HTML
--> --> -->| Dataset Profile | |
| Dataset title | A potential risk index dataset for landfalling tropical cyclones over the Chinese mainland, Version 1.0 (PRITC dataset V1.0) |
| Time range | 1949–2018 |
| Geographical scope Data format | The Chinese mainland Text |
| Data volume | 68 KB |
| Data service system | http://tcdata.typhoon.org.cn/en/qzfxzs_sm.html |
| Sources of funding | National Key Research and Development Program of China (2017YFC1501604), National Natural Science Foundations of China (41875114), Shanghai Science & Technology Research Program (19dz1200101), National Basic Research Program of China (2015CB452806), and Basic Research Projects of the Shanghai Typhoon Institute of the China Meteorological Administration (2020JB06). |
The risks resulting from TCs are related to TC hazards and to the vulnerability and resilience of the hazard-bearing bodies. TC hazards are the drivers of risk or damage and generally include severe winds, heavy precipitation, and storm surge. Reasonable and reliable indications of potential risk from the perspective of TC hazards are a key point in TC risk assessments. Several different expressions based on the intensity of TCs or on their extreme wind speeds exist and are most popularly used as indicators of the potential risk resulting from TC hazards. Examples include the power dissipation index (Emanuel, 2005) and the hurricane intensity index (Kantha 2006, 2013; Powell and Reinhold, 2007; Xiao et al., 2011; Peduzzi et al., 2012; Hong et al., 2016; Choun and Kim, 2019; Fang et al., 2020; Liu et al., 2020b). Fundamentally, these indicators express the damage-based risk caused by TC winds. The absence of precipitation in these indicators is one source of the differences that exist between the estimated and actual risks resulting from landfalling TCs, especially over complex terrain. To address this issue, Rezapour and Baldock, (2014) added a rainfall index to the hazard index to estimate and rank the severity levels of hurricanes making landfall in the continental United States based on precipitation data extracted from remotely sensed imagery using an artificial neural network database. Zhang et al., (2010) added a total vapor index to the total damage index for TCs making landfall in China. Both studies showed that the hazard indices, when rainfall factors were included, were highly correlated with DELs.
Recently, Chen et al., (2009; 2013; 2019) developed three potential risk indices for TCs making landfall on the Chinese mainland based on 30 years (1984–2013) of surface observations obtained from the China Meteorological Administration (CMA). Among these three indices, one index was based on wind, one was based on precipitation, and one was based on both precipitation and wind. All three indices were significantly correlated with damage, and the index that was based on both precipitation and wind ranked best among the three. A potential risk index dataset for TCs that made landfall over the Chinese mainland from 1949–2018, abbreviated as the PRITC dataset V1.0, was developed following the publishing of Chen et al., (2019) and was released to the public through the internet in August 2020. The dataset will be updated annually in the future.
For ease of use, detailed information about the dataset is introduced in this paper. Section 2 describes the data sources and the equations of the indices. Section 3 presents the dataset composition and the organizational structure of the data. Section 4 presents some general characteristics of the indices. The last section includes the conclusion and discussion.
2.1. Best-track data
The 6-h track and intensity data of TCs that made landfall over the Chinese mainland were obtained from the CMA TC best track dataset (Ying et al., 2014) and were downloaded from2
2.2. Observed precipitation and wind data
The TC-induced precipitation and wind data recorded at meteorological stations throughout the Chinese mainland were obtained from the CMA TC database (Ying et al., 2014). The temporal duration ranged from 1949 to 2018, covering a total of 70 years. The TC-induced precipitation data consist of the daily precipitation, maximum 1-h precipitation, and the associated dates and times when stations recorded total precipitation values ≥ 10 mm. The TC-induced wind data consist of the date(s) on which wind speeds ≥ 10.8 m s?1 occurred and the maximum sustained wind speed and the maximum wind gusts with the associated wind directions, dates, and times.A total of 1401 meteorological stations in 29 provinces (Fig. 1) were selected following the methods of Lu et al. (2017) and the Climatological Atlas of Tropical Cyclones over the Western North Pacific (1981–2010) published by the Shanghai Typhoon Institute of CMA in 2017 (STI/CMA, 2017). Among these stations, there were 449 basic national weather stations, 102 reference national climatological stations, and 814 general national weather stations. The years in which the stations were constructed ranged from 1914 to 1977 (Fig. 2); 4.8% of the stations were built by 1949, and 96.5% of the stations were built by 1960.
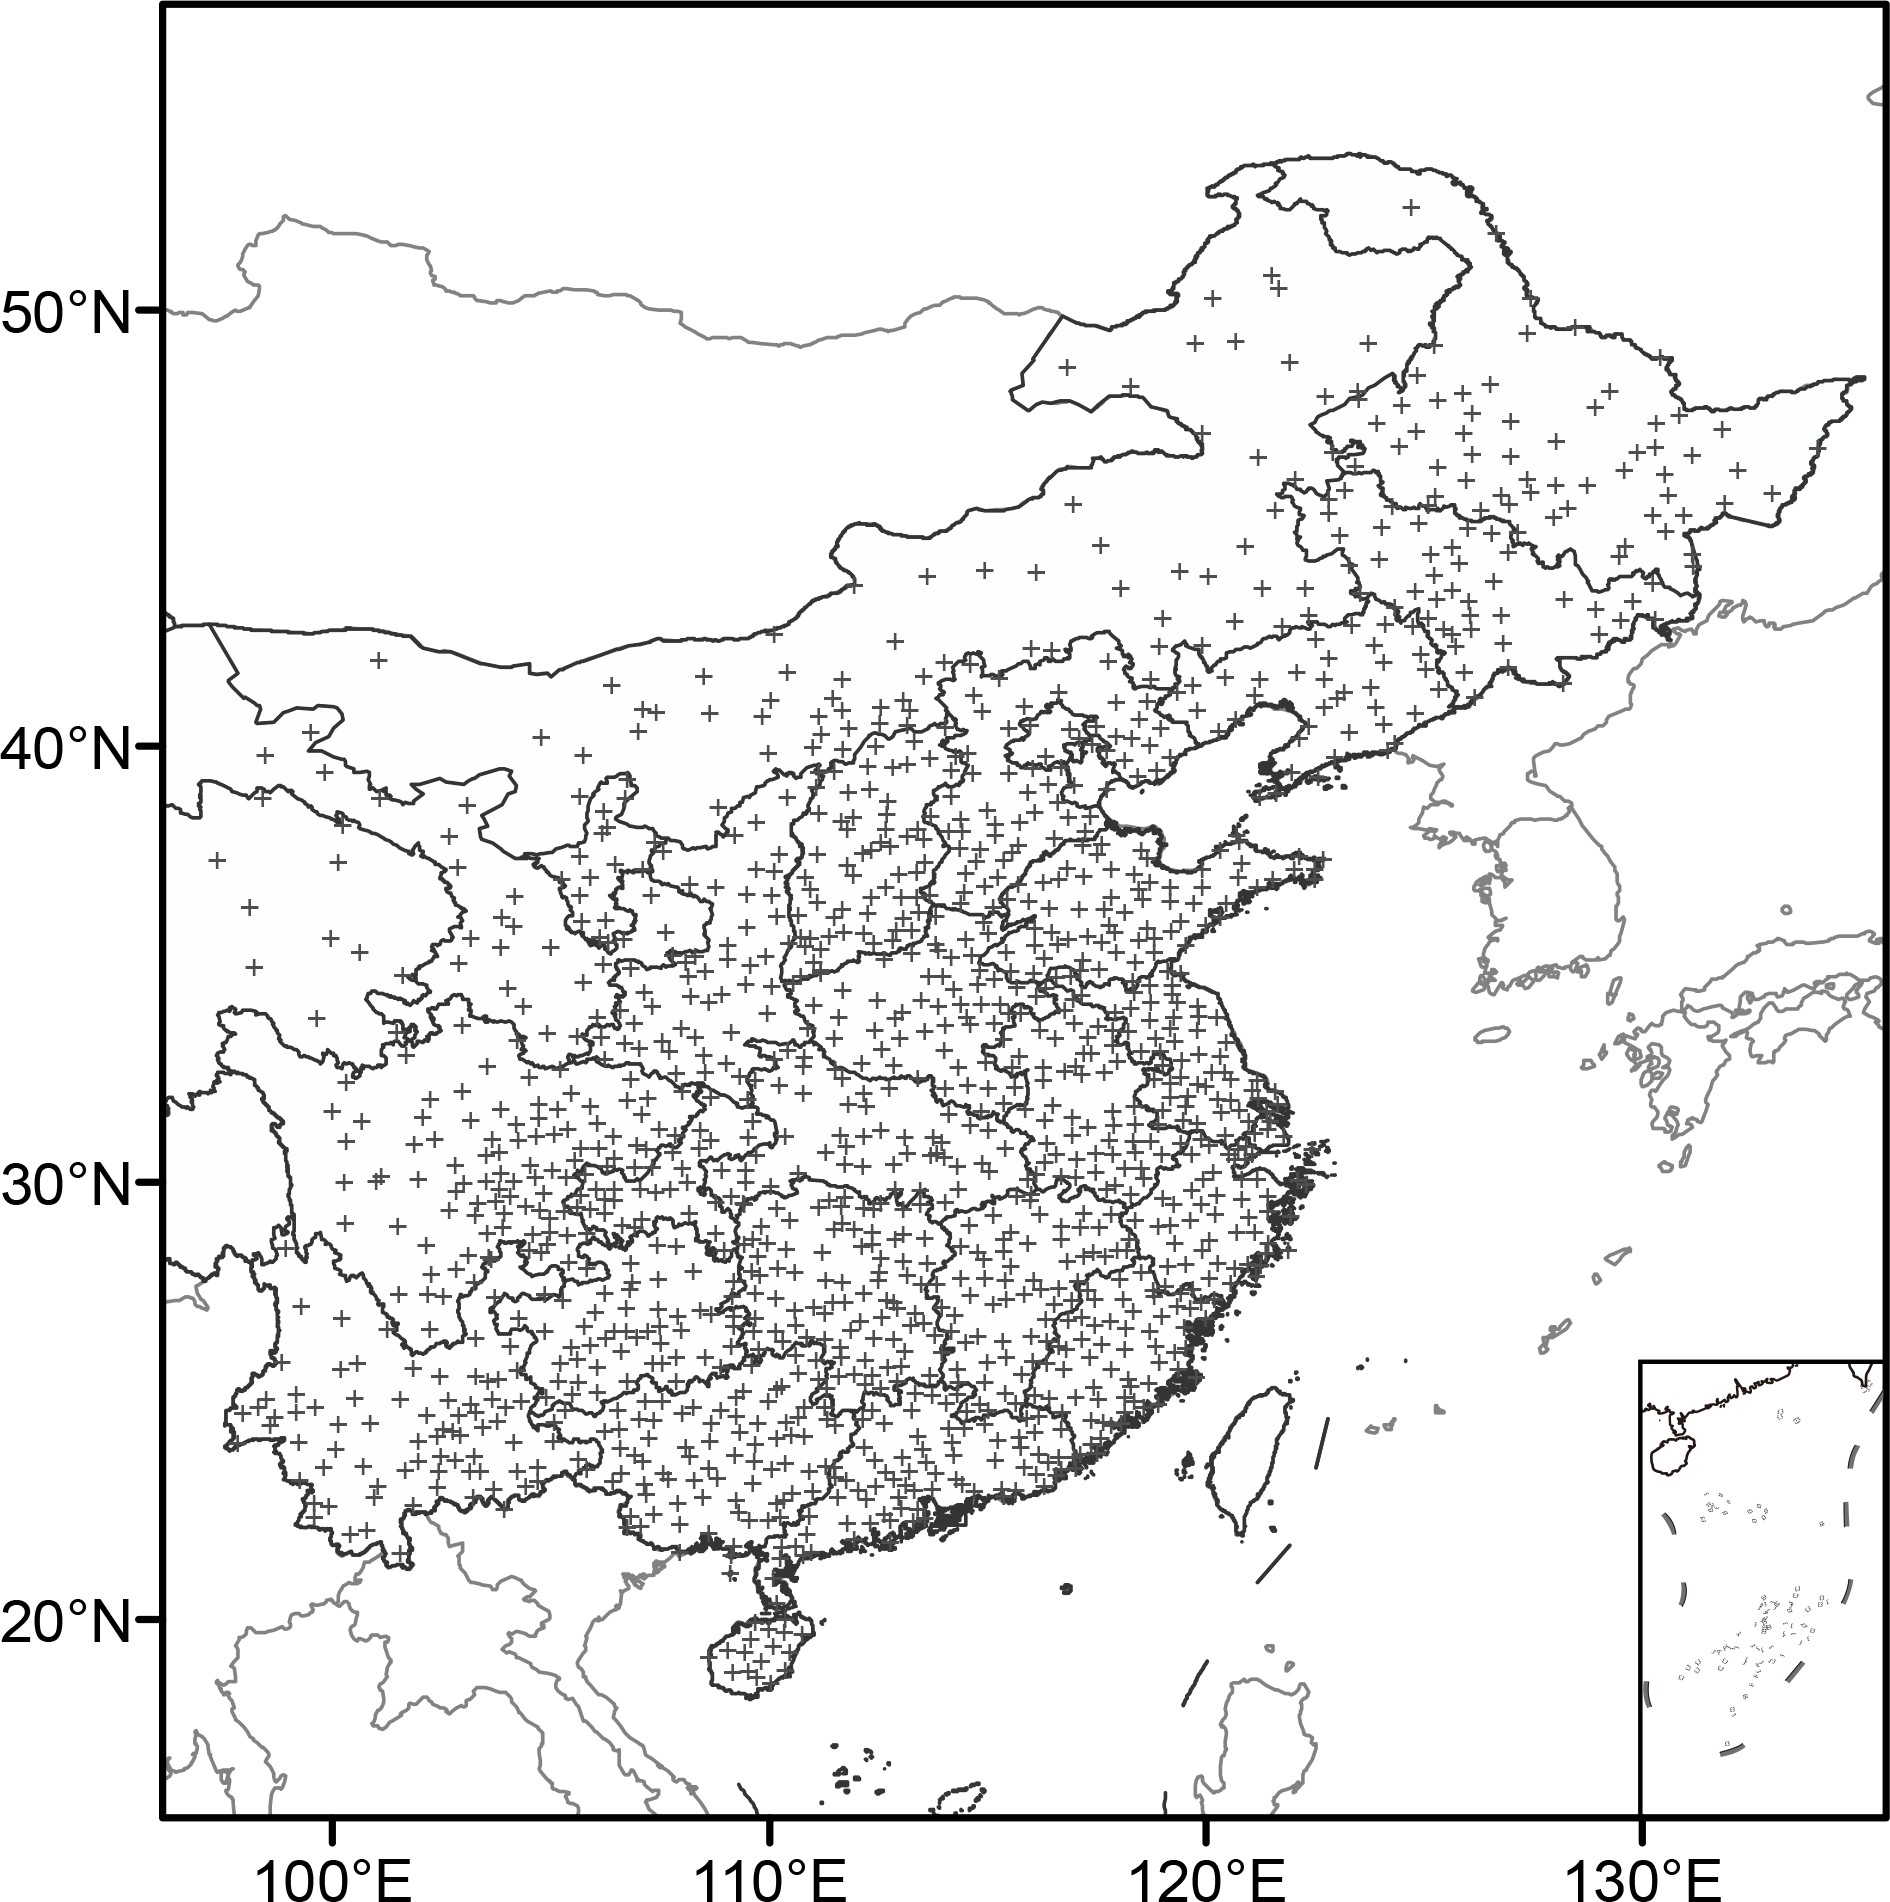 Figure1. Distribution of the 1401 meteorological stations from which data was obtained to calculate the indices used in this study.
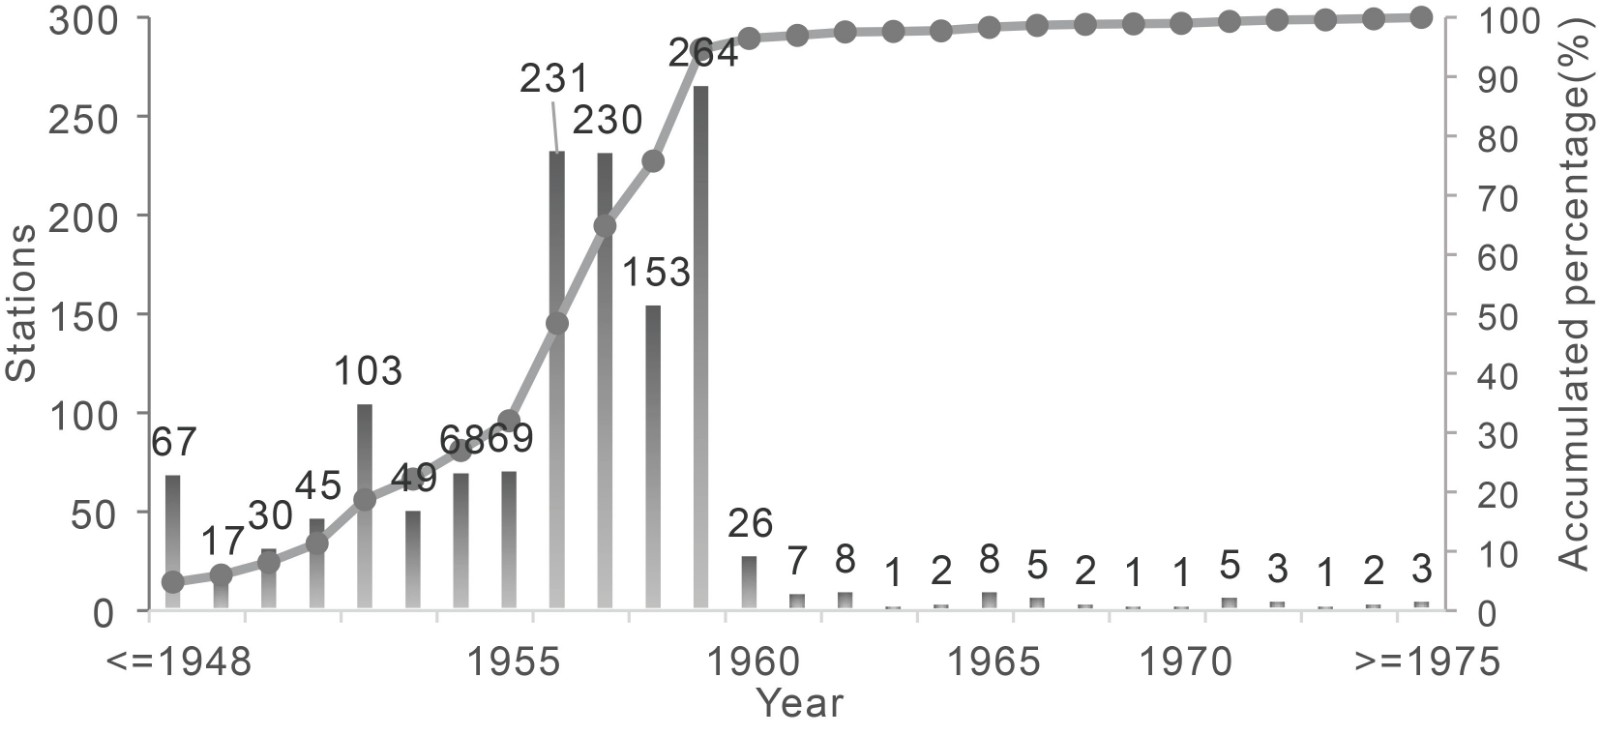 Figure2. Construction of the temporal evolution of the 1401 studied meteorological stations. The number on the top of each bar indicates the number of stations built in that year.
2
2.3. Definition of the potential risk indices
Three potential risk indices were proposed by Chen et al. (2019) based on observed TC-induced precipitation and wind data to estimate the severity of the impacts of landfalling TCs. The first was an index of TC-induced wind (IWT), which was defined as follows:where GUSTi is the maximum wind gust (m s?1) at the ith station as induced by a TC, Nsw is the number of stations with maximum wind gusts ≥ 13.9 m s–1 during the TC, and GUST_TMX is the maximum GUST_T value among all the TCs in the study period. For the 583 TCs that occurred from 1949 to 2018, the GUST_TMX value was 4481 m s–1 for TC Winnie (1997).
The second index proposed by Chen et al. (2019) was an index of TC-induced precipitation (IPT); this index was defined as follows:
where


Chen et al. (2019) discussed that the IPWT expressed in the form of Eq. (5) has the advantage of a linear combination of the impacts from wind and precipitation; it simultaneously possesses the amplification effects resulting from both factors. According to statistics recorded over thirty years (1984–2013), Chen et al. (2019) found that the correlation coefficients between the above three indices, IWT, IPT, and IPWT, and a damage index were 0.70, 0.78, and 0.80, respectively. Thus, the inclusion of precipitation information resulted in a better indication of the potential risk of a TC than the indication produced by the index based solely on wind.
| SN | YEAR | ID | TCNAME | PRO_LD | CAT_LD | IPT | IWT | IPWT | CAT_IPWT |
| 564 | 2017 | 20170302 | MERBOK | Guangdong | STS | 0.1314 | 0.0647 | 0.1023 | 1 |
| 565 | 2017 | 20170807 | ROKE | Hongkong | TS | 0.0254 | 0.0426 | 0.0345 | 1 |
| 566 | 2017 | 20171009 | NESAT | Fujian | TY | 0.275 | 0.1215 | 0.215 | 2 |
| 567 | 2017 | 20171110 | HAITANG | Fujian | TS | 0.4197 | 0.1505 | 0.3167 | 3 |
| 568 | 2017 | 20171413 | HATO | Guangdong | STY | 0.3872 | 0.4214 | 0.4859 | 4 |
| 569 | 2017 | 20171514 | PAKHAR | Guangdong | STS | 0.1755 | 0.151 | 0.1765 | 2 |
| 570 | 2017 | 20171716 | MAWAR | Guangdong | TS | 0.0763 | 0.0304 | 0.0545 | 1 |
| 571 | 2017 | 20172100 | (nameless) | Hainan | TS | 0.0045 | 0.0156 | 0.0101 | 0 |
| 572 | 2017 | 20172320 | KHANUN | Guangdong | STS | 0.1621 | 0.2046 | 0.1999 | 2 |
Table1. Sample data from the potential risk index dataset for landfalling tropical cyclones over the Chinese mainland (PRITC dataset V1.0).
| Abbreviation | Description |
| SN | The serial number starting from 1. |
| YEAR | The year of the corresponding TC. |
| ID | A unique identifier for the TC, containing the information of the year, TC serial number, and Chinese TC serial number. |
| TCNAME | TC name. “(nameless)” means an unnamed TC. |
| PRO_LD | The province where the TC first made landfall on the Chinese mainland. |
| CAT_LD | The TC’s intensity grade at the time of its first landfall over the Chinese mainland. |
| IPT | The index of TC-induced precipitation calculated with Eq. (3). |
| IWT | The index of TC-induced wind calculated with Eq. (1). |
| IPWT | The combined index of TC-induced precipitation calculated with Eq. (5). |
| CAT_IPWT | The category level ranging from 0 to 4 based on IPWT. |
| >=TY | Indicates that the TC landfall intensity grade was equal to or stronger than a typhoon during 1949 to 1972. |
| NTC | Indicates storms that were weaker than tropical depressions and had maximum wind speeds lower than 10.8 m s?1 Chen et al., 2016. |
Table2. List of abbreviations used in the potential risk indices dataset.
The headline is also shown in Table 1 and includes the following 10 items.
SN is the serial number starting from 1.
YEAR is the year of the corresponding TC.
ID is a unique identifier for each TC. The format of the ID is “YYYYaabb”. “YYYY” is the four-digit year. “aa” is the two-digit TC serial number. “bb” is the two-digit Chinese TC serial number. The values “00” indicate a lack of Chinese TC serial numbers for all TCs before 1959 or means that the object is an unnamed TC that occurred after 2000. The TC serial numbers and the Chinese TC serial numbers were obtained from CMA’s TC database. For example, “20171413” means that the TC was the 14th TC and the 13th named TC in the 2017 season, referring to Hato (2017).
TCNAME is the name of the corresponding TC. The name of an unnamed TC is replaced by “(nameless)” in the corresponding column.
PRO_LD is the province where the corresponding TC first made landfall on the Chinese mainland. Some TCs reenter the sea after moving over land for some time and make second or even third landfalls.
CAT_LD is the TC’s intensity grade at the time of its first landfall over the Chinese mainland. There are six standard grades including a super typhoon (SuperTY), severe typhoon (STY), typhoon (TY), severe tropical storm (STS), tropical storm (TS), and tropical depression (TD), according to the national standard of China ICS 07.060 (GB/T 19201-2006); a grade called a nontropical cyclone (NTC) was added for storms that were weaker than TDs and had maximum wind speeds lower than 10.8 m s?1 (Chen et al., 2016). The term “>=TY” indicates that the intensity grade was equal to or stronger than TY because the maximum TC landfall intensity grade recorded at the TC landfall was grade 12 based on the Beaufort scale; wind speed records were missing from 1949 to 1972.
IWT, IPT, and IPWT were calculated with Eqs. (1), (3), and (5), respectively. According to Table 1, the IPT, IWT, and IPWT values of Hato (2017) were 0.3872, 0.4214, and 0.4859, respectively.
CAT_IPWT is the category of IPWT as defined in Table 3. CAT_IPWT was assigned five categories (from 0 to 4) with increasing impact severities and was determined based on the corresponding relation between IPWT, the damage index, and the categories based on typhoon cases from 1984 to 2013. Note that the five categories were not based on equal bin sizes of the IPWT values but were based on a consideration of the proportion of the damaging typhoons in each category. During this period, 98.6%, 87.7%, 72.9%, 69.8%, and 73.4% of typhoon cases were members of the same damage category or the next damage category down (i.e., CAT_IPWT Categories 0+1, 1+2, 2+3, and 3+4, respectively (Chen et al., 2019, see their Fig. 6). The CAT_IPWT value of Hato (2017) was 4, implying that it was one of the most destructive TCs.
| CAT_IPWT | Meaning | IPWT range |
| 0 | Tiny impact | <0.0234 |
| 1 | Mild impact | [0.0234,0.1480) |
| 2 | Medium impact | [0.1480,0.2570) |
| 3 | Severe impact | [0.2570,0.4200) |
| 4 | Super severe impact | ≥0.4200 |
Table3. The classification basis and means of CAT_IPWT. The “[” symbols in the table indicate the inclusion of the value, and the “)” symbols indicate that the value is left out. For example, 0.0234 ≤ IPWT < 0.1480 is shown as “[0.0234, 0.1480)” (Chen et al., 2019).
2
4.1. Frequency distribution of the indices and top 10 TCs
The frequency distributions of IPWT, IWT, and IPT and boxplots of the TCs are shown in Fig. 3. The means (medians) of the IPT, IWT, and IPWT values were 0.2321 (0.1951), 0.1414 (0.1075), and 0.2109 (0.1620), respectively. Usually, IWT was smaller than IPT and IPWT.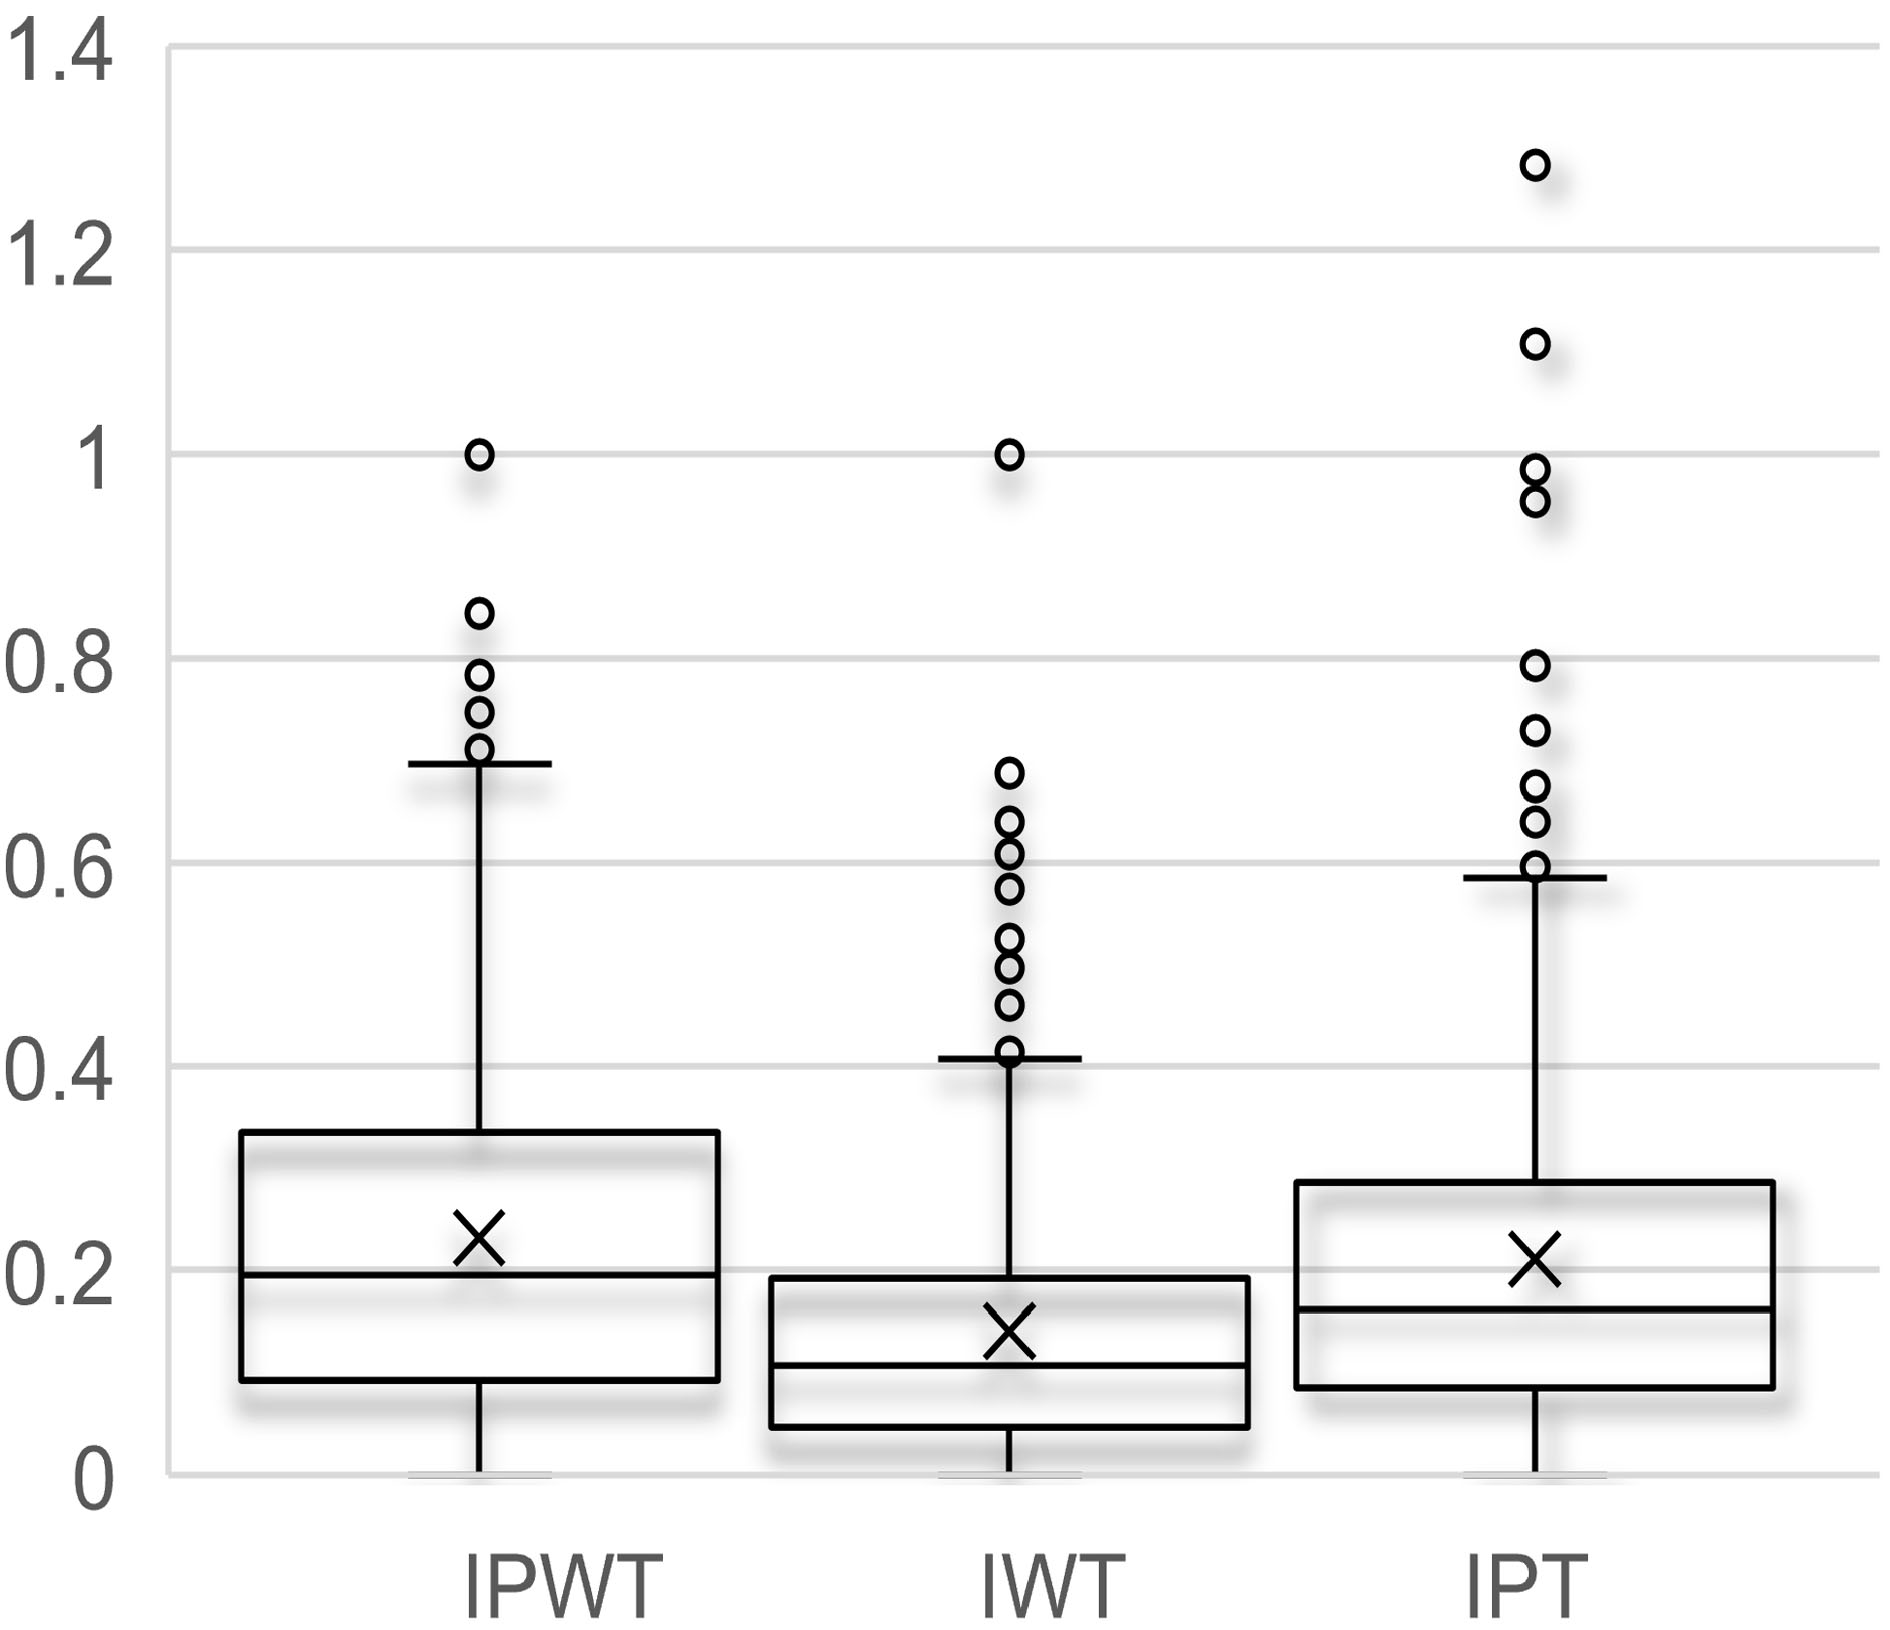 Figure3. Box plots of the IPT, IWT, and IPWT values of TCs from 1960 to 2018. “X” indicates the mean. The bottom, central, and top of the line of each box are the 25%, 50%, and 75% values, respectively.
The top 10 IPT, IWT, and IPWT values are listed in Table 4, and these TC tracks are shown in Fig. 4. The highest IPT, IWT, and IPWT values were 1.0, 1.0, and 1.2837, respectively. Among the top 10 TCs ranked by the IPWT, 6 made landfall over the coastal areas of Fujian Province and 3 made landfall over Guangdong Province (Fig. 4).
| Rank | IPWT | IPT | IWT | |||||
| TC name | IPWT | TC name | IPT | TC name | IWT | |||
| 1 | Winnie (1997) | 1.2837 | Bilis (2006) | 1.0000 | Winnie (1997) | 1.0000 | ||
| 2 | Bilis (2006) | 1.1090 | Mary (1960) | 0.8537 | Babe (1977) | 0.6936 | ||
| 3 | Mangkhut (2018) | 0.9850 | Amy (1962) | 0.8444 | Matsa (2005) | 0.6873 | ||
| 4 | Amy (1962) | 0.9538 | Mangkhut (2018) | 0.7870 | Mangkhut (2018) | 0.6617 | ||
| 5 | Freda (1984) | 0.7930 | Winnie (1997) | 0.7834 | Andy (1982) | 0.6405 | ||
| 6 | Polly (1992) | 0.7490 | Herb (1996) | 0.7647 | Bilis (2006) | 0.609 | ||
| 7 | Mary (1960) | 0.7431 | Vongfong (2002) | 0.7461 | Opal (1962) | 0.5883 | ||
| 8 | Herb (1996) | 0.7289 | Usagi (2013) | 0.7249 | Amy (1962) | 0.5764 | ||
| 9 | Prapiroon (2006) | 0.6784 | Polly (1992) | 0.7100 | Hope (1979) | 0.5744 | ||
| 10 | Tim (1994) | 0.6742 | June (1984) | 0.7096 | Abe (1990) | 0.5416 | ||
Table4. The top 10 TCs that occurred between 1960 and 2018 ranked by IPWT, IPT, or IWT.
 Figure4. The tracks of the top 10 TCs as ranked by IPWT from 1960 to 2018. The number beside each TC name indicates its ranking. For example, “1. Winnie” means that Winnie was the TC with the largest IPWT. “GD”, “FJ”, and “ZJ” are the locations of Guangdong, Fujian, and Zhejiang Provinces, respectively.
The TC with the most destructive potential as indicated by IPWT was Winnie (1997), which also had the highest IWT value and the 7th highest IPT value. This TC made landfall on Wenling city, Zhejiang Province, with a landfall intensity of 40 m s?1. It brought heavy precipitation and strong wind gusts to 15 provinces (Figs. 5a and 5b). A maximum wind gust (sustained wind) of 41 m s?1 (34 m s?1) was recorded at Shengsi Island (Dachen Island). Winnie (1997) caused damage to 11 provinces and province-level municipalities from southeastern to northeastern China including Fujian, Zhejiang, Anhui, Shanghai, Jiangsu, Henan, Hebei, Shandong, Liaoning, Tianjin, and Jilin. The DELs of 10 provinces (except for Tianjin municipality, which does not have damage records) are shown in Fig. 6c. The most severe damage occurred in Zhejiang and Shandong Provinces, with DELs of 18.6 billion and 135 billion Yuan, respectively. Winnie (1997) resulted in the largest affected crop area (7159 thousand hectares) and the second highest DEL in the gross domestic production in China in the year of the TC (0.5859%), with a DEL of 43.63 billion based on data from 1984–2016.
 Figure5. The distributions of the total precipitation (units: mm) (a), maximum sustained wind (units: m s?1) (b), and direct economic losses (c) caused by TC Winnie (1997). The unit of the direct economic loss was 0.1 billion Chinese Yuan in 1997.
 Figure6. The distributions of the total precipitation (units: mm) (a), maximum sustained wind (units: m s?1) (b), and direct economic losses (c) caused by TC Bilis (2006). The unit of the direct economic loss was 0.1 billion Chinese Yuan in 2006.
The TC with the maximum IPT value was Bilis (2006). It first made landfall on Taiwan Province with a maximum wind speed of 30 m s?1 and made a second landfall on Xiapu, Fujian Province with the same intensity as the first landfall. Although the landfall intensity of Bilis (2006) was moderate, its long lifetime and trajectory over land brought long-term heavy precipitation over a large area (Fig. 6). Maximum total precipitation of 570 mm was recorded as lasting four days at Boluo station, Guangdong Province. Bilis (2006) caused more than 8000 (3000) landslides and mudslides in Bangzhou (Zixing) city, Hunan Province (Deng and Wang, 2007). It also brought strong wind gusts to both the coastal and inland areas (Fig. 6b). Sustained winds ranging from 10.8 m s?1 to 24.8 m s?1 were observed over Guangdong Province, the Qinzhou region in Guangxi Province, the local region in Yunnan Province, eastern Hubei Province and Hunan Province, the Jiujiang and Guangfeng regions in Jiangxi Province, the Pingba and Liuzhi regions in Guizhou Province, and most of Shanghai Province and Jiangsu Province. Wind gusts ranging from 32.7 m s?1 to 42.0 m s?1 were recorded over Yuhuan and Dachen Island in Zhejiang Province. The maximum wind gust was 42.0 m s?1 over Dachen Island. A total of 1057 deaths and damages of 38.31 billion Chinese Yuan were recorded over six provinces in 2006 including Zhejiang, Jiangxi, Hunan, Guangxi, Guangdong, and Fujian Provinces. The DEL of each province is shown in Fig. 6c. The top two provinces ranked by DEL were Guangdong and Hunan Provinces, with DEL values of 13.4 and 12.9 billion Chinese Yuan, respectively in 2006.
The percentages of each IPWT category from 0 to 4 were 7.41%, 37.86%, 25.51%, 16.46%, and 12.76%, respectively (Table 5). Notably, the CAT_IPWT values of all TCs shown in Table 4 belong to the super severe impact category (i.e., CAT_IPWT 4).
| CAT_IPWT | 0 | 1 | 2 | 3 | 4 |
| Cases | 36 | 184 | 124 | 80 | 62 |
| Percentage (%) | 7.41 | 37.86 | 25.51 | 16.46 | 12.76 |
Table5. Frequency distribution of CAT_IPWT from 1960 to 2018.
2
4.2. Annual total and mean values of the indices
The maximum, mean, median, and minimum values of the annual total IPT, IWT, and IPWT values from 1960 to 2018 are listed in Table 6. The ranges of the annual total IPT, IWT, and IPWT values are 0.4485–3.5387, 0.1832–2.8673, and 0.3245–3.3987, respectively. The mean (median) of annual total IPT, IWT, and IPWT values were 1.9113 (1.8561), 1.1646 (1.0745), and 1.7367 (1.5615), respectively. 1998 was a unique year in that it had the lowest annual total IPT, IWT, and IPWT values.| Index | IPT | IWT | IPWT |
| Maximum | 3.5387 (1994) | 2.8673 (2005) | 3.3987 (2018) |
| Mean | 1.9113 | 1.1646 | 1.7367 |
| Median | 1.8561 | 1.0745 | 1.5615 |
| Minimum | 0.4485 (1998) | 0.1832 (1998) | 0.3245 (1998) |
Table6. Statistics of annual total IPT, IWT, and IPWT from 1960 to 2018. Number in the bracket is the corresponding year when it has maximum value or minimum value.
The time series of the annual total IPT, IWT, and IPWT values from 1960 to 2018 are shown in Fig. 7b. In agreement with previous studies (Ying et al., 2011a, b), a slight upward IPT trend and a downward IWT trend were found over the study period. If we focus only on the period from 1960 to 2004, slight downward trends are observed for both IWT and IPT; this result is similar to the trends reported in the results of Ren et al., (2006). A slight upward IPWT trend was also found from 1960 to 2018, although this trend was not statistically significant at the 95% confidence level according to the Mann-Kendall test. This means that the combined impact of TC-induced precipitation and wind over the Chinese mainland was increasing due to the increase in TC-induced precipitation.
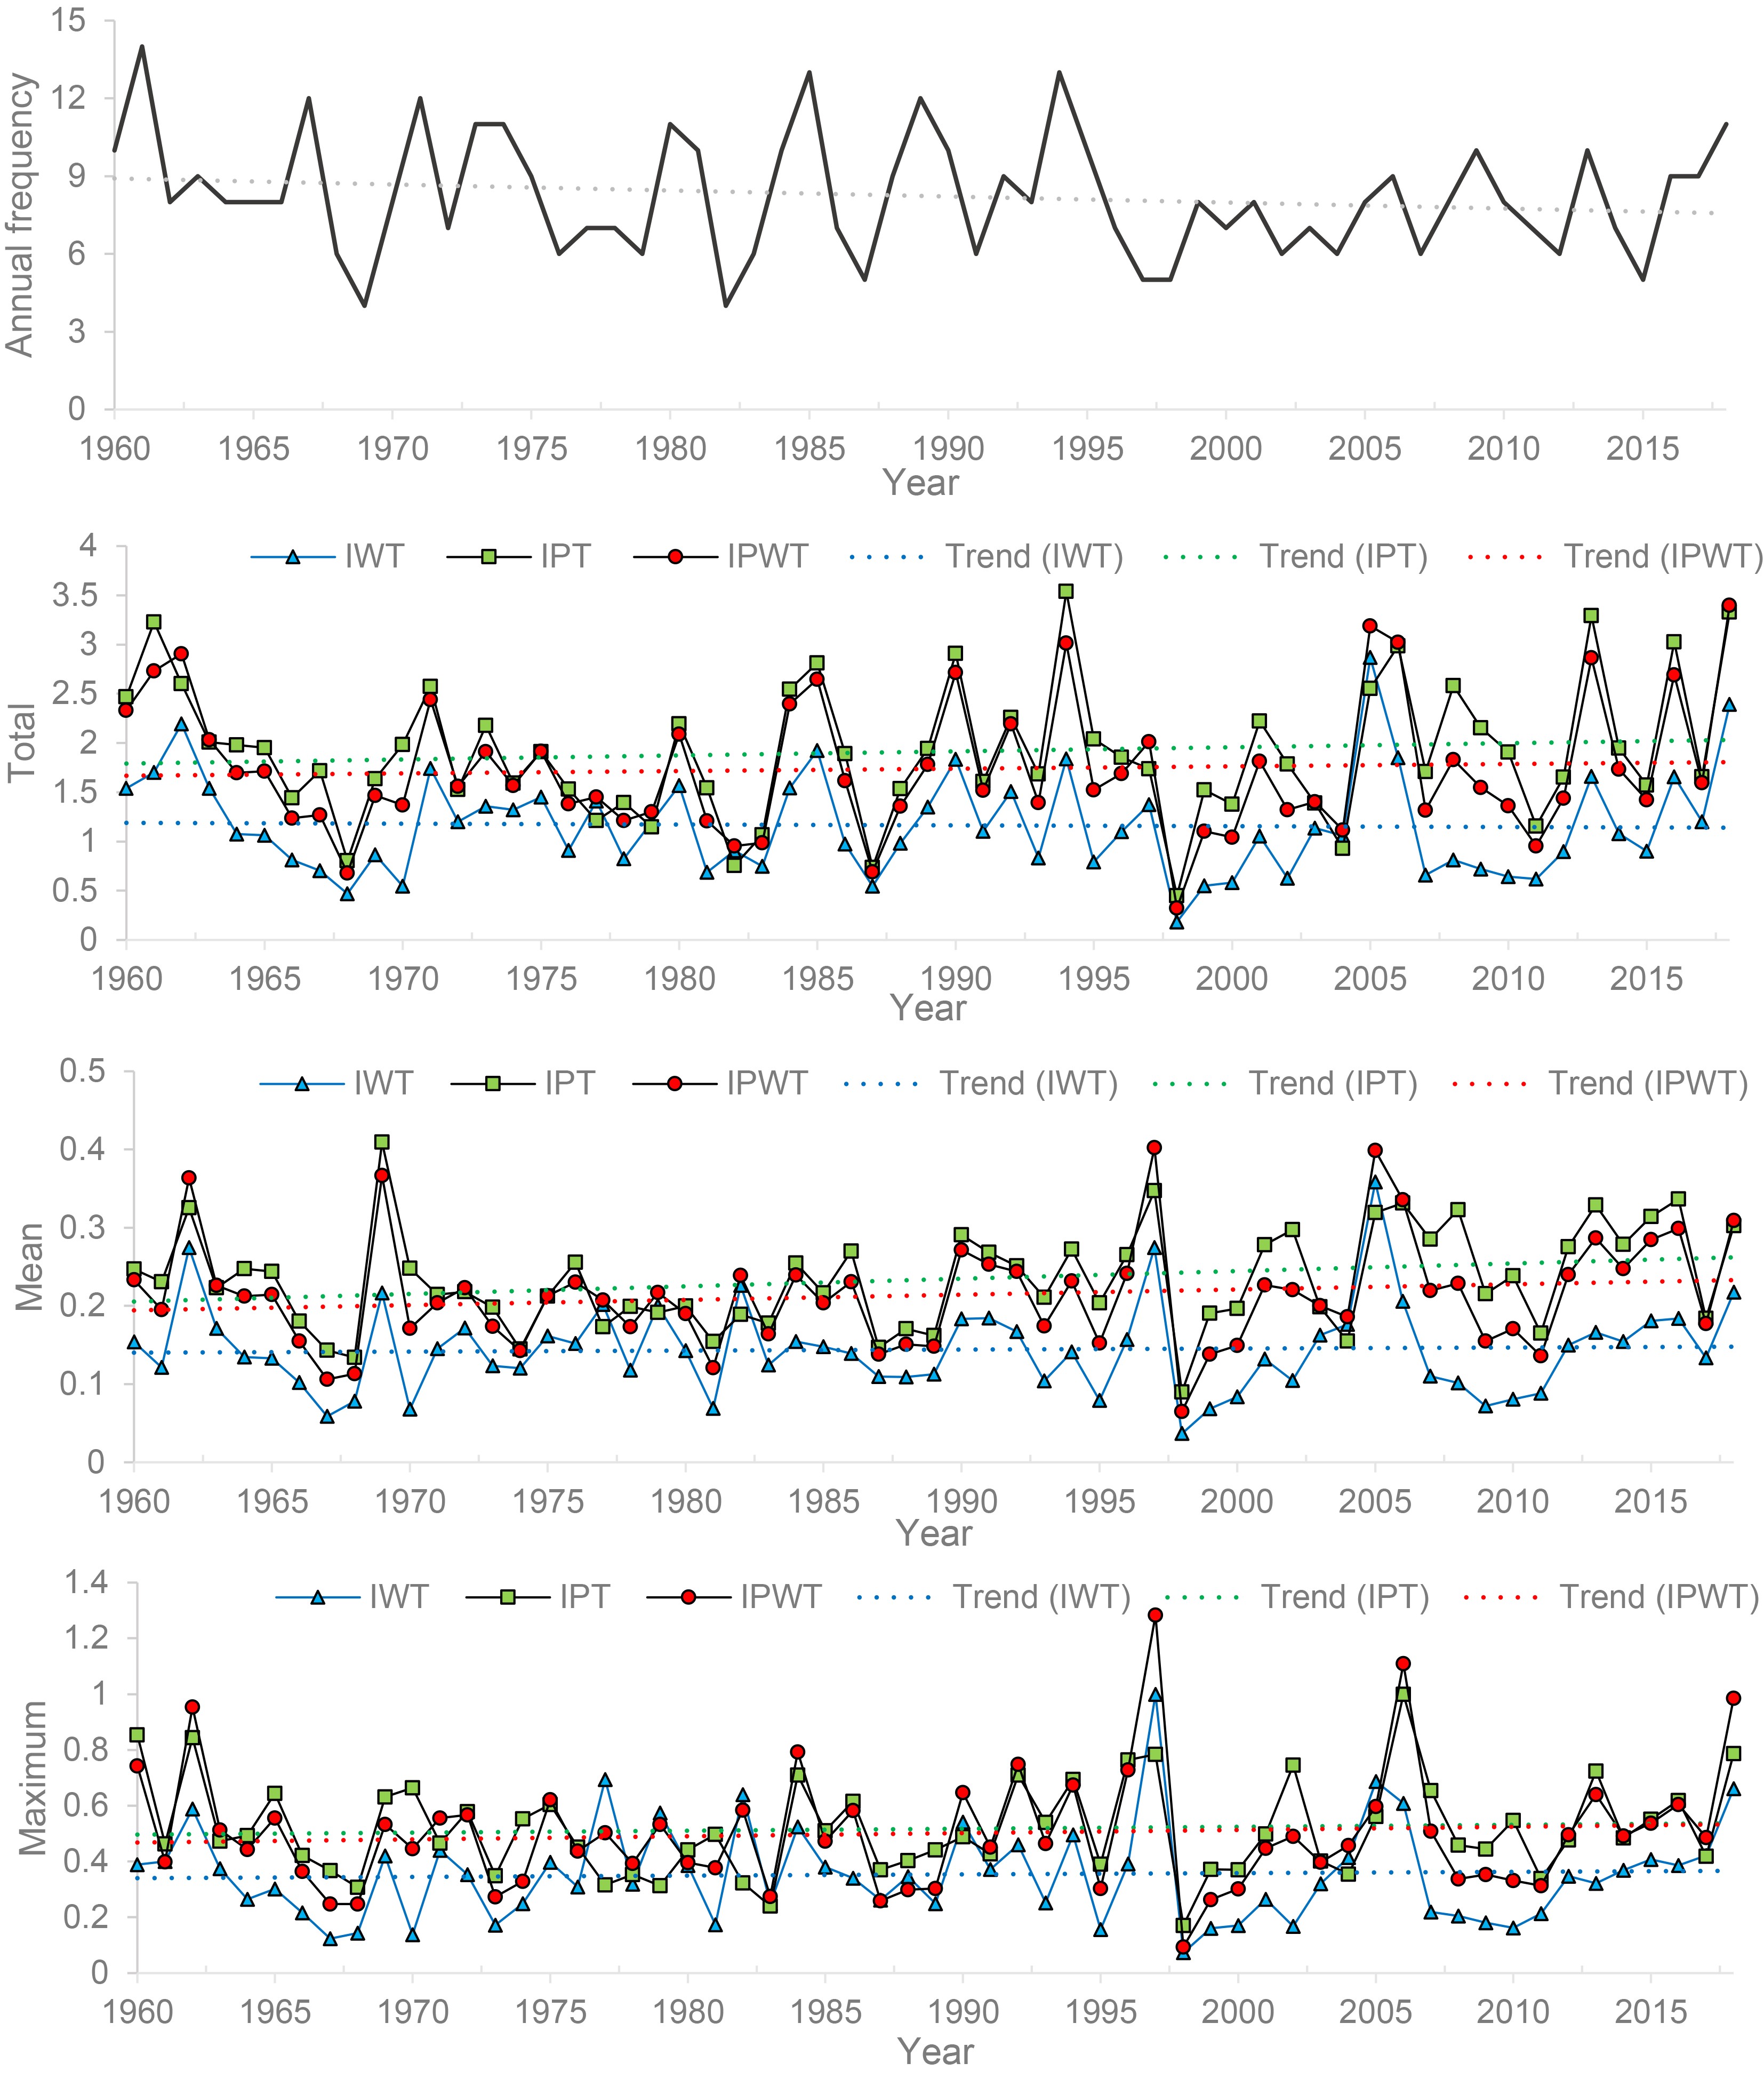 Figure7. Time series of the frequency of landfalling TCs and the IWT, IPT, and IPWT values from 1960 to 2018 with linear trends. (a) Annual frequency of TCs landfalling; (b) annual total; (c) annual mean; and (d) annual maximum.
Due to the decreasing trend of TCs landfalling over the Chinese mainland (Fig. 7a), the annual mean IPT and IPWT values showed more significant increasing trends than the trend of the annual total value (Fig. 7c), although the IWT series remained stable. The linear trend of the annual mean IPT (IPWT) was over the 90% (95%) confidence level. This means that the potential destructiveness of a single TC was increasing; this result aligned with the positive trends observed in the frequency and intensity of TC precipitation (Ying et al., 2011b; Zhang et al., 2013; Liu et al. 2020a ). The annual maximum IPT, IWT, and IPWT values are shown in Fig. 7d, and there are no significant linear trends.
The mean, maximum, median, and minimum values of the annual frequency of the IPWT categories are shown in Table 7. There were 1.36 Category 3 TCs and 1.05 Category 4 TCs per year. Both 2005 and 1985 were unique in having 4 TCs with Category 4 IPWT values and 5 TCs with Category 3 IPWT, which was the maximum frequency calculated in a year. The annual frequency of each category showed a differing trend from 1960 to 2018. The frequencies of Category 0 and Category 1 (Category 2 and Category 3) TCs showed downward (stable) trends (Fig. 8a) with statistical significance over (below) the 95% confidence level. However, the annual frequency and the percentage of landfalling Category 4 TCs showed increasing trends (Figs. 8a, c). Due to the decreasing annual frequency of landfalling TCs, the percentages of TCs of Categories 0–1 (Category 2) out of all storm categories still had downward (stable) trends (Fig. 8b). However, the proportion of Category 3 storms among the landfalling TCs started increasing slightly from a stable trend, and the percentage of Category 4 storms among the landfalling TCs showed a clearer increasing trend than did frequency (Fig. 8c). This means that the impacts of landfalling TCs, especially those resulting from the influences of heavy-impact TCs were increasing.
| CAT_0 | CAT_1 | CAT_2 | CAT_3 | CAT_4 | |
| Mean | 0.61 | 3.12 | 2.10 | 1.36 | 1.05 |
| Maximum | 2 | 7 (1967) | 5 (1973,2008) | 5 (1985) | 4 (2005) |
| Median | 0 | 3 | 2 | 1 | 1 |
| Minimum | 0 | 0 | 0 | 0 | 0 |
Table7. Statistics of the annual frequency of CAT_IPWT from 1960 to 2018. The numbers in parentheses show the year of the maximum annual frequency of CAT_IPWT.
 Figure8. Time series of CAT_IPWT values from 1960 to 2018 with linear trends. (a) Annual frequency; (b) percentage of the total landfalling TCs in categories 0, 1, and 2; and (c) percentage of the total landfalling TCs in categories 3 and 4.
The basic statistical characteristics and long-term trends of the studied indices and the IPWT categories were analyzed from 1960 to 2018. The results are as follows.
The mean annual total IPT, IWT, and IPWT values were 1.9113, 1.1646, and 1.7367, respectively. There were 1.36 (1.05) TCs that were classified as IPWT Category 3 (4) per year. The combined impact of TC-induced precipitation and wind over the Chinese mainland increased due to the increase in TC-induced precipitation, especially from heavy-impact TCs. Slight upward trends of annual total IPWT and IPT and downward trends of annual total IWT were found. The annual frequency and its percentage of landfalling TCs of Category 4 also increased over the study period.
The mean of IPT, IWT, and IPWT values of TCs that occurred over the study period were 0.2321, 0.1414, and 0.2109, respectively. The average impact of a TC per year was significantly increasing, in accordance with significant increases in the frequency and intensity of TC precipitation.
The “75.8” rainstorm, which was a period of unprecedented heavy rainfall in Henan Province from 4–8 August 1975, was engraved in the memories of many people due to the 1605 mm of total precipitation, the millions of deaths, and the more than 1000 billion Yuan of DEL that occurred (Ding, 2015). This heavy rain was caused by super typhoon Nina (1975), which had 55 m s?1 and 35 m s?1 landfall intensities in Taiwan and Fujian Provinces, respectively. The IPT, IWT, and IPWT values of Nina (1975) ranked 115, 46, and 74, respectively, among TCs that occurred during the period between 1960 and 2018. The main reason that Nina (1975) is not included on the lists of the top 10 TCs using the IPT and IPWT indices is the nonconformity of the local extreme rainfall and heavy rainfall occurring over a wide area in a single day; these effects were not captured well by the weather station network. In the future, local extreme total rainfall and hourly rainfall should be considered in the calculation of the IPT value. The “75.8” rainstorm is also a good case study to determine the effects of the characteristics of hazard-bearing bodies in damage-inducing events. The real damage resulting from TCs is tightly related not only to the rain, wind, and storm surge caused by the TCs but also to the local geographical, social, and economic environment. Therefore, these factors, which are critical for vulnerability and resilience considerations, should not be ignored when estimating the impacts from TCs with low IPT, IWT, and IPWT values.
Acknowledgements. The authors thank the editor and anonymous reviewers for their constructive comments and suggestions. This work has been supported by the National Key Research and Development Program of China (Grant No. 2017YFC1501604), National Natural Science Foundations of China (Grant No. 41875114), Shanghai Science & Technology Research Program (Grant No. 19dz1200101), National Basic Research Program of China (Grant No. 2015CB452806), Shanghai Sailing Program (Grant No. 21YF1456900), and Basic Research Projects of the Shanghai Typhoon Institute of the China Meteorological Administration (Grant Nos. 2020JB06, and 2021JB06).
Open Access This article is distributed under the terms of the Creative Commons Attribution 4.0 International License (
