HTML
--> --> -->Organonitrates (ON) are generating increasing interest owing to their crucial role in the chemistry of atmospheric oxidation and potentially significant influence on regional air quality, climate change and global biogeochemical cycles (Bertman et al., 1995; Jenkin and Clemitshaw, 2000; Russo et al., 2010). The broad definition of ON includes peroxy nitrates (RO2NO2) and multifunction alkyl nitrates (RONO2). Lacking the ideal analytical instruments to detect the bulk ON was the biggest obstacle for fully understanding the chemistry of ON in the past. In recent years, several advanced techniques have emerged that are capable of measuring various kinds of ON, especially for particulate ON. Aerosol mass spectrometry (AMS), which has been widely used to characterize organic compounds of aerosols with high temporal resolution, can quantify the number of ON species based on indirect estimation methods (Farmer et al., 2010; Hao et al., 2014; Xu et al., 2015a, b). Rollins et al. (2012) reported the first direct ambient measurement of particulate ON by the Berkeley thermal dissociation-laser induced fluorescence method. These measurements provided significant evidence that ON contribute a substantial portion of the secondary organic aerosols (Rollins et al., 2012; Fry et al., 2013; Ayres et al., 2015; Boyd et al., 2015; Xu et al., 2015b; Lee et al., 2016; Yu et al., 2019). There are two main secondary formation pathways for ON: OH-initiated oxidation of hydrocarbons in the presence of NOx in the daytime, and NO3-induced oxidation of alkenes at night. For the secondary formation pathway, several studies have shown that particulate ON yields were high via nighttime NO3 reacting with biogenic unsaturated alkenes (i.e., isoprene and monoterpene) (Fry et al., 2009; Ayres et al., 2015; Boyd et al., 2015, 2017). Very recently, Joo et al. (2019) reported that particulate ON can be formed from the reaction of NO3 oxidation of 3-Methylfuran, which is an important tracer species in biomass burning plumes. However, the properties, sources and formation mechanisms of particulate ON are still not well understood (Perring et al., 2013). To the best of our knowledge, most research on particulate ON has been conducted in the U.S. and Europe (Perring et al., 2013; Ng et al., 2017), and very few studies have reported detailed particulate ON results for urban areas in China (Xu et al., 2017; Yu et al., 2019), which are characterized by an atmosphere with a large variety of anthropogenic pollutants.
In this study, we conducted aerosol measurements using a TD coupled with an Aerodyne high-resolution time-of-flight aerosol mass spectrometer (TD-HR-AMS) and other collocated instruments at a rural site in the NCP region in summer 2013. Besides investigating the sources and volatility of organic aerosol (OA), we also focused on characterizing the particulate ON with mass concentration, volatility and their possible sources in the NCP rural region.
2.1. Site description and instrumentation
The sampling site (39.80°N, 116.96°E; 15 m MSL) was at Xianghe Atmospheric Observatory of the Institute of Atmospheric Physics, Chinese Academy of Sciences. This site is a rural site surrounded by agricultural fields and located between Beijing and Tianjin, which are the two most important megacities in the NCP region (Fig. 1). The site’s location means that it experiences plumes derived from local agricultural activities or regional transport from urban areas. Measurements were performed from 9 June to 9 July 2013.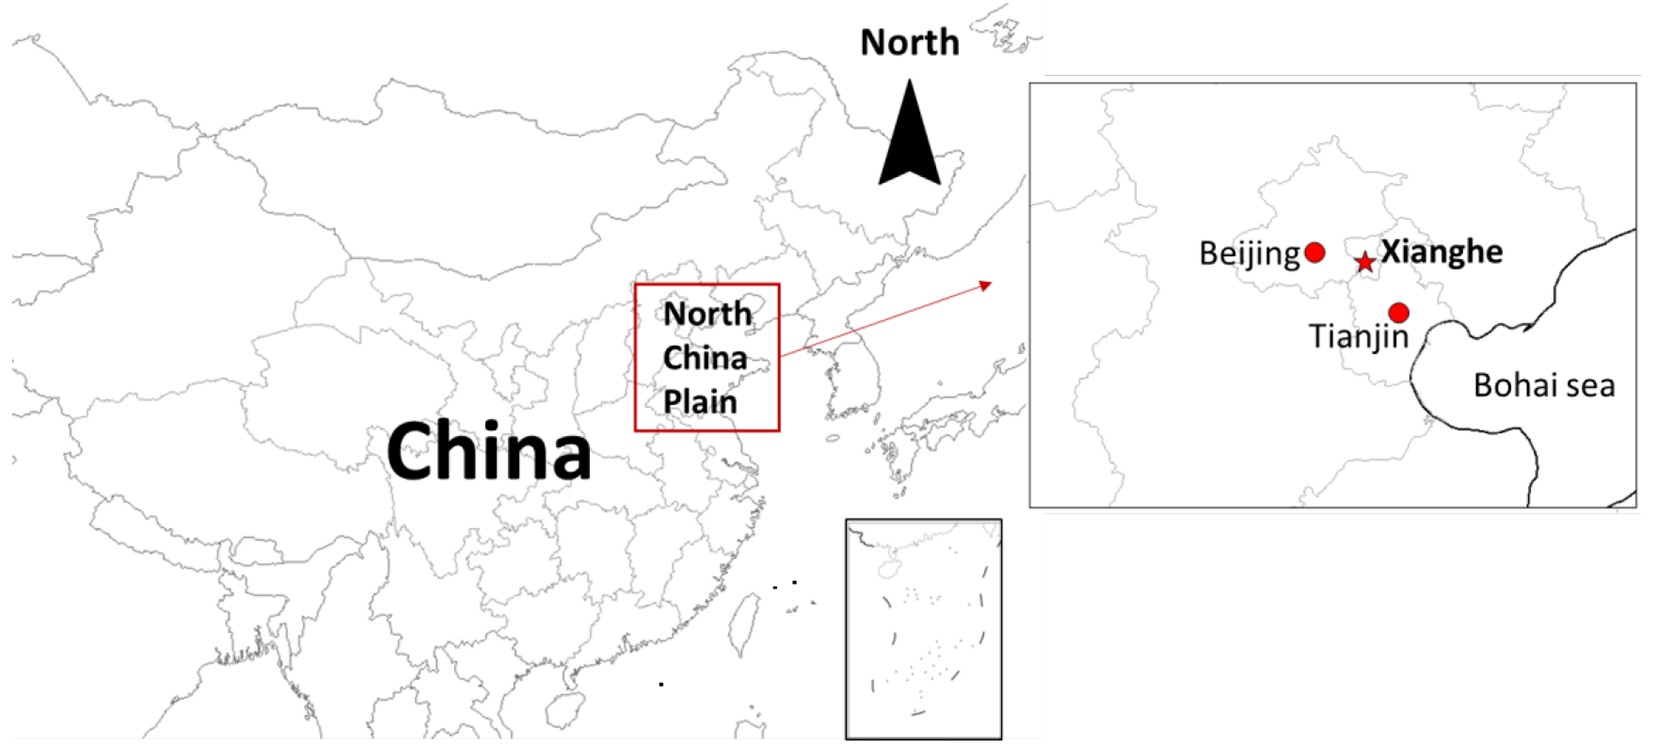 Figure1. Location of the sampling site (Xianghe).
The TD-HR-AMS system was deployed at the site to characterize the chemical compositions, mass concentrations and volatility of non-refractory particulate matter (NR-PM1) (DeCarlo et al., 2006; Canagaratna et al., 2007). A detailed description of the setup and operation of the TD-HR-AMS during measurements can be found in our previous studies (Cao et al., 2018, 2019). Briefly, a PM2.5 cyclone was used to remove coarse particles and introduce the ambient air into the TD-HR-AMS and a scanning mobility particle sizer system (3775 CPC and 3080 DMA, TSI Inc.) through a copper tube with a flow of 10 L min?1. The TD was positioned upstream of the HR-ToF-AMS, and the flow rate passing through the TD was 0.45 L min?1 with a residence time of ~27.9 s in the heating section. The TD included a heating section and denuder section. The temperatures in the heating section were set at 48°C, 95°C, 143°C and 192°C, corresponding to the measured temperatures of 50°C, 100°C, 150°C and 200°C, respectively. Ambient aerosols can pass through directly (bypass flow) or through the TD section (TD flow), and are then dried by a nafion to eliminate the potential influence of relative humidity on the particle collection efficiency (CE) (Matthew et al., 2008). The ionization efficiency (IE) and size calibrations were performed with size-selected pure ammonium-nitrate particles every two weeks. A composition-dependent CE was applied to the data based on the method of Middlebrook et al. (2012). The NR-PM1 species were quantified by the V-mode with unit mass resolution, while the high-resolution mass spectral data were obtained by the W-mode. We operated the HR-ToF-AMS in four menus: bypass flow in V-mode, TD flow in V-mode, TD flow in W-mode, and bypass flow in W-mode, each with a sampling time of 2 min. Besides the TD-HR-AMS system, an aethalometer (AE-31, Magee Inc.) was simultaneously used to measure refractory black carbon (BC) with a temporal resolution of 5 min. The wavelength of 880 nm was used to calculate the mass concentration of BC. The total measured BC can be divided into BC derived from traffic emissions (BC_tr) and biomass burning (BC_bb) based on the aerosol absorption as described in Sandradewi et al., (2008), shown in Text S1 in the Electronic Supplementary Material (ESM).
2
2.2. HR-ToF-AMS data routine processing and positive matrix factorization analysis
The HR-ToF-AMS data routine analysis was performed using the software SQUIRREL (version 1.57) and PIKA (version 1.16) downloaded from the ToF-AMS software downloads webpage (Positive matrix factorization (PMF) analysis is a mathematical technique for solving bilinear unmixing problems (Paatero and Tapper, 1994), and has been widely applied in the aerosol community for source apportionment (Lanz et al., 2007; Jimenez et al., 2009; Ulbrich et al., 2009; Huang et al., 2010, 2013; Ng et al., 2010; Xu et al., 2015a, b; Beddows and Harrison, 2019). PMF analysis for AMS data describes the measured matrix as the linear combination of different factors with a constant mass spectrum and their corresponding time series. The observed data matrix and error matrix were generated with the default fragmentation table in PIKA v1.16 and pretreated the error matrix using PMF Evaluation Toolkit software, following the procedure described in Ulbrich et al. (2009). Ions with a signal-to-noise ratio (SNR) less than 0.2 were removed and ions with an SNR ranging between 0.2 and 2 were downweighted by a factor of 2. The ions of H2O+, HO+, O+, and CO+, which are related to


2
2.3. Estimation of ON mass concentration
In this study, we used two indirect methods to quantify nitrate functionality of ON mass concentration (i.e., NO3,org) based on HR-ToF-AMS measurements. The first method was based on the NO+/


where Robs is the


The second method was based on PMF analysis. We performed the same PMF analysis on HR organic mass spectra combining NO+ and


where [OA factor]i represents the mass concentration of the ith OA factor and fNOi and fNO2,i represent the mass fractions of NO+ and

3.1. PM1 composition and OA source apportionment
The daily average ambient PM1 mass concentration was 51.2 ± 48.0 μg m?3 (mean ± standard deviation), ranging from 1.5 to 466 μg m?3, shown in Fig. 2a. The biggest contributor of PM1 mass loading during summer 2013 was organic (35.4%), followed by sulfate (31.3%), ammonium (12.8%) and nitrate (11.4%) (Fig. 2b). Figure 2c indicates the variation in relative contributions of different species as a function of the total PM1 mass loading. We can see that organics show a continuously increasing fraction when PM1 was accumulating, implying OA played a more important role in extremely polluted periods. Therefore, we discuss the source apportionment of OA further below.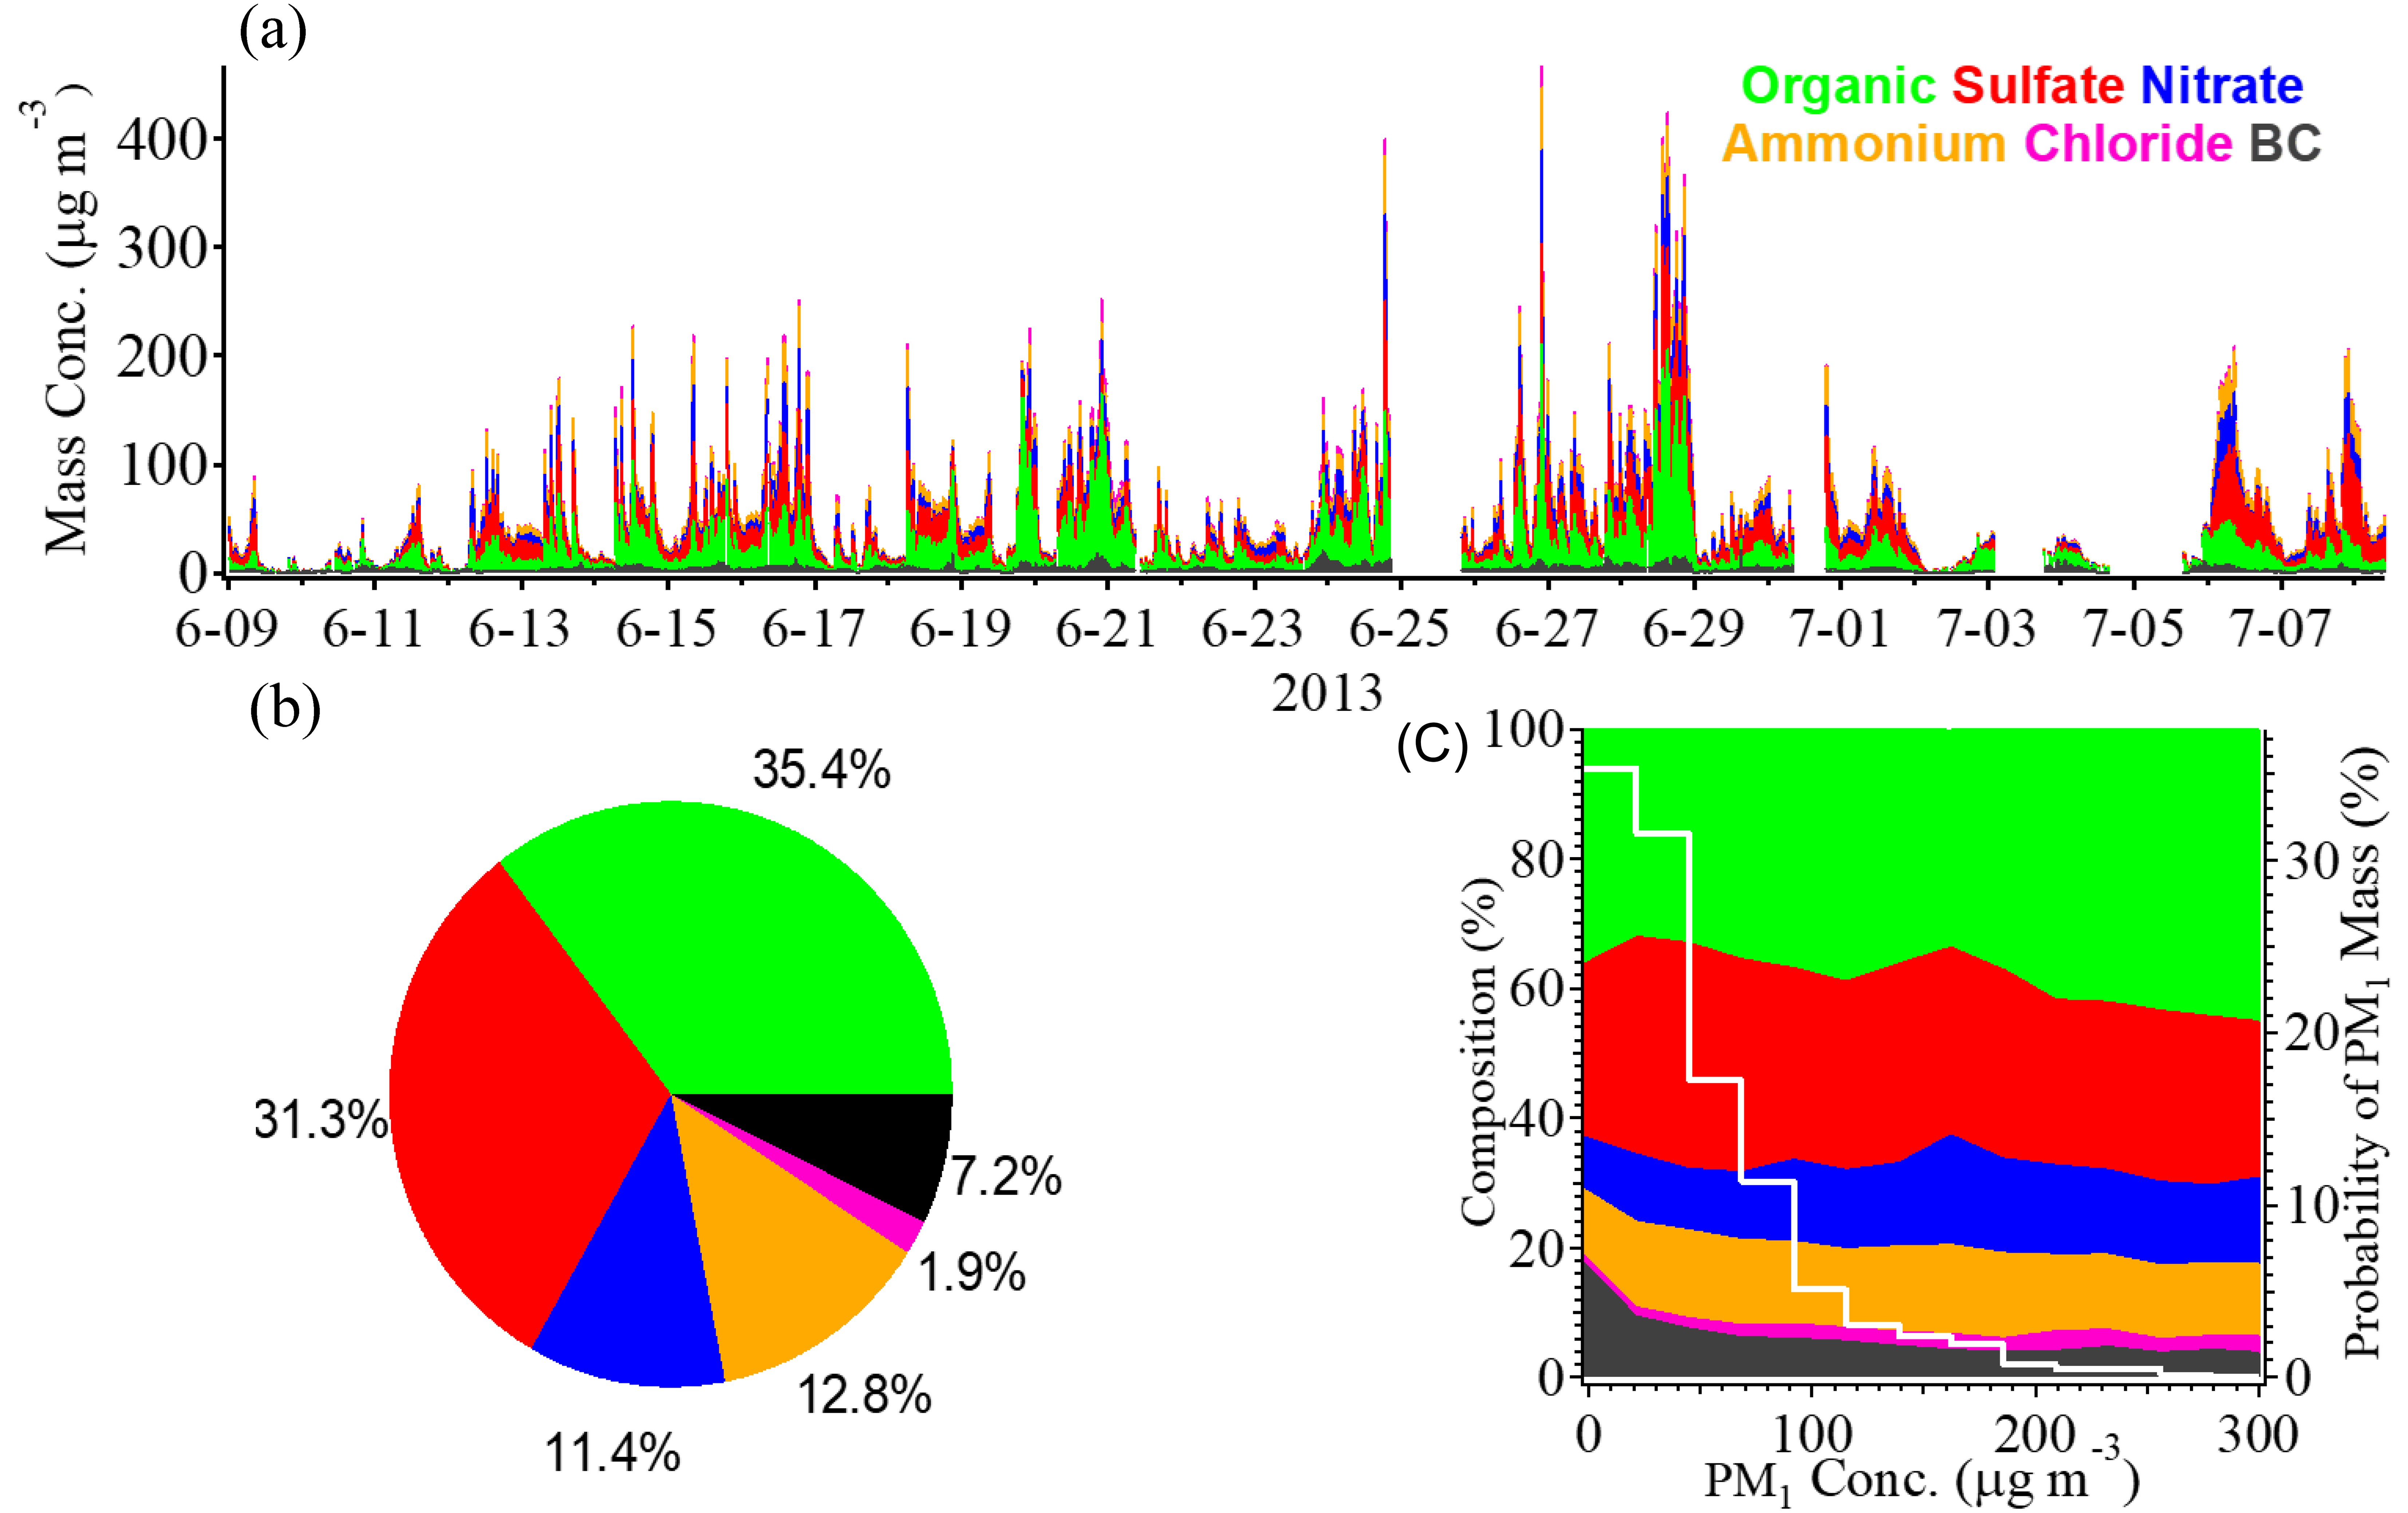 Figure2. (a) Time series of PM1 species. (b) Pie chart showing the average chemical compositions. (c) Evolutions of PM1 compositions (left-hand axis) as a function of PM1 mass concentration, and the probability distributions of PM1 mass concentration (white line to the right-hand axis).
PMF analysis for OA resolved four OA factors: HOA, BBOA, LO-OOA and MO-OOA. The MS profiles and the mass contributions of each factor are shown in Figs. 3a and b. The mass fractions of HOA, BBOA, LO-OOA and MO-OOA were 18.4%, 29.4%, 21.4% and 30.8%, respectively. Note that biomass burning is a large contributor to OA due to the summer wheat harvest in the NCP region. BBOA was found to contribute 36%–39% to OA during harvest seasons in China (Zhang et al., 2015). The characteristics of the mass profile for each factor are distinct. HOA had an MS profile characterized by a large fraction of


 Figure3. (a) MS profiles of the OA factors. (b) Pie chart showing the average OA components. (c) Diurnal patterns of the OA components.
2
3.2. Estimating results of ON and correlation analysis
We first applied the


| Values | |||
| (a) NO+/NO2+ ratio method | |||
| Lower | Upper | ||
| NO3,org (μg m?3)a | 0.46 | 0.70 | |
| NO3,org/total NO3 | 0.078 | 0.12 | |
| (b) PMF method | |||
| NO3,org (μg m?3)b | 0.54 | ||
| NO3,org/total NO3 | 0.093 | ||
| Notes: aNO3, org for upper bound is denoted as NO3_org_ratio_1, and NO3, org for lower bound is denoted as NO3_org_ratio_2; bNO3, org estimated using the PMF method is denoted as NO3_org_PMF. | |||
Table1. Summary of ON estimations using the NO+/NO2+ ratio method and the PMF method.
 Figure4. (a) Time series of NO3, org concentration estimated by the NO+/NO2+ ratio method and PMF method for the study period. (b) Correlations between NO3_org_ratio_1 and NO3_org_PMF. (c) Diurnal trends of NO3_org_ratio_1, BC_bb (left-hand axis), inorganic nitrates (NO3_inorg) and BBOA (right-hand axis).
Figure 5a shows scatterplots of NO3_org_ratio_1 versus OA factors resolved by PMF analysis, BC from biomass burning (BC_bb), and BC from traffic emissions (BC_tr). We find that NO3_org_ratio_1 had good correlations with BBOA (r = 0.71) and BC_bb (r = 0.67), but a poor correlation with LO-OOA (r = 0.20), which is quite different from the results in other regions that show the highest ON correlation with LO-OOA (Xu et al., 2015a, b; Yu et al., 2019). Particulate ON formation is found to be through photooxidation of biogenic VOCs in the presence of NOx in the daytime (Teng et al., 2015, 2017) and NO3 radicals oxidation of biogenic VOCs at night (Fry et al., 2013; Ayres et al., 2015; Boyd et al., 2015; Xu et al., 2015b; Lee et al., 2016; Yu et al., 2019). However, recent studies show that NO3 radicals reacting with typical VOCs in biomass burning plumes could also produce a substantial fraction of particulate ON (Ahern et al., 2019; Joo et al., 2019). The good correlation between ON and biomass burning aerosols in this study indicate the possible existence of different formation mechanisms of ON relevant to biomass burning plumes in the real atmosphere. Here, we further compared the diurnal variation of NO3_org_ratio, inorganic nitrates (NO3_inorg), BBOA and BC_bb in Fig. 4c. First, the result shows that NO3_org_ratio had a quite different diurnal variation from NO3_inorg, implying that ON has been well separated from inorganic nitrates in this study. Furthermore, NO3_org_ratio increased by nearly two times from 1700 LST to 2200 LST and maintained a relative high mass loading level during the nighttime. We note that there were two similar peaks at 2100–2200 LST and 0300–0400 LST in the NO3_org_ratio, BBOA and BC_bb variation trends. A number of studies have proposed that nighttime biomass burning contributes to OA compositions in field campaigns, in particular with some specific ON species formation (Allan et al., 2010; Iinuma et al., 2010, 2016; Mohr et al., 2013). However, these studies did not describe the influence of biomass burning on overall ON. In order to better understand ON in this case, we will attempt to characterize it from the property of volatility in the following section.
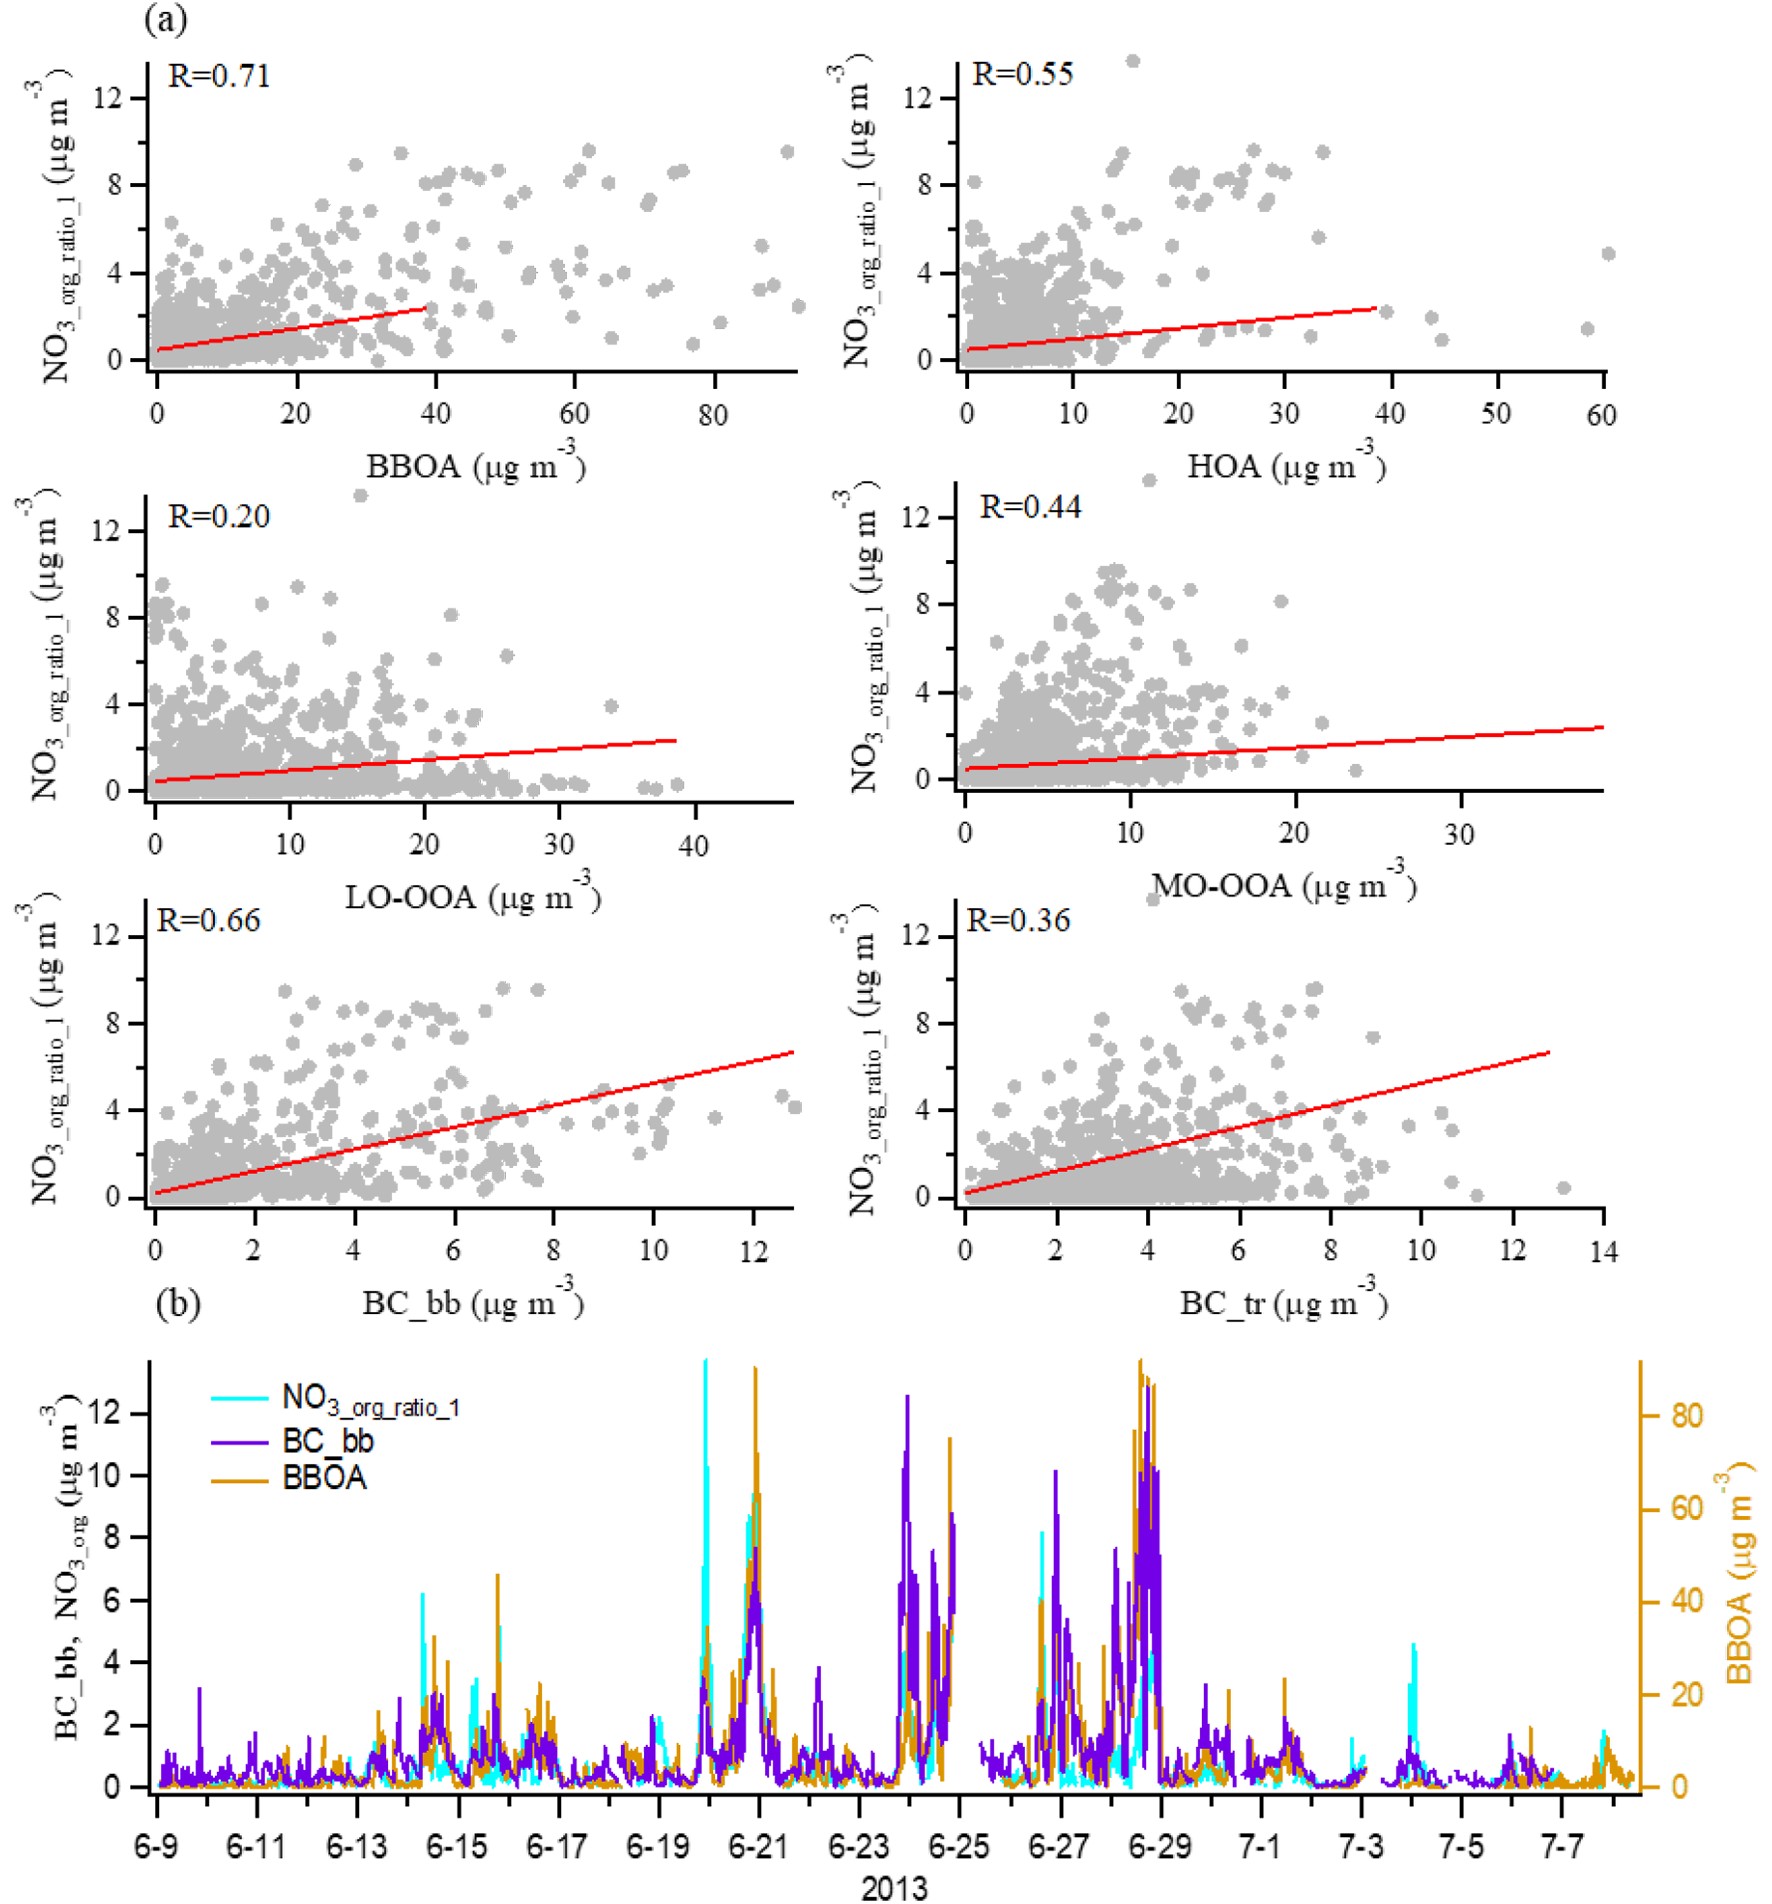 Figure5. (a) Correlations of NO3, org1_ratio with OA factors resolved by PMF, BC from biomass burning (BC_bb), and BC from traffic emissions (BC_tr). (b) Time series of NO3, org concentration estimated by the NO+/
2
3.3. Volatility characteristics of OA factors and ON
The mass fraction remaining (MFR) of different OA factors resolved by PMF analysis, ON and inorganic nitrates are shown in Fig. 6. MFRs varied differently among different OA factors. The MFR of HOA was 0.58 at 50°C and decreased by 1.70 % °C?1; then the evaporation rate slowed down from 50°C to 200°C with a nearly constant rate of 0.35% °C?1, and only 4.9% was left at 200°C. BBOA had a similar MFR variation to HOA, with a fast decrease from ambient temperature to 50°C (evaporation rate was 2% °C?1) and a slower decrease from 50°C to 200°C (0.5% °C?1 for 50°C–150°C and 0.006% °C?1 for 150°C–200°C), but much wider standard deviation (SD) areas at temperature stages, suggesting BBOA contained more compounds that have different evaporation, which agrees with the BBOA factor in this case consisting of fresh and aged ones. The MFR of LO-OOA at 50°C was 0.72, lower than that of MO-OOA (0.80) and with increased temperature, and the MFR of MO-OOA decreased much slower than LO-OOA and other OA factors, both implying that MO-OOA was less volatile compared to other OA factors. The volatility sequence of OA factors in this study was HOA > BBOA > LO-OOA > MO-OOA, determined by the MFR at 50°C (Cao et al., 2018, 2019; Xu et al., 2019). Figure6. Variation of the average MFR of OA factors (a–d) resolved by PMF, ON (NO3_org) (e), and inorganic nitrates (f) with the TD temperature. The shaded regions indicate the average ± SD.
In order to investigate the volatility of ON, we estimated the mass concentration of NO3,org at different temperatures using the

The ON were quantified by two methods, i.e.,

Acknowledgements. This work was supported by the Ministry of Science and Technology of China (Grant No. 2017YFC0210004), the National Natural Science Foundation of China (Grant No. 91744202), and the China Postdoctoral Science Foundation and Guangdong Province Outstanding Young Talents for the International Education & Development Plan: Post-Doctoral Program.
Electronic supplementary material: Supplementary material is available in the online version of this article at
