HTML
--> --> -->In general, orographic precipitation might be inhibited by increasing aerosol particles, due to a smaller collision efficiency of cloud droplets (Givati and Rosenfeld, 2004) or lower riming rate (Borys et al., 2003). An increasing aerosol concentration will produce more cloud droplets of smaller size and then suppress the warm microphysical processes (Albrecht, 1989; Thompson and Eidhammer, 2014). Moreover, larger quantities of cloud droplets and liquid water content (LWC) under polluted conditions may increase the frequency of the freezing of small droplets, and potentially reduce the number of light precipitation events and increase the number of heavy precipitation events (Qian et al., 2009; Alizadeh-Choobari and Gharaylou, 2017; Alizadeh-Choobari, 2018). Because of the complexity of the dynamical and microphysical processes involved, the influence of aerosol particles on orographic precipitation may be different under different environmental conditions (Lynn et al., 2007; Khain, 2009; Muhlbauer et al., 2010, Fan et al., 2014; Xiao et al., 2016). Moreover, the response of microphysical processes to increasing aerosol loading may be different and even opposite (Tao et al., 2012). The discrepancies found among previous studies on aerosol?cloud?precipitation interaction may exist because of the different microphysical schemes employed, besides the model initial conditions (Ghan et al., 2011). Additionally, Muhlbauer et al. (2010), by using three different models, suggested that the sensitivity of orographic precipitation to aerosol particles also changes dramatically from model to model.
In many atmospheric models, the autoconversion process is used to describe the conversion from cloud water to rainwater. It is a key microphysical process whereby initial raindrops are formed from the collision and coalescence of cloud droplets (Lin et al., 1983). Because of the complexity of the collision?coalescence process, there have been many parameterization schemes developed for numerical models (Berry, 1968; Kessler, 1969; Tripoli and Cotton, 1980; Beheng, 1994; Khairoutdinov and Kogan, 2000; Seifert and Beheng, 2001; Liu and Daum, 2004), especially in bulk microphysics models. Xie and Liu (2015) suggested that the aerosol-induced precipitation change of deep convective cloud systems is strongly dependent on the autoconversion parameterization scheme. Their results showed that surface precipitation is reduced significantly with increasing aerosol loading by using the Khairoutdinov?Kogan scheme (Khairoutdinov and Kogan, 2000), while it is increased slightly by using the Kessler (Kessler, 1969) scheme. In a climate model (CAM4), Chuang et al. (2012) showed that cloud properties are sensitive to the treatment of autoconversion. By considering five autoconversion schemes, Michibata and Takemura (2015) reported that the liquid water path and cloud optical thickness are highly sensitive to the choice of scheme, and the sensitivity has the same magnitude as model biases. In short, the variation of precipitation induced by aerosols may be different when different autoconversion schemes are adopted.
Although numerous studies have been conducted to study the influence of aerosol particles on orographic precipitation, they have not delved deeply into comparing parameterization schemes or models when discussing aerosol?cloud?precipitation interaction. Therefore, in this study, we attempt to evaluate the sensitivity of orographic precipitation to aerosol particles by using different autoconversion schemes. Moreover, the responses of the microphysical processes and precipitation formation to changes in aerosol loading are also investigated. Specifically, we employ seven common autoconversion schemes (Chuang et al., 2012; Michibata and Takemura, 2015; Planche et al., 2015) that describe the interaction of aerosol and precipitation with the influences of cloud water content and droplet number concentration. The hope is that our findings will be helpful for investigating aerosol?cloud interaction or improving cloud parameterization.
where h(x) is the terrain height at the grid of x, h0 (= 1 km) is the peak height of the terrain, x0 (= 400) is the location of the center of the terrain, and a (= 20 km) is the half-width of the terrain (Xiao et al., 2014). According to the work of Muhlbauer and Lohmann (2008), the initial profiles of relative humidity and temperature are shown in Fig. 1. The surface temperature and surface pressure are set to 285 K and 1000 hPa, respectively. The relative humidity is set to 90% at the surface and the wind is set to 15 m s?1 below 10 km.
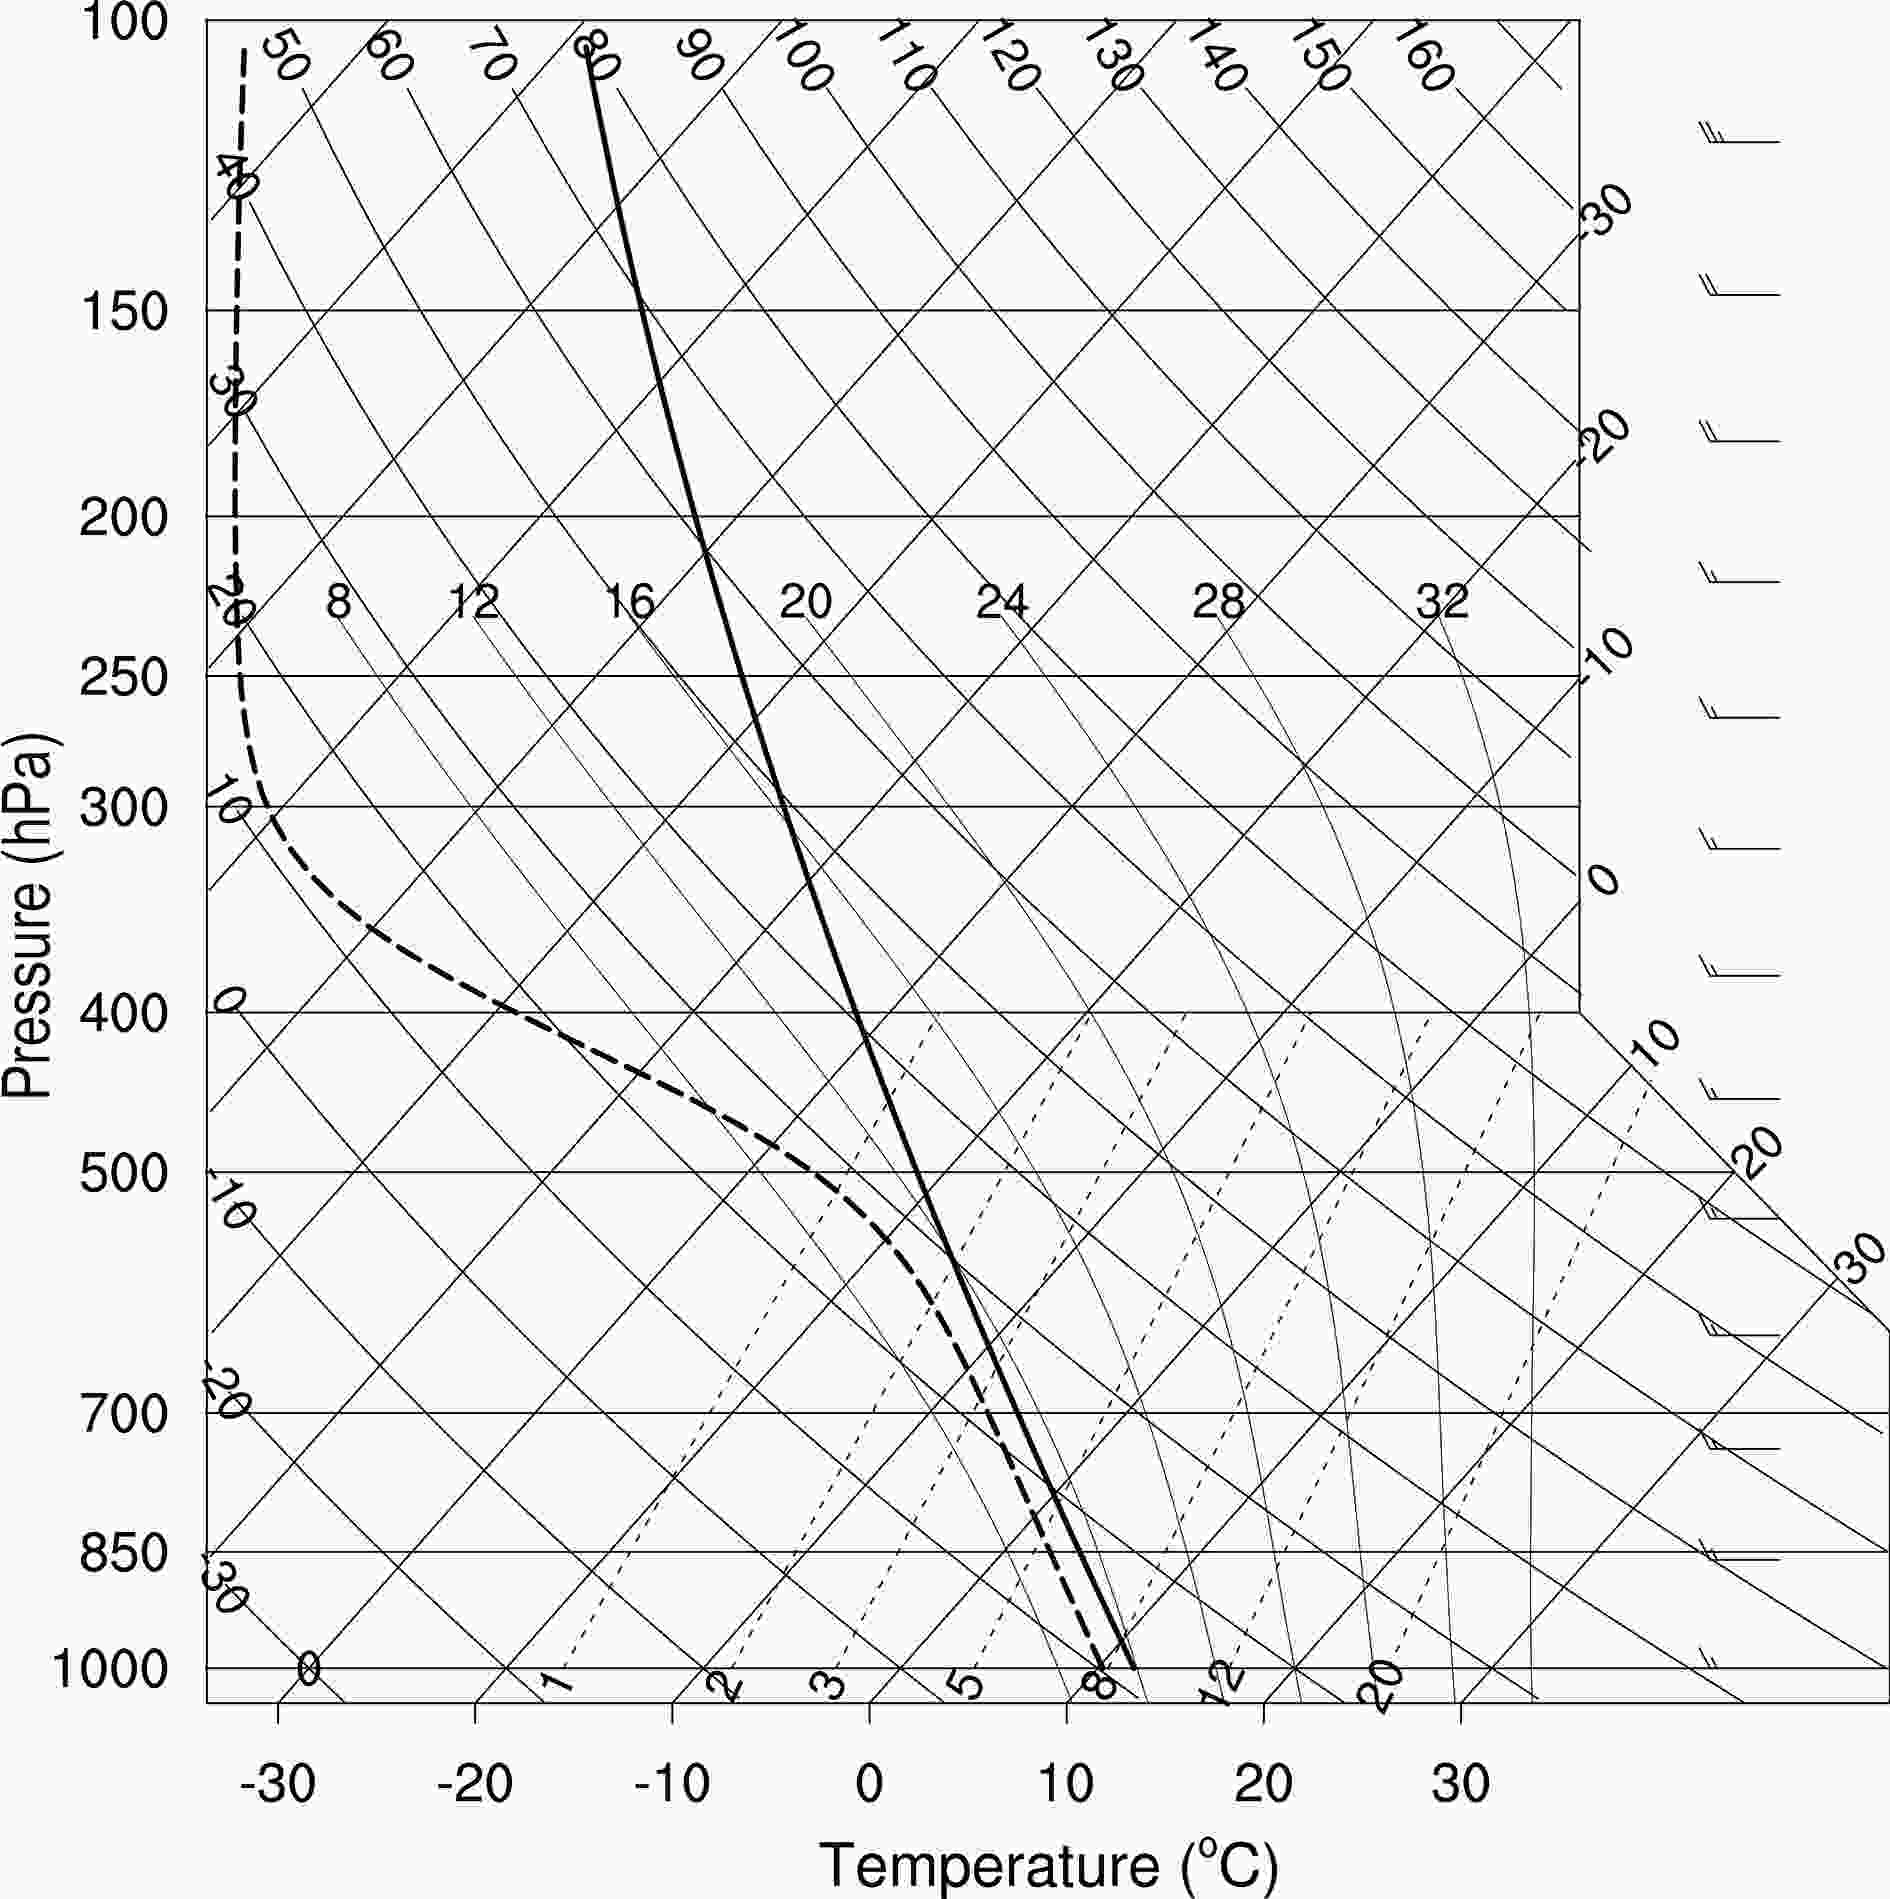 Figure1. Initial profiles of temperature (solid line) and dewpoint temperature (dashed line) for simulation.
In order to explore the impact of autoconversion parameterization schemes on the change in aerosol-induced orographic precipitation, the equations in the microphysics schemes remain unchanged except for the autoconversion formula. In this study, the initial concentration of cloud droplets is changed from 100 cm?3 to 1000 cm?3 to describe the environmental conditions from clean to polluted. Seven autoconversion schemes are employed to investigate the sensitivity to the concentration of initial cloud droplets.
The Berry scheme (Berry, 1968; hereafter referred to as Be1968) states that the autoconversion rate is reduced by an increasing number concentration of cloud droplets and is increased by an increasing mass concentration of cloud water. However, there is a nonlinear relationship between the rate and number (or mass) concentration of cloud droplets:
where (?qr/?t)auto (units: kg m?3) is the autoconversion rate, Nc and qc are the number concentration (units: m-3) and mass concentration (units: kg m?3) of cloud droplets, C1 = 1.0 × 10?2, C2 = 0.12, and C3 = 1.0 × 10?12. The Tripoli and Cotton scheme (Tripoli and Cotton, 1980; hereafter referred to as TC1980) is similar to the Berry scheme, but contains the Heaviside step function:
where mu is dynamic viscosity; Ecr (= 0.55) is the mean collection efficiency; ρw is the density of liquid water; and H(qc ? qc0) is the Heaviside step function, in which qc0 is the minimum cloud water for the conversion. The equation of the Beheng scheme (Beheng, 1994; hereafter referred to as Be1994) is:
where Nc and qc are the number concentration (units: cm?3) and mass concentration (units: g cm?3) of cloud droplets, μ is the spectral shape parameter, and C4 = 6.0 × 1028. The equation of the Khairoutdinov and Kogan scheme (Khairoutdinov and Kogan, 2000; hereafter referred to as KK2000) is:
where ρ0 is the density of air. The Seifert and Beheng scheme (Seifert and Beheng, 2001) states that the autoconversion rate is associated with the shape parameter, cloud water, and rainwater. The equation is:
where x* (= 2.6 × 10?7 g) referred to the boundary between cloud water and rainwater, kc (= 9.44 × 109 cm2 g?2 s?1) is a constant, xc is the mean mass, τ is the ratio of rainwater to the total liquid water mass, and

where κ2 (= 1.9 × 1011 cm?3) is a constant, and β6 is a function of relative dispersion (ε). As the cloud droplet size distribution is represented by the gamma function, β6 is shown to be
where the relative dispersion ε = 571.4Nc + 0.2714 (Morrison and Grabowski, 2007). According to the results of Xie et al. (2013), there is a negative relationship between the autoconversion rate and cloud droplet number concentration, especially for concentrations less than 300 cm?3.
In this study, the stochastic collection equation (SCE) is employed as a reference to describe the evolution of the drop spectrum. The time-dependent SCE for a spectrum of liquid water is (Tzivion et al., 1987)
where n(x, t) dx is the number of drops with masses between x and x + dx per unit volume at time t, and K(x, y) is the collection kernel. According to the solution of Tzivion et al. (1987), the SCE is converted to a set of two-moment equations and it is an efficient method to simulate the evolution of the drop spectrum with collision and coalescence. In order to separate the drop spectrum into cloud droplets and raindrops artificially for parameterization schemes, the separating drop radius of 40 μm is adopted (Seifert and Beheng, 2001; hereafter referred to as SB2001). The drop spectrum is divided into 36 bins with mass doubling between adjacent bins. The experiments are conducted with seven autoconversion equations and ten conditions of initial cloud droplet concentration (Table 1). In particular, the initial cloud droplet concentration (N) is increased from 100 cm?3 to 1000 cm?3 (N = 100 to 1000 cm?3) with a concentration interval of 100 cm?3.
| Scheme reference | Experiment name | Equation |
| Berry (1968) | Be1968 | (2) |
| Tripoli and Cotton (1980) | TC1980 | (3) |
| Beheng (1994) | Be1994 | (4) |
| Khairoutdinov and Kogan (2000) | KK2000 | (5) |
| Seifert and Beheng (2001) | SB2001 | (6) |
| Liu and Daum (2004) | LD2004 | (7) |
| Tzivion et al. (1987) | SCE | (8) |
Table1. List of experiments in this study.
The change in autoconversion rate in each scheme is shown in Fig. 2. In these autoconversion schemes, the cloud water content and droplet number concentration are considered to calculate the autoconversion rate. From the representation of equations, the sensitivities of the autoconversion rate to droplet number concentration is different from scheme to scheme (approximately as a function of Nc?1 in Be1968, Nc?1/3 in TC1980, Nc?3.3 in Be1994, Nc?1.79 in KK2000, Nc?2 in SB2001, and Nc?1 in LD 2004). Hence, the variation of the autoconversion rate with the change in cloud droplet number concentration from 10 cm?3 to 1000 cm?3 is also different. The Be1994 scheme is the most sensitive to cloud droplet number concentration besides the SCE scheme, while the TC1980 scheme is the least sensitive. In general, there is a significant difference in the autoconversion rate between schemes, even under the same values of cloud water content and number concentration. Moreover, the degree of variation of the autoconversion rate induced by cloud droplet number concentration is also different in every scheme.
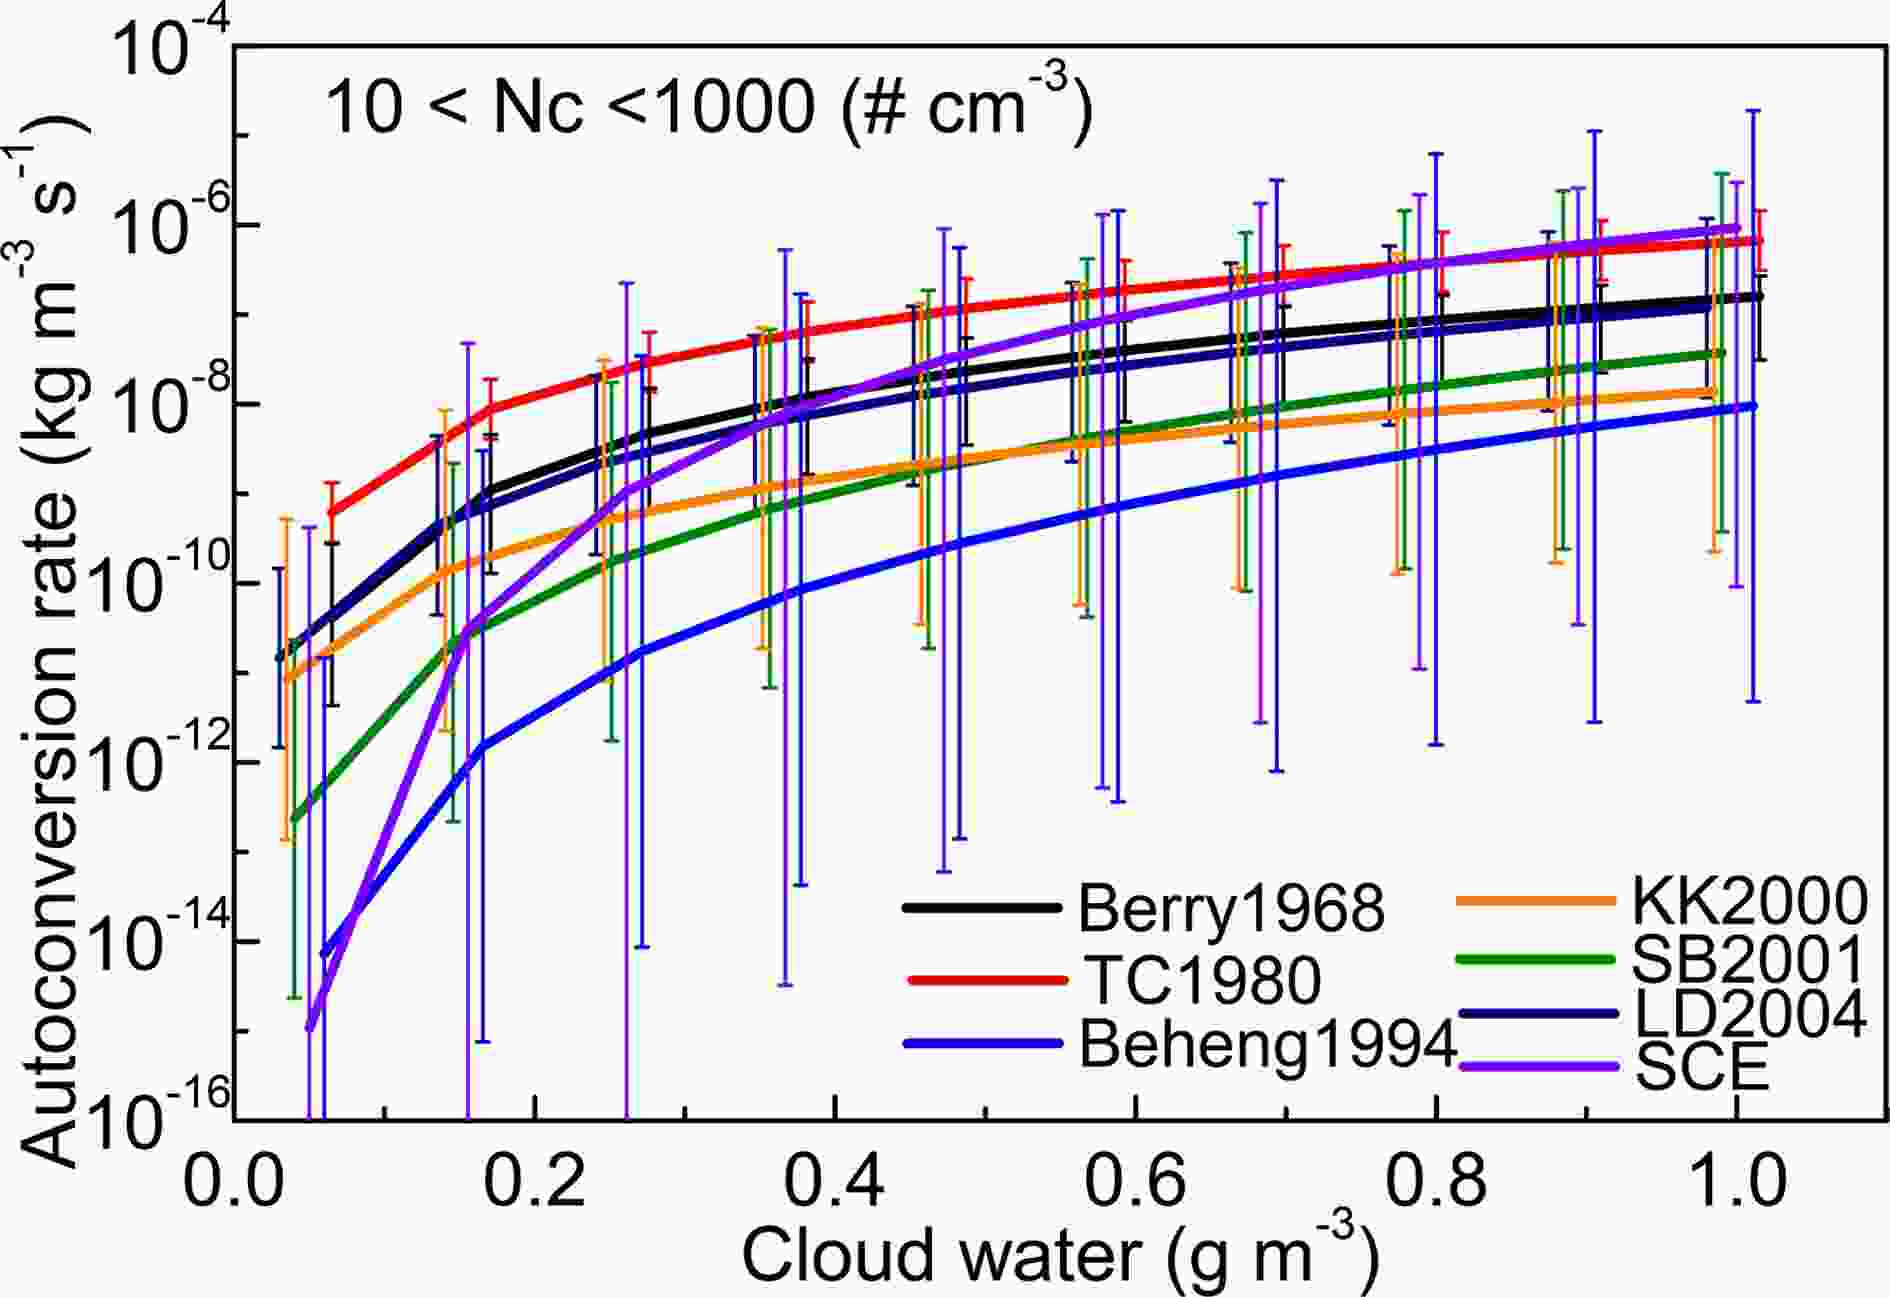 Figure2. Dependence of autoconversion rate (units: kg m?3 s?1) on the cloud water content and cloud droplet number concentration. The curves describe the rate with a concentration of 100 cm?3, while the error bars represent the range of number concentration from 10 to 1000 cm?3.
3.1. Changes of hydrometeors
As air travels over the idealized bell-shaped topography in this study, stable stratocumulus cloud is formed. Figure 3 shows vertical cross-sections of the LWC (contains cloud water and rainwater) and wind field after 10 h of simulation with the SCE scheme. Under different initial conditions of cloud droplet concentration, the simulated stratocumulus clouds are alike in appearance. In this study, the evolution of warm-phase orographic cloud will be emphasized, because the mass concentration of ice-phase particles is almost zero in these cases. Under the condition of N = 100 cm?3 (it means initial concentration of cloud droplets is 100 cm-3), the orographic cloud mainly locates on the windward side of the mountain, and the maximum LWC also appears on the windward slope while the air flow descends on the leeward side. As the number concentration of initial cloud droplets increases, the LWC increases mainly below the height of 1.5 km. A higher cloud droplet number concentration will lead to a delayed formation of raindrops. Hence, the changed distribution of LWC gradually moves from the peak of the mountain to downstream with increasing droplet concentration. The changed trend of cloud water is similar to that of LWC, while it is opposite in rainwater (not shown). Moreover, the changes of rainwater are mainly distributed around the peak of the mountain.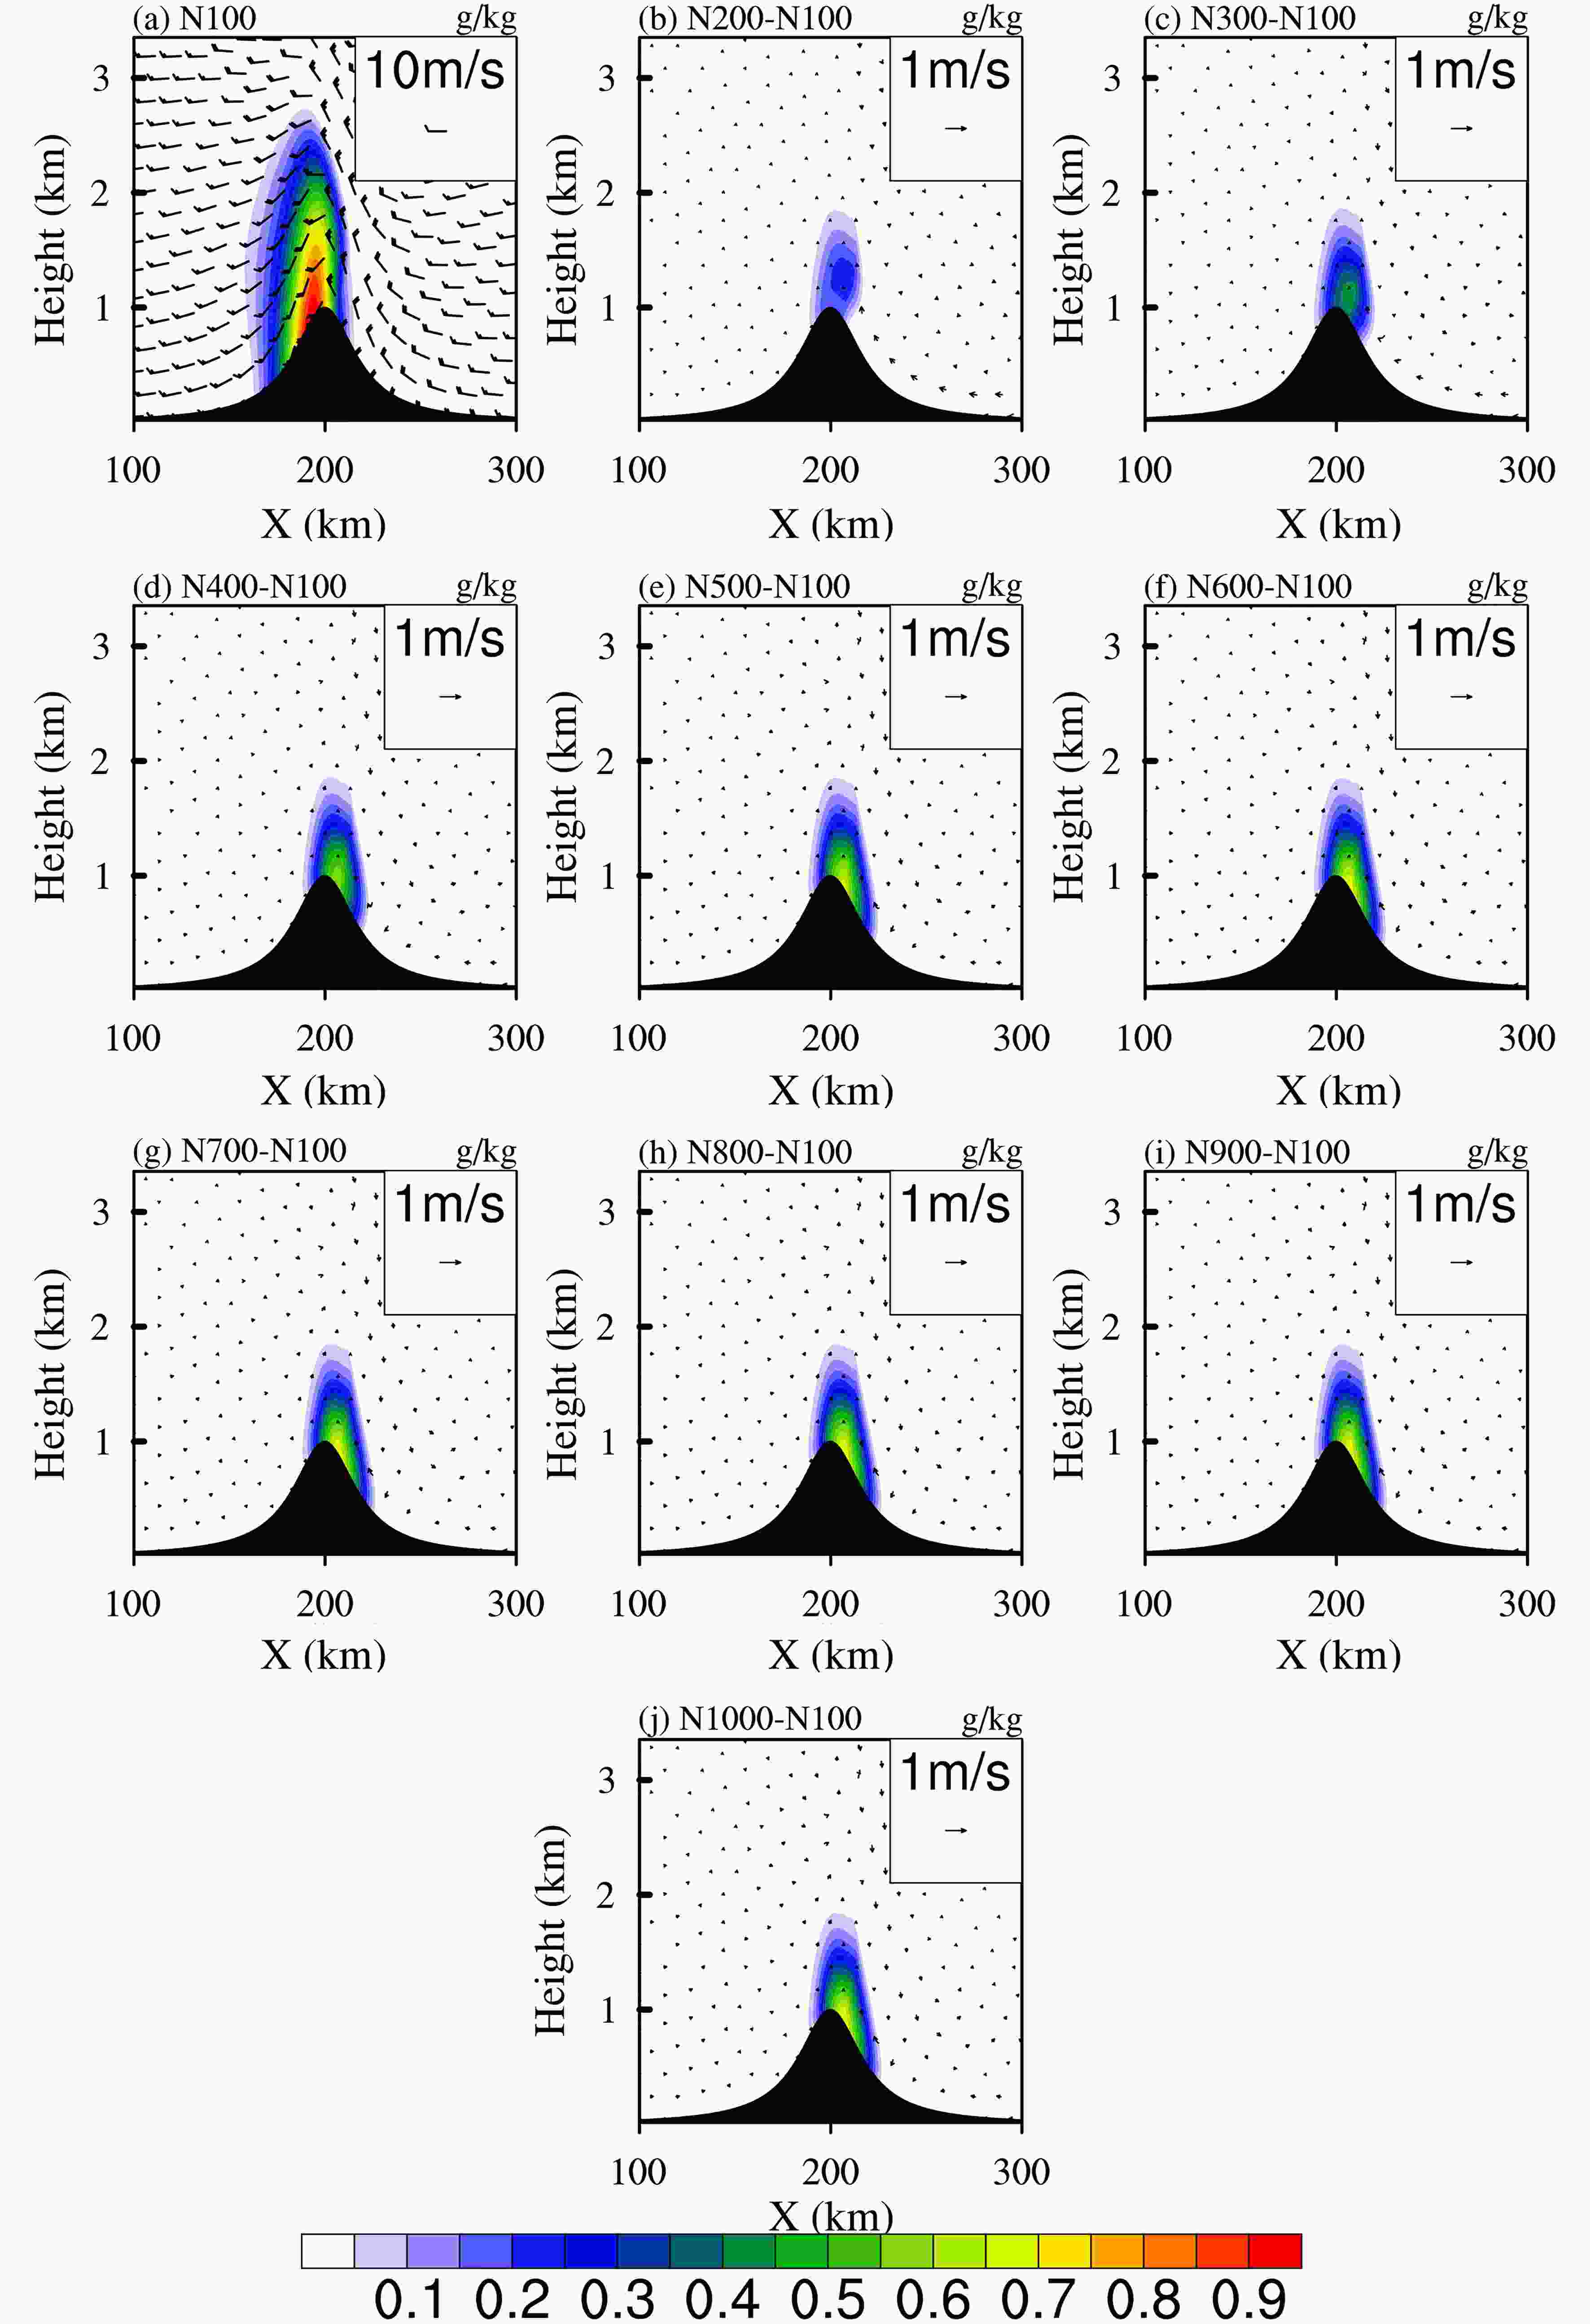 Figure3. Vertical cross-sections of the LWC and wind field under the initial condition of N = 100 cm?3 (initial cloud droplet concentration) after 10 h of simulation with the SCE scheme, and the differences between other conditions of droplet number concentration and the condition of N = 100 cm?3.
The grid-averaged mixing ratios of cloud water and rainwater are shown in Fig. 4. In the SCE scheme, the mixing ratio of cloud water is increased with increasing initial droplet concentration, while the rainwater is decreased. In general, high concentrations of cloud droplets are produced under polluted conditions, leading to competition for water vapor and less efficient collision of droplets. Ultimately, the formation of rainwater is inhibited, resulting suppressed precipitation. Compared to other autoconversion schemes, the changed rates of cloud water and rainwater due to increasing initial droplet concentration are larger in the SCE scheme. Except for the SCE scheme, the changes of cloud water and rainwater to number concentration of droplets in other schemes can be divided into two categories. The first category contains the Be1994, KK2000, SB2001, and LD2004 schemes. In the first category, the grid-averaged cloud water is significantly increased by about 4% per increase in droplets of 100 cm?3 when N ≤ 400 cm?3. When N ≥ 400 cm?3, the cloud water remains unchanged. The second category contains the Be1968 and TC1980 schemes. The simulated mixing ratios of cloud water from these schemes are gradually increased with increasing initial droplet concentration, and they are increased by about 19% when the number concentration of initial cloud droplets increases from 100 cm?3 to 1000 cm?3. In the SCE scheme, the grid-averaged cloud water is increased by about 55% when the initial droplet concentration is increased by 10 times (N = 100 cm?3 changes to N = 1000 cm?3). Moreover, the changed tendency of rainwater is opposite to that of cloud water.
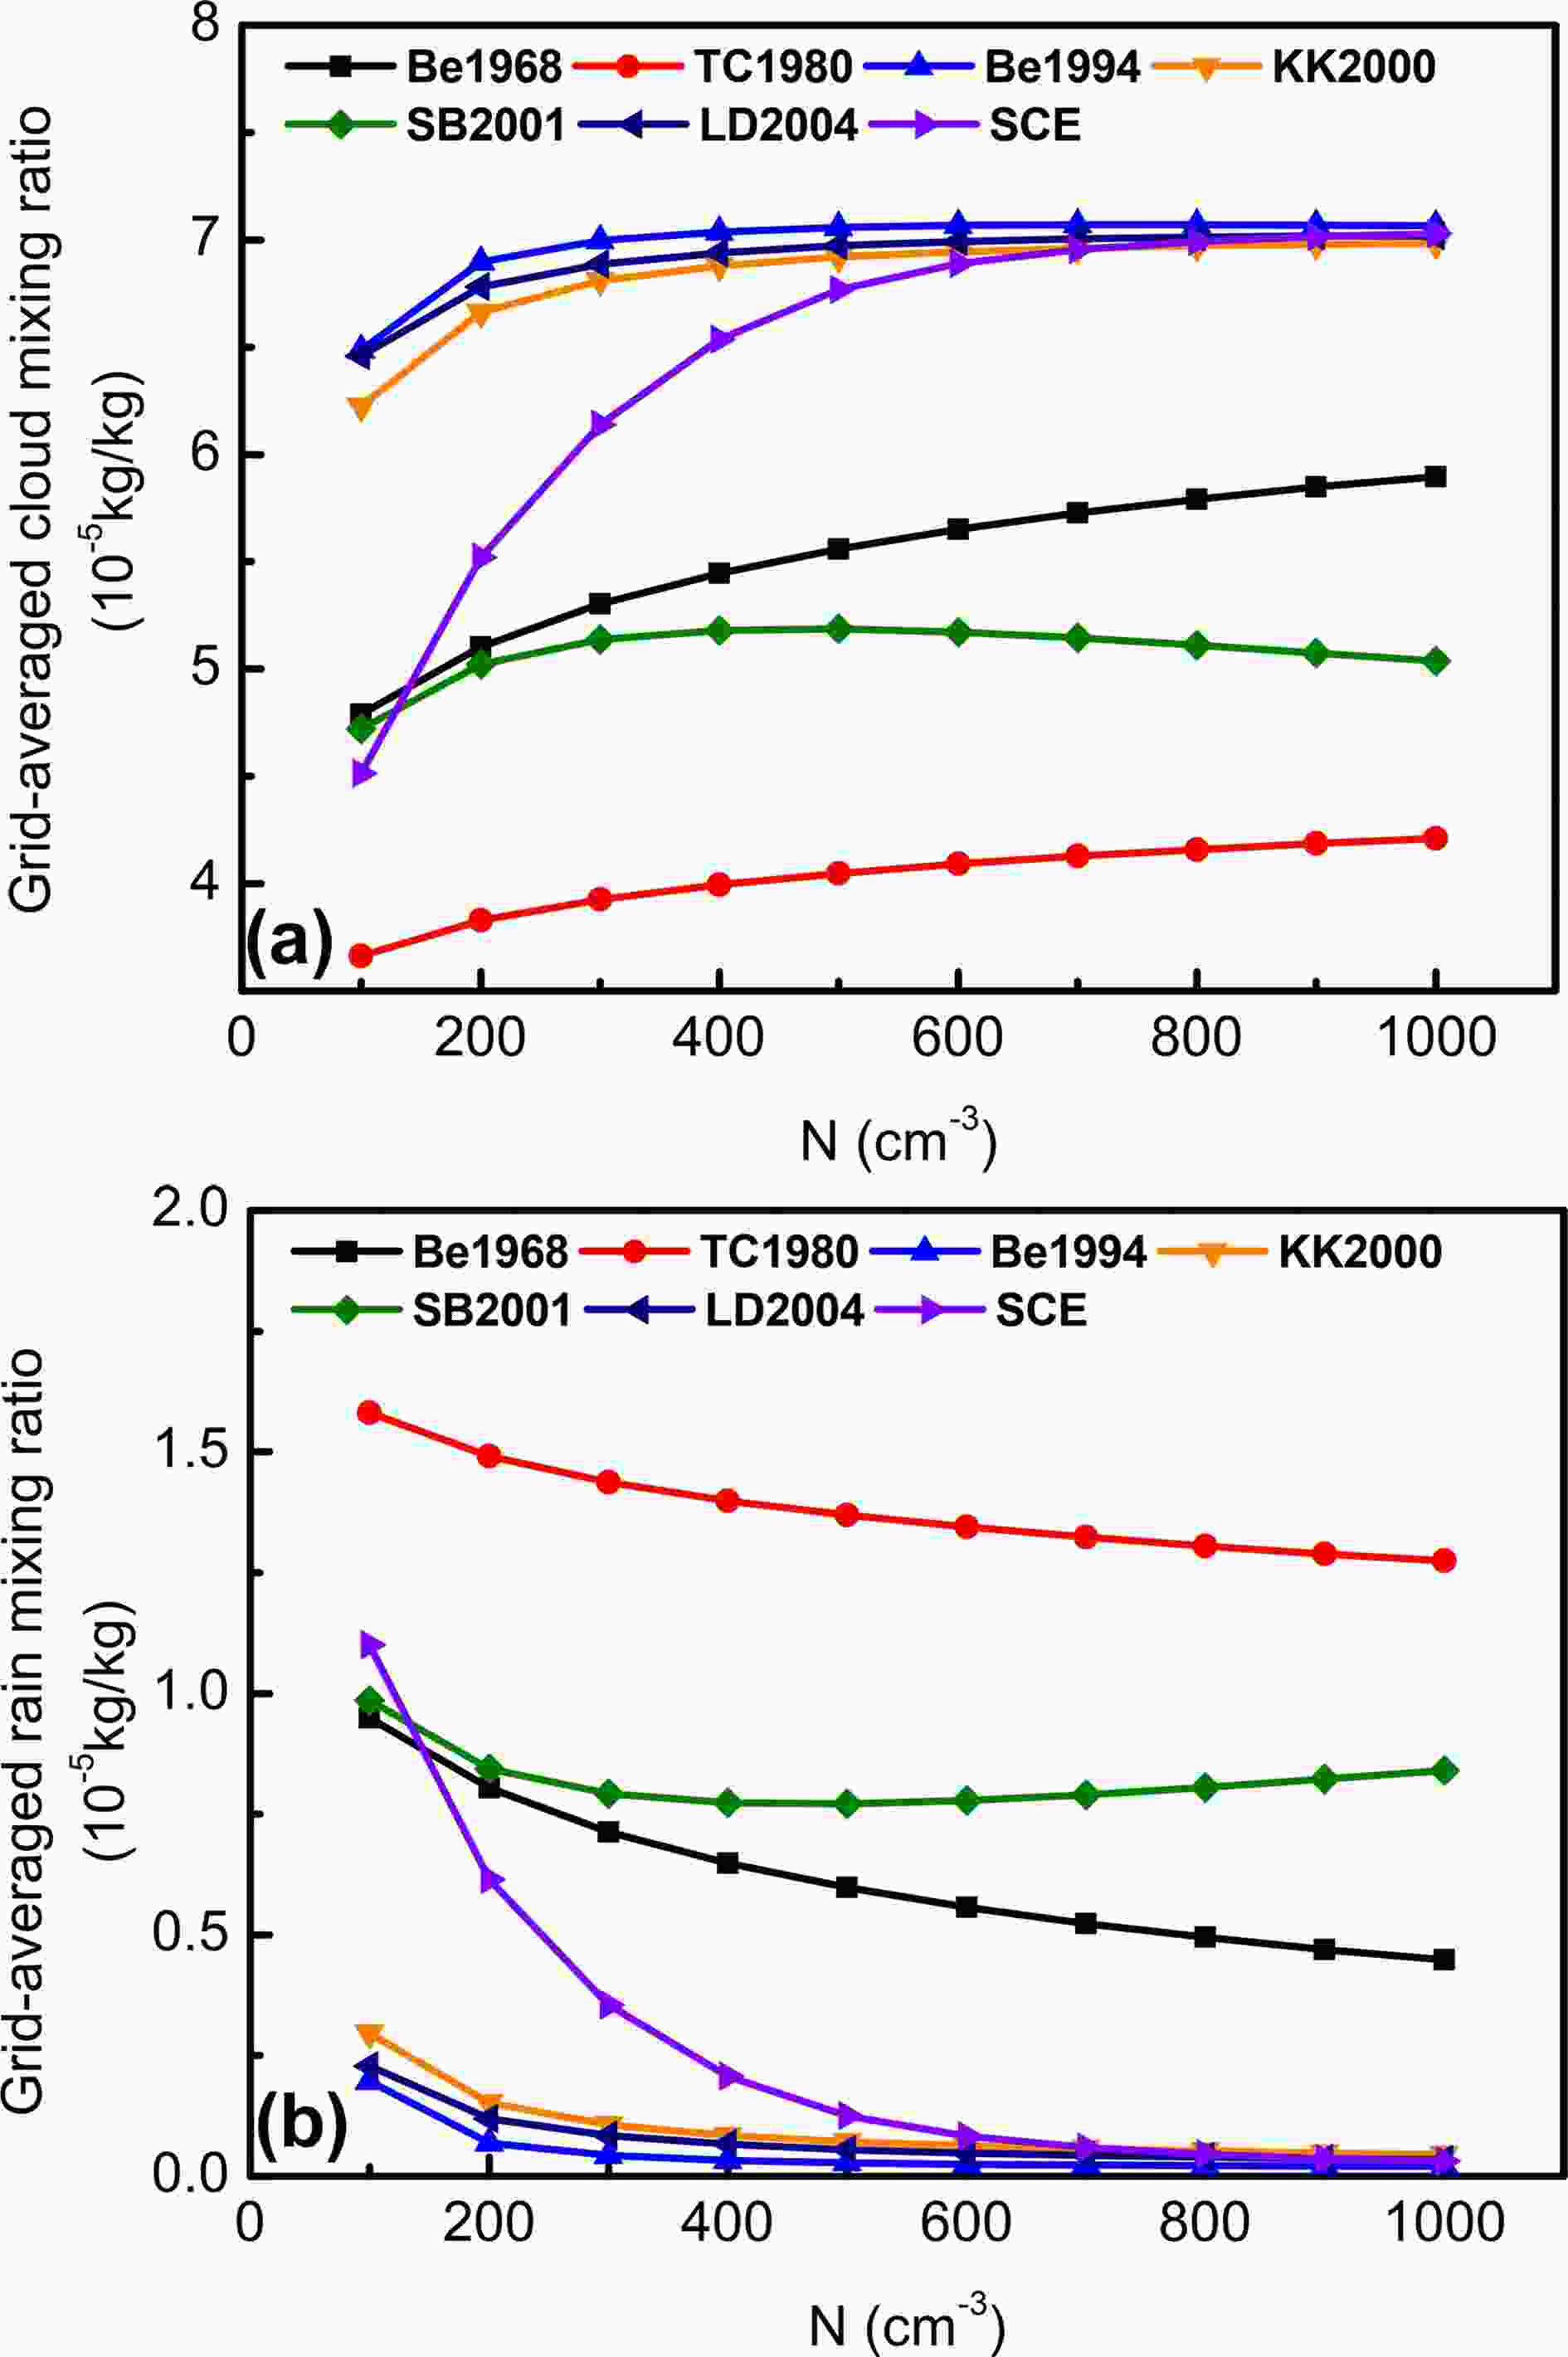 Figure4. Grid-averaged mixing ratio of (a) cloud water and (b) rainwater.
2
3.2. Changes of surface precipitation
The accumulated surface precipitation is shown in Fig. 5. The change of total precipitation to initial droplet concentration is similar to that of rainwater. When N ≤ 400 cm?3, the accumulated precipitation simulated with the Be1994, KK2000, SB2001 and LD2004 schemes (the first category) decreases dramatically, while it changes little under the condition of N ≥ 400 cm?3. For the second category (Be1968 and TC1980), the total precipitation is gradually decreased by about 2.7% per increase in droplets of 100 cm?3 while that in the SCE scheme is decreased by about 9.7%. The spillover, which describes the ratio of the accumulated precipitation on the leeward side to the total accumulated precipitation (Jiang, 2003; Xiao et al., 2014), is used to investigate the distribution of precipitation. In the SCE scheme, the spillover increases firstly and then decreases under the condition of N ≥ 400 cm?3. In the first category, the spillover is mainly decreased with increasing initial droplet concentration. The change of spillover simulated with the SB2001 scheme is similar to that in the SCE scheme, but the extent of variation in the SB2001 scheme is smaller. In the second category, the spillover increases with increasing initial droplet concentration, meaning there is more precipitation moving to the leeward side. Next, the microphysical processes are investigated for deeper analysis.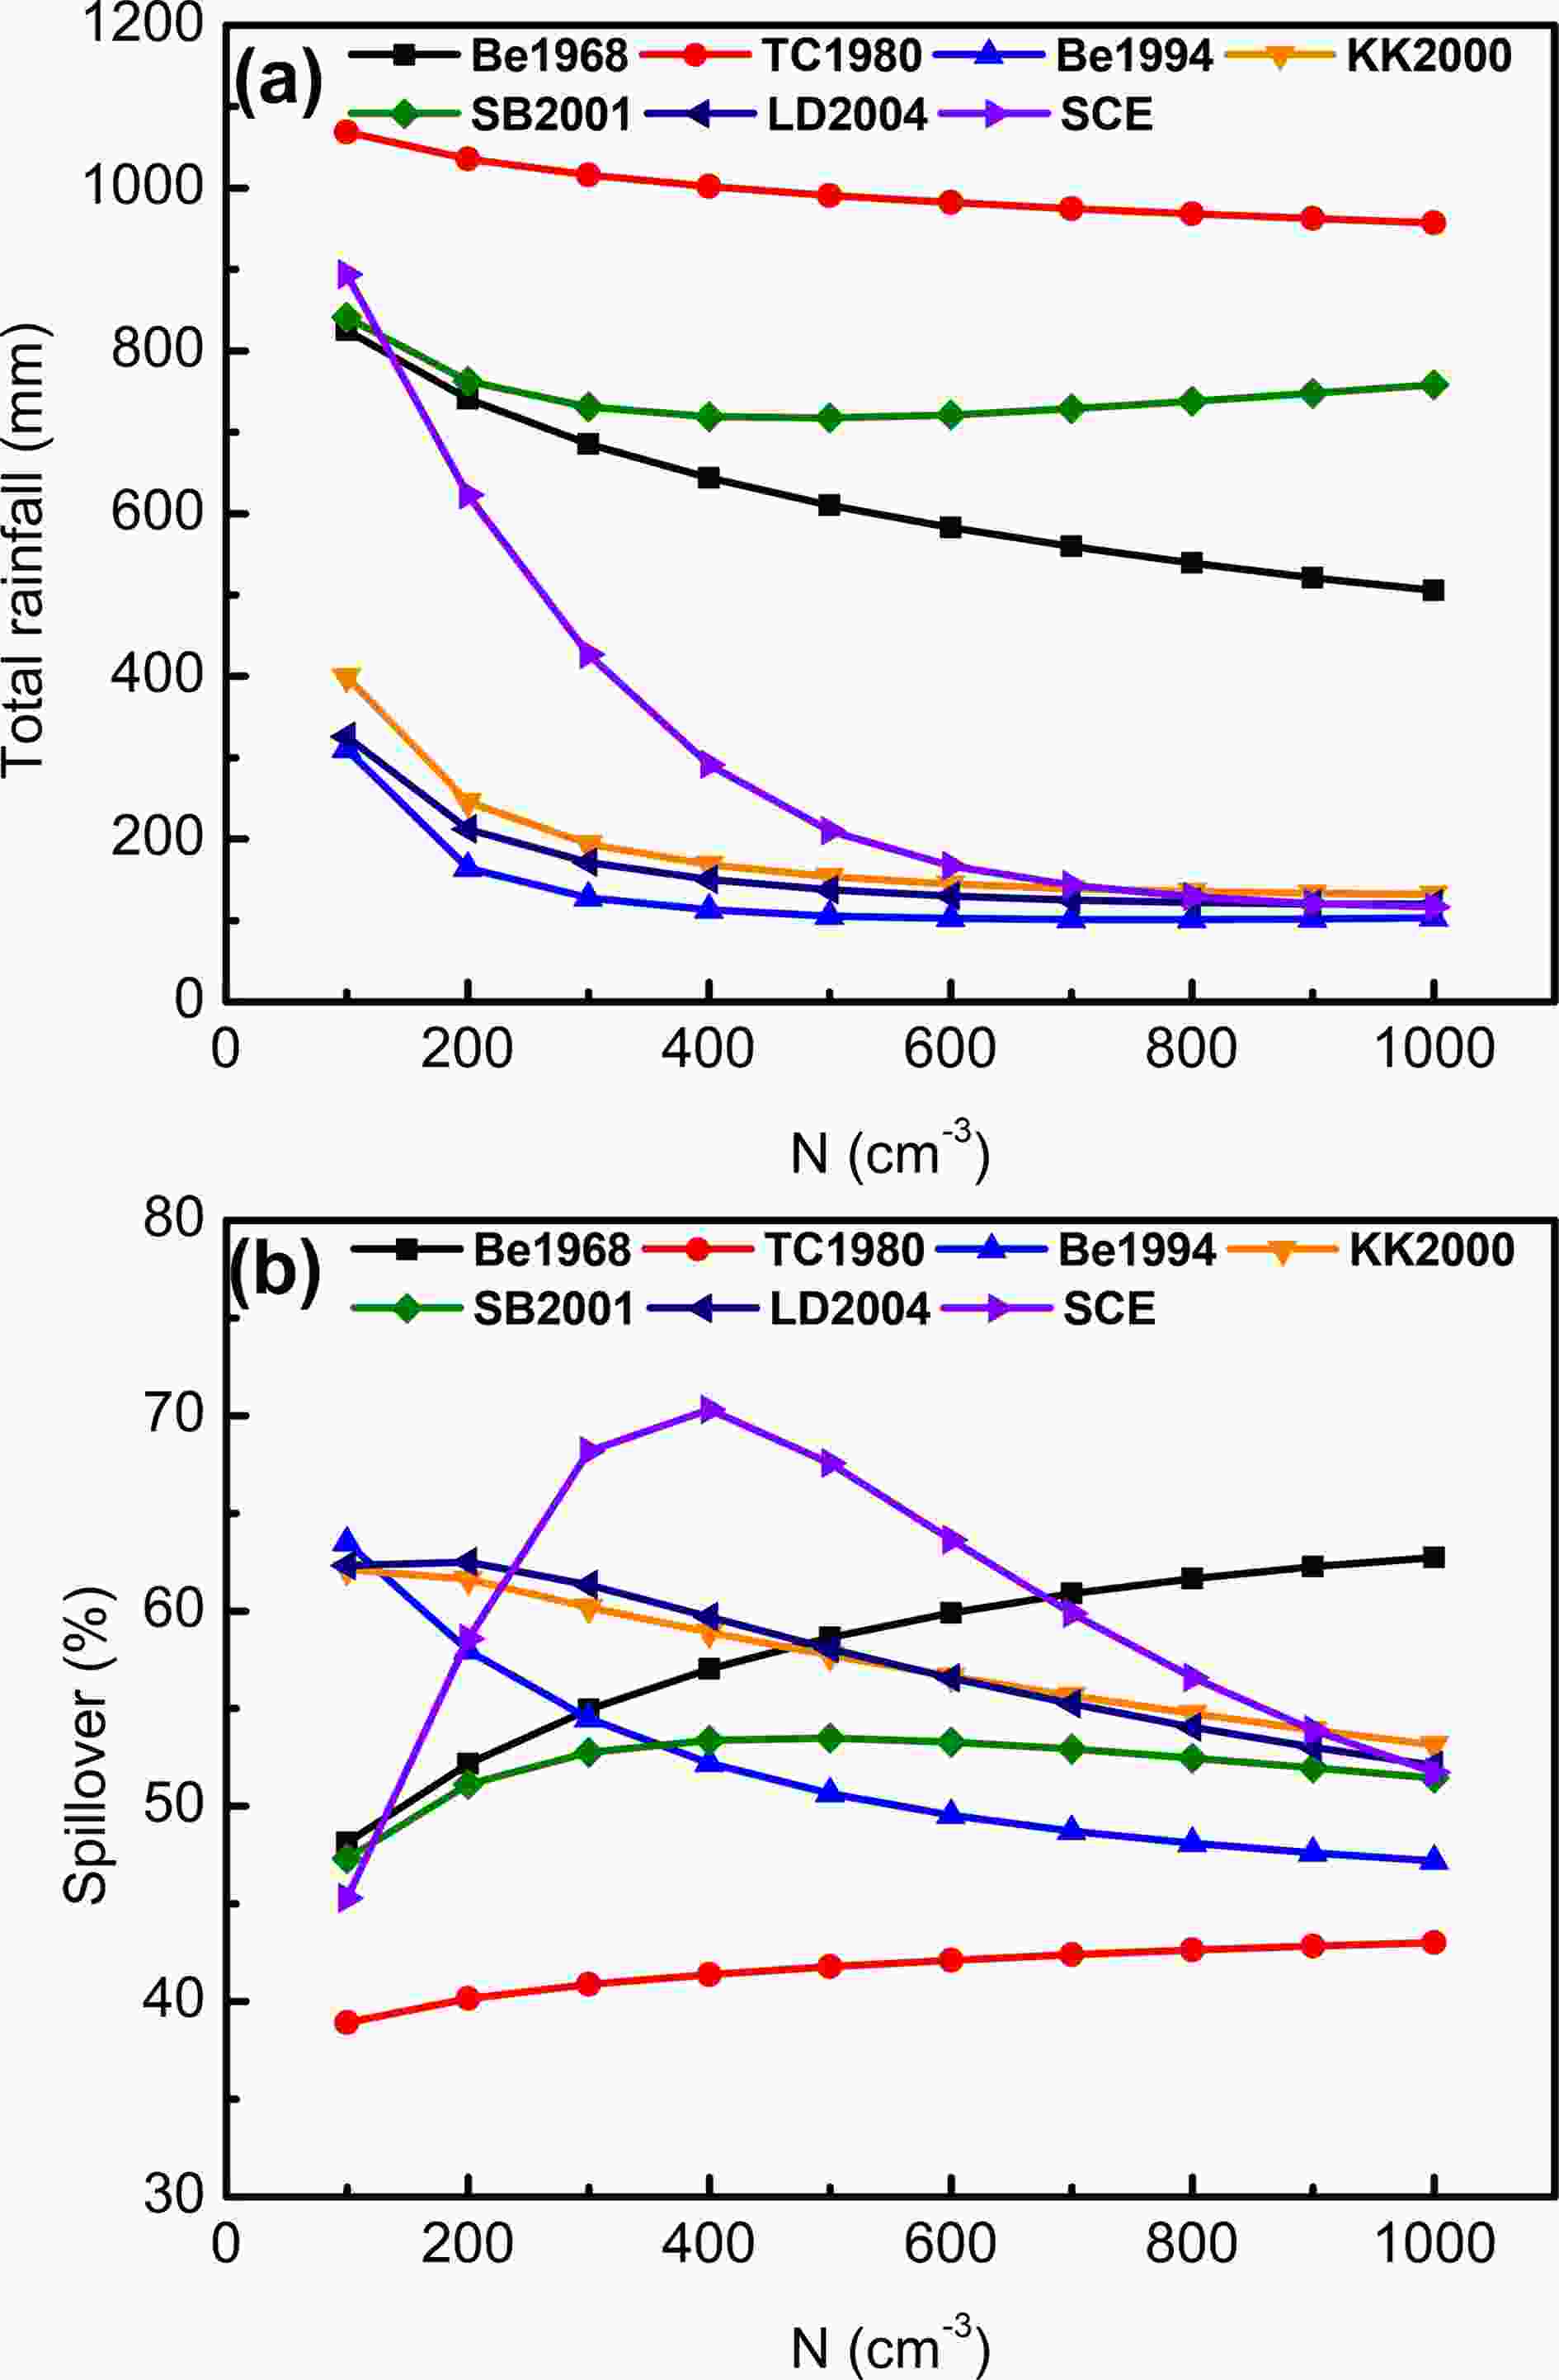 Figure5. Grid-accumulated amount of (a) surface precipitation and (b) spillover (ratio of precipitation on leeward side to total precipitation) after 10 h of simulation.
2
3.3. Microphysical processes
The grid-averaged conversion rates of microphysical processes are shown in Fig. 6. The conversion rate of microphysical processes can influence cloud water and rainwater, and vice versa. Theoretically, the autoconversion rate is influenced by the cloud droplet number concentration and mass concentration, but the conversion rate values simulated with different schemes are remarkably different, even with the same concentration of droplets (Michibata and Takemura, 2015). In the SCE scheme, the grid-averaged autoconversion rate decreases from 2.65 × 10?9 to 8.52 × 10?10 kg kg?1 s?1 under the condition of N = 100 cm?3 changing to N = 1000 cm?3. In the first category of schemes (Be1994, KK2000, and LD2004), the autoconversion rate is significantly decreased with increasing initial droplet concentration, except for the SB2001 scheme. When N ≥ 400 cm?3, the autoconversion rate simulated by the Be1994, KK2000 and LD2004 schemes is lower than 1 × 10?10 kg kg?1 s?1, while that of the SCE scheme is under the condition of N ≥ 600 cm?3. In the second category of schemes (Be1968 and TC1980), the autoconversion rate is slightly decreased with increasing initial droplet concentration, and the value of the rate greatly exceeds that in the Be1994, KK2000 and LD2004 schemes.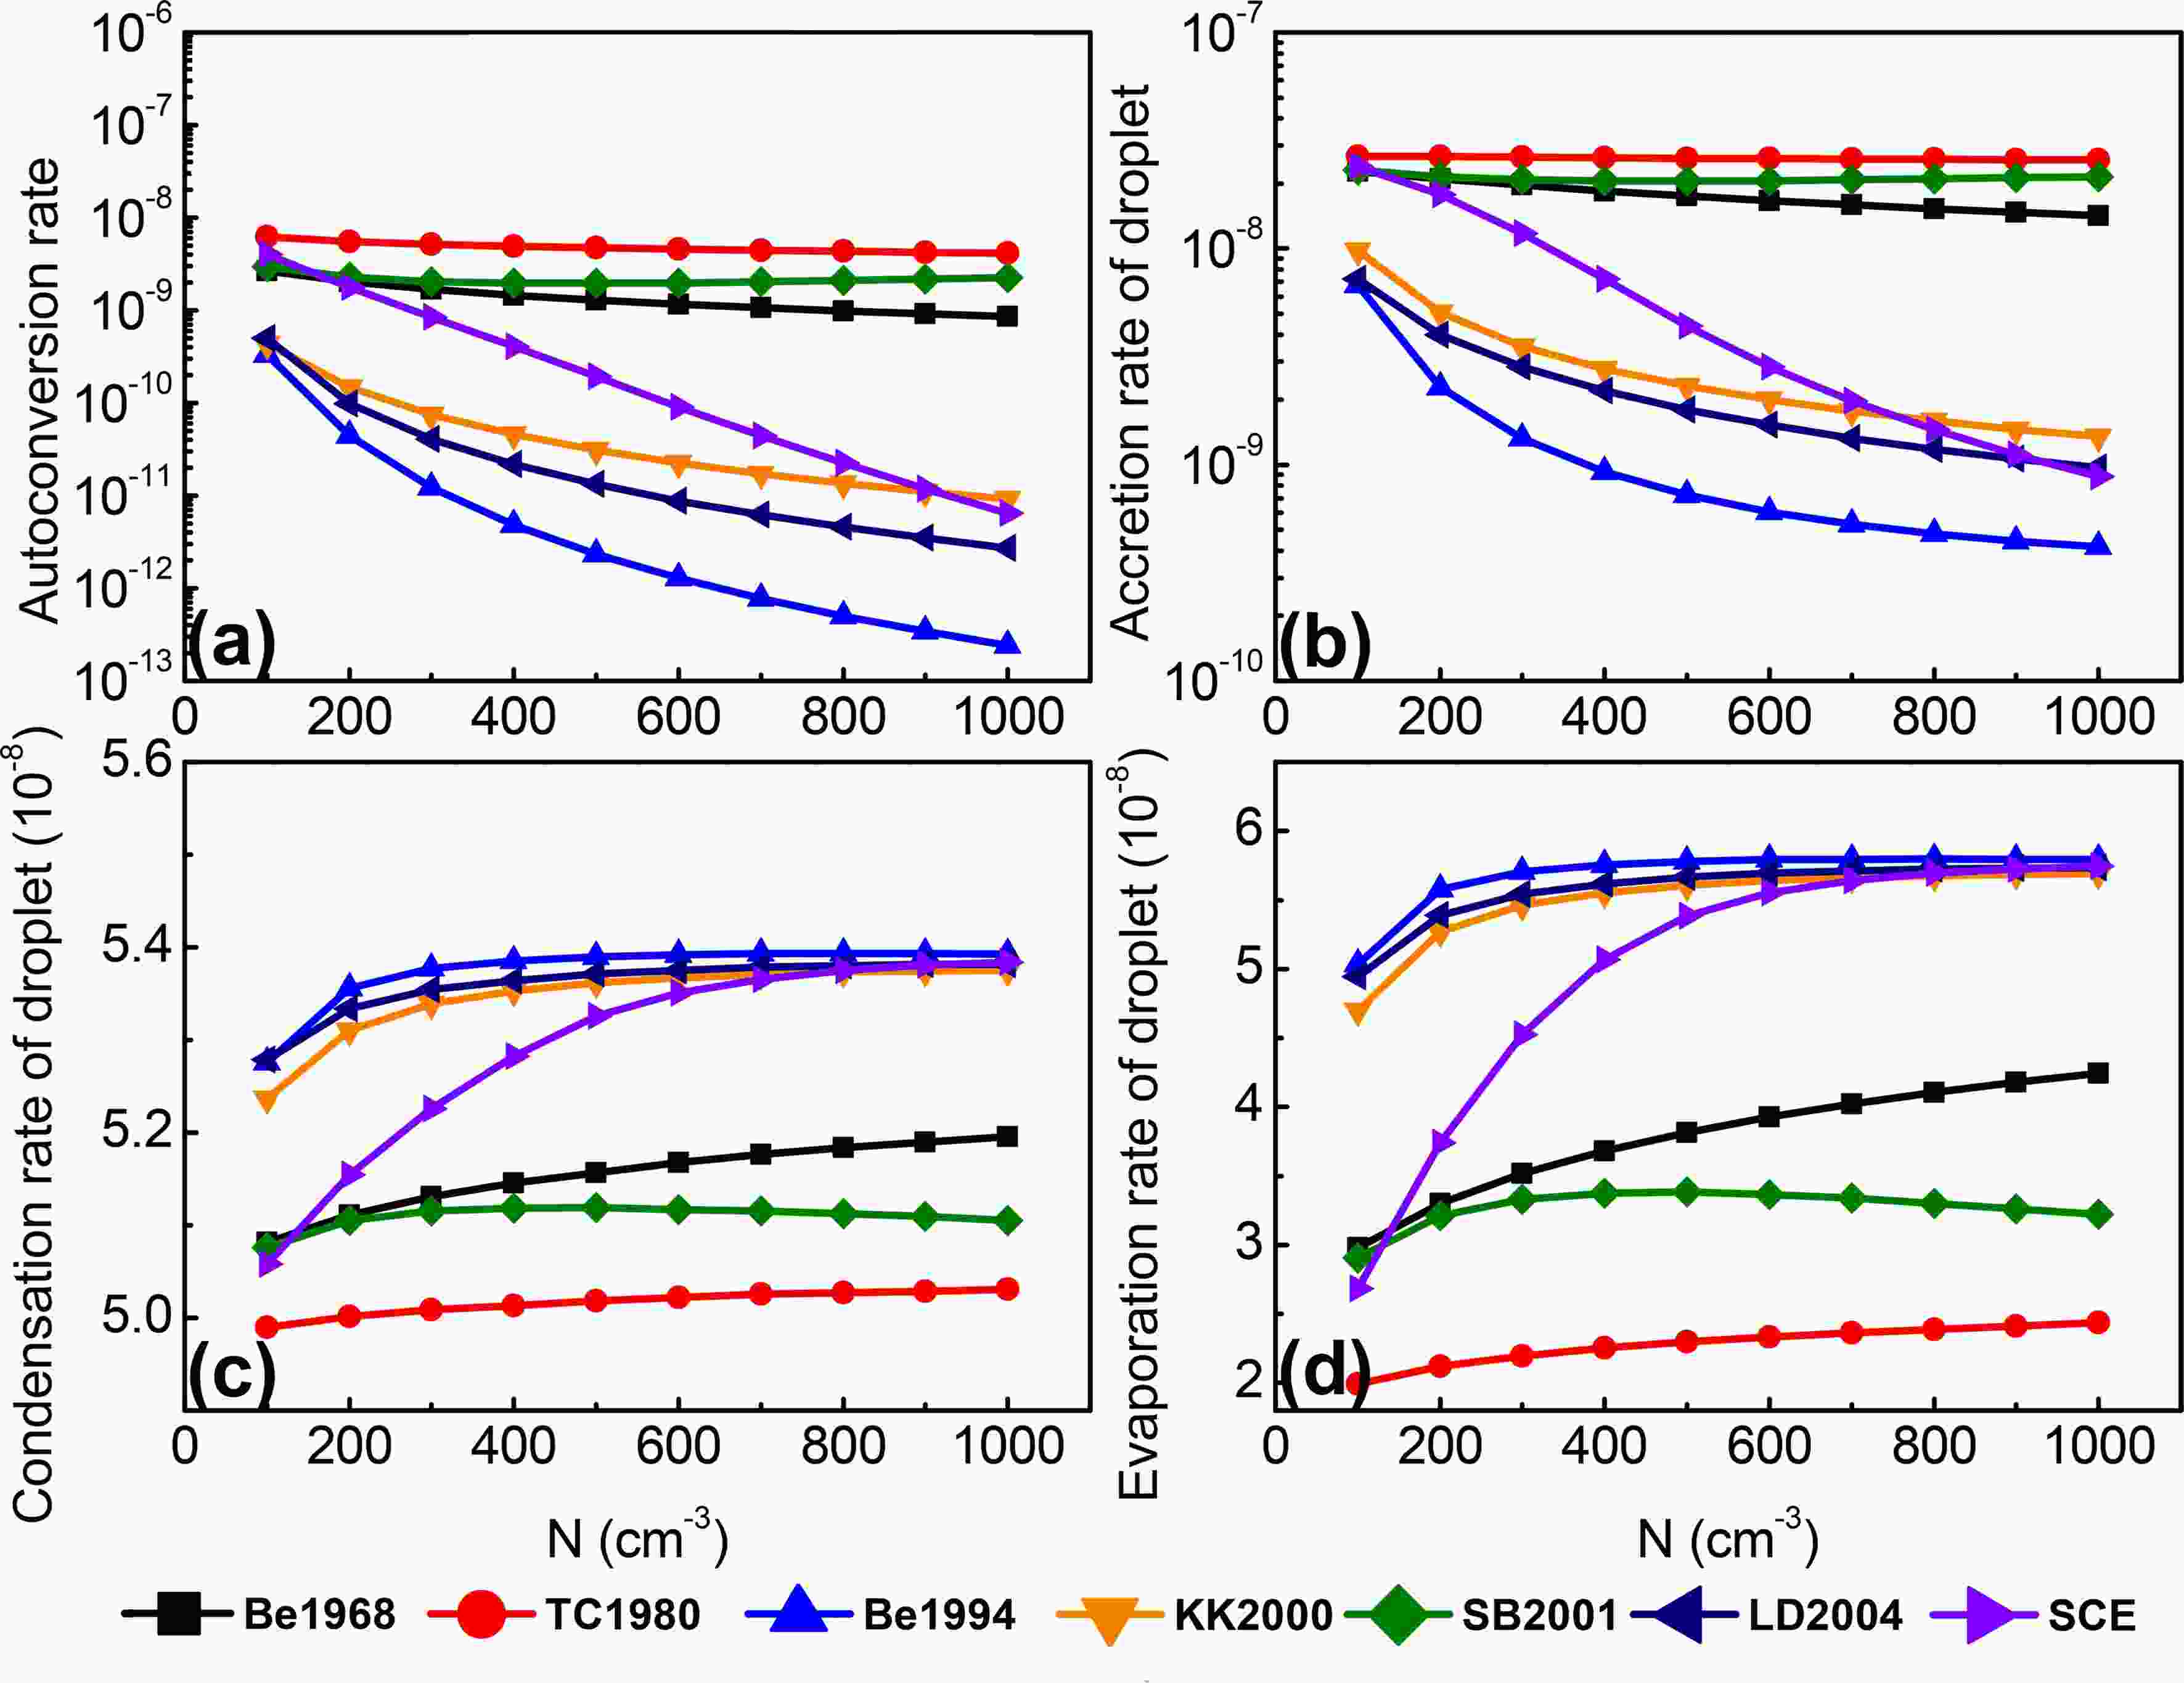 Figure6. Grid-averaged rates of microphysical processes (units: kg kg?1 s?1): (a) autoconversion; (b) accretion of cloud droplets by raindrops; (c) condensation of cloud droplets; (d) evaporation of cloud droplets.
When the autoconversion rate gets low, the formation of raindrops is suppressed, resulting in a lower accretion rate of droplets by raindrops. Hence, the change in the accretion rate of droplets to increasing initial droplet concentration is similar to that of the autoconversion rate. In warm-phase processes, because of low conversion rates of autoconversion and accretion, there will be more cloud droplets suspended in the atmosphere. More cloud droplets will increase the amount of condensation of cloud droplets, and it also increases the amount of evaporation. Therefore, the changes in condensation rate and evaporation rate owing to increasing initial droplet concentration are opposite to those of autoconversion rate, but are similar to the variation of cloud water. Hence, the cloud water in the Be1994, KK2000 and LD2004 schemes is higher than that in the Be1968 and TC1980 schemes.
In Fig. 5, the change in the distribution of surface precipitation owing to increasing initial droplet concentration is different from scheme to scheme. However, the change in the microphysical rate has a similar tendency between different schemes. The autoconversion rate simulated by the Be1994, KK2000 and LD2004 schemes is much lower than that in other schemes, and then the formation of raindrops is delayed, resulting in suppressed total precipitation. Hence, the surface precipitation distribution shifts toward the downwind direction compared to other schemes, leading to higher spillover in these three schemes. As the initial condition changes from N = 100 cm?3 to N = 1000 cm?3, rainwater is decreased with decreasing autoconversion rate, leading to a significant decrease in the precipitation on the leeward side. Because the total surface precipitation is predominantly contributed by the precipitation on the leeward side, the spillover in these three schemes (Be1994, KK2000, and LD2004) is decreased with increasing initial droplet concentration. Moreover, there is low sensitivity of surface precipitation to the initial concentration of cloud droplets in these schemes, due to the low autoconversion rate under the condition of N ≥ 400 cm?3.
In the Be1968 and TC1980 schemes, a higher autoconversion rate benefits the formation of raindrops and the surface precipitation is mainly distributed on the windward slope (Fig. 5b). As the initial droplet concentration is increased, the grid-averaged autoconversion rate is slightly decreased and the conversion of cloud water to rainwater is also efficient, leading to a shift in precipitation (an increase in the spillover). In the SCE scheme, the autoconversion rate is extra sensitive to the initial droplet concentration. Under the condition of a high autoconversion rate (N ≤ 400 cm?3), the surface precipitation moves downwind and the spillover is increased with increasing initial droplet concentration. Under the condition of N ≥ 400 cm?3, a low efficiency in the autoconversion rate results in less rainwater and the surface precipitation is mainly distributed on the leeward side of the mountain. Hence, the increase in cloud droplet concentration suppresses the drop formation, leading to a decrease in the spillover.
Sensitivity tests show that the sensitivities of cloud water, rainwater, surface precipitation, and spillover to the CCN concentration, cloud water is significantly increased while rainwater is decreased by suppressing the drop formation, resulting in a decrease in surface precipitation by about 87%. Interestingly, the spillover (ratio of precipitation on the leeward side to total precipitation) is increased when N ≤ 400 cm?3, and then decreased when N ≥ 400 cm?3. Under the condition of N ≤ 400 cm?3, the distribution of orographic precipitation shifts downstream with increasing CCN due to the delay of rain formation. When N ≥ 400 cm?3, surface precipitation is mainly distributed on the leeward side of the mountain, and increasing the initial cloud droplet concentration leads to a decrease in precipitation on the leeward side, resulting in a decrease in the spillover.
In the other schemes, the variation trends of cloud water and rainwater are similar to those of the SCE scheme. However, the decreased range of surface precipitation induced by increasing initial droplet concentration is smaller than that in the SCE, and so is rainwater. The autoconversion rates calculated from the Be1968, TC1980 and SB2001 schemes are higher than those of the Be1994, KK2000 and LD204 schemes, resulting in more precipitation on the windward slope and lower spillover. Compared with the SCE scheme, the Be1968, TC1980 and SB2001 schemes show similar variations of surface precipitation distribution as the cloud droplet number concentration falls below 400 cm?3. When N ≥ 400 cm?3, the Be1994, KK2000 and LD2004 schemes have the same variation trend of surface precipitation distribution as the SCE scheme. In the Be1968 and TC1980 schemes, the surface precipitation is slightly decreased by 38% and 10%, respectively, and the spillover is increased with increasing droplet concentration, due to the shift in surface precipitation. In the Be1994, KK2000 and LD2004 schemes, the sensitivities of total precipitation to a changed CCN concentration are lower than those in other schemes, especially under the condition of N ≥ 400 cm?3. Moreover, the surface precipitation is mainly distributed on the leeward side of the mountain and it is decreased by suppressing drop formation, leading to a decrease in the spillover. Although the suppression of orographic precipitation by increasing initial droplet concentration can be described under these autoconversion schemes, the decreased range and the surface distribution of orographic precipitation is different from scheme to scheme.
In previous works, comparisons between different microphysical schemes or dynamic frameworks have been conducted to investigate the sensitivity of precipitation to CCN, but the results were dependent on the cases and models employed (Seifert et al, 2006; Morrison and Grabowski, 2007; Muhlbauer et al., 2010; Xie et al., 2015). Autoconversion is a process that describes the initial formation of raindrops from the collision of cloud droplets, and it is important for warm-cloud microphysical processes. In this study, we have evaluated the sensitivity of orographic precipitation to different autoconversion schemes. However, the cloud-rain autoconversion process affects not only warm-cloud microphysical properties but also ice-cloud microphysical properties. The response of ice-cloud microphysical properties to CCN may be different under different schemes. Hence, the impact of CCN on ice-cloud microphysical processes with different autoconversion schemes will be investigated in the future. Moreover, a model’s microphysics scheme is composed of multiple processes, meaning there will be more uncertainties regarding the sensitivity to CCN. Hence, more processes should be investigated separately to study the effect of CCN on orographic precipitation.
Acknowledgements. This study was jointly sponsored by the National Key Basic Research and Development Program of China (Grant No. 2018YFC1505702), the National Natural Science Foundation of China (Grant No. 41705120, 41590873, 41975138), Weather Modification Ability Construction Project of Northwest China (Grant No. ZQC-R18211), and a Guangdong Province Science and Technology Project (Grant No. 2017B020244002). All simulations in this paper were performed using the computational resources of the Guangzhou Institute of Tropical and Marine Meteorology. The model data in this study are available upon request from the authors via xh_8646@163.com or xiaoh@gd121.cn.
