HTML
--> --> -->An alternative method is the ensemble Kalman filter (EnKF), which has enjoyed increasing popularity for convective-scale applications (Dowell et al., 2004, 2011, Putnam et al., 2014). Compared with the variational methods, EnKF has the advantage of explicitly providing the flow-dependent BEC throughout the assimilation cycles, especially for the cross-variable covariances that are valuable for radar DA. However, the problems of rank deficiency or sampling error represent key shortcomings of EnKF, because the ensembles used in radar DA are much smaller than the degrees of freedom of cloud models. A practical approach to overcome this problem is using a hybrid approach that can combine the advantages of the variational and EnKF methods. Such a hybrid approach was first expressed by replacing the BEC of the 3DVar cost function with a linear combination of climatological and ensemble-based contributions (Hamill and Snyder, 2000). The extended control variable method is used in another formulation of the hybrid approach to introduce an ensemble BEC into the variational framework, as documented in Lorenc (2003). Wang et al. (2007) proved these two algorithms are theoretically equivalent; however, the extended control variable method is suitable for easy implementation in existing variational DA systems, which makes it more attractive. The advantages of the hybrid approach were first demonstrated using simulated and realistic observations for large-scale DA, and greater benefits were found in comparison with traditional 3DVar and EnKF methods when the ensemble size was small (Wang et al., 2013; Buehner, 2005; Buehner et al., 2010a, b; Hamill et al., 2011; Zhang and Zhang, 2012).
Motivated by the encouraging results, some recent studies explored the utility of the hybrid approach in providing initial conditions for convection-allowing models (Wang et al., 2013c; Gustafsson et al., 2014; Chen et al., 2020). Schwartz and Liu (2014) and Schwartz (2016) found that continuously cycling hybrid DA outperformed 3DVar and EnKF for most hours in the subsequent forecasts at a 4-km horizontal resolution. Wu et al. (2017) employed the hybrid approach in their operational DA system of Gridpoint Statistical Interpolation to improve the forecast accuracy. In these studies, only conventional observations were used. For radar DA, Gao et al. (2013b) first reported an initial test of a hybrid EnKF-En3DVar in assimilating simulated radar data for an idealized supercell storm. EnKF was found to outperform (underperform) the hybrid EnKF-En3DVar approach in terms of model dynamic variables (hydrometeor state variables). Sensitivity experiments by Gao and Stensrud (2014) demonstrated that this method for small ensembles benefitted from a larger weighting for the static covariance. Recently, Wang et al. (2019) incorporated ensemble covariances derived from a Data Assimilation Research Testbed-ensemble adjustment Kalman filter into 3DEnVar with each radar DA cycle and found that reflectivity and updraft helicity forecasts were improved. In these studies, the EnKF remains an integral part of the hybrid EnKF-3DEnVar approach, which is computationally expensive for radar DA (Gao et al., 2016).
Another type of hybrid approach for calculating BEC is to employ an ensemble of DAs. It unifies the ensemble forecasts and existing variational systems with little modification. Such an ensemble 3DEnVar (E3DA) system was developed and implemented for radar DA by Gao et al. (2016). In this system, instead of running a parallel EnKF, as in other hybrid systems, an ensemble 3DEnVar is run multiple times to provide perturbations. The performance of E3DA was found to be similar to that of systems based on the hybrid EnKF-3DEnVar approach, but with greater efficiency (Gao and Stensrud, 2014). As documented in Buehner et al. (2017) and Lorenc et al. (2017), in comparison with a hybrid EnKF-En3DVar system, E3DA is able to significantly reduce the overall computational cost because the component of the DA procedure for updating the ensemble perturbations can be greatly simplified, e.g., significant reduction in the number of iterations for minimization. However, E3DA has mostly been tested with observing system simulation experiments under the assumption of a perfect prediction model for radar DA, and it remains necessary to examine its performance using real convective cases.
In this study, we developed a new WRF E3DA system to assimilate real radar observations for convective systems that occurred over southern and southeastern China. This system is based on an enhanced WRF 3DVar system that adopts new momentum control variables and includes an indirect radar reflectivity scheme (Barker et al., 2012; Wang et al., 2008a, b, 2013a; Sun et al., 2016).
The remainder of the paper is organized as follows: Section 2 gives the details of the E3DA and WRF 3DVar systems, and then the configurations of the experiments are presented in section 3. Section 4 describes the forecast results, and lastly, conclusions and some further discussion are presented in section 5.
2.1. WRF 3DVar system
The E3DA is implemented within the WRF 3DVar variational framework, as described originally in Gao et al. (2018). The WRF 3DVar applies an incremental formulation (Courtier et al., 1994) to seek a balanced state analysis that can minimize the cost function
where


The control variables used in this study include velocity components


2
2.2. E3DA system
The flow-dependent ensemble BEC is incorporated into the WRF 3DVar system using the extended control variable method (Lorenc, 2003), and the cost function [Eq. (1)] can be written as follows:Here,


Here, vector


For this E3DA method, the radar observations are assimilated using 3DEnVar to update the control forecast, in which the ensemble forecasts are introduced to estimate the flow-dependent BEC. Different from the commonly used hybrid EnKF-3DEnVar systems, our E3DA system runs 3DEnVar multiple times to update the forecast ensemble perturbations.
The E3DA system is implemented as follows: First, model integrations for the length of the analysis cycle are conducted to produce control and ensemble forecasts, in which the ensemble with different initial and boundary conditions is created by adding a group of smooth, random, and Gaussian perturbations (Dowell and Wicker, 2009). The radar observations are assimilated into the control forecast using the ensemble BEC calculated from the ensemble forecasts. Meanwhile, the 3DEnVar is run

The Advanced Research version of the WRF model (version 3.9.1) was used as the convection-allowing cloud model in our experiments. Two-way nested domains with horizontal resolutions of 9 km (161 × 161 × 51) and 3 km (501 × 501 × 51) were adopted. Boundary conditions of the innermost domain were provided by the external domain, and the inner domain provided feedback to the outer domain. Overall, three experiments were conducted. The first experiment did not assimilate radar data (ExpNoDA), and then the other two experiments, using the 3DVar (Exp3DVar) and E3DA (ExpE3DA) approaches, incorporated radar DA. In ExpNoDA, the initial and lateral boundary conditions were obtained from the National Centers for Environmental Prediction Global Forecasting System analysis, and were updated at 6-h intervals. The simulation began at 0000 UTC 5 June 2009 and continued for 16 h. In Exp3DVar, an initial 4.5-h spin-up forecast was performed starting at 0000 UTC 5 June 2009. Radar observations were then assimilated on the inner domain during 0430–0930 UTC at 1-h intervals. Finally, a 6.5-h prediction was conducted using the final analysis.
In ExpE3DA, a 40-member ensemble was created by adding perturbations to the wind components (


For all experiments, the same physics parameterization schemes were used, which included the Yonsei University planetary boundary layer scheme (Hong et al., 2006), Rapid Update Cycle Land surface model (Smirnova et al., 1997), and Thompson microphysical scheme (Thompson et al., 2008). The radar observations were obtained from Hefei radar (HFRD), Nantong radar (NTRD), Nanjing radar (NJRD), and Yancheng radar (YCRD) sites. The observation errors assumed for reflectivity and radial velocity were 3 dBZ and 2 m s?1, respectively. A quality control procedure including despeckling and removal of ground clutter for radar reflectivity and de-aliasing for radial velocity (unfolding; Brewster et al., 2005) were employed before radar DA. A quantitative precipitation estimation product obtained from the National Meteorological Center of China was taken as an observation with which to verify the precipitation forecast of the model (Shen et al., 2014).
To examine the forecast skills of reflectivity and precipitation quantitatively, the Fraction Skill Score (FSS) (Roberts and Lean, 2008) and BIAS (Mittermaie and Roberts, 2010) metrics were applied. The FSS is defined as
where


where a, b and c denote the numbers of hits, false alarms, and misses, respectively. A BIAS value larger (smaller) than 1.0 indicates the forecast reflectivity or precipitation is overestimated (underestimated).
4.1. Reflectivity forecasts
The averaged FSS and BIAS values derived from ExpNoDA, Exp3DVar and ExpE3DA for the thresholds of 25, 35 and 45 dBZ over the entire domain are shown in Fig. 1. The FSS generally deceases with time in all experiments and the highest scores are at the threshold of 25 dBZ. The FSS values for the threshold of 45 dBZ decline quickly, indicating a less skillful forecast for very intense reflectivity cores. When compared with ExpNoDA, the radar DA experiments result in improved FSS values for all thresholds over the entire forecast period. In both Exp3DVar and ExpE3DA, the improvements are most evident between t = 3.5–4 h and t = 0.5 h for the thresholds of 25 and 45 dBZ. In addition, the FSS values of ExpE3DA are consistently higher than those of Exp3DVar at all forecast periods, and the differences are larger for the 25 and 35 dBZ thresholds in the final 2 h. Meanwhile, as shown in Figs. 1d–f, ExpNoDA has the smallest BIAS for all thresholds, indicating underestimation of the reflectivity. In Exp3DVar, the underestimation is reduced with the BIAS closer to 1.0 at the threshold of 25 dBZ. For the thresholds of 25 and 35 dBZ, ExpE3DA has the highest BIAS scores (closest to 1.0) at the initial time, and these are maintained throughout the forecast period. For the threshold of 45 dBZ, the BIAS is smaller than 1.0 in all experiments, and ExpE3DA has the largest BIAS at all forecast periods. Figure1. The (a–c) FSS and (d–f) BIAS of the ExpNoDA (dashed gray curve), Exp3DVar (solid gray curve) and ExpE3DA (solid black curve) experiments for reflectivity thresholds of 25, 35 and 45 dBZ. The x-axis is the time starting at 0930 UTC 5 June 2009.
The 2-h reflectivity forecasts from each of the above three experiments at 1130 UTC 5 June 2009 are shown in Fig. 2. At 1130 UTC, a strong convective cluster was initialized in Anhui and a well-organized bow echo was evident in observation (Fig. 2a). ExpNoDA mainly forecasts a weak bow echo and misses the convective cluster in Anhui, resulting in large underestimation of reflectivity exceeding 35 dBZ. Exp3DVar captures the general appearance of the bow-shaped echo, although it extends too broadly in the northeastern direction. Similar bow echo features are also found in ExpE3DA but with a stronger reflectivity center collocated with the observation. In addition, ExpE3DA is able to capture moderate–intense reflectivity around the border of Jiangsu and Anhui and in southern Jiangsu, whereas the same convection is scattered in Exp3DVar. For the vertical cross section of reflectivity (Fig. 3), the observation shows an extensive strong convective system of 500 km in length and extending over a vertical range of 15 km, as well as some separate convections ahead of it. These features are not captured in ExpNoDA, except for some narrow and weak cells at the range of 150–300 km. Exp3DVar yields slight improvements over ExpNoDA, manifest as a large increase in the areal coverage of reflectivity smaller than 45 dBZ. In the region of 50–300 km, ExpE3DA forecasts a well-organized convective system that closely matches the observed reflectivity exceeding 30 dBZ, although with some underestimation of the high reflectivity above 45 dBZ. ExpE3DA also outperforms both ExpNoDA and Exp3DVar by producing more convection in the region of 300–500 km.
 Figure2. Radar reflectivity (units: dBZ) from (a) observation, (b) ExpNoDA, (c) Exp3DVar and (d) ExpE3DA at 1130 UTC 5 June 2009.
 Figure3. Vertical cross sections of the radar reflectivity (units: dBZ) along line AB in Fig. 2a from (a) observation, (b) ExpNoDA, (c) Exp3DVar and (d) ExpE3DA at 1130 UTC 5 June 2009.
2
4.2. Radial velocity forecasts
The averaged root-mean-square errors (RMSEs) of the forecast radial velocity for the three experiments verified against the radar observations are shown in Fig. 4a. It is found that Exp3DVar consistently and significantly outperforms ExpNoDA at all forecast hours, with an RMSE reduction of 1.2–2.5 m s?1. ExpE3DA further reduces the RMSE relative to Exp3DVar by 25%–35%, sufficient to ensure the best performance among the experiments during the entire forecast period. The smaller RMSE in ExpE3DA in comparison with both ExpNoDA and Exp3DVar suggests superiority of E3DA in predicting radial velocity. Figure4. (a) RMSEs for radial velocity (units: m s?1) against the radar observations (the x-axis is the time starting at 0930 UTC 5 June 2009), and (b–e) the radial velocity (units: m s?1) from (b) observation, (c) ExpNoDA, (d) Exp3DVar and (e) ExpE3DA at the 0.5° elevation angle from HFRD at 1300 UTC 5 June 2009.
The radial velocity at 0.5° elevation angle from HFRD and the corresponding 3.5-h forecast radial velocity from the three experiments at 1300 UTC 5 June 2009 are presented in Figs. 4b–e. A strong eastern surface wind with peak radial velocity exceeding 24 m s?1 is clearly visible in central Anhui in the observation (Fig. 4a). This feature is not captured in ExpNoDA and the wind speed is clearly weaker. Instead, a southwestern wind is incorrectly forecast in central Anhui. In Exp3DVar, the negative radial velocity is maintained better to the east of HFRD, while the positive velocity is absent to the west of HFRD. ExpE3DA successfully forecasts the positive and negative velocity structures with a maximum wind speed of 22 m s?1 that is similar to the observation. These results indicate the importance of radar DA using E3DA in this case for capturing important circulation features that lead to surface radial velocity intensification during the forecast.
2
4.3. Precipitation forecasts
Quantitative verification was also performed for the hourly precipitation forecast. Figure 5 presents the averaged FSS and BIAS of the three experiments at precipitation thresholds of 1, 2.5 and 5 mm. In Figs. 5a–c, it can be seen that Exp3DVar results in higher FSS values than ExpNoDA during the 6-h forecast period, particularly for the threshold of 1.0 mm at t = 2 h and for the threshold of 2.5 mm during the final 2 h. ExpE3DA further improves the forecast skill in comparison with Exp3DVar, increasing the FSS by 0.1 on average for all thresholds. The FSS differences between ExpE3DA and Exp3DVar are smaller than that between Exp3DVar and ExpNoDA, except for the threshold of 2.5 mm in the first 4 h. The BIAS (Figs. 5d–f) indicates that ExpNoDA largely underpredicts the rainfall, with the lowest BIAS values smaller than 1.0, especially for the threshold of 5.0 mm. The dry bias values are reduced by Exp3DVar and their differences can be as large as 0.35 for the threshold of 1.0 mm during the first 3 h. For all thresholds, the highest BIAS values from ExpE3DA are closer to 1.0 than from Exp3DVar, with average BIAS enhancement of 0.2–0.4.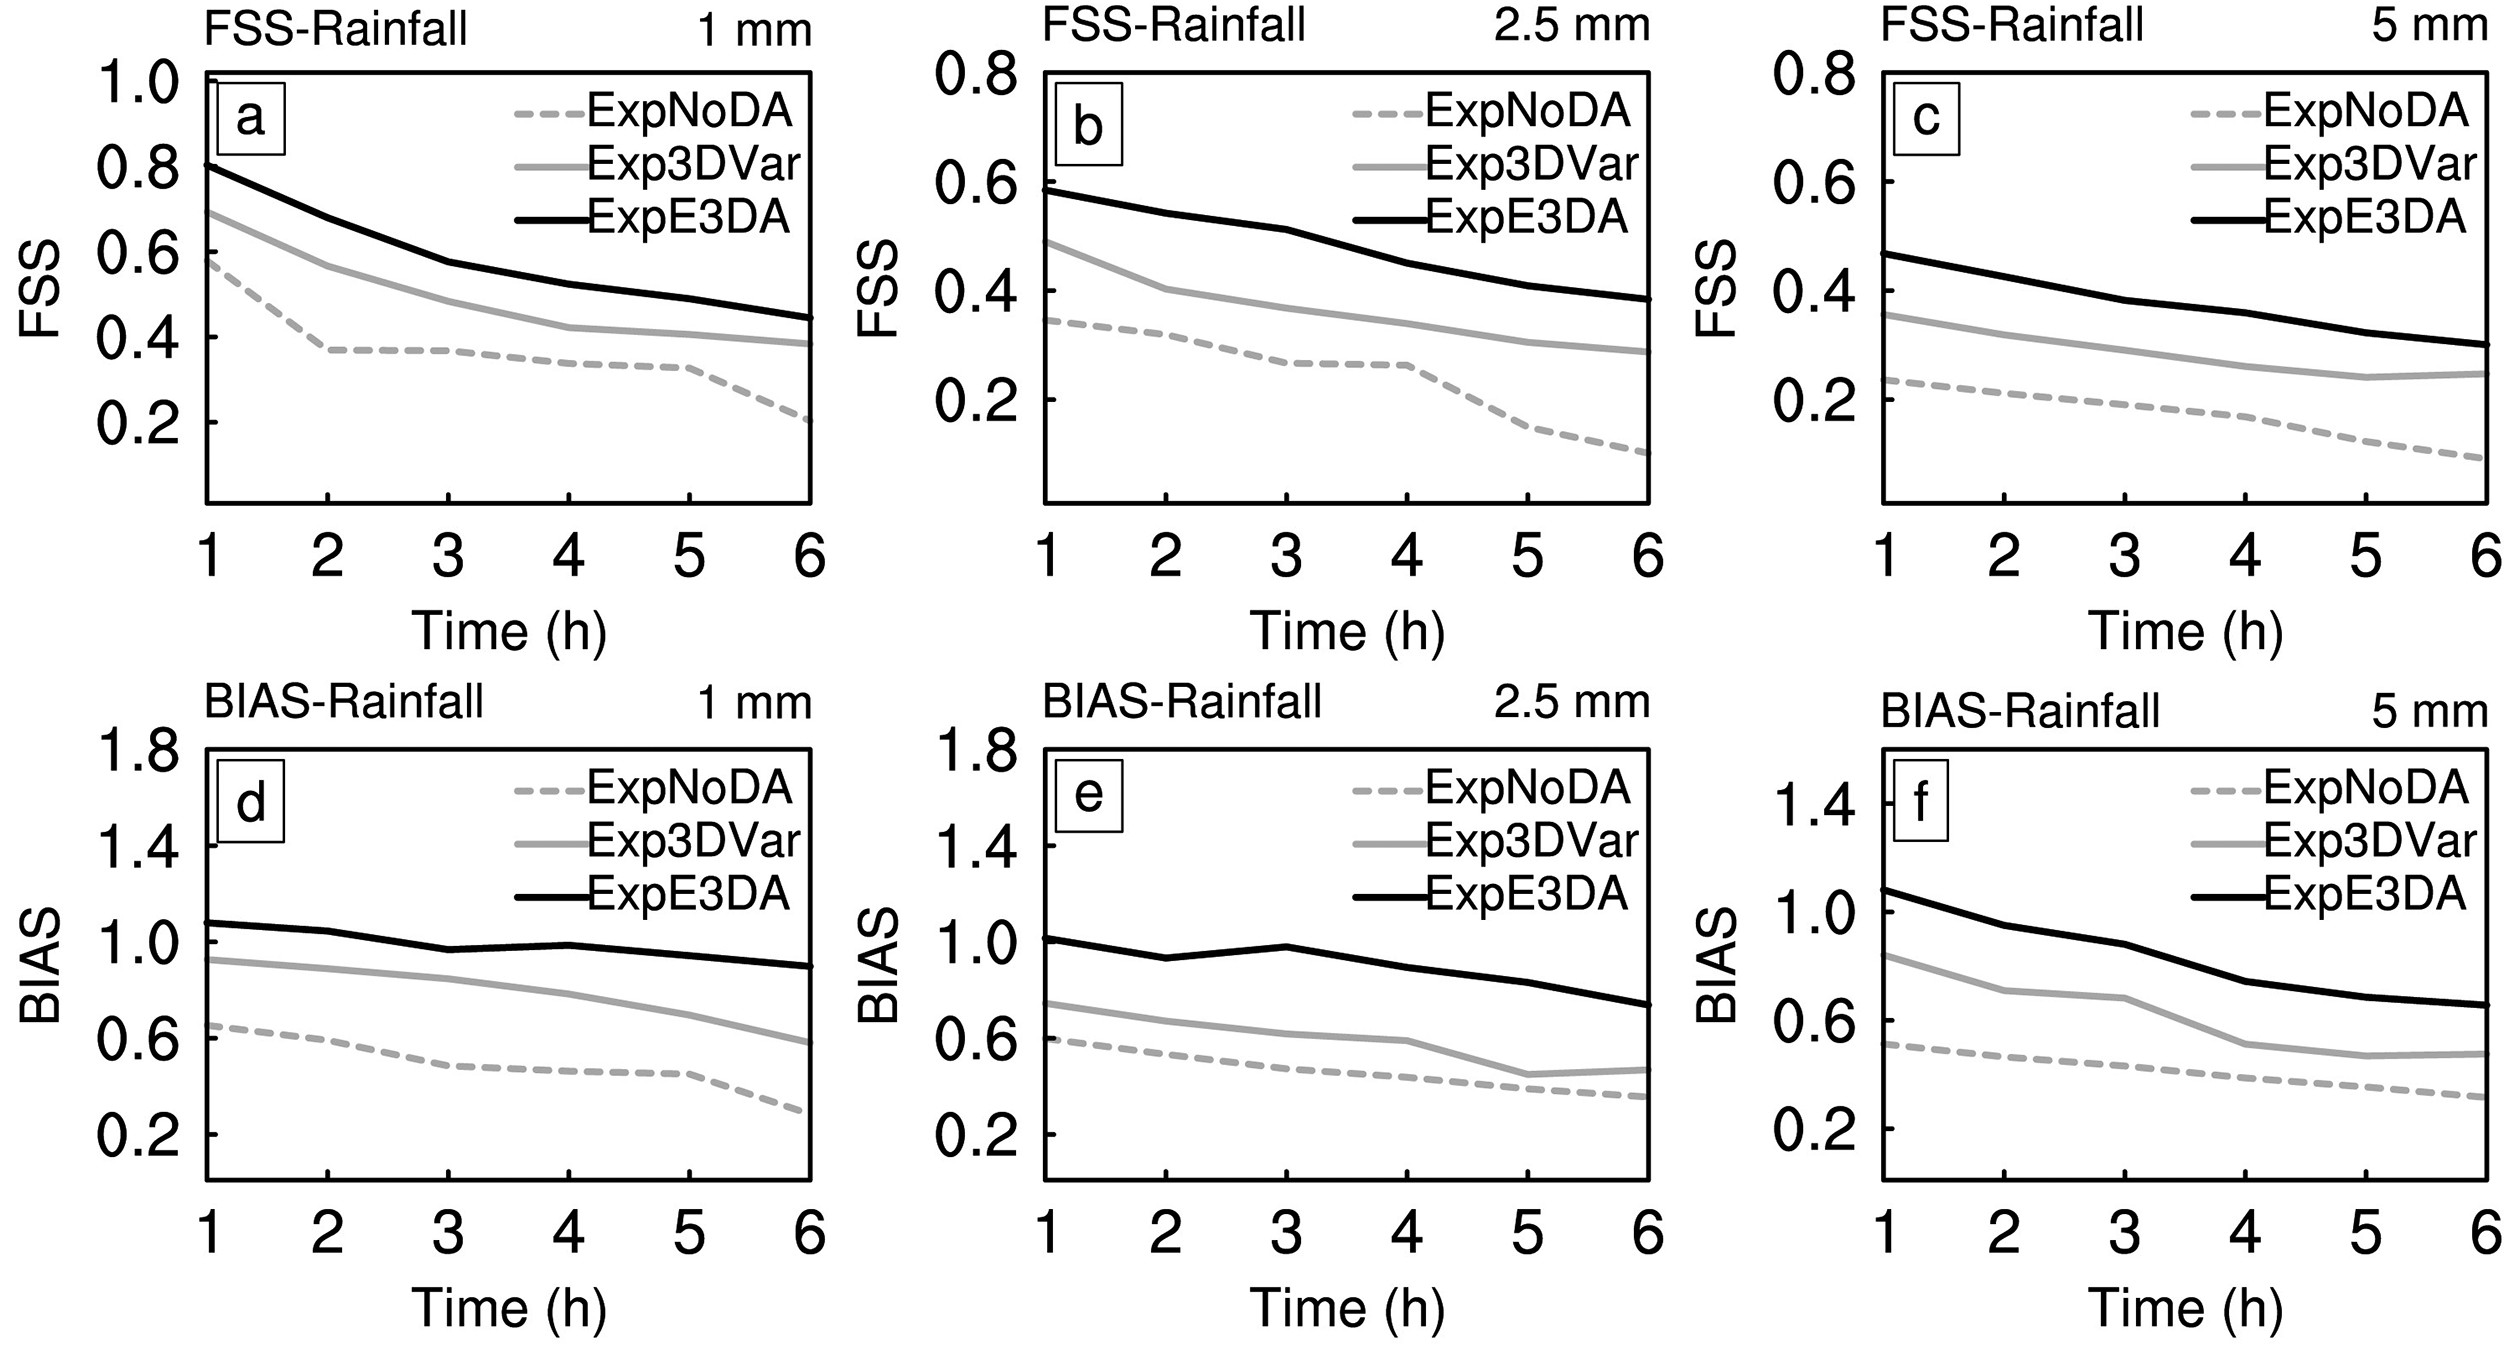 Figure5. The (a–c) FSS and (d–f) BIAS of the ExpNoDA (dashed gray curve), Exp3DVar (solid gray curve) and ExpE3DA (solid black curve) experiments for precipitation thresholds of 1, 2.5 and 5 mm. The x-axis is the time starting at 1000 UTC 5 June 2009.
The 6-h accumulated precipitation forecast patterns from the observations and the three experiments starting from 1000 UTC are shown in Fig. 6. The observed precipitation is characterized by two major rainbands covering northern Zhejiang and large parts of Anhui and Jiangsu with a maximum value of 12.8 mm (Fig. 6a). ExpNoDA fails to distinguish these two organized rainbands, producing scattered precipitation over the entire region. Again, both Exp3DVar and ExpE3DA show more skillful precipitation forecasts, indicating that radar DA is effective for producing satisfactory initial representation of the storm. Exp3DVar captures the bow-shaped rainband well but with some dry bias values of 1.6–4.8 mm. It also largely underpredicts the rainband in Anhui and western Jiangsu and overpredicts the precipitation intensity in central Jiangsu. In contrast, ExpE3DA realistically reproduces the two rainband features in terms of intensity and spatial extent, and it has greatly reduced dry biases in comparison with Exp3DVar.
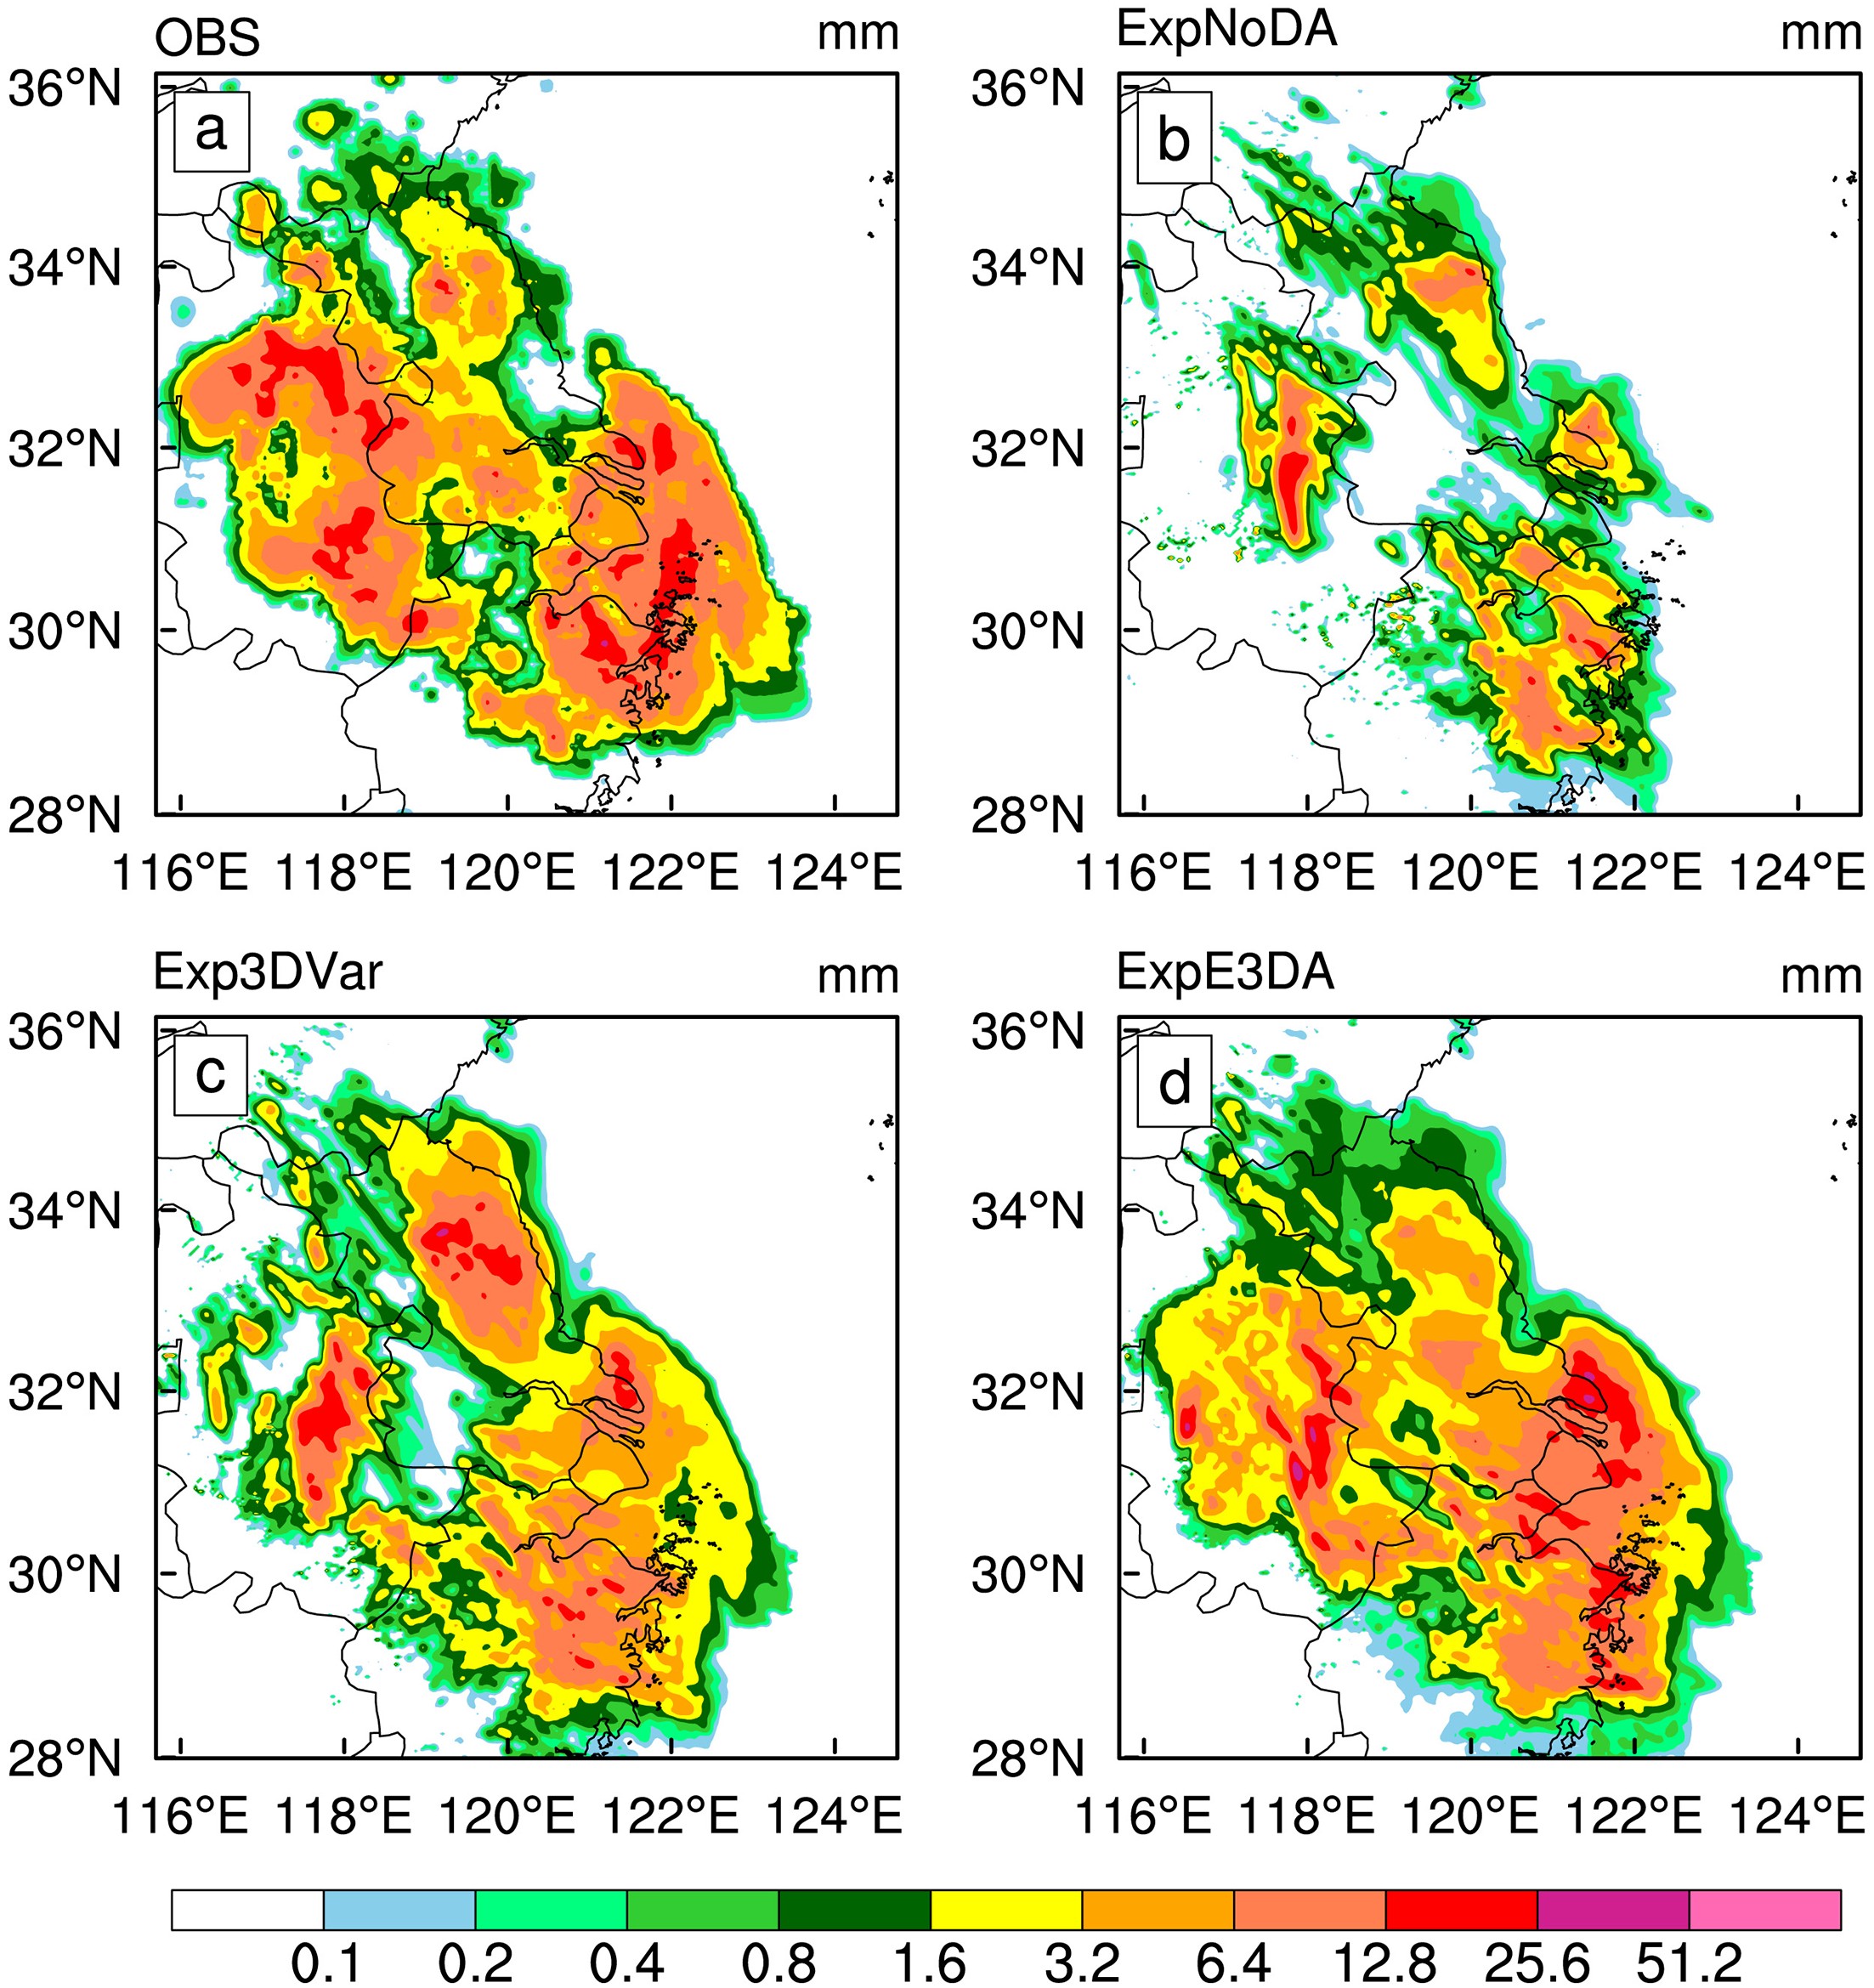 Figure6. Six-hour accumulated precipitation (units: mm) from (a) observation, (b) ExpNoDA, (c) Exp3DVar and (d) ExpE3DA initiated at 1000 UTC 5 June 2009.
2
4.4. Wind, temperature and humidity forecasts
The domain-averaged RMSEs of the horizontal wind components, temperature, and water vapor forecasts against radiosonde and surface METAR observations in the inner 3-km domain are presented in Fig. 7. As shown in Figs. 7a–d, ExpE3DA significantly outperforms ExpNoDA, and it is generally better than Exp3DVar for all variables, except in the upper levels where the errors are similar. Water vapor appears to have the largest error reduction from ExpE3DA compared with Exp3DVar and ExpNoDA between 350 and 700 hPa. The reductions for wind and temperature are smaller but are evident in the low and middle levels. In comparison with the RMSEs against the surface observations, the errors of ExpE3DA are the lowest, while the errors of ExpNoDA are the greatest and worse than those of Exp3DVar for all variables.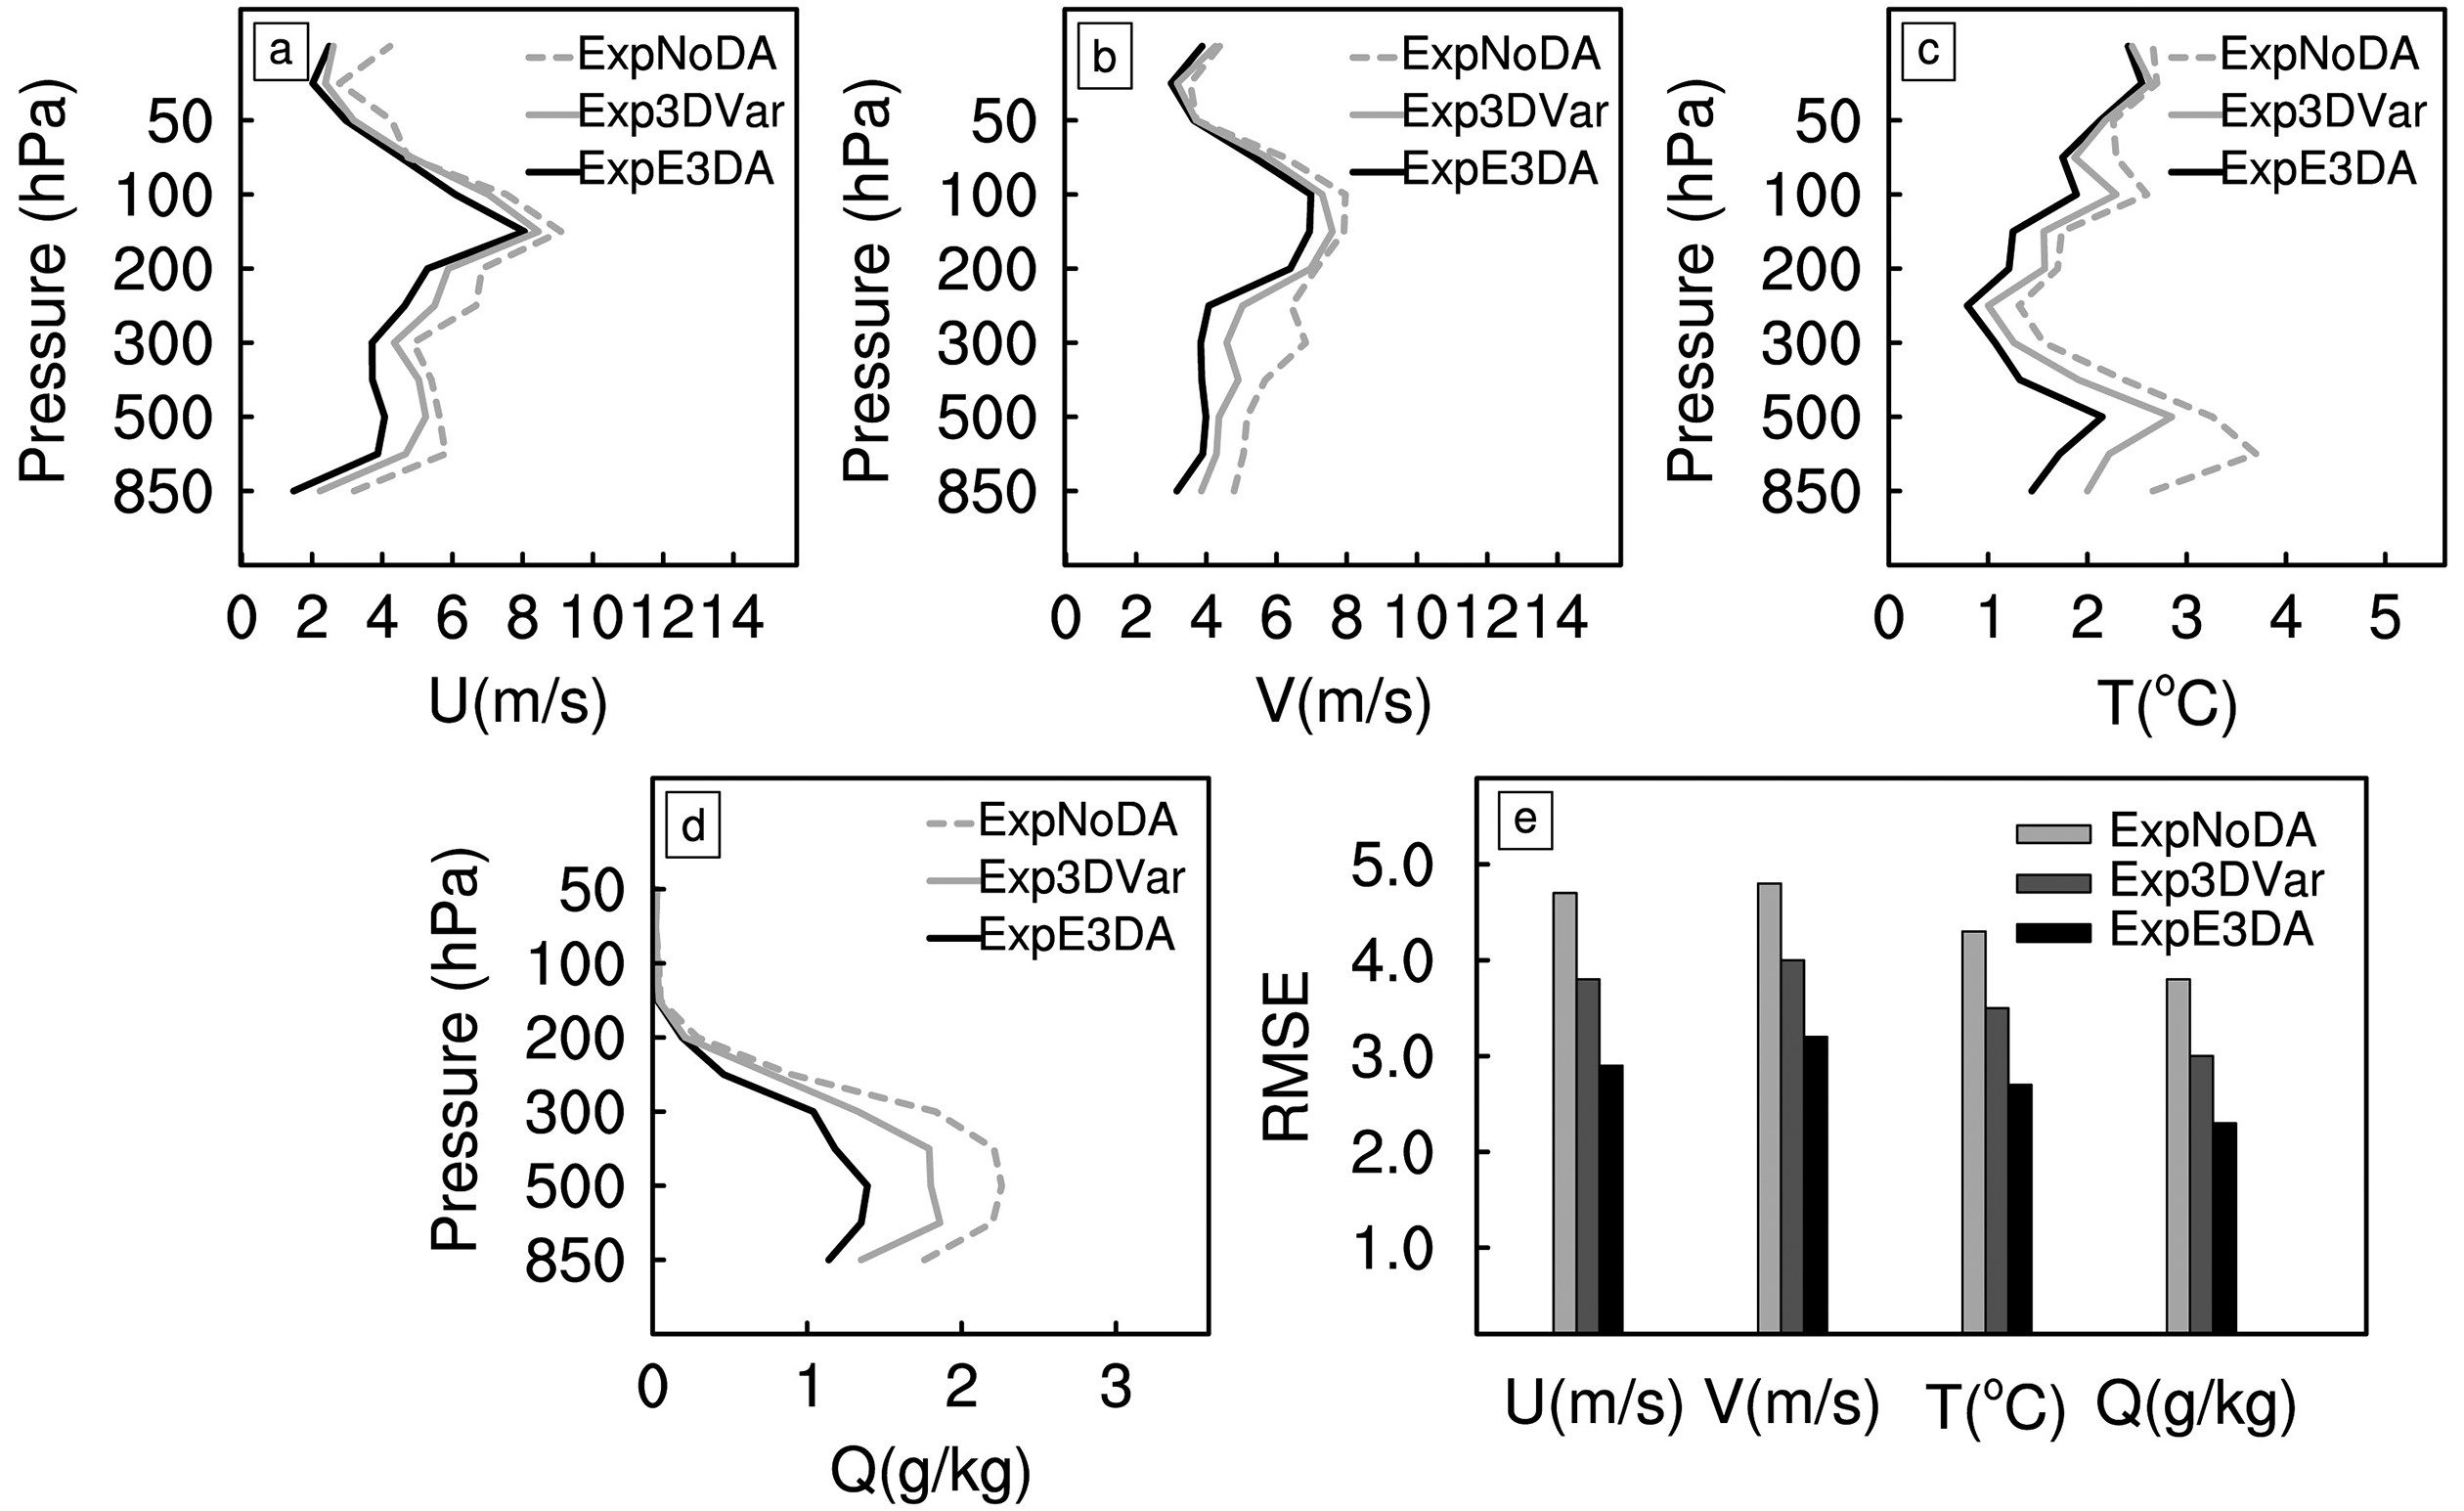 Figure7. Averaged RMSEs of the forecast from ExpNoDA, Exp3DVar and ExpE3DA against all the (a–d) radiosondes and (e) METAR stations in the 3-km domain for the

To reveal the reasons for the improved forecast, diagnosis of the analysis fields was performed. Figure 8 presents the vertical cross sections of first-guess and analyzed radar reflectivity and relative humidity, and vertical velocity and temperature during the fifth assimilation cycles along the line from (33.6°N, 117.5°E) to (31.7°N, 120.6°E). It can be seen that both Exp3DVar and ExpE3DA are able to increase reflectivity associated with the convections at x = 100 and 300 km (Figs. 8a–d). ExpE3DA also adjusts other fields, such as vertical velocity, temperature and humidity, to create a stronger updraft, warmer and more saturated environment corresponding to the added reflectivity (Figs. 8c and d, 8g and h). The temperature and vertical velocity in ExpE3DA can be increased by 3°C and 4 m s?1, respectively. However, the added reflectivity of Exp3DVar shown in Figs. 8a and b does not correspond to these adjustments. Further examination reveals that both experiments perform similarly for the other assimilation cycles (figure not shown). This indicates that ExpE3DA has reasonable cross-variable correlations for convective-scale reflectivity assimilation.
 Figure8. Vertical cross sections of the (a–d) radar reflectivity (shaded; units: dBZ) and relative humidity (solid blue line; units: %), and (e–h) vertical velocity (shaded; units: m s?1) and temperature (solid black line; units: °C) along the line from (33.6°N, 117.5°E) to (31.7°N, 120.6°E) from the (a, c, e, g) first guess and (b, d, f, h) analysis of Exp3DVar and ExpE3DA during the fifth assimilation cycle.
 Figure8. (Continued)
2
4.5. Multiple case verification
To generalize the conclusions of this study, we further applied E3DA to two additional convective cases: one that occurred over southern China on 23 April 2007 and the other that affected southeastern China on 14 June 2009. A summary of the experimental setup is listed in Table 1. Figure 9 shows the averaged FSS and BIAS of these two cases for ExpNoDA, Exp3DVar and ExpE3DA using thresholds of 25, 35 and 45 dBZ. It confirms the finding that ExpE3DA has the highest FSS for all thresholds during the entire forecast period, followed by Exp3DVar. The largest differences in FSS between Exp3DVar and ExpE3DA are in the first 3 h. The BIAS of the three experiments shows that ExpE3DA has the highest bias for all hours, and that both Exp3DVar and ExpNoDA underpredict the BIAS for all thresholds.| The 14 June 2009 case | The 23–24 April 2007 case | |
| Domain center | 33.5°N, 118.5°E | 24°N, 114°E |
| Domain size | D01: 161 × 161 × 51 (9 km) D02: 501 × 501 × 51 (3 km) | D01: 161 × 161 × 51 (9 km) D02: 501 × 501 × 51 (3 km) |
| Assimilation period | 0400–0900 UTC 14 June (every 1 h) | 1900 UTC 23 April–0000 UTC 24 April (every 1 h) |
| Forecast period | 0900–1500 UTC 14 June | 0000–0600 UTC 24 April |
| Physics parameterization schemes | Same as the 5 June 2009 case | Same as the 5 June 2009 case |
| Radar sites used | Shangqiu, Fuyang, Hefei, Xuzhou, Lianyungang, Yancheng, Nanjing and Nantong | Xiamen, Fuzhou, Jianyang, Guangzhou, Shenzhen, Shantou, Yangjiang, Shaoguan and Guilin |
Table1. List of model configurations, and the radar sites used for the additional two convective cases.
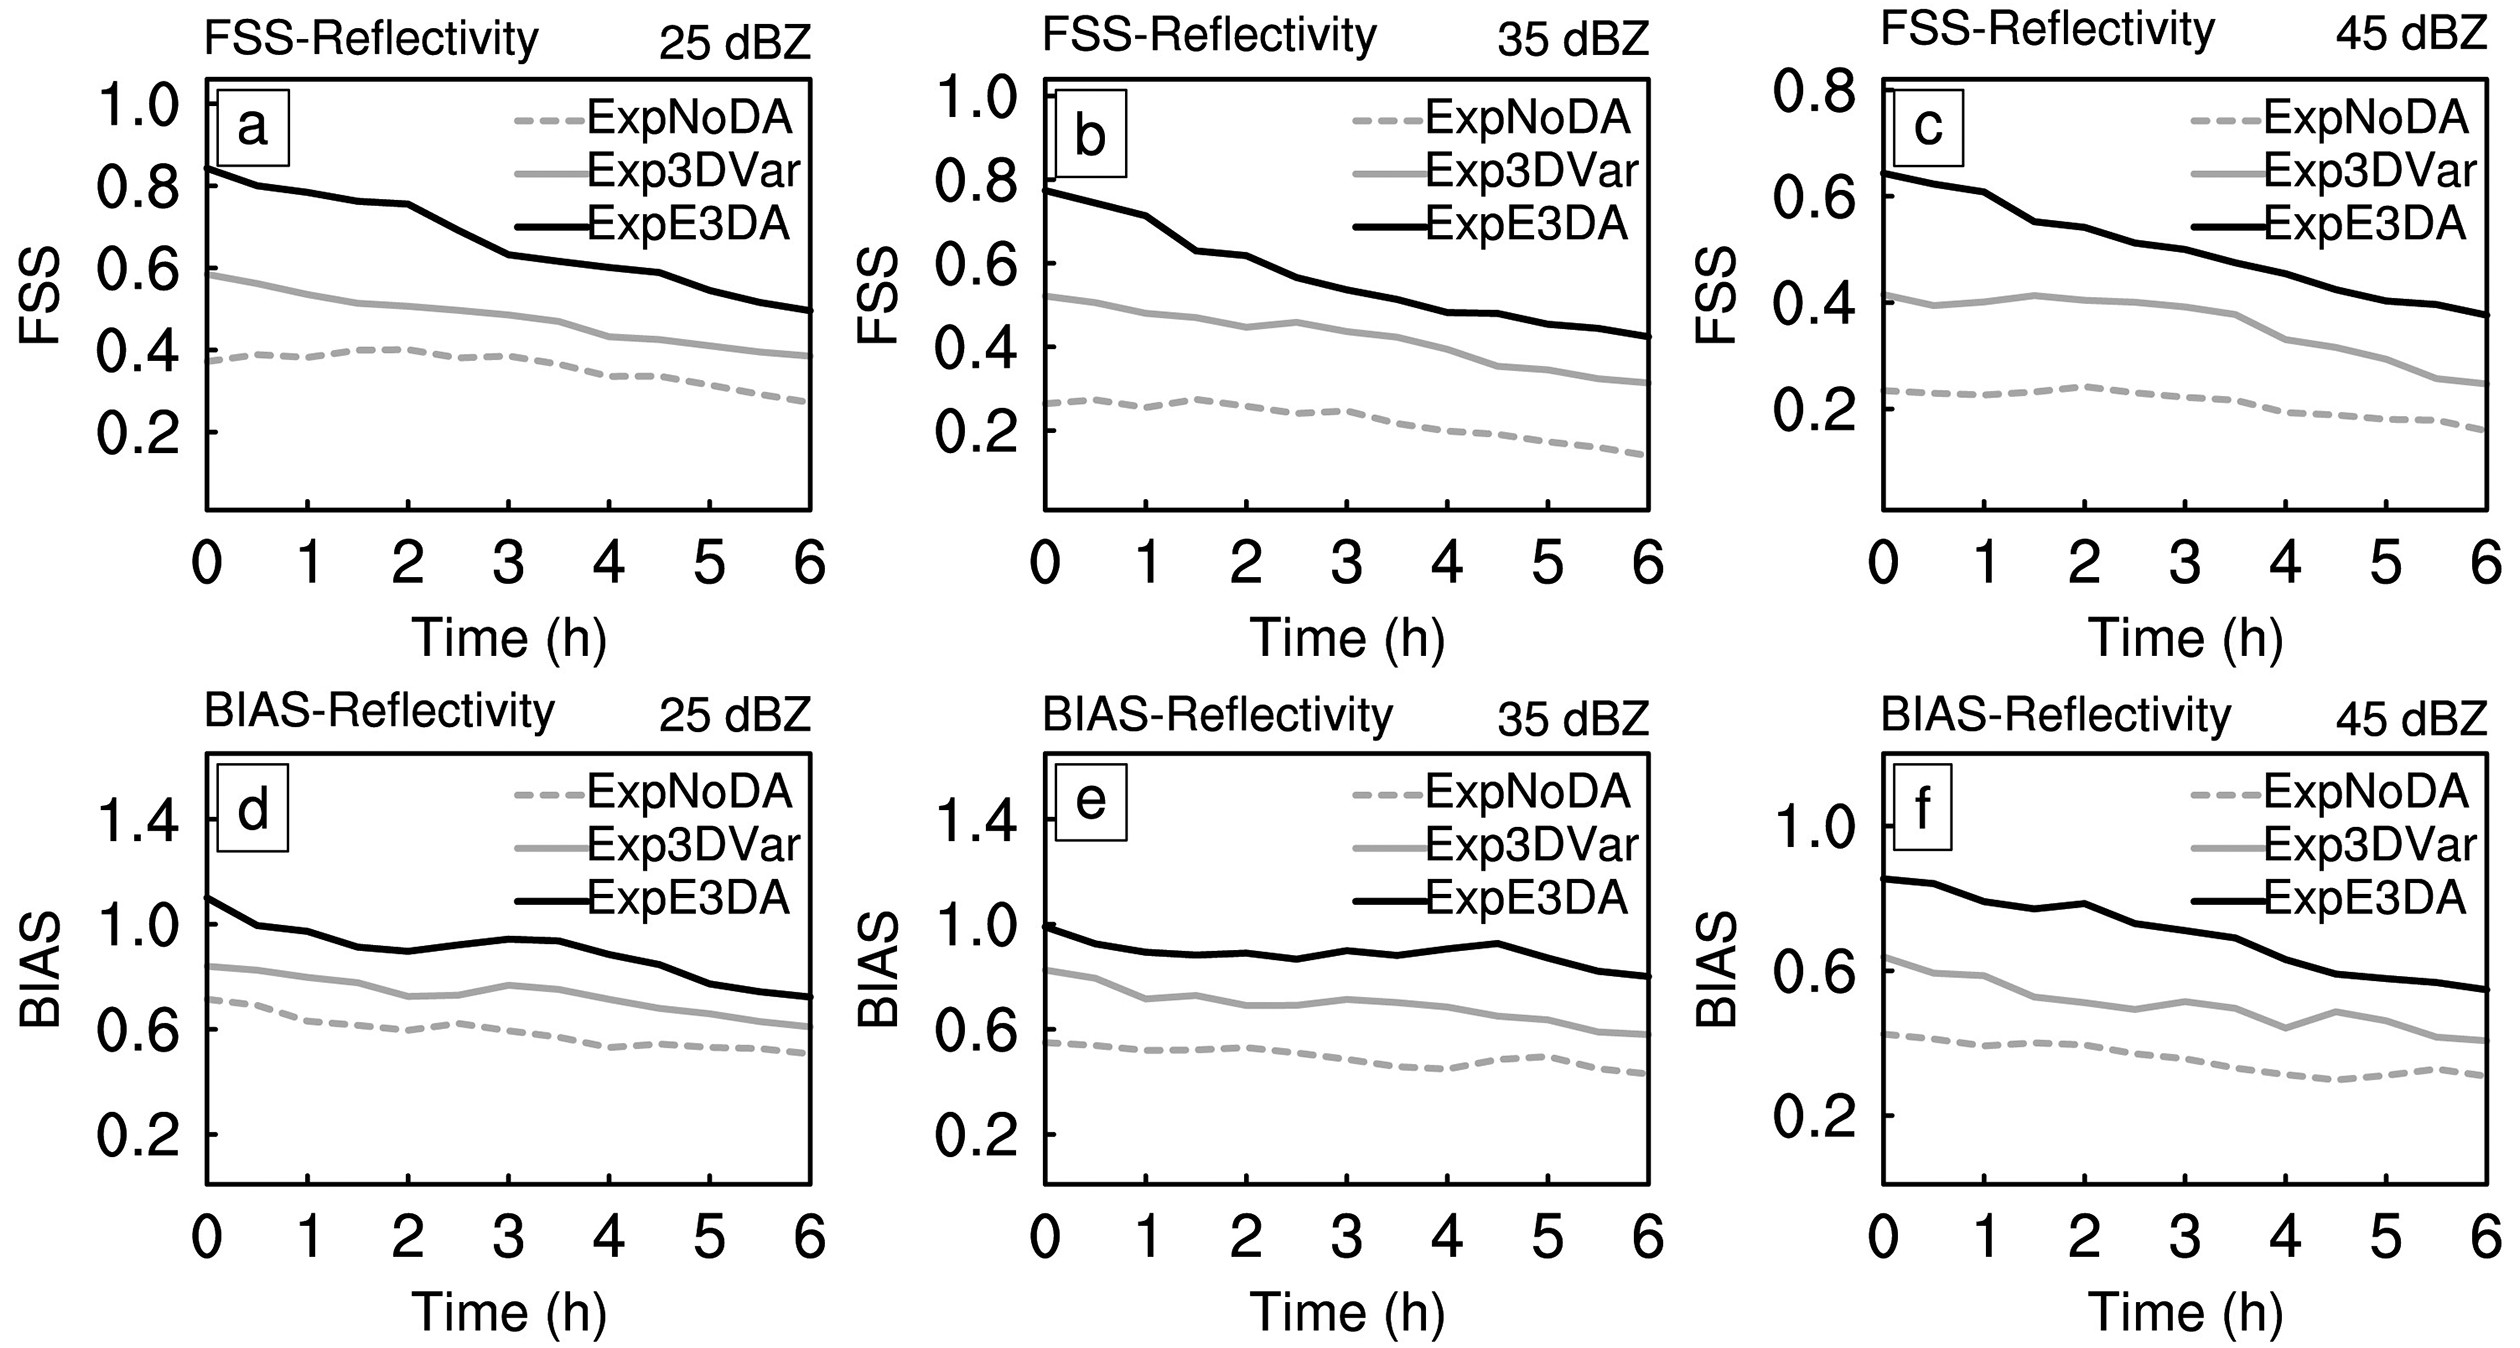 Figure9. Averaged (a–c) FSS and (d–f) BIAS from the two convective cases of the ExpNoDA (dashed gray curve), Exp3DVar (solid gray curve) and ExpE3DA (solid black curve) experiments for reflectivity thresholds of 25, 35 and 45 dBZ. The x-axis is the forecast time length.
Figure 10 shows the 2.5-h reflectivity forecasts for an example (1130 UTC) of the convective case that occurred on 14 June 2009. At this time, the observed reflectivity showed two major convective clusters in eastern Anhui and eastern Jiangsu provinces, with maximum reflectivity exceeding 60 dBZ. The two convective clusters in ExpNoDA were weaker and displaced to the northeast. This location error was corrected by both ExpE3DA and Exp3DVar; however, the intensity and coverage of the two areas of convections in ExpE3DA were much closer to the observations than in Exp3DVar, especially for the convection at the border of Anhui and Jiangsu provinces.
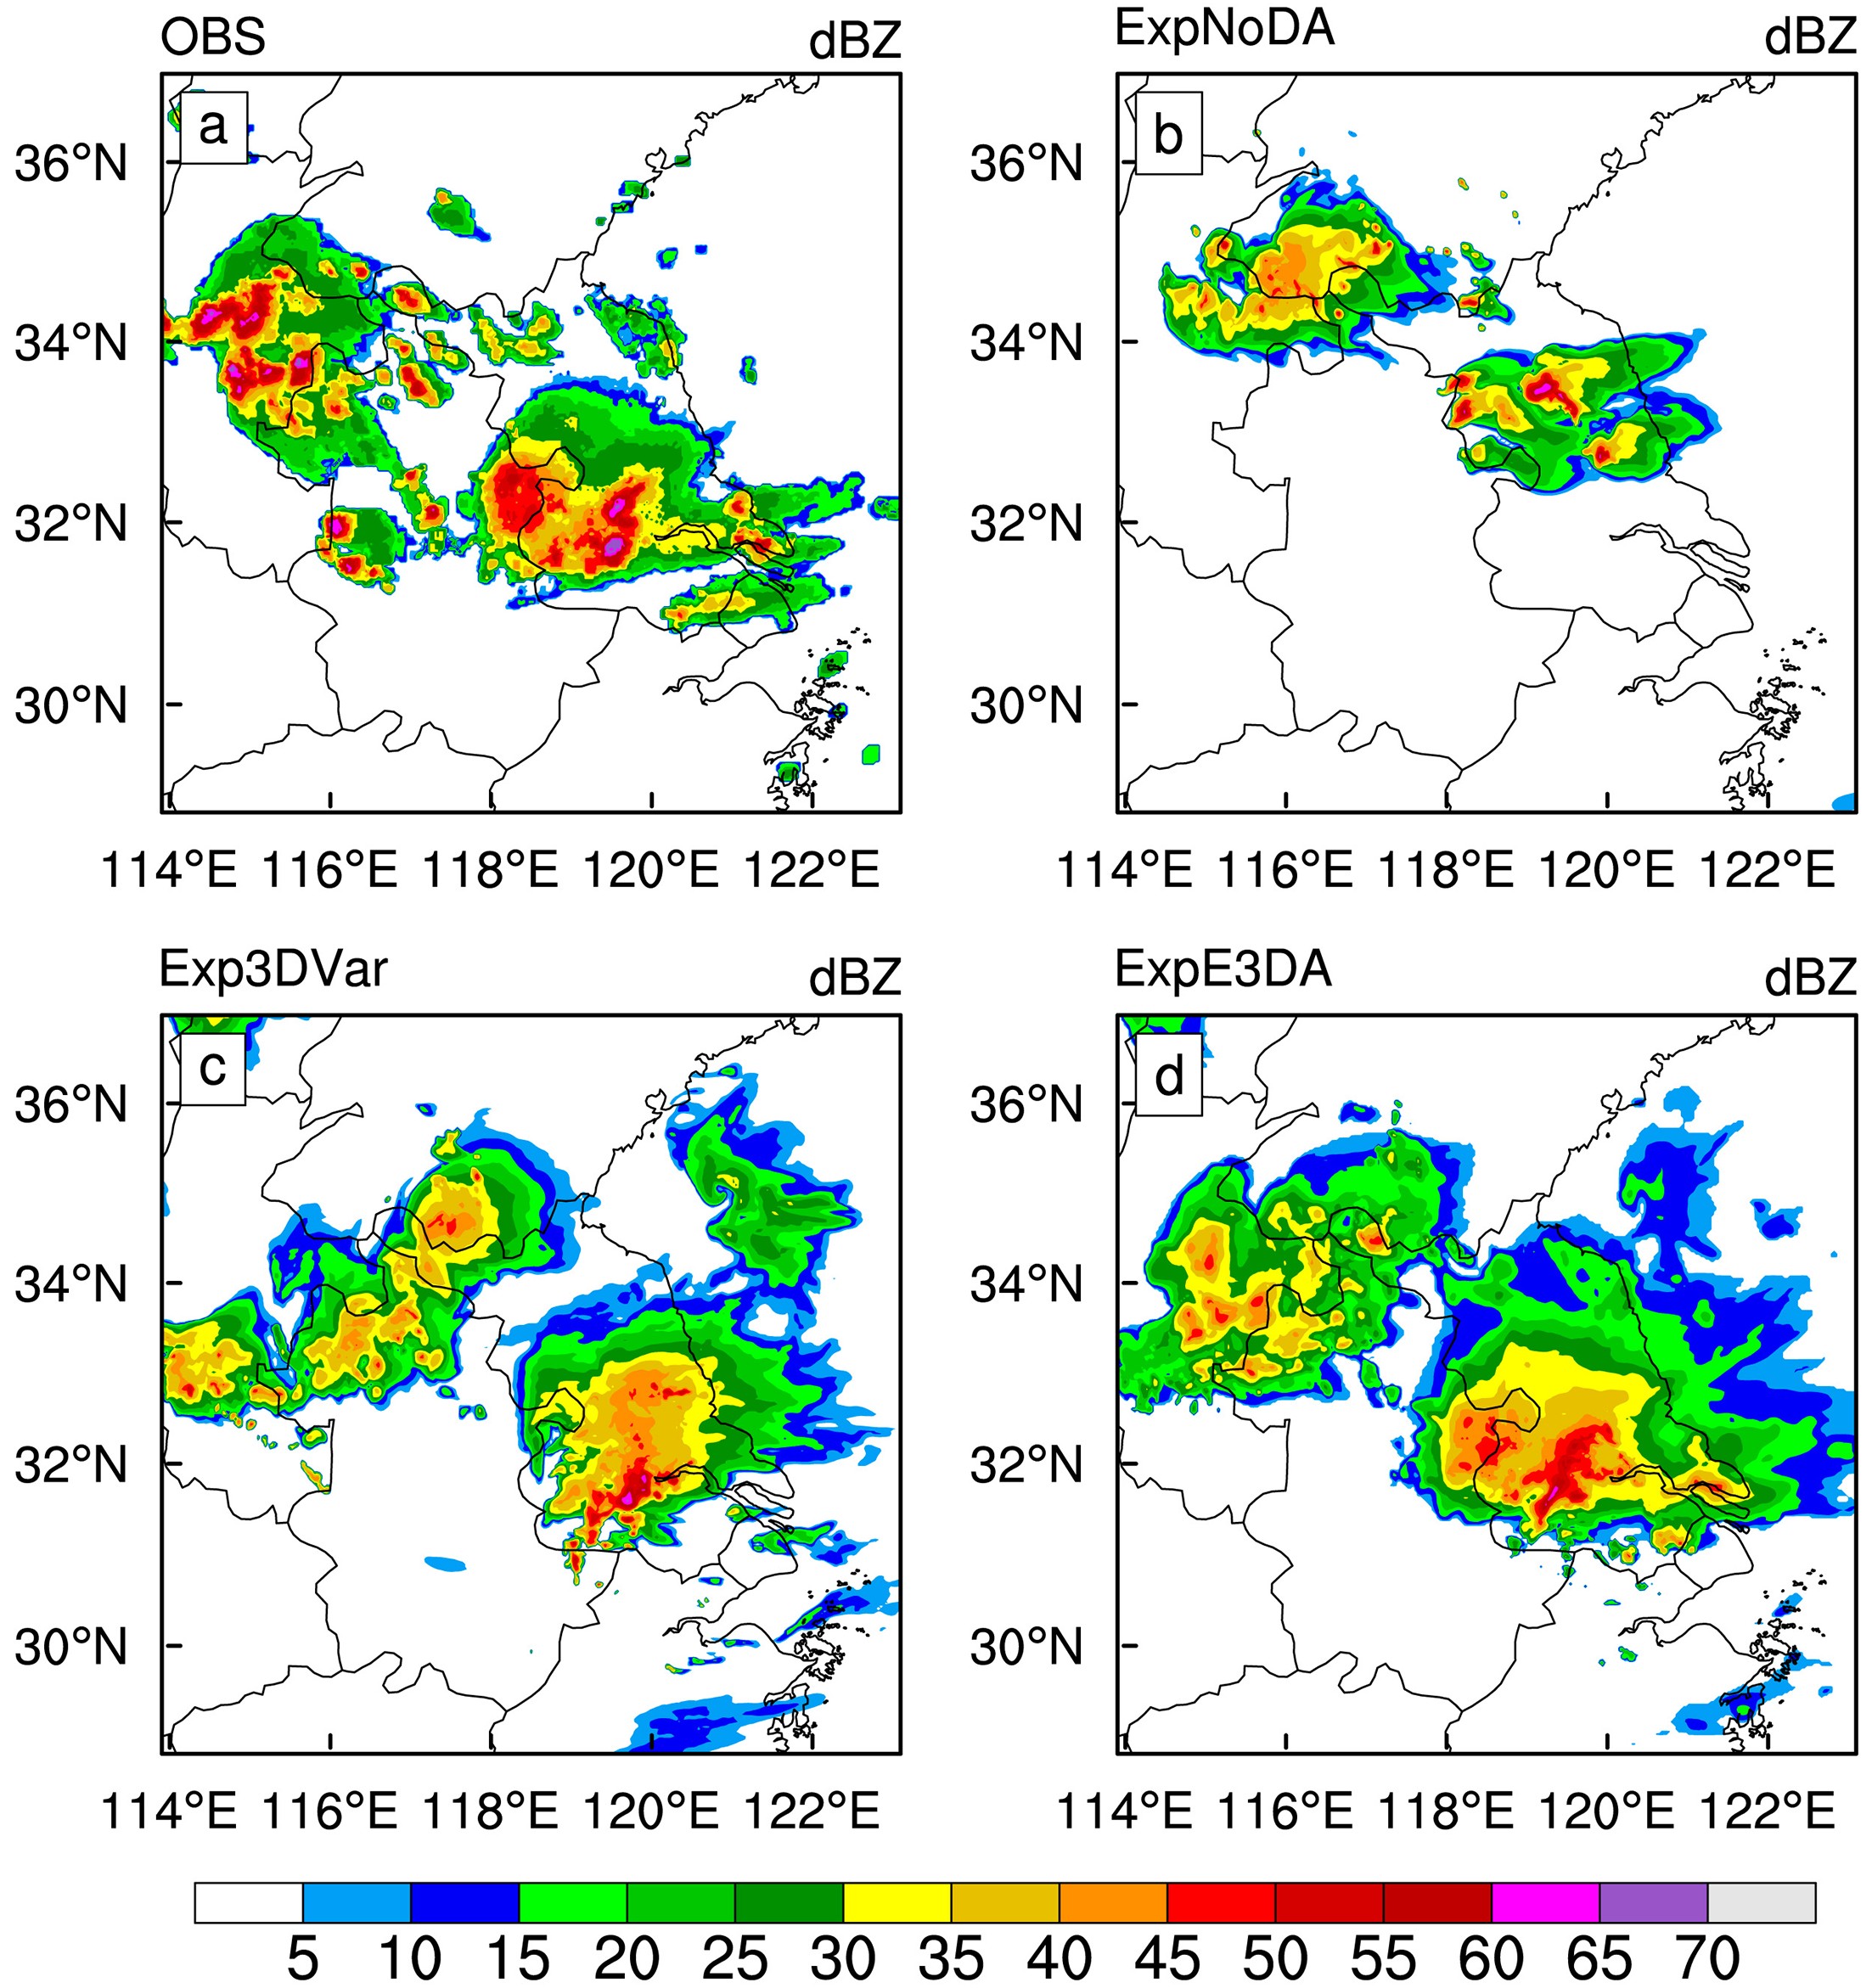 Figure10. As in Fig. 2 but at 1130 UTC 14 June 2009.
The results indicated that ExpE3DA significantly improves the quantitative reflectivity forecast skill over both ExpNoDA and Exp3DVar at all thresholds of 25, 35 and 45 dBZ, as measured by the FSS and BIAS. The positive impact of ExpE3DA was retained throughout the 6.5-h forecast period. It was found that ExpE3DA performed best in capturing the main characteristics of the storm, including a strong bow-shaped echo, as well as more convection in Anhui, than produced in the other two experiments. The forecast from Exp3DVar resulted in moderate improvement over ExpNoDA with a more realistic bow-shaped echo structure and improved reflectivity forecast skill. Furthermore, ExpE3DA better represented the multiple reflectivity cores in the vertical reflectivity structure, which Exp3DVar and especially ExpNoDA underestimated systematically.
Verification of the forecast radial velocity against the observations showed that ExpE3DA had consistently smaller RMSEs than Exp3DVar, i.e., decreases of 25%–35%, while Exp3DVar reduced the RMSEs from ExpNoDA by 1.2–2.5 m s?1. ExpE3DA also successfully simulated the inbound and outbound velocity structure as well as its associated wind speed in the 3.5-h forecast, while Exp3DVar only enhanced the outbound velocities and ExpNoDA largely missed these features. The positive impact of ExpE3DA was also found in the quantitative precipitation forecast skills at the thresholds of 1, 2.5 and 5 mm. For the 6-h accumulated precipitation, ExpE3DA performed better in capturing the two major rainbands over northern Zhejiang, Anhui, and Jiangsu more realistically than ExpNoDA and Exp3DVar. When verified against radiosonde and METAR station data, the RMSEs of wind, temperature, and water vapor from ExpNoDA and Exp3DVar were reduced by ExpE3DA. Diagnostic analysis revealed that the cross-variable correlations of E3DA contributed to its superior performance over 3DVar. E3DA was further applied to two additional convective cases that occurred in southern and southeastern China and the results of the 0–6-h forecasts illustrated its effectiveness and scale of improvement.
This study has served as a preliminary study for examining the E3DA system developed for radar DA. Further work will focus on comprehensive comparison of hybrid E3DA and EnKF-3DEnVar approaches in radar DA. It is also suggested that the more advanced ensemble-4DEnVar approach is applied to improve the performance of radar DA in the future.
Acknowledgements. This research was supported by the Startup Foundation for Introducing Talent of Shenyang Agricultural University (Grant No. 8804-880418054), the National Agricultural Research System of China (Grant No. CARS-13), and the National Key Research and Development Program of China (Grant No. 2017YFC1502102).
