
 , 张德怀2, 代然然2
1. 中国科学院大学地球科学学院 中国科学院计算地球动力学重点实验室, 北京 100049;
2. 西南大学地理科学学院, 重庆 400715
摘要: 基于对雅鲁藏布江流域东西方向的70个表土孢粉样品,进行孢粉现代过程的分析和研究,获得以下认识。研究区不同植被带下孢粉组合存在明显差异,如松林带以松属花粉为主,冷杉和云杉林带以冷杉属-松属-云杉属组合为主,阔叶林和灌木带以栎属-桦属-松属组合为主,高寒草甸带以莎草科-蒿属-菊科组合为特征,高寒草原带以蒿属-莎草科组合为特点。其中,AP/NAP(乔木与非乔木花粉)比值可很好地指示植被变化。利用花粉含量的PCA分析,重新建立2个花粉-气候指标(Pi,Ti),它们分别与年均降水量和年均温度有较高的相关系数,并通过0.01显著性检验,说明它们能够用来定量重建该地区过去气候的变化。
关键词: 现代孢粉PCA气候梯度花粉-气候指标雅鲁藏布江流域
Tibetan Plateau, with an average elevation of ca. 4 000 m and often described as a third pole, is a unique region for climate and vegetation studies. The high altitude terrain and seasonal monsoonal circulation systems control the regional climate and land surface properties (e.g., vegetation). In addition, the land surface, especially the vegetation, also affects regional atmospheric circulation and monsoonal systems. Though many paleoclimatic studies and paleovegetation reconstructions based on pollen data have been carried out for Tibetan Plateau[1-6], it is still important to understand the relationship between the modern pollen assemblages and vegetation and climate in the region[7-12]. Lu et al.[7], Shen et al.[8], and Wei et al.[9] established a relationship between pollen data and vegetation, but those studies were mostly basud on qualitative analyses. Herzschuh and Birks[12] used pollen data from the eastern and central Tibetan Plateau to argue that precipitation was the principal factor affecting vegetation in Qaidam basin, and established the threshold values of mean annual precipitation for four pollen types (e.g., Ephedra, Compositae, Chenopodiaceae, and Nitraria). Based on 1 202 surface pollen data sets, Lu et al.[2]established a transfer function between pollen assemblages and the primary climatic parameters, and demonstrated that the pollen assemblages could provide useful quantitative estimates of the past environmental changes. Those studies, however, cover wide ranges, and there is a lack of systematic regional research.
The Yarlung Zangbo River (YLZR) basin in the southern Tibetan Plateau is an environmentally sensitive area since most of the ground surface of the basin is overlain by an air convection layer whose thickness is less than one-third of the global average, and is therefore vulnerable to global climate change. In addition, the YLZR basin is well suited to the study of modern pollen-vegetation relationships since there is a wide range of vegetation types (e.g., forest, shrubland, steppe, alpine meadow, and alpine steppe) and the area is relatively unaffected by human activities. In this study, we collected 70 surface pollen samples from the YLZR basin to improve our understanding of the relationship between modern pollen assembalges and climate. We then establish a pollen-vegetation-climate model for the YLZR basin, based on our results.
1 Study areaThe Yarlung Zangbo River (YLZR) (80°12′-97°38′E, 27 °26′-28°54′N) originates from the Gyima Yangzoin Glacier on the northern slope of the Himalayas. The river is 2 057 km in length and flows from west to east across the southern part of the Tibetan Plateau, passing through Pulan, Xigaze, Lhasa, Shannan and Nyingchi areas. It then flows into India to become the Brahmaputra, which later meets with the Gangers River before flowing into the Bay of Bengal. The watershed area is 240 480 km2[13]. The average elevation of the basin in 4 000 m and its topography is complex, dominated by high mountains (e.g., the Gangdise, Nyainqentanlha, and Himalayan Mountains) and deep valleys. The terrain of the whole basin slopes gradually from west to east with an average gradient of 2.6‰.
The entire basin is part of the hydrological system associated with the Indian Ocean and the climatic patterns between the upper and the lower reaches of the basin exhibit clear differences due to location and topography. Precipitation, reflecting the impact of the southwest summer monsoon, is mainly concentrated during the interval from June to September (the rainy season) and accounts for about 65%-80% of the annual total for the basin. Mean annual precipitation (MAP) decreases systematically from east to west, reflecting the weakening of the influence of the summer monsoon (Fig. 1(a)). Highest MAP and mean annual temperature (MAT) exceeding 850 mm and 10 ℃, respectively, occur in the eastern forested area; while the lowest values, approximately 150 mm and -4 ℃, occur in the western alpine steppe area (Fig. 1(b)). Thus, the magnitude of the influence of the summer monsoon is a key factor in determining the distribution of vegetation formations.
Fig. 1
 | Download: JPG larger image |
Fig. 1 Location of the modern pollen samples from the Yarlung Zangbo River basin and the climate and vegetation distributions | |
The natural vegetation of the YLZR basin can be divided into four main types, from east to west: coniferous forest, broadleaved forest and shrubland, alpine meadow, and alpine steppe (Fig. 1(c)). Trees mainly comprise Pinus densata, P. armandi, Abies georget var. smithii, A.delavayi, A. forrestii, Picea balfouriana, P. linzhiensis, Betula platy-phylla, and Quercus. Shrubs and dwarf shrubs include Rosa spp., Hippophae, Rhododendron thymifolium, Salix spp., and Corylus. The most common herbs are Artemisia spp., Carex spp., Kob-resia spp., Stipa purpurea, S. basiplumosa, Festuca, Poa, Roegneria, Koeleria and Compositae[14].
2 Materials and methods2.1 Surface pollen sample collectionA total of 70 modern pollen samples were collected from surface soil in the YLZR basin during July 2010. The location of each site was determined by GPS. The vegetation type and the major plant taxa at each sampling site were recorded in the field (Table 1). In the forest sites, we used 10 m×10 m quadrats to survey the tree layer, 5 m×5 m quadrats for the shrub layer and 1 m×1 m quadrats for the herb layer. All species observed in the tree, shrub and herb layers were recorded in terms of species abundance (the total number of species per unit area), canopy range, height and diameter at breast height of trees and shrubs, and the height of the herbs. Habitat conditions, such as slope, slope aspect, soil type and physical characteristics, livestock grazing and other evidence of human disturbance were also recorded. At each site, moss polsters (forest only), topsoil and litter (shrub and grassland) were taken randomly from each quadrat, and then mixed and sealed in a plastic bag to produce a single sample for that site.
Table 1
| Table 1 Location and surrounding vegetation types of regional surface pollen samples from the Yarlung Zangbo River (YLZR) basin |
Meteorological data were available from 27 national climate stations in the study area and the surrounding region, and were taken from the China Meteorological Statistical Annals (supplied by the China National Weather Service). Averages for the 30 a period from 1961 to 1990 were used. MAT and MAP for each sampling site were obtained by spatial interpolation of the data the 27 meteorological stations.
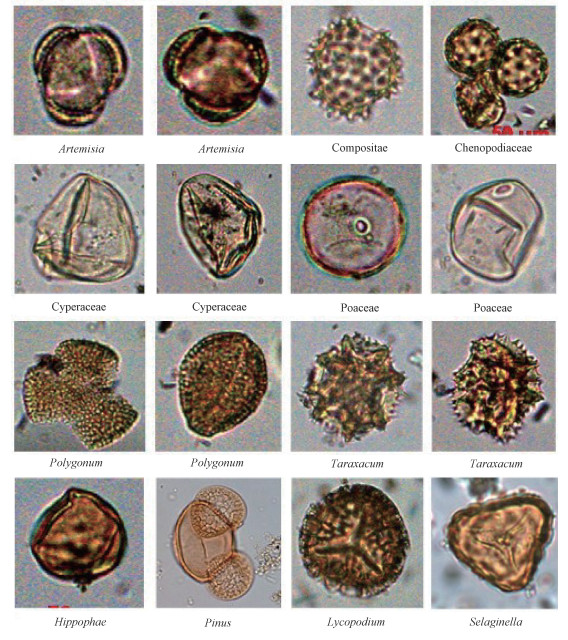
2.2 Laboratory methodsProcessing of the surface pollen samples consisted of treating 5-10 g of sample with HCl (5%-10%), NaOH (5%-10%), HF (36%), followed by acetolysis and removal of clay-sized particles by sieving. Prior to chemical processing, a tablet of Lycopodium spores (containing (27 637±563) spores) was added to each sample for calculating the pollen concentration[15]. Finally, the samples were suspended in glycerol, mounted on microscope slides and examined with a transmitted light microscope (Olympus BX 51) at ×400 for routine counting and at ×600 for critical identifications. Pollen grains were identified follo-wing Wang et al.[16] aided by a reference pollen collection from northwestern China. At least 400 terrestrial pollen grains were counted for each sample, and the percentage of each pollen type was calculated based on the sum of all counted pollen grains. Pollen diagrams were produced using Grapher 8.0 software.
2.3 Numerical analysisOrdination techniques have been widely used in analyzing relationships between pollen assemblages, vegetation and environmental variables[6, 17-20]. To determine whether to use linear or unimodal-based numerical methods, detrended correspondence anal-ysis (DCA) is first performed to evaluate the gradient length of the first axis, which is measured in standard deviation (SD) units of species turnover[21]. A linear model implemented with prin-cipal components analysis (PCA) and redundancy analysis (RDA) is appropriate where the gradient length is < 3 SD, and a unimodal model with canonical correspondence analysis (CCA) where the gradient length is > 4 SD. For intermediate lengths, both models may be useful. In this study, the DCA of surface pollen samples along the YLZR transect showed that the first axis had a gradient length of < 3 SD (1.95), indicating that the species response might be moderately linear[21] and thus that PCA or RDA was preferable over CCA. Accordingly, the patterns of variation of the modern pollen assem-blages in relation to environmental variables were explored using PCA and assessed using associated statistical procedures. DCA and PCA were con-ducted using the CANOCO software package[22].
3 Results3.1 Vegetation composition of the samp-ling sitesTable 1 lists the vegetation composition for each sampling site. Based on field observations, five different vegetation types were distinguished: pine forest, fir and spruce forest, broadleaved forest/shrubland, alpine meadow and alpine steppe. The forest vegetation in the eastern part of the YLZR basin, growing in the valleys and mountain slopes below 4 000 m, consists mainly of Pinus, Picea, Abies, Tsuga, Betula and Quercus. Alpine meadow occupies the central part of the Plateau at elevations of exceeding 4 500-5 200 m; it consists mainly of sedge and grass communities typically comprising Carex, Kobresia pygmaea and K. humilis, together with Festuca, Poa, Polygonum macrophyllum, P. viviparum, Caltha scaposa, Roegneria, and Koeleria. Alpine steppe occupies the western part of the YLZR basin at elevations of 4 500-4 800 m. Artemisia stracheyi, A. wellbyi, Stipa purpurea, S. basiplumosa, Carex mooucroftii and Poa are the dominant constituents of alpine steppe, together with for example Astragalus, Oxytropis and Festuca. Cushion plants (e.g., Arenaria musciformis, Andro-sace tapete) and succulents (e.g., Rhodiola spp., Sedum spp.) are frequently present.
3.2 Pollen assemblagesA total of 46 pollen types, consisting of 15 arboreal taxa, 9 shrub taxa and 22 herb taxa were identified. As expected, the composition of the pollen assembalges varies systematically with vegetation type. Five pollen assemblage zones along the east-west transect in the YLZR basin can be distinguished, which are illustrated in Fig. 2 and described as follows.
Fig. 2
 | Download: JPG larger image |
Fig. 2 Pollen percentage diagram of surface samples from the Yarlung Zangbo River basin | |
3.2.1 Zone 1 (Pine forest, sites 1-9): Pinus pollen assemblageThe samples from pine forest have very high tree pollen frequencies (up to 90%), mainly com-prising Pinus (10%-90%), Abies (1%-10%), Tsuga (1%-6%), and Cupressaceae (0-6%). The shrub and herb pollen content are the lowest in the entire sample set, consists mainly of Artemisia (0-18%), Poaceae (0-12%), Rosaceae (0-10%) and Compositae (0-5%). The total pollen concentration rangs from 15 000 to 40 000 grains/g.
3.2.2 Zone 2 (Fir and spruce forest, sites 10-15): Abies-Pinus-Picea pollen assemblageThis zone is also characterized by very high tree pollen frequencies (up to 90%), mainly comprising Abies (15%-50%), Pinus (20%-40%), Picea (5%-20%), Tsuga (1%-3%), and Cupressaceae (1%-3%). The herb and shrub pollen types mainly consist of Artemisia (5%-20%), Rosaceae (3%-15%), Poaceae (1%-8%) and Corylus (1%-3%). Total pollen concentration is also high, ranging from 15 000 to 60 000 grains/g.
3.2.3 Zone 3 (Broadleaved forest/shrub, sites 16-27): Quercus-Betula-Pinus pollen assemblageBroadleaved trees and shrubs are well represented, mainly comprising Quercus (2%-40%), Betula (2%-30%), and Rosaceae (1%-50%). Coniferous tree pollen percentages are lower compared to the two preceding zones; they mainly comparise Pinus (5%-30%), Abies (0-15%) and Picea (0-8%). Herb pollen percentages are low, comprising Artemisia (5%-50%), Poaceae (0-18%), Cyperaceae (0-25%) and Compositae (0-10%). The total pollen concentration ranges from 10 000 to 147 660 grains/g. It is noteworthy that the representation of Hippophae and Rhododendron reaches respective maxima in Hippophae shrubland (samples 21, 22) and Rhododendron shrubland (samples 18, 19).
3.2.4 Zone 4 (Alpine meadow, sites 28-59): Cyperaceae-Artemisia-Compositae pollen assemblageHerb and shrub pollen are dominant. Cyperaceae frequencies are high, with an average of 35%, as are those of Artemisia (0-60%), Compositae (e.g., Aster-type, Taraxacum-type, Saussurea-type, Anthemis-type) (0-20%), Poaceae (0-10%) and Ephedra (0-2%) are well represented. The tree pollen frequencies are signifinantly lower than in the previous zones. They mainly include Pinus (0-25%), Tsuga (0-7%), Cupressaceae (0-6%), Quercus (0-8%) and Salix (0-5%). The total pollen concentration is less than 30 000 grains/g. It should be noted that there is a pronounced decrease in Artemisia, Chenopodiaceae and Pinus, at the expense of Cyperaceae and Compositae, in samples 39 and 48.
3.2.5 Zone 5 (Alpine steppe, sites 60-70): Artemisia-Cyperaceae-Poaceae pollen assemblageHerb and shrub pollen are dominant. They comprise Artemisia (20%-60%), Cyperaceae (10%-45%), Poaceae (5%-25%) and Chenopodiaceae (3%-15%). These taxa exhibit the higheset frequencies in the entire data set, while the tree pollen frequencies, mainly consisting of Pinus, Tsuga and Cupressaceae, are the lowest. The total pollen concentration is the lowest ( < 10 000 grains/g).
3.3 PCA resultsWe used 26 main pollen types (accounting for some 90% of the total pollen content) for PCA. They comprise Pinus, Picea, Abies, Tsuga, Cupressaceae, Larix, Quercus, Betula, Ulmus, Juglans, Corylus, Rosaceae, Hippophae, Rhododendron, Poaceae, Artemisia, Chenopo-diaceae, Ephedra, Compositae, Cyperaceae, Polyg-onum, Ranunculaceae, Labiatae, Leguminosae, Cruciferae, and Caryophyllaceae. The results are illustrated in Fig. 3(a).
Fig. 3
 | Download: JPG larger image |
Part (a) is biplot of PCA results based on surface pollen taxa (Ranu: Ranunculaceae; Cupr: Cupressaceae; Labi: Labiatae; Rhod: Rhododendron; Cruc: Cruciferae); Part (b) is biplot of PCA results based on surface pollen samples. Fig. 3 PCA results of the surface pollen data from Yarlung Zangbo River basin | |
The first two principal components represent 77% of the total variance (axis 1, 61.2%; axis 2, 15.8%). The first principal component, axis 1, is characterized by high positive loading of Pinus, Abies, Picea and other tree and shrub taxa; and by negative loading of Cyperaceae, Chenopodiaceae, Poaceae, Ephedra, Compositae, Polygonum and Artemisia. Thus, axis 1 reflects, from positive to negative values, a gradient from warm to cold climatic conditions. The second principal comp-onent, axis 2, is characterized by positive loadings of Cyperaceae, Hippophae, Pinus, Compositae and Caryophyllaceae; and negative loading of Artemisia, Poaceae, Leguminosae, Rosaceae and Chenop-odiaceae. Thus, axis 2 represents, from positive to negative values, a gradient from relatively humid to more arid conditions.
The biplot of the sample scores on the first two principal components (Fig. 3(b)) also indicates that the first principal component primarily separates samples from forest (e.g., pine forest, fir and spruce forest, broadleaved trees/shrubs), alpine meadow and alpine steppe. The second principal component separates most of the alpine meadow samples from those from alpine steppe.
4 Discussion4.1 Pollen assemblages of the different vegetation typesThe pollen assemblages and PCA scatter plots identify five modern vegetation types in the study region: pine forest, fir and spruce forest, broa-dleaved forest/shrubland, alpine meadow and alpine steppe (see Fig. 2, Fig. 3). Based on pollen frequencies, Pinus is the dominant taxon in pine forest; Abies, Picea and Pinus are the dominant taxa in the fir and spruce forest; and Quercus, Betula, Rosaceae, Rhododendron and Hippophae are the dominant taxa in the broadleaved forest/shrubland. Alpine meadow is characterized by Cyperaceae, Compositae and Caryophyllaceae; and alpine steppe by Poaceae, Artemisia, Cyperaceae, Chenopo-diaceae and Polygonum. These results indicate that the surface pollen assemblages are representative of the modern vegetation composition and thus that the dominant pollen taxa can be used for qualitative vegetation reconstruction in the study region.
4.2 Pollen dispersal and representationPollen dispersal is a key factor affecting the representation of specific taxon in the modern pollen rain. In this study we estimate the representation of some of the main types on a qualitative basis by comparing the abundance of each taxon in the pollen assemblages with the observed vegetation type and composition around the sample site. Below, we select five major groups of taxa for discussion of the main patterns of pollen dispersal and representation.
4.2.1 Pinus, Abies, PiceaPinus pollen is present in all the surface samples and is the dominant taxon in the pine forest zones (2 200-3 500 m). The highest Pinus frequencies ( > 50%) occur in pine forest (e.g., Pinus densata, P. armandi), and the lowest percentages ( < 20%) occur in alpine steppe, where pine trees are absent. In the alpine meadow, Pinus exhibits values of 1%-35%, probably reflecting long-distance transport by wind. Generally, pine trees are unlikely to be locally present at sites where Pinus frequencies are less than 35%. In accordance with previous studies[17, 23-24], we conclude that in the YLZR basin Pinus pollen is well dispersed and is greatly over-represented in the pollen rain.
The highest Abies (15%-50%) and Picea (5%-20%) pollen percentages correspond closely to the distribution of fir (e.g., Abies georget var. smithii, A.delavayi, A. forrestii) and spruce (Picea balfouriana, P. linzhiensis) forest (2 300-4 300 m), where the fir cover ranges from 30%-40% and that of spruce from 10%-20%. In the alpine meadow and alpine steppe, the frequencies of Abies and Picea are near zero, which suggests that in the study area the dispersal distance of Abies and Picea is significantly shorter than that of Pinus, where coniferous trees (e.g., pine, fir and spruce) are absent. In summary, Abies and Picea may be over-represented in the pollen rain, in accordance with the results of studies in China and Mongolia[17, 20].
4.2.2 Quercus, BetulaQuercus and Betula pollens are represented in most the vegetation zones, especially in broadleaved forest/shrubland. The highest Quercus pollen content (25%-50%) corresponds closely to the distribution of oak forest (Samples 16, 17) with coverage of 40%-60%, while percentage below 1% or zero occur where Quercus is absent in the vegetation. This suggests that Quercus is equally-or under-represented in the pollen rain[23-24]. The highest Betula percentage (20%-35%) occur in brich forest (Samples 24-26), with an area coverage of 20%-30%. However, the representation of Betula (~3%) at sites where birch is absent in the vegetation indicates that Betula pollen is well dispersed and is over-represented in the pollen rain, in accordance with the results of studies in the northern China and Mongolia[17, 23-25].
4.2.3 Rhododendron, Rosaceae, HippophaeAlpine broadleaved shrub, consisting for example of Rhododendron, Rosa and Hippophae, is common at altitudes between 3 500 and 4 500 m in the study area. Rhododendron is mainly distributed within the altitudinal range of 3 500-4 000 m, where its coverage is 40%-60%. The highest Rhododendron pollen frequencies (18%, 25%) occur in samples 18 and 19, respectively; while its representation is greatly reduced or zero in the adjacent samples, suggesting that it is poorly dispersed. Rosa is mainly distributed from 3 500-4 000 m, where its coverage in the vegetation is 30-40%. Highest Rosaceae pollen frequencies (50%, 20%) occur in sample 20 and 21, respectively; and low frequencies (~2%) in alpine meadow and alpine steppe where Rosa plants are absent. It is noteworthy that Rosaceae frequencies up to 10% of the samples where Rosa plant (e.g., Potentilla) occur, suggesting that Rosa pollen is better dispersed than Rhododendron pollen. Hippophae shrub is mainly distributed from 3 800-4 500 m, where its coverage is 20%-40%. Highest Hipp-ophae frequencies occur in the samples 22, 23 and 27 (8%, 17%, 13%, respectively), while its frequen-cies are low or zero in adjacent samples, suggesting that it is poorly dispersed.
4.2.4 Cyperaceae, CompositaeCyperaceae and Compositae are the two principal pollen types in alpine meadow. The samples from alpine meadow, with an average elevation of 4 800 m, where the coverage of Cyper-aceae in the vegetation typically exceeds 50%, are characterized by the predominance of Cyperaceae ( > 50%), suggesting that this taxon is equally-represented in the study area. Interestingly, Cyperaceae frequencies in surface pollen data from steppe and meadow vegetation in northern China are low, indicating that it is poorly represented[24, 26]. However, in contrast, it is over-or equally-represented in pollen data from the Tibetan Plateau region[6, 27]. In the present study area, relatively low frequencies of Compositae ( < 10%) occur in the samples from alpine meadow, where Compositae plants cover 30%-50% area, suggesting that this taxon is under-represented.
4.2.5 Poaceae, Artemisia, ChenopodiaceaeHigher frequencies of Poaceae and Artemisia occur in the alpine steppe, with an elevation range from 4 500 to 4 800 m, than in the alpine meadow and forest. However, Poaceae frequencies are relatively low (6%-30%, average 21%) even though grasses are abundant in the alpine steppe vegetation, indicating that it is under-represented. Similar conclusions were made in studies in the steppe and desert of north and northwest China[28-30]. A relatively low pollen productivity and the thin exine of Poaceae grains my account for its low representation[23-24]. Artemisia exhibits high frequencies (20%-50%) in samples from alpine steppe, where Artemisia plants cover 20%-40% area, suggesting that Artemisia pollen is over-represented. Chenopodiaceae is dominant in the modern pollen rain of alpine desert vegetation zones in the western art of the Tibetan Plateau, where the precipitation is the lowest. Highest Chenopodiaceae frequencies (5%-15%) occur in the samples from alpine steppe, where the coverage of Chenop-odiaceae plants is low ( < 5%), indicating that it is over-represented. Our findings regarding the representativeness of Artemisia and Chenopodiaceae are in accord with those of studies of surface pollen assemblages in arid China[29, 31-32].
4.3 Pollen-climate indicesThe ratio of arboreal pollen (AP) to non-arboreal pollen (NAP) is widely used as an indicator of variations in effective moisture in North China and in the forest/steppe transition in cental China; as well as an indicator of climatically-driven changes in the tree-line in other regions[20, 31, 33]. In the YLZR basin the AP/NAP ratio decreases progressively from an average of 14.6 in pine forest, 4.0 in fir and spruce forest, 3.0 in broadleaved forest/shrubland, 0.25 in alpine meadow, to 0.08 in alpine steppe (Fig. 4). This demonstrates that the AP/NAP ratio is a good indicator of forest/alpine meadow/alpine steppe in the study region.
Fig. 4
 | Download: JPG larger image |
Pi, precipitation index; Ti, temperature index; AP/NAP, ratio of arboreal to non-arboreal pollen; A/Cy, ratio of Artemisia to Cyperaceae; MAT, the mean annual temperature; MAP, mean annual precipitation. Fig. 4 Summed percentages of groups of pollen types (P1-P5) used in the calculation of pollen-climate indices (Pi, Ti) | |
The of Artemisia to Cyperaceae (A/Cy) in the pollen diagrams has been widely used as a semi-quantitative measure of summer temperature changes in the central and eastern Tibetan Plateau, and for distinguishing meadow and steppe vegetation[31].Li et al.[27] assessed the utility of the A/Cy ratio as an indicator of vertical shifts in vegetation belts and temperature changes in the central Tibetan Plateau based on 37 surface soil samples from an altitudinal range of 4 720-4 820 m. However, in the YLZR basin the A/Cy ratio is relatively weakly correlated with altitude (R2=0.296 1) and MAT (R2=0.429 9) (see Fig. 4). However, in this case several additional factors may affect the A/Cy ratio. Firstly, there are three categories of forest (pine forest, fir and spruce forest, broad-leaved forest/shrubland) among the total of five vegetation types. Tree pollen is dominant in the forest zones with frequencies up to 90%. Thus, herb pollen ( < 20%), including Artemisia and Cyperaceae, fails to represent the local vegetation (e.g., forest). Secondly, different taxa have different degrees of pollen dispersal efficiency and representativeness of the vegetation. As mentioned above, in the present study Artemisia is over-represented, which means that the lower Artemisia frequencies do not necessarily reflect the true local vegetation since Artemisia pollen is often present in samples from plant communities in which Artemisia is absent. However, Cyperaceae is equally-represented, which means that Cyperaceae pollen frequencies better reflect the local vegetation. On the other hand, overgrazing by livestock may cause vegetation degradation, resulting in the increased representation of Artemisia in pollen assemblages[19, 34-35]. This means that the use of the A/Cy ratio as an environmental indicator is unreli-able in areas where Artemisia is absent in the vegetation and overgrazing area occurs. Thus, the applicability of A/Cy ratio may be limited in the YLZR basin.
Consequently, we defined two new pollen-climate indices for the YLZR basin that are based on the modern pollen data: a precipitation index (Pi) and a temperature index (Ti). The two indices are calculated from the ratios of groups of pollen taxa that represent different precipitation and temperature conditions in the study region. The groups of climatically sensitive pollen taxa are based largely on the results of PCA (see Fig. 3); however, mem-bership of a particular group was also determined on the basis of pollen assemblages (see Fig. 2), knowledge of ecological conditions acquired during field-work, and on considerations related to the pollen representation of specific taxa. We divided 20 pollen taxa (Pinus, Picea, Abies, Tsuga, Quercus, Betula, Corylus, Poaceae, Artemisia, Chenopo-diaceae, Cyperaceae, Compositae, Polygonum, and so on) into five groups based on their relationships to five major vegetation communities (Table 2). Group 1 (P1), including Pinus, is dominant in pine forest. Group 2 (P2), containing Picea and Abies, occurs commonly in fir and spruce forest. Group 3 (P3), including Quercus, Betula, Hippophae, Rosaceae, Rhododendron, Corylus, Juglans, Ulmus, represents broadleaved forest/shrubland. Group 4 (P4), containing Cyperaceae, Compositae, Caryophyllaceae, is the main component of alpine meadow. Group 5 (P5), including Poaceae, Artemisia, Leguminosae, Polygonum, Chenopodiaceae, Ephedra, occurs in alpine steppe. The temperature index (Ti) is calculated as
| ${{T}_{i}}=\left( \rm{P}1+\rm{P}3 \right)/\left( \rm{P}2+\rm{P}4+\rm{P}5 \right), $ |
| Table 2 Composition of the five groups of pollen types (P1-P5) used in calculations of temperature index (Ti) and precipitation index (Pi) |
where P1-P5 are the summed percentages of the components of each group and is directly propor-tional to temperature. Similarly, the precipitation index (Pi) is calculated as
| ${{P}_{i}}=\left( \rm{P}1+\rm{P}2+\rm{P}3 \right)/\left( \rm{P}4+\rm{P}5 \right), $ |
Fig. 5
 | Download: JPG larger image |
Fig. 5 Scatter plots of pollen indices versus-climatic parameters (i.e., Ti, Pi, AP/NAP ratio) vs. mean annual precipitation (MAP) and mean annual temperature (MAT) | |
5 Conclusions1) We studied modern pollen-vegetation relationships using 70 surface samples collected along an east-west transection across the YLZR basin. The modern pollen spectra and the results of PCA suggest that the vegetation zones along the transection are characterized by distinctive pollen assemblages as follows: ① pine forest zone: Pinus pollen assemblage, ② fir and spruce forest zone: Abies-Pinus-Picea pollen assemblage, ③ broad-leaved forest/shrubland zone: Quercus-Betula-Pinus pollen assemblage, ④ alpine meadow zone: Cyperaceae-Artemisia-Compositae pollen assem-blage, and ⑤ alpine steppe zone: Artemisia-Cyperaceae-Poaceae pollen assemblage.
2) Our results shed light on several important issues in pollen dispersal and representation in the alpine regions of the southern part of Tibetan Plateau. As expected, Pinus, Abies, and Picea are over-represented in the modern pollen rain, apparently as a result of the long-distance dispersal ability of its saccate pollen. Quercus is greatly under-represented, since its frequencies are < 50% within oak forest. However, Betula pollen is over-represented. Three shrub pollen types (Rosaceae, Hippophae, and Rhododendron) are under-repres-ented, as their pollen frequencies are < 20% within shrub-dominated area. Cyperaceae, Artemisia, and Chenopodiaceae are over-represented. Poaceae and Compositae are under-represented with respective pollen frequencies of < 30% and 20% within steppe-dominated areas.
3) We have developed two new pollen indices to represent the principal climatic gradients in the YLZR basin. The temperature index (Ti) is based on the ratio between the pollen percentages of 9 pollen taxa characteristic of cool temperature coniferous forest and broad-leaved forest/shrubland and 11 pollen taxa characteristic of subalpine coniferous forest, cold meadow, and cold steppe. The precipitation index (Pi) is based on the ratio between the pollen percentages of 11 pollen taxa characteristic of cool temperature coniferous forest, subalpine coniferous forest, and cool temperature broadleaved/shrubland and 9 pollen taxa charact-eristic of cold meadow and cold steppe. Comparison of the pollen-climate indices with modern climatic data yielded relatively strong correlations (R2=0.738 8 for precipitation and R2=0.511 6 for temperature), showing that the indices closely track the regional climatic gradient.
We thank Prof. Liu Yongqin and Dr. Liu Xiaobo for collecting the samples.
Appendix: sporopllen diagram
 |
References
| [1] | Herzschuh U, Birks H J B. Evaluating the indicator value of Tibetan pollen taxa for modern vegetation and climate[J].Review of Palaeobotany and Palynology, 2010, 160:197–208.DOI:10.1016/j.revpalbo.2010.02.016 |
| [2] | Lu H Y, Wu N Q, Kambiu L, et al. Modern pollen distributions in Qinghai-Tibetan Plateau and the development of transfer functions for reconstructing Holocene environmental changes[J].Quaternary Science Reviews, 2011, 30:947–966.DOI:10.1016/j.quascirev.2011.01.008 |
| [3] | Sun J M, Zhu R X, An Z S. Tectonic uplift in the northern Tibetan Plateau since 13.7 Ma ago inferred from molasse deposits along the Altyn Tagh Fault[J].Earth and Planetary Science Letters, 2005, 235:641–653.DOI:10.1016/j.epsl.2005.04.034 |
| [4] | Tang L, Shen C, Liu K, et al. Climatic and hydrological changes in the southeastern Qinghai-Tibet Plateau during the past 18000 years[J].Acta Micropalaeontologica Sinica, 2000, 17:113–124. |
| [5] | Yu G, Tang L, Yang X, et al. Modern pollen samples from alpine vegetation on the Tibetan Plateau[J].Global Ecology and Biogeography, 2001, 10:503–519. |
| [6] | Zhao Y, Yu Z C, Liu X J, et al. Late Holocene vegetation and climate oscillations in the Qaidam basin of the northeastern Tibetan plateau[J].Quaternary Research, 2010, 73:59–69.DOI:10.1016/j.yqres.2008.11.007 |
| [7] | Lu X M, Chen H, Xu Q H. Surface pollen and its relationship to vegetation on the southern slope of the eastern Qilian Mountains[J].Journal of Geographical Sciences, 2006, 16:215–222.DOI:10.1007/s11442-006-0210-3 |
| [8] | Shen C, Liu K, Tang L, et al. Quantitative relationships between modern pollen rain and climate in the Tibetan Plateau[J].Review of Palaeobotany and Palynology, 2006, 140:61–77.DOI:10.1016/j.revpalbo.2006.03.001 |
| [9] | Wei H C, Zheng Z, Ma H Z, et al. Pollen distribution patterns of surface soil sample in Qinghai of China and their relationship with vegetation[J].Arid Land Geograpghy, 2009, 32:932–940. |
| [10] | Herzschuh U, Birks HJB, Mischke S, et al. A modern pollen-climate calibration set based on lake sediments from the Tibetan Plateau and its application to a Late Quaternary pollen record from the Qilian Mountains[J].Journal of Biogeography, 2010, 37:752–766.DOI:10.1111/jbi.2010.37.issue-4 |
| [11] | Wang Y, Herzschuh U, Shumilovskikh LS, et al. Quantitative reconstruction of precipitation changes on the NE Tibetan Plateau since the Last Glacial Maximum:extending the concept of pollen source area to pollen-based climate reconstructions from large lakes[J].Climate of the Past, 2014, 10:21–39.DOI:10.5194/cp-10-21-2014 |
| [12] | Herzschuh U, Birks H J B. Evaluating the indicator value of Tibetan pollen taxa for modern vegetation and climate[J].Review of Palaeobotany and Palynology, 2010, 160:197–208.DOI:10.1016/j.revpalbo.2010.02.016 |
| [13] | Guan Z H, Chen C Y, Qu Y X, et al. River and lakes in Tibet[M].Beijing: Science Press, 1984. |
| [14] | Zhang X S. Vegetation Map of China and Its Geographic Pattern (1:100000)[M].Beijing: Geological Publishing House, 2007. |
| [15] | Moore P D, Webb J A, Collinson M E. Pollen analysis[M], 2nd ed. BlackwellScience, Oxford. 1991. |
| [16] | Wang F X, Qian N F, Zhang Y L, et al. Pollen Flora of China[M].Beijing: Science Press, 1995. |
| [17] | Ma Y Z, Liu K B, Feng Z D, et al. A survey of modern pollen and vegetation along a south-north transect in Mongolia[J].Journal of Biogeography, 2008, 35:1512–1532.DOI:10.1111/jbi.2008.35.issue-8 |
| [18] | Schofielt J E, Edwards K J, McMullen A J. Modern pollen-vegetation relationships in subarctic southern Greenland and the interpretation of fossil pollen data from the Norse landnam[J].Journal of Biogeography, 2007, 34:473–488.DOI:10.1111/jbi.2007.34.issue-3 |
| [19] | Zhang Y, Kong Z C, Wang G H, et al. Anthropogenic and climatic impacts on surface pollen assemblages along a precipitation gradient in north-eastern China[J].Global Ecology and Biogeography, 2010, 19:621–631. |
| [20] | Zhao Y, Li F R, Hou Y T, et al. Surface pollen and its relationships with modern vegetation and climate on the Loess Plateau and surrounding deserts in China[J].Review of Palaeobotany and Palynology, 2012, 181:47–53.DOI:10.1016/j.revpalbo.2012.05.007 |
| [21] | Jongman R H G, Braak C J F, van Tongeren O F R. Data analysis in community and landscape ecology[M]. Cambridge University Press, Cambridge. 1995.https://books.google.com/books/about/Data_Analysis_in_Community_and_Landscape.html?id=Oy8F3oVGPeIC |
| [22] | ter Braak C J F, Smilauer P. CANOCO 4. 5. Biometris[M]. Wageningen University and Research Center, Wageningen, 2002: 500. |
| [23] | Li W Y. Quaternary Vegetation and Environment of China[M].Beijing: Science Press, 1998. |
| [24] | Li Y Y, Zhang X S, Zhou G S. Quantitative relationships between several common pollen taxa and vegetation in the north of China[J].Chinese Science Bulletin, 2000, 45(16):1519–1523.DOI:10.1007/BF02898901 |
| [25] | Yang Z J, Xu Q H, Meng L Y, et al. Quantitative relationship between pollen in the surface soil and vegetation in the Yanshan area[J].Acta Phytoecologica Sinica, 2003, 27(6):804–809. |
| [26] | Weng C Y, Sun X J, Chen Y S. Numerical characteristics of pollen assemblages of surface samples from the West Kunlun Mountains[J].Acta Botanlca Sinica, 1993, 35(1):69–79. |
| [27] | Li Q, Lu H Y, Zhu L P, et al. Pollen-inferred climate changes and vertical shifts of alpine vegetation belts on the northern slope of the Nyainqentanglha Mountains (central Tibetan Plateau) since 8.4 kyr BP[J].The Holocene, 2011, 21(6):939–950.DOI:10.1177/0959683611400218 |
| [28] | Li Y, Xu Q, Yang X, et al. Pollen vegetation relationship and pollen preservation on the northeastern Qinghai-Tibetan Plateau[J].Grana, 2005, 44:160–171.DOI:10.1080/00173130500230608 |
| [29] | Luo C X, Zheng Z, Tarasov P, et al. Characteristics of the modern pollen distribution and their relationship to vegetation in the Xinjiang region, northwestern China[J].Review of Palaeobotany and Palynology, 2009, 153:282–295.DOI:10.1016/j.revpalbo.2008.08.007 |
| [30] | Zhao Y, Herzschuh U. Modern pollen representation of source vegetation in the Qaidam Basin and surrounding mountains, north-eastern Tibetan Plateau[J].Vegetation History and Archaeobotany, 2009, 18:245–260.DOI:10.1007/s00334-008-0201-7 |
| [31] | Herzschuh U. Reliability of pollen ratios for environmental reconstructions on the Tibetan Plateau[J].Journal of Biogeography, 2007, 34:1265–1273.DOI:10.1111/jbi.2007.34.issue-7 |
| [32] | Herzschuh U, Kürschner H, Mischke S. Temper-aturevariabilityand verticalvegetation eltshiftsduringthe last 50000 yrinthe Qilian Mountains (NE margin of the Tibetan Plateau, China)[J].Quaternary Research, 2006, 66:133–146.DOI:10.1016/j.yqres.2006.03.001 |
| [33] | Liu H Y, Cui H T, Pott R, et al. The surface pollen of the woodland-steppe ecotones in southeastern Inner Mongolia, China[J].Review of Palaeobotany and Palynology, 1999, 105:237–250.DOI:10.1016/S0034-6667(98)00074-8 |
| [34] | Liu H Y, Wang Y, Yang S, et al. Climatic and anthropogenic control of surface pollen assemblages in East Asian steppe[J].Review of Palynology and Palaeobotany, 2006, 138(3/4):281–289. |
| [35] | Ren GY. Vegetation development and human activities during the last 3000 years in Korqin Sany Land[J].Scientia Geographica Sinica, 1999, 19(1):42–48. |
