 ,1,3, 乔治军,31
 2
3
4
Developing SSR Markers of Proso Millet Based on Transcriptome Sequencing
CHEN XiaoHong1, HE JieLi2, SHI TianTian1, SHAO HuanHuan1, WANG HaiGang3, CHEN Ling3, GAO ZhiJun4, WANG RuiYun,1,3, QIAO ZhiJun,31 2
3
4
通讯作者:
责任编辑: 李莉
收稿日期:2019-07-25接受日期:2020-02-20网络出版日期:2020-05-16
| 基金资助: |
Received:2019-07-25Accepted:2020-02-20Online:2020-05-16
作者简介 About authors
陈小红,Tel:13466897634;E-mail:13466897634@163.com。
何杰丽,E-mail:15835437045@163.com。

摘要
关键词:
Abstract
Keywords:
PDF (637KB)元数据多维度评价相关文章导出EndNote|Ris|Bibtex收藏本文
本文引用格式
陈小红, 何杰丽, 石甜甜, 邵欢欢, 王海岗, 陈凌, 高志军, 王瑞云, 乔治军. 基于转录组测序开发糜子SSR标记[J]. 中国农业科学, 2020, 53(10): 1940-1949 doi:10.3864/j.issn.0578-1752.2020.10.002
CHEN XiaoHong, HE JieLi, SHI TianTian, SHAO HuanHuan, WANG HaiGang, CHEN Ling, GAO ZhiJun, WANG RuiYun, QIAO ZhiJun.
0 引言
【研究意义】糜子(Panicum miliaceum L.)属于禾本科黍属,为干旱和半干旱地区粟类作物。糜子起源于中国,在亚洲(印度、日本、不丹、土耳其、斯里兰卡、伊朗、孟加拉国、阿富汗和黎巴嫩)、非洲(埃及、马拉维)、欧洲(波兰、英国、罗马尼亚、匈牙利、俄罗斯和乌克兰)、美洲(加拿大、美国、巴西和阿根廷)和大洋洲(澳大利亚、新西兰)均有分布[1,2,3,4,5,6,7,8,9,10]。糜子生育期短、抗旱耐瘠,在干旱环境中具生产优势,是亚洲国家的粮食作物,在欧洲和美国多用于饲鸟。在中国,糜子曾是华北地区的主粮,如今仅在山区和边远地带栽培;年种植面积约32万hm2、产量约30万吨[5]。糜子不仅富含抗性淀粉,可降低血糖和血脂,是保持肠道健康的功能食品;而且还含有木脂素类营养成分,可预防乳腺癌等多种激素依赖型癌症和减少心脏病发生[9];也是乳糜病患者的理想食品。随着全球气温升高,糜子在旱作生态农业建设、种植业结构调整和国家粮食安全保障中起的作用日益突显[2]。目前,全球有糜子种质资源29 000余份,中国占9 850份,搞清其遗传背景是合理高效利用的前提[1, 3]。然而,糜子是异源四倍体,基因组信息复杂,可供准确评估遗传差异的分子标记缺乏,亟待构建一大批SSR以促进糜子作物产业化发展。【前人研究进展】2016年,CAVERS等[7]从称谓、农艺性状描述、经济价值、地理分布、生活习性、栽培驯化史、营养生长、生殖发育、杂交、种群动态、杂草防控、农事操作和病虫害影响等13个方面详细阐述了加拿大糜子作物的研究近况;WANG等[6]介绍了中国糜子生产概况及资源的遗传特性。2017年,王瑞云[3]概括了糜子DNA标记的开发、连锁图谱构建、遗传多样性分析、驯化和传播等;HABIYAREMYE等[4]介绍了美国糜子的栽培现状。2018年,刁现民主编著作《中国现代农业产业可持续发展战略研究·谷子糜子分册》,基于中国糜子的分布和生产,系统探究了糜子生产的分布区域及产业发展历程和现状,翔实总结了糜子育种、种质创新、生物技术、植物保护和食品加工等领域研究前沿,深入剖析了中国糜子的生产形势和产业发展中有待改进的问题,探究了产业发展的重要环节和具体内容,提出了产业结构调整和农业供给侧改革形势下产业发展的战略构想及可行建议[2]。2019年,VETRIVENTHAN等[1]调查了印度国际半干旱热带作物研究所(International Crops Research Institute for the Semi-Arid Tropics,ICRISAT)基因库全球糜子资源农艺性状的多样性,以来自30个国家的849份资源为试验材料,发现糜子平均株高62 cm、穗长209 mm,种子颜色共有11种,获得大粒高产资源2份(IPm2和IPm2661)。上述研究多是基于表型的遗传多样性,应用基因分型准确评估资源的研究偏少[10,11,12,13,14,15,16]。SSR标记在基因组中分布广、含量丰富、具共显性且重复性好,已广泛应用于水稻、小麦等作物的遗传研究[17,18,19,20,21]。就糜子而言,HU等[22]和CHO等[23]分别首次开发了46和25个种非特异性和特异性SSR。RAJPUT等[24]检测548个柳枝稷SSR,发现339个可用于糜子,其中254个呈多态性,分辨率为0.25—14.75(平均2.71)。目前,基于转录组测序挖掘糜子SSR已开展了多项研究[25,26,27,28,29,30,31]。王银月等[25]从4份(3份甘肃和1份山西)糜子资源中挖掘到1 210个SSR,其中116个多态性较高。连帅等[26]用63个标记评估国内外地方品种和野生资源,发现国内资源遗传多样性较国外材料丰富。刘笑瑜等[27]构建了85个可以有效分辨不同基因型的高基元SSR。JIANG等[28]从雁黍5号中发掘出8 139个EST-SSR,验证其中24个,发现21个扩增效果好,3个具多态性,开发效率为87.5%。寇淑君等[29]对11个SSR标记荧光后,利用毛细管电泳技术评估中国糜子的遗传差异,检测出的等位变异数(平均为6.5个)超过传统聚丙烯酰胺凝胶电泳鉴定结果(平均为3个)的2倍。石甜甜等[30]用144个(高、低基元分别为64和80个)SSR评估96份国内外(国内、国外分别为71和25份)糜子资源,发现北方春糜子区材料的遗传多样性较丰富;主成分分析将试材划归6类,均与地理来源一致。何杰丽等[31]检测200个SSR,发现80个呈多态性,开发效率为40%;引物分辨率(Rp)为0.67—4.67(平均值为2.00)。【本研究切入点】较大宗作物而言,作为小杂粮的糜子研究深度不够,尤其是可供利用的SSR欠缺,难以全面而准确分析资源间遗传差异。【拟解决的关键问题】本研究拟开发一批新的糜子特异性标记,明确其引物分辨程度、碱基重复分布状况及遗传参数高低,为准确评估糜子遗传多样性提供有效的分子检测工具。1 材料与方法
1.1 试验材料
试验选用地理来源差异较大的6份糜子材料(表1),待幼苗长至三叶期,取叶片约0.3 g,置于-80℃保存备用。Table 1
表1
表1供SSR引物筛选的糜子材料
Table 1
| 序号 No. | 统一编号 Unicode | 名称 Accession name | 来源 Origin | 生态栽培区 Ecotope |
|---|---|---|---|---|
| 1 | 00000177 | 红糜子Hongmizi | 黑龙江省宁安市 Ning’an, Heilongjiang | 东北春糜子区 Northeast spring-sowing ecotope |
| 2 | 00000750 | 白糜子Baimizi | 新疆沙湾县 Shawan, Xinjiang | 西北春夏糜子区 Northwest spring & summer-sowing ecotope |
| 3 | 00006653 | 金黍Jinshu | 海南省 Hainan | 南方秋冬糜子区 Southern autumn & winter-sowing ecotope |
| 4 | 00007238 | 大红糜子Dahongmizi | 内蒙古巴彦淖尔 Bayanzhuoer, Inner Mongolia | 北方春糜子区 Northern spring-sowing ecotope |
| 5 | 00007478 | 白圪塔糜Baigetami | 青海省湟中县 Huangzhong, Qinghai | 西北春夏糜子区 Northwest spring & summer-sowing ecotope |
| 6 | 红黍子Hongshuzi | 河南省安阳市 Anyang, Henan | 华北夏糜子区 Northern summer-sowing ecotope |
新窗口打开|下载CSV
1.2 试验方法
1.2.1 引物设计 利用Primer Premier 5.0[32]设计引物。1.2.2 DNA提取和PCR扩增 用改良CTAB法[33]提取糜子叶片DNA,用1%琼脂糖凝胶电泳和NanodropND- 1000核酸浓度检测仪分别检测DNA的完整性和浓度,根据A260/A280和A260/A230值判断DNA纯度,A260/A280范围在1.7—1.9,A260/A230>2.0。PCR扩增体系(20 μL)为2×MasterMix10 μL、上下游引物各0.8 μL(终浓度为0.4 μmoL·L-1)、DNA模板1 μL(30—80 ng·μL-1)和ddH2O 7.4 μL。反应程序为94℃ 4 min;94℃ 40 s,退火40 s,72℃ 8 min。
1.2.3 聚丙烯酰胺凝胶电泳检测 根据电泳条带读取多态性,用“1、0”分别表示扩增条带的有和无。
1.3 数据处理
根据公式Rp = ∑Ib,计算标记的分辨率(resolving power,Rp)[34],其中Ib=1-(2×︱0.5-p︱),Ib表示等位基因信息量,p表示等位基因出现的次数。用软件PowerMarker 3.25[35]和PopGen 1.32[36]计算SSR遗传多样性参数。2 结果
2.1 DNA质量和浓度检测
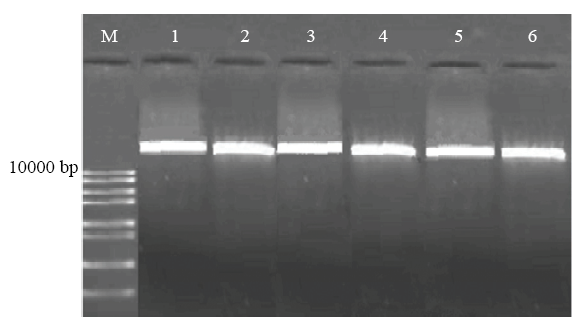
Nanodrop ND-1000核酸浓度检测仪检测到DNA原液浓度为300—2 200 ng·μL-1,检测到A260/A280为1.833—1.905,A260/A230为2.008—2.269。琼脂糖凝胶电泳检测糜子叶片基因组DNA,得到清晰明亮的电泳条带(图1),说明DNA完整、浓度高。图1
 新窗口打开|下载原图ZIP|生成PPT
图1基因组DNA琼脂糖凝胶电泳图
Fig. 1Genetic DNA bands running through agarose gel electrophoresis
2.2 引物的开发
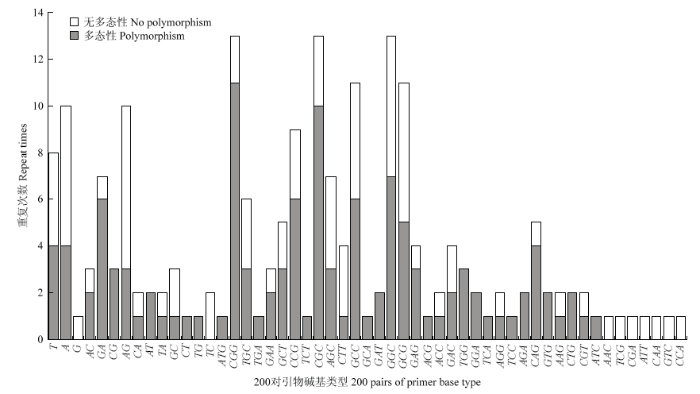
统计200对引物碱基序列重复的分布情况(图2)。单碱基序列重复引物共20个,10个(50%)具多态性(电子附图1);二碱基序列重复引物36个,15个(41.67%)具多态性(电子附图2);三碱基序列重复引物144个,55个(38.19%)具多态性(电子附图3)。图2
 新窗口打开|下载原图ZIP|生成PPT
图2200对引物碱基序列重复分布
Fig. 2Repeat motif distribution of 200 pairs of primer
200对引物碱基类型共53种,数量较多的(>9)有CGG(13)、CGC(13)、GCC(13)、GCC(11)、GCG(11)、A(10)和AG(10)。其中,具多态性的碱基类型有44种,重复数量最多的是CGG(11),无多态性的碱基类型有35种,AG重复数量较多(7)。
2.3 引物筛选及分析
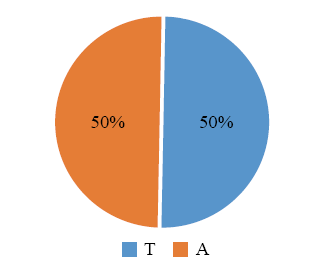
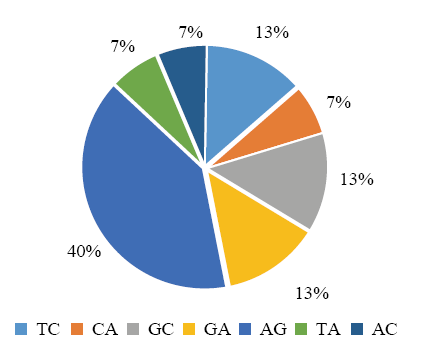
200对SSR引物扩增6份地理来源差异较大的糜子材料,80对引物的扩增条带呈多态性(电子附图1—电子附图3),其中单、二和三碱基序列重复引物分别为10、15和55对(电子附图1—电子附图3)。分析其碱基序列重复类型如下(图3—图5和电子附表1)。从图3和电子附表1可以看出,单碱基引物的重复基元为A(50%)和T(50%);从图4和电子附表1可以看出,二碱基引物碱基重复类型有AG(6)、TC(2)、GC(2)、GA(2)、CA(1)、TA(1)和AC(1)7种,其中AG(40%)数量最多;从图5和电子附表1可以看出,三碱基引物碱基重复类型有24种,包括GGC(7)、GCG(6)、GCC(5)、CGG(4)、TGC(3)、CCG(3)、AGC(3)、CTT(3)、GAA(2)、GCT(2)、CGC(2)、GAG(2)、GAC(2)、ACC(1)、AGG(1)、CAG(1)、CGT(1)、AAG(1)、AAC(1)、TCG(1)、CGA(1)、ATT(1)、CAA(1)和CCA(1),其中GGC、GCG和GCC数量较多(分别占13%、11%和9%)。
图3
 新窗口打开|下载原图ZIP|生成PPT
图3单核苷酸序列重复SSR的类型及分布
Fig. 3Type and distribution of mono-nucleotide motif SSR
图4
 新窗口打开|下载原图ZIP|生成PPT
图4二核苷酸序列重复SSR的类型及分布
Fig. 4Type and distribution of di-nucleotide motif SSR
图5
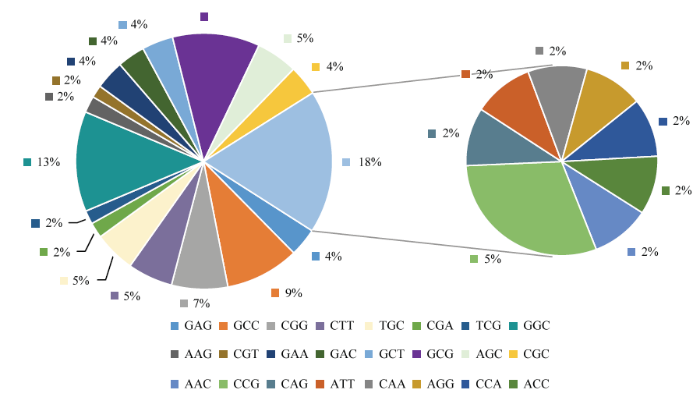 新窗口打开|下载原图ZIP|生成PPT
图5三核苷酸序列重复SSR的类型及分布
Fig. 5Type and distribution of tri-nucleotide motif SSR
2.4 80对引物基元的Rp值分析
从电子附表2可以看出,单碱基重复引物等位基因大小为50—500 bp,条带数为5(RYW150)—12(RYW108)。RYW105的等位基因条带最多(12个),位点范围为50—400 bp。RYW150的条带最少(5个),位点范围为110—500 bp。Rp值的范围为0.67(RYW110)—4.67(RYW107),平均为2.07;$\overline{\text{Rp}}$值介于0.33(RYW110)—0.67(RYW107),平均为0.51。从电子附表3可以看出,二碱基重复引物的等位基因大小为50—500 bp,条带数为6(RYW165)—16(RYW141)。RYW141的等位基因条带最多(16个),位点范围为100—450 bp。RYW165的等位基因条带最少(6个)。引物Rp值为1.33(RYW114和RYW162)—4.33(RYW166),平均为2.73;$\overline{\text{Rp}}$值介于0.40(RYW168)—0.78(RYW113),平均为0.59。
从电子附表4可以看出,三碱基重复引物的等位基因大小为50—500 bp,条带数为5(RYW134)—20(RYW140)。RYW140的条带最多(20个),位点范围为50—500 bp;RYW134的等位基因条带最少(5个),位点范围为50—250 bp。Rp值为0.67(RYW91、RYW98、RYW100、RYW118、RYW126、RYW127和RYW148)—4.00(RYW102和RYW158),平均为1.83;$\overline{\text{Rp}}$值为0.33(RYW91、RYW93、RYW98、RYW100、RYW118、RYW121、RYW126、RYW127和RYW148)—0.83(RYW153),平均为0.59。其中Rp和$\overline{\text{Rp}}$值均为最低的引物有RYW91、RYW98、RYW100、RYW118、RYW126、RYW127和RYW148。
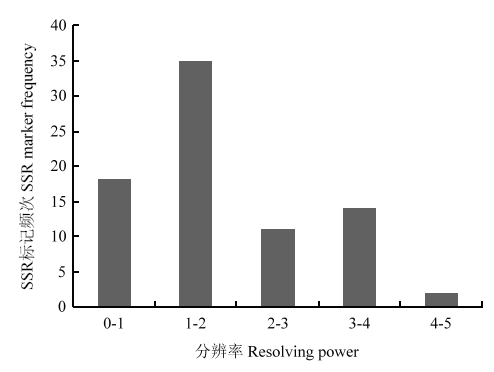
分析80个SSR的分布频次(图6)。Rp值在区间0—1、1—2、2—3、3—4和4—5分别包含17(21.25%)、36(75%)、11(13.75%)、14(17.5%)和2(2.5%)个标记。其中,1—2标记频次最多,4—5标记频次最少。5个标记(RYW107、RYW161、RYW166、RYW115和RYW158)的Rp值信息含量丰富。
图6
 新窗口打开|下载原图ZIP|生成PPT
图680个SSR标记的分辨率(Rp值)
Fig. 6Resolving power values of 80 SSR marker in proso millet
2.5 引物多态性及遗传参数分析
分析各类型引物的多态性及遗传参数(电子附表5—电子附表7)。单碱基序列重复标记的观测等位基因数为2—3个(平均为2.2000),8个位点产生2个变异,2个位点产生3个变异;有效等位基因数为1.8000—2.8800(平均为2.0993);多样性指数为0.6365—1.0776(平均为0.7497);观测杂合度为0.1000—1.0000(平均为0.6567);期望杂合度为0.4848—0.7121(平均为0.5622);Nei's期望杂合度为0.4444—0.6528(平均为0.5122);PIC为0.3750—0.5355(平均为0.4293)。可见RYW150的多态性最丰富,RYW103和RYW109的多态性最低。二碱基序列重复标记的观测等位基因数为2—3个(平均为2.5333),7个位点产生2个变异,8个位点产生3个变异;有效等位基因数为1.6000—3.0000(平均为2.2341);多样性指数为0.5623—1.0986(平均为0.8339);观测杂合度为0.5000—1.0000(平均为0.8444);期望杂合度为0.4091—0.7273(平均为0.4994);Nei's期望杂合度为0.3700—0.6667(平均为0.5373);PIC为0.2392—0.74384(平均为0.4293)。可见RYW168的多态性最丰富,RYW167的多态性最低。
三碱基序列重复标记的观测等位基因数为2—3个(平均为2.4727),29个位点产生2个变异,26个位点产生3个变异;有效等位基因数为1.6000—2.9412(平均为2.2445);多样性指数为0.5623—1.0889(平均为0.8312);观测杂合度为0.5000—1.0000(平均为0.8448);期望杂合度为0.4091—0.7333(平均为0.5967);Nei's期望杂合度为0.3750—0.6600(平均为0.5438);PIC为0.2392—0.7438(平均为0.3989)。可见RYW124和RYW137的多态性最丰富,RYW144多态性最低。
3 讨论
3.1 SSR标记的多态率及开发率
HU等[37]用6个ISJ/长片段随机引物(introns splice junction or long random primers)扩增32份中国糜子主产区的材料,检测到56个DNA片段,其中42个具多态性、遗传一致度介于0.0286—0.4737;聚类结果表明糜子的粳糯性与地理来源有关。HU等[22]首次利用46个糜子非特异性SSR分析中国118份糜子材料,检测到中等水平多态性等位基因226个,每个引物的等位基因数介于2—9,且遗传距离与材料的地理起源呈正相关。但由于标记来自其它作物,通用性低,开发糜子特异性SSR是准确评估糜子遗传多样性的重要环节。CHO等[23]率先构建糜子基因组DNA的SSR文库,筛选143对引物,获得25个多态性标记,多态率为17.5%。2014年以来,基于高通量测序手段挖掘了一大批糜子特异性SSR。王银月等[25]、王璐琳等[15]和刘笑瑜[27]分别开发了116、17和85个标记,多态率分别为9.59%、24.28%和56.3%。本研究构建标记的多态率为40%,低于刘笑瑜[27]的研究结果,可能与后者构建的SSR碱基序列重复为高基元有关;而高于其他研究结果[15, 23, 25],可能与本研究选材来源广、数目多有关。SSR标记开发率是评估构建效率的重要指标。就SSR开发率而言,RAJPUT等[24]和王璐琳等[15]研究结果分别为62%和95.7%,本研究为88.5%,高于RAJPUT等[24]而低于王璐琳等[15]的研究结果,一方面,RAJPUT等[24]发掘的SSR来源于柳枝稷,为非种特异性标记,开发率低于本研究的种特异性标记;另一方面,王璐琳等[15]发掘的SSR为三碱基重复基元,而本研究标记除此外,还包括一、二碱基重复基元,故开发率低于前者。
3.2 SSR的Rp值及遗传多样性衡量参数
就糜子作物SSR的Rp而言,以往研究发现其范围介于1.00—5.75(平均为3.15)、0.334—4.002(平均为1.51)和0.25—14.75(平均为2.71)[13, 24, 27],本研究结果为0.67—4.67(平均为2.00),与上述结果基本一致;而其他植物如苎麻(Boehmeria nivea L. Gaudich.)、密花石斛(Crotalaria)、柽麻(Dendrobium nobile Lindl.)和穿心莲(Andrographis paniculata(Burm. f.)Nees)分别为3.22、6.15、6.59和10.8,均高于糜子,可能与不同物种自身的遗传特性有关[38,39,40,41]。前人研究表明糜子基因多样性指数分别为0.4902、0.6275、0.7708、0.6284和0.8478,PIC值分别为0.4321、0.4855、0.4723、0.5544和0.5874[15, 26-27, 13, 29],本研究检测到这两个指标分别为0.8215和0.4215,与以往结果基本相符。
3.3 SSR的碱基组成
迄今糜子中已经开发出一些SSR,其中二、三碱基重复引物占比分别为13%—87.9%和12.01%—87%[23,24,25],本研究结果为18.75%和68.75%,与以往结果相符;而以往研究开发的高基元引物占比仅为9.77%[23],可见糜子中开发的SSR多为低基元重复。王银月等[25]筛选1210对引物得到116个多态性SSR,二、三碱基重复的分别为102和14个,其中AC、GA、AG、CA、TC、AAC、CAA、CAG、CGG和AAG与本研究结果一致;另外,本研究还发现碱基重复类型T、A、GC、TA、GAG、GCC、CTT、TGC、CGA、TCG、GGC、CGT、GAA、GAC、GCT、GCG、AGC、CGC、CCG、ATT、AGG、CCA和ACC,王银月等[25]还检测到重复类型GT、CT、TG、ACA、AGA、AGT和CCT,上述重复类型差异可能与研究材料不同有关。
研究发现,SSR重复基序中A/T较普遍,而G/C发生频率低,这可能与打破G—C的3个氢键比A—T的2个氢键需要更高能量有关[42,43,44]。本研究基于转录组测序获得的200对SSR引物中,单碱基序列重复基元有20个,19个为A/T碱基重复;筛选出的80个多态性标记中,单碱基序列重复基序类型都是A/T,与前人研究结果基本一致[42, 44-45]。
4 结论
用6份地理来源差异较大的糜子材料检测200对SSR引物,发现177对(88.5%)可扩增出完整条带,其中80对扩增条带具多态性,多态率为40%。参考文献 原文顺序
文献年度倒序
文中引用次数倒序
被引期刊影响因子
[本文引用: 3]
[本文引用: 3]
[本文引用: 3]
[本文引用: 3]
[本文引用: 3]
[本文引用: 2]
[本文引用: 2]
[本文引用: 2]
[本文引用: 2]
[本文引用: 1]
[本文引用: 2]
DOI:10.1177/0959683618798116URL [本文引用: 2]
[本文引用: 1]
[本文引用: 1]
[本文引用: 3]
[本文引用: 3]
[本文引用: 1]
[本文引用: 1]
[本文引用: 7]
[本文引用: 7]
[本文引用: 1]
[本文引用: 1]
[本文引用: 1]
DOI:10.3864/j.issn.0578-1752.2013.02.002URL [本文引用: 1]

【目的】分析大麦亲本材料的遗传多样性,寻找与部分农艺性状相关联的分子标记,为大麦杂交组合的配置及分子标记辅助育种提供依据。【方法】利用86个SSR标记对113份大麦亲本材料进行多态性扫描,并进行遗传多样性分析。挑选57个标记进行群体遗传结构分析,在此基础上采用Tassel 2.1 GLM(general linear model)和MLM(mixed linear model)方法进行标记与农艺性状的关联分析。【结果】86个标记共检测出200个等位变异,变异范围为1—5个;基因频率的变异范围为0.0088—1.0000,Shannon指数变异范围为0.0000—1.2236;遗传相似系数(GS)变异范围在0.5504—0.9897,平均值为0.7477。通过群体遗传结构分析将供试材料分为4个亚群。以GLM分析,发现9个与株高、穗长、芒长、穗粒数和小穗着生密度相关联的标记,各标记对表型变异的解释率在0.0507—0.2766;以MLM分析,发现6个与株高、芒长和小穗着生密度相关的标记,各标记对表型变异的解释率在0.0238—0.1999。【结论】利用SSR标记分析了113份大麦亲本材料的遗传多样性及群体遗传结构,并通过2种关联分析模型,分别寻找到了9个与株高、穗长、芒长、穗粒数相关联,6个与株高、芒长和小穗着生密度相关联的标记,这些标记位于1H、2H、3H、4H和7H染色体。
DOI:10.3864/j.issn.0578-1752.2013.02.002URL [本文引用: 1]
【目的】分析大麦亲本材料的遗传多样性,寻找与部分农艺性状相关联的分子标记,为大麦杂交组合的配置及分子标记辅助育种提供依据。【方法】利用86个SSR标记对113份大麦亲本材料进行多态性扫描,并进行遗传多样性分析。挑选57个标记进行群体遗传结构分析,在此基础上采用Tassel 2.1 GLM(general linear model)和MLM(mixed linear model)方法进行标记与农艺性状的关联分析。【结果】86个标记共检测出200个等位变异,变异范围为1—5个;基因频率的变异范围为0.0088—1.0000,Shannon指数变异范围为0.0000—1.2236;遗传相似系数(GS)变异范围在0.5504—0.9897,平均值为0.7477。通过群体遗传结构分析将供试材料分为4个亚群。以GLM分析,发现9个与株高、穗长、芒长、穗粒数和小穗着生密度相关联的标记,各标记对表型变异的解释率在0.0507—0.2766;以MLM分析,发现6个与株高、芒长和小穗着生密度相关的标记,各标记对表型变异的解释率在0.0238—0.1999。【结论】利用SSR标记分析了113份大麦亲本材料的遗传多样性及群体遗传结构,并通过2种关联分析模型,分别寻找到了9个与株高、穗长、芒长、穗粒数相关联,6个与株高、芒长和小穗着生密度相关联的标记,这些标记位于1H、2H、3H、4H和7H染色体。
URL [本文引用: 1]
【Objective】Annual wild soybeans (Glycine soja), the ancestors of cultivated soybean (G. max), are important sources of major genes for resistance to pests, diseases and environmental stresses. The study of genetic diversity is invaluable for efficient utilization and conservation of annual wild soybeans.【Method】Genetic diversity of 544 accessions of annual wild soybeans, collected from Shanxi province, was evaluated by the traits of qualitative, quantitative and SSR molecular markers.【Results】Of 8 qualitative traits, the distribution of Shannon-weaver index and PIC were 0.0243-1.1814 and 0.0073-0.6582, with the mean of 0.5965 and 0.3262, respectively. The leaf shape value was the highest one of the Shannon-weaver index and the stem type value was the largest one of the PIC, while the cotyledon color value was the lowest in both. Of 4 quantitative traits, coefficients of variation were 99.40%, 24.63%, 13.49% and 5.70% for 100-seed weight, oil content, days to maturity and protein content, respectively; and the materials in 37-38W×112-113E plots were richest in accessions (190) and genetic diversity (1.9308). In 53 accessions, 218 alleles were found in 30 loci, with each locus having a mean of 7.27 alleles; and the mean of genetic diversity index was 1.5431,with a range of 0.7869~2.1561; while the mean of PIC was 0.6432, with a range of 0.3164~0.8637.【Conclusion】Of 8 qualitative traits and 4 quantitative traits, there was no correlation between genetic diversity index (shannon-weaver) and longitude or latitude (︱r︱=0.77 and ︱r︱=0.08,P﹥0.05) in Shanxi’s wild soybean. Based on the results of SSR analysis, Shanxi’s wild soybean, with high genetic diversity, was clustered into 5 groups, which showed some rules in the geographical distribution.
[本文引用: 1]
[本文引用: 1]
[本文引用: 1]
DOI:10.1016/S1673-8527(08)60139-3URL [本文引用: 2]
[本文引用: 5]
DOI:10.4236/ajps.2014.51023URL [本文引用: 6]
[本文引用: 7]
[本文引用: 7]
DOI:10.3864/j.issn.0578-1752.2016.17.002URL [本文引用: 3]
【Objective】The objective of this study is to assess the genetic diversity of broomcorn millet accessions which collected from China and abroad.【Method】Five hundred pairs of SSR primers developed in the authors’ laboratory by high-throughput sequencing were used to identify polymorphisms in six representatives randomly selected from the total of accessions. A total of 63 primer pairs produced clear and reproducible polymorphic fragments among the six accessions and then were used to analyze the genetic diversity and relationship of 192 broomcorn millet landraces and wild accessions.【Result】A total of 161 alleles were detected with an average of 2.56 alleles per locus, and the mean Shannon-Weaver index (I), mean Nei and mean PIC were 0.6275, 0.3874 and 0.4855, respectively. The results indicated that there is a significant difference among the 10 populations of broomcorn millet resources in genetic diversity from diverse geographic origins. The variance range of effective alleles number is 1.2407 (South region) - 1.8846 (Inner Mongolia). In domestic populations, the rank of Shannon-Weaver index is Inner Mongolia Plateau>Tohoku>Loess Plateau>Northwest>southern regions, and the rank of foreign populations is the former Soviet Union>Europe>Mongolia>India>United States. The results of Nei’s genetic heterozygosity analysis showed that the minimum and maximum of observed (Ho) and expected heterozygosity (He) is 0.2372 from India and 0.3966 from Inner Mongolia as well as 0.3114 from the Unite State and 0.4622 from Inner Mongolia Plateau, respectively. The effective number of alleles (1.9285±0.5101), Shannon-Weaver index (0.6948±0.2852) and Nei gene diversity index (0.4373±0.1773) of the wild germplasm are much higher which in domestic and foreign accessions. For domestic population and alien population, the effective number of alleles (1.8145±0.4519) of domestic resources, Shannon-Weaver index (0.6657±0.2413), and Nei gene diversity index (0.412± 0.1574) of domestic accessions were higher than that in foreign resources (1.6862±0.4527, 0.5897±0.2469, 0.3652±0.1655). UPGMA cluster analysis showed that the 10 geographic populations could be clustered into three categories, the accessions from the Inner Mongolia Plateau, the Loess Plateau, northeast, northwest, Mongolia area were clustered as one group, the former Soviet Union, the United States, India, Europe together as one group, and southern region of China clustered as one independent group. The wild millet (34) which is from Qiqihaer is separated from others at 0.37, the wild millet from Gansu (19) was divided into an independent individual at 0.34, indicating that there are significant genetic variances between the two wild accessions and others. In general, genetic division of population is not significant for 192 domestic and foreign accessions, and there have material interpenetration among different groups.【Conclusion】The Inner Mongolian Plateau, northeast area and the Loess Plateau with the most abundant genetic diversity is the most complex area of genetic relationship, which further confirms that China is the origin center of Panicum miliaceum.
[D].
[本文引用: 6]
[D].
[本文引用: 6]
[本文引用: 2]
DOI:10.3864/j.issn.0578-1752.2019.09.001URL [本文引用: 3]
【Objective】Genetic diversity and population genetic structure of 131 broomcorn millet accessions in China were analyzed based on fluorescently labeled SSR markers for variety improvement and germplasm innovation as well as effective utilization of broomcorn millet germplasm.【Method】Six broomcorn millet accessions with phenotypical diversity from different geographical origins were used to select SSR markers with highly polymorphism by denaturing polyacrylamide gel electrophoresis. The polymorphic markers were labeled with four fluorescent dyes: 6-FAM, HEX, ROX and TAMRA at the 5' end of forward primers which used in subsequent analyses. The size of each allele locus was determined by DNA Analyzer to estimate the genetic diversity and genetic population structure of the tested accessions. 【Result】 Twenty-two polymorphic and stably amplifying markers were selected for both traditional denaturing PAGE electrophoresis detection and fluorescent SSR labeling-automatic analysis technology. A total of 128 alleles were detected with an average of 5.82 alleles per locus, the gene diversity index, polymorphism information content and Shannon's information index ranged from 0.3572 to 0.8132, 0.2934 to 0.8150 and 0.5427 to 1.7681, respectively, with an average of 0.6284, 0.5874 and 1.2062 respectively. Genetic distance and genetic identity of accessions from different ecotypes were 0.0764-0.7251 (average value is 0.3121) and 0.4843-0.9265 (average value is 0.7465), respectively, the smallest genetic distance was found between NSP ecotype and LPSS ecotype. UPGMA cluster analysis showed that NSP ecotype and LPSS ecotype were clustered into one group. The clustering result of the cultivars and landraces from NES ecotype was consistent, the cultivars from LPSS ecotype were divided into different groups. By plotting the relationship between K and ΔK, ΔK is the largest when K=4. Based on K and △K values, 131 broomcorn millet accessions were grouped four genotypes by the population genetic structure analysis. Group Ⅰ is composed of NSP ecotype. Group Ⅱ consist of NES ecotype. Most accessions of group Ⅲ are from NSP ecotype. Group Ⅳ mainly contain LPSS ecotype. Most of the accessions in same group have same genetic component while only a few accessions contained genetic component of other groups. The analysis result of population genetic structure was consistent with the UPGMA clustering, indicating that the genetic diversity is related to geographical region. 【Conclusion】 There have more abundant genetic diversity in NSP and LPSS ecotype than other regions. The cultivars of NES ecotype were bred mainly from the landraces. The cultivars of LPSS ecotype were introduced from a wide range of resources during the breeding process, harboring genetic exchanges with other ecological regions.
[本文引用: 2]
[本文引用: 2]
[本文引用: 2]
[本文引用: 2]
[本文引用: 1]
[本文引用: 1]
[本文引用: 1]
[本文引用: 1]
DOI:10.1093/bioinformatics/bti282URL [本文引用: 1]
[本文引用: 1]
[本文引用: 1]
DOI:10.1016/j.mgene.2015.01.003URL [本文引用: 1]
DOI:10.1016/j.bse.2016.02.032URL [本文引用: 1]
DOI:10.1016/j.gene.2013.07.096URL [本文引用: 1]
Genetic variability in the wild genotypes of Dendrobium nobile Lindl. collected from different parts of Northeast India, was analyzed using a Start Codon Targeted (SCoT) marker system. A total of sixty individuals comprising of six natural populations were investigated for the existing natural genetic diversity. One hundred and thirty two (132) amplicons were produced by SCoT marker generating 96.21% polymorphism. The PIC value of the SCoT marker system was 0.78 and the Rp values of the primers ranged between 4.43 and 7.50. The percentage of polymorphic loci (Pp) ranging from 25% to 56.82%, Nei's gene diversity (h) from 0.08 to 0.15 with mean Nei's gene diversity of 028, and Shannon's information index (I) values ranging from 0.13 to 0.24 with an average value of 0.43 were recorded. The gene flow value (0.37) and the diversity among populations (0.57) demonstrated higher genetic variation among the populations. Analysis of molecular variance (AMOVA) showed 43.37% of variation within the populations, whereas 56.63% variation was recorded among the populations. Cluster analysis also reveals high genetic variation among the genotypes. Present investigation suggests the effectiveness of SCoT marker system to estimate the genetic diversity of D. nobile and that it can be seen as a preliminary point for future research on the population and evolutionary genetics of this endangered orchid species of medicinal importance. (C) 2013 Elsevier B.V.
[本文引用: 1]
[D].
[本文引用: 2]
[D].
[本文引用: 2]
[本文引用: 1]
DOI:10.1007/s11033-011-1338-5URL [本文引用: 2]
[D].
[本文引用: 1]
[D].
[本文引用: 1]
