 ,, 李鑫格, 王雪, 刘小军, 田永超, 朱艳, 曹卫星, 曹强,*南京农业大学国家信息农业工程技术中心 / 智慧农业教育部工程研究中心 / 农业农村部农作物系统分析与决策重点实验室 / 江苏省信息农业重点实验室, 江苏南京 210095
Nitrogen demand characteristics with different grain yield levels for wheat after rice
DU Yu-Xiao,, LI Xin-Ge, WANG Xue, LIU Xiao-Jun, TIAN Yong-Chao, ZHU Yan, CAO Wei-Xing, CAO Qiang,*National Engineering and Technology Center for Information Agriculture, Nanjing Agricltural University / Engineering and Research Center for Smart Agriculture, Ministry of Education / Key Laboratory for Crop System Analysis and Decision Making, Ministry of Agriculture and Rural Affairs / Jiangsu Key Laboratory for Information Agriculture, Nanjing 210095, Jiangsu, China通讯作者:
收稿日期:2020-03-26接受日期:2020-07-2网络出版日期:2020-11-12
| 基金资助: |
Received:2020-03-26Accepted:2020-07-2Online:2020-11-12
| Fund supported: |
作者简介 About authors
E-mail:

摘要
关键词:
Abstract
Keywords:
PDF (506KB)元数据多维度评价相关文章导出EndNote|Ris|Bibtex收藏本文
本文引用格式
杜宇笑, 李鑫格, 王雪, 刘小军, 田永超, 朱艳, 曹卫星, 曹强. 不同产量水平稻茬小麦氮素需求特征研究[J]. 作物学报, 2020, 46(11): 1780-1789. doi:10.3724/SP.J.1006.2020.01027
DU Yu-Xiao, LI Xin-Ge, WANG Xue, LIU Xiao-Jun, TIAN Yong-Chao, ZHU Yan, CAO Wei-Xing, CAO Qiang.
小麦是我国重要的粮食作物之一, 随着人们对粮食需求的不断增加, 提高小麦产量与品质对于保障国家粮食安全具有极其重要的意义。氮素对小麦产量和品质的形成至关重要。然而, 农民习惯施氮量远高于小麦实际氮素需求量, 造成作物需求与氮素供给不匹配, 氮肥利用效率降低, 且增施氮肥对小麦的增产作用明显减小, 不能充分发挥作物产量潜力[1], 而农业环境问题却日渐突出。如何在确保作物高产优质的同时提高资源利用效率并降低对环境的影响, 是目前迫切需要解决的重点和难点[2,3]。
小麦的氮素需求规律受作物遗传特征、农田气候环境、土壤理化特性以及田间管理技术等因素的综合影响[4]。前人研究表明, 不同产量水平的小麦氮积累量具有显著差异[5,6]。于振文等[7]研究发现, 黄淮麦区小麦单位籽粒需氮量为23.7~34.0 kg t-1, 对应产量范围为6.3~9.8 t hm-2。而当产量高于9 t hm-2, 其单位籽粒需氮量为26.3~31.3 kg t-1, 在超高产条件下小麦需氮量呈先增加后降低趋势[8]。氮肥施用量影响小麦植株氮素累积, 高氮条件下的植株氮积累量高于低氮, 施氮量过高易造成小麦氮素奢侈吸收, 反之, 氮肥亏缺会限制小麦氮素累积[9,10,11]。有不少研究表明, 籽粒氮浓度与产量间具有较强的负相关关系, 随着产量的提高, 单位籽粒需氮量会逐渐下降。如何平衡小麦产量与氮素吸收之间的关系, 是获得高产优质小麦的重要研究方向[11,12,13]。不同产量水平小麦的氮浓度、收获指数和氮收获指数等均有较大差异, 也对小麦的养分吸收产生重要影响[14]。前人对如何诊断小麦田间氮素营养状况的研究较多, 多数研究者认为氮营养指数是快速准确诊断小麦植株氮素营养状况的优良指标, 对田间氮肥的施用具有指导作用[15,16,17]。小麦氮素需求特征的研究主要集中在北方旱茬麦区, 对长江中下游的稻茬小麦研究较少。因此, 明确长江中下游地区不同产量水平稻茬小麦的氮素需求, 阐明各氮素指标变化特征, 对小麦施肥管理及保障农田生态环境具有重要意义[18]。
1 材料与方法
1.1 数据来源
本研究所用数据来源于2010—2019年在江苏省开展的多年多点不同品种、氮肥水平以及播期播量的小麦田间试验, 共有171个数据。试验前茬作物均为水稻, 供试品种均为江苏省主栽小麦品种。氮肥基追比为5∶5, 追肥时期为拔节期。钾肥和磷肥作为基肥在播种前全部施用。其余栽培管理同一般高产田。所用数据的相关试验详情如表1和表2所示。Table 1
表1
表1各试验设计与产量范围
Table 1
| 地点Location | 试验年份Year | 品种 Cultivar | 播期(月/日) Sowing date (month/day) | 氮肥 Nitrogen rate (kg hm-2) | 密度 Density (×104 hm-2) | 产量范围 Range of yield (t hm-2) |
|---|---|---|---|---|---|---|
| 仪征市 Yizheng | 2010-2011 | 扬麦16 Yangmai 16 | 10/15, 10/25, 11/4, 11/14, 11/24 | 225 | 135, 180, 270, 315 | 5.1-8.3 |
| 徐州市 Xuzhou | 2013-2014 | 徐麦30, 济麦22 Xumai 30, Jimai 22 | 10/15 | 0, 90, 180, 270, 375 | 240 | 3.4-8.9 |
| 如皋市 Rugao | 2013-2014 | 宁麦13, 徐麦30 Ningmai 13, Xumai 30 | 10/28 | 0, 75, 150, 225, 300 | 225 | 2.9-9.1 |
| 兴化市 Xinghua | 2018-2019 | 镇麦12, 宁麦13, 扬麦23 Zhenmai 12, Ningmai 13, Yangmai 23 | 11/1 | 0, 90, 180, 270, 360 | 225 | 2.8-7.4 |
| 兴化市 Xinghua | 2018-2019 | 扬麦23 Yangmai 23 | 11/4, 11/24, 12/1 | 0, 180, 270, 360 | 180, 270, 360 | 2.9-8.5 |
新窗口打开|下载CSV
Table 2
表2
表2小麦生育期降雨量和试验田块土壤基础理化指标
Table 2
| 地点Location | 试验年份Year | 全氮 Total N (g kg-1) | 碱解氮Available N (mg kg-1) | 速效磷Available P (mg kg-1) | 速效钾Available K (mg kg-1) | 有机质 Organic matter (g kg-1) | 磷肥施用量 P rate (kg hm-2) | 钾肥施用量 K rate (kg hm-2) | 生育期降水量 Rainfall (mm) |
|---|---|---|---|---|---|---|---|---|---|
| 仪征市 Yizheng | 2010-2011 | 1.27 | 112.48 | 45.63 | 89.39 | 20.50 | 120 | 135 | 1172.4 |
| 如皋市 Rugao | 2013-2014 | 2.49 | 170.48 | 52.63 | 93.48 | 30.50 | 120 | 120 | 1387.0 |
| 徐州市 Xuzhou | 2013-2014 | 1.55 | 122.53 | 45.83 | 80.72 | 35.50 | 135 | 135 | 695.6 |
| 兴化市 Xinghua | 2018-2019 | 1.37 | 102.86 | 28.89 | 120.59 | 18.68 | 105 | 120 | 492.4 |
新窗口打开|下载CSV
1.2 样品处理与分析方法
小麦植株干物质积累量: 在小麦起身期、拔节期、开花期、成熟期等关键生育期进行破坏性取样, 每个小区内随机取20株, 去掉根, 将茎叶穗等器官分开装袋, 于105℃杀青30 min, 80℃烘至恒重后称重, 计算出单位土地面积的地上部干物质积累量。各器官干物重(t hm-2) = 干物重(g)/单茎数×分蘖数(m-2)/100
植株干物重(t hm-2) = 茎干物重(t hm-2)+叶干物重(t hm-2)+穗干物重(t hm-2)
植株氮浓度: 将称完重的样品用磨样机粉碎, 用万分之一天平称取磨好的小麦样品0.1500 g, 在消煮炉中进行消煮, 之后通过流动分析仪, 使用凯氏定氮法测定小麦茎、叶、穗的氮素含量。氮浓度计算公式为:
氮浓度(%) = N-measured×定容体积/0.1500 g×100
植株氮浓度(%) = [(茎干物重(t hm-2)×茎氮浓度(%)+叶干物重(t hm-2)×叶氮浓度(%)+穗干物重(t hm-2)×穗氮浓度(%)]/[(茎干物重(t hm-2)+叶干物重(t hm-2)+穗干物重(t hm-2)]
其中, N-measured指流动分析仪测得的结果, 定容体积为0.1 L。
植株氮积累量: 获得的地上部各器官干物质积累量与植株各器官氮含量的乘积即氮积累量。各器官的氮积累量之和为植株氮积累量。计算公式为:
氮积累量(kg hm-2) = 氮浓度(%)×干物重(t hm-2)×10
植株氮积累量(kg hm-2) = 茎氮积累量(kg hm-2)+叶氮积累量(kg hm-2)+穗氮积累量(kg hm-2)
收获指数: 籽粒干重与地上部干物重的比值。计算公式为:
收获指数 = 籽粒产量(t hm-2)/成熟期干物质积累量(t hm-2)
氮收获指数: 籽粒中的氮积累量与地上部植株氮积累总量的比值。计算公式为:
氮收获指数=籽粒氮积累量(kg hm-2) /成熟期植株氮积累量(kg hm-2)
单位籽粒需氮量: 生产1 t籽粒产量, 小麦植株的氮素积累量。计算公式为:
单位籽粒需氮量(kg t-1) = 植株氮积累量(kg hm-2) /籽粒产量(t hm-2)
临界氮浓度: 达到地上部生物量所需的最小氮浓度[19], 根据赵犇等[15]提出的公式进行计算:
NC = 4.33×PDM-0.45
Nc代表临界氮浓度, PDM代表植株干物重。
氮营养指数(NNI)是实际氮浓度(Na)与临界氮浓度(Nc)的比值, 根据Lemair等[17]提出的公式进行计算:
NNI = Na/Nc
NNI=1代表氮营养处于最佳状态, NNI<1表明氮营养供应不足, NNI>1表明氮营养供应充足甚至过量。
1.3 数据处理
本研究的样本数据分为4个产量水平: 低产水平<4.5 t hm-2, 4.5 t hm-2≤中低产水平<6.0 t hm-2, 6.0 t hm-2≤中产水平<7.5 t hm-2, 高产水平≥7.5 t hm-2。用Origin 2018进行数据分析和作图, 用IBM SPSS Statistic 25统计软件进行单因素方差分析。2 结果与分析
2.1 数据分布
本研究中稻茬小麦产量变化范围为2.7~9.1 t hm-2, 平均产量为6.4 t hm-2 (表3)。比2017年我国小麦平均产量(5.5 t hm-2)高16.4%, 比2017年世界小麦平均产量(3.5 t hm-2)高82.9%。Table 3
表3
表3不同产量水平样本描述性统计分析
Table 3
| 产量水平 Yield level (t hm-2) | 样本容量Sample size | 平均值Mean | 标准差 SD | 最小值 Min. | 25%分位25% Q | 中间值 Median | 75%分位 75% Q | 最大值 Max. |
|---|---|---|---|---|---|---|---|---|
| 低产<4.5 Low yield <4.5 | 26 | 3.5 | 0.5 | 2.7 | 3.0 | 3.5 | 4.0 | 4.5 |
| 4.5≤中低产<6.0 4.5≤low-middle yield <6.0 | 33 | 5.3 | 0.4 | 4.5 | 5.0 | 5.4 | 5.7 | 6.0 |
| 6.0≤中产<7.5 6.0≤ middle yield <7.5 | 64 | 6.9 | 0.4 | 6.1 | 6.6 | 6.9 | 7.2 | 7.5 |
| 高产≥7.5 High yield ≥7.5 | 48 | 8.1 | 0.4 | 7.5 | 7.8 | 8.1 | 8.5 | 9.1 |
| 总计 Total | 171 | 6.4 | 1.6 | 2.7 | 5.4 | 6.7 | 7.6 | 9.1 |
新窗口打开|下载CSV
2.2 稻茬小麦氮素需求随产量变化特征
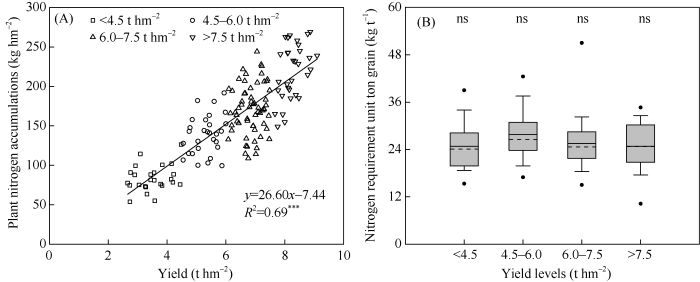
小麦植株氮积累量与籽粒产量呈显著线性正相关, y = 26.60x - 7.44。69%的小麦籽粒产量的提高归因于植株氮积累量的增加(图1-A)。本研究中, 低产、中低产、中产和高产的单位籽粒需氮量分别为24.8、27.8、25.5和25.7 kg t-1 (图1-B), 不同产量水平间无显著差异。图1
 新窗口打开|下载原图ZIP|生成PPT
图1籽粒产量与植株氮积累量的关系(A)和不同产量水平单位籽粒需氮量(B)
图(A)中实线表示拟合曲线, ***显著性为P < 0.001; 图(B)中实线表示平均值, 虚线表示中值, 箱型边界表示75%和25%的四分位数, 上下边缘表示90和10百分位数, 圆点表示最大值和最小值, ns代表不同产量水平间无显著差异(P < 0.05)。
Fig. 1Relationship between grain yield and plant nitrogen accumulation (A) and nitrogen requirement per ton grain with different yield levels (B)
The solid lines in Fig. A represent the fitting curve, *** indicates significantly difference at P < 0.001; the solid and dashed lines indicate mean and median, respectively in Fig. B. The box boundaries indicate the 75% and 25% quartiles, the whisker caps indicate 90th and 10th percentiles, and the dots indicate the maximum and minimum, and the ns represents that there was no significant difference among different yield levels (P < 0.05).
2.3 不同产量水平稻茬小麦植株干物质积累量、植株氮积累量和氮浓度变化特征
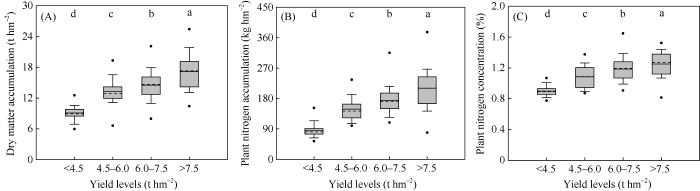
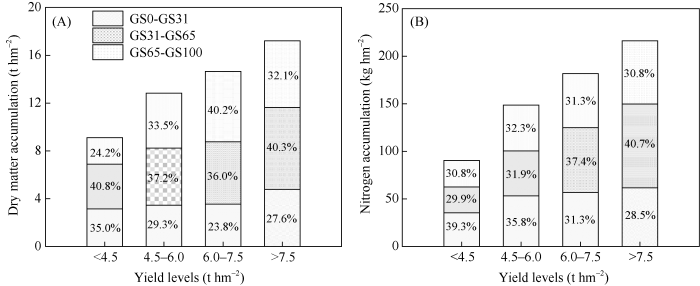
不同产量水平小麦植株干物质积累量、氮积累量和氮浓度, 随着产量水平的提高呈增加趋势(图2)。收获期, 不同产量水平的干物质积累量分别为9.1、13.2、14.5和17.2 t hm-2, 植株氮积累量分别为85.9、148.4、174.3和210.3 kg hm-2, 植株氮浓度分别为0.90%、1.08%、1.18%和1.25%, 且不同产量水平间均有显著差异。通过分析不同生育阶段植株干物质积累量和氮积累量占成熟期总积累量的比例(图3)可知, 从低产到中产播种—拔节期和拔节—开花期阶段的干物质积累占比逐渐降低, 而在开花—成熟期阶段的占比逐渐上升, 而中产到高产则呈相反趋势。对于氮积累量而言, 从低产到高产播种—拔节期阶段的占比逐渐降低, 拔节—开花期阶段的占比逐渐提高; 而开花—成熟期阶段的占比呈先提高后降低趋势。不同阶段的干物质积累量和氮积累量逐渐增加。图2
 新窗口打开|下载原图ZIP|生成PPT
图2不同产量水平下干物质积累量(A)、植株氮积累量(B)和植株氮浓度(C)的变化规律
图中实线表示平均值, 虚线表示中值, 箱型边界表示75%和25%的四分位数, 上下边缘表示90和10百分位数, 圆点表示最大值和最小值, 同一图片中的不同小字母(a, b, c, d)表示产量水平间有显著差异(P < 0.05)。
Fig. 2Variation of dry matter accumulation (A), plant nitrogen accumulation (B), and plant nitrogen concentration (C) at maturity at different yield levels in wheat
The solid and dashed lines indicate mean and median, respectively. The box boundaries indicate the 75% and 25% quartiles, the whisker caps indicate 90th and 10th percentiles, and the dots indicate the maximum and minimum, different small letters (a, b, c, d) in the same figure represent that there was significant difference in different yield levels (P < 0.05).
图3
 新窗口打开|下载原图ZIP|生成PPT
图3不同产量水平不同生育阶段干物质积累量(A)和氮积累量(B)占成熟期总积累量的百分比
图中GS0代表播种期, GS31代表拔节期, GS65代表开花期, GS100代表成熟期。
Fig. 3Dry matter accumulation (A) and plant nitrogen accumulation (B) of different period as a percentage of the total at maturity with different yield levels
GS0 indicates sowing stage, GS31 indicates jointing stage, GS65 indicates flowering stage, and GS100 indicates maturity stage.
2.4 不同产量水平稻茬小麦氮收获指数、收获指数、籽粒和秸秆氮浓度变化特征
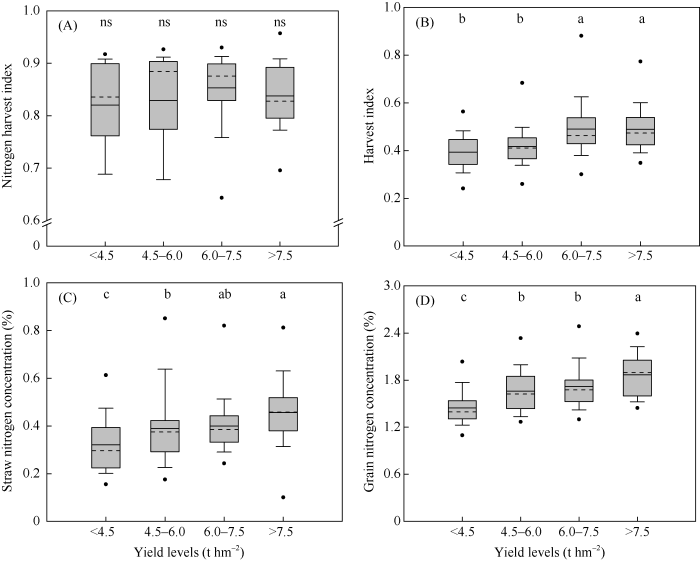
不同产量水平的氮收获指数均值分别为0.82、0.83、0.85和0.84, 且不同产量水平间差异不显著(图4)。不同产量水平的收获指数分别为0.39、0.42、0.49和0.49, 呈现逐渐上升趋势, 且中产和高产的收获指数显著高于低产和中低产。随着产量水平的提高, 秸秆氮浓度和籽粒氮浓度均逐渐提高, 秸秆氮浓度分别为0.32%、0.39%、0.41%和0.46%, 且除中产外, 其余产量水平间均有显著差异。不同产量水平的籽粒氮浓度分别为1.44%、1.66%、1.72%和1.87%, 中产和中低产间无显著差异, 其余产量水平均有显著差异, 即高产水平显著高于中产和中低产, 中产和中低产显著高于低产的籽粒氮浓度。图4
 新窗口打开|下载原图ZIP|生成PPT
图4不同产量水平下氮收获指数(A)、收获指数(B)、秸秆氮浓度(C)和籽粒氮浓度(D)的变化规律
图中实线表示平均值, 虚线表示中值, 箱型边界表示75%和25%的四分位数, 上下边缘表示90和10百分位数, 圆点表示最大值和最小值, 同一图片中的不同小字母(a, b, c, d)表示产量水平间显著差异, ns表示4个产量水平间无显著差异(P < 0.05)。
Fig. 4Variation of nitrogen harvest index (A), harvest index (B), straw nitrogen concentration (C), and grain nitrogen concentration (D) with different yield levels
The solid and dashed lines indicate mean and median, respectively. The box boundaries indicate the 75% and 25% quartiles, the whisker caps indicate 90th and 10th percentiles, and the dots indicate the maximum and minimum, different small letters (a, b, c, d) in the same figure represent that there was significant difference in different yield levels, and the ns represent that there was no significant difference among different yield levels (P < 0.05).
2.5 不同产量水平稻茬小麦氮营养指数变化特征
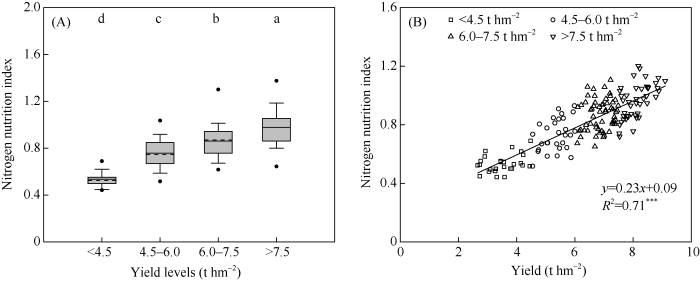
本研究基于赵犇等[15]建立的小麦临界氮浓度稀释曲线计算得出氮营养指数。由图5可知, 产量与氮营养指数呈线性正相关关系(R2 = 0.71), 不同产量水平的氮营养指数分别为0.53、0.76、0.86和0.98, 即随产量水平的提高而提高, 且不同产量水平间差异显著。图5
 新窗口打开|下载原图ZIP|生成PPT
图5不同产量水平小麦氮营养指数变化规律(A)及其与籽粒产量的相关关系(B)
图(A)中实线表示平均值, 虚线表示中值, 箱型边界表示75%和25%的四分位数, 上下边缘表示90和10百分位数, 圆点表示最大值和最小值, 不同小字母(a, b, c, d)表示产量水平间有显著差异(P < 0.05); 图(B)中实线表示拟合曲线, ***显著性为P < 0.001。
Fig. 5Nitrogen nutrition index with different yield levels (A) and its correlation with wheat yield (B)
The solid and dashed lines in Fig. A indicate mean and median, respectively. The box boundaries indicate the 75% and 25% quartiles, the whisker caps indicate 90th and 10th percentiles, and the dots indicate the maximum and minimum, and different small letters (a, b, c, d) represent that there was significant difference in different yield levels (P < 0.05); the solid line in Fig. B represents the relationship, *** indicates significantly difference at P < 0.001.
3 讨论
3.1 不同产量水平稻茬小麦氮素需求特征
氮肥是小麦获得高产的重要因素, 有研究指出,随着产量的提高植株氮积累量也逐渐提高, 且两者呈显著幂函数关系[14], 李瑞珂等[4]也认为, 高产水平的氮积累量显著高于低产水平。近年来对小麦氮素积累的研究不断深入, 单位籽粒需氮量成为指导小麦田间施肥的重要指标, 该指标对确定小麦施氮量具有重要作用[14]。本研究中稻茬小麦单位籽粒需氮量变化范围为10.3~51.0 kg t-1, 均值为25.9 kg t-1, 对应产量范围为2.7~9.1 t hm-2。1985—1995年中国小麦单位籽粒需氮量为15.1~50.5 kg t-1, 均值为24.6 kg t-1, 对应产量范围0.4~8.7 t hm-2 [20]。2000—2011年中国小麦单位籽粒需氮量为10.9~88.7 kg t-1, 均值为26.4 kg t-1, 对应产量范围为0.2~12.0 t hm-2 [21]。华北地区旱地小麦的单位籽粒需氮量变化范围为14.4~37.5 kg t-1, 均值为23.7 kg t-1, 对应产量范围1.6~11.8 t hm-2 [11]。而英法等国小麦在高氮条件下, 单位籽粒需氮量均值为31.1 kg t-1, 对应产量范围5.49~9.65 t hm-2; 而低氮条件下均值为14.4 kg t-1,对应产量范围为3.87~6.86 t hm-2 [9]。其中, 本研究稻茬小麦的单位籽粒需氮量高于1985—1995年中国小麦的单位籽粒需氮量, 但低于2000—2011年中国小麦和英法等国小麦的单位籽粒需氮量, 与华北地区旱地小麦单位籽粒需氮量相近。本研究稻茬小麦单位籽粒需氮量随着产量水平的提高呈现先提高后降低趋势, 但4个产量水平间无显著差异。岳善超[11]研究表明, 华北地区旱地小麦在适宜施氮条件下, 随着产量水平的提高, 单位籽粒需氮量逐渐下降; 但在不同施氮条件下, 单位籽粒需氮量与2000—2011中国小麦的变化趋势一致, 呈现随施氮量提高而逐渐提高的趋势。出现该差异主要是不同年份小麦品种、种植模式以及生态条件不同造成的。有不少研究者认为, 小麦成熟期植株干物质积累量、氮积累量和氮浓度均随产量的提高而提高, 且植株氮积累量和干物质积累量的提高同步, 高产小麦具有更高的养分吸收能力[14,22-23]。不同产量水平小麦在不同生育阶段的干物质积累量和氮积累量具有显著差异[18,24]。相关研究发现, 拔节至开花期是小麦生长和养分吸收的重要生育阶段, 孕穗期的干物质积累量与产量之间呈显著正相关关系[25,26]。周玲等[24]和Meng等[27]研究发现, 高产水平小麦花前的干物质积累量与中产相近, 而花后则远高于中产水平小麦。Meng等[27]和黄明等[28]认为, 高产小麦成熟期氮积累量较中产和低产分别高17%和57%, 随着产量水平的提高, 出苗—拔节期的氮积累比例显著降低, 而拔节—开花期和开花—成熟期的氮积累量和氮积累比例均增加或显著增加。小麦在拔节后期具有较强的干物质和产量形成能力, 拔节—开花期的氮积累量对产量形成的影响最大[2]。氮肥施用应集中在中后期, 以满足小麦氮素需求[27]。本研究中, 高产水平下播种—拔节期和拔节—开花期阶段的干物质积累和氮积累比例呈增加趋势, 而在开花—成熟期阶段则先增加后降低, 这与高产小麦具有较高的干物质积累量和氮积累量有关。
3.2 不同产量水平稻茬小麦收获指数、氮收获指数、氮浓度及氮营养指数变化特征
随着产量水平的提高, 收获指数逐渐提高。岳善超[11]认为, 华北地区旱地小麦在优化施氮田间管理条件下, 收获指数从低产的0.39增加到超高产的0.48, 对应产量范围为3.2~11.8 t hm-2。山东省小麦收获指数范围为0.40~0.49, 对应产量范围为5.2~9.4 t hm-2 [29]。河北地区小麦收获指数范围为0.47~0.50, 对应产量范围为6.9~9.7 t hm-2 [30]。英格兰冬小麦收获指数范围为0.37~0.76, 对应产量范围为2.1~11.8 t hm-2 [31]。本研究稻茬小麦的收获指数范围为0.39~0.49, 对应产量范围为2.7~9.1 t hm-2, 与华北地区旱地小麦的研究结果一致, 但低于河北省小麦和英格兰小麦的收获指数, 这与其较高的产量有关。Barraclough等[31]认为, 不同小麦品种的收获指数间有差异, 但产量间差异并不明显。理论上小麦的收获指数可以达到0.64[32]。许多研究者[29,33-34]研究发现, 收获指数主要是生物量生产和异速生长的结果, 较高的收获指数是获得高产的原因之一, 提高收获指数能有效提高产量。收获指数不仅与品种和地区有关, 还与管理条件有关, 在干燥条件下, 小麦收获指数较低, 高水分条件下, 收获指数较高[34]。本研究的氮收获指数范围为0.60~0.96, 该结果与多个相关研究的结果较为一致, 且多数研究认为不同产量水平间的氮收获指数变化范围为0.69~0.98, 产量之间差异不显著, 主要与小麦品种有关[11,29,31]。本研究中籽粒和秸秆氮浓度变化范围分别为1.44%~1.87%和0.32%~0.46%。华北地区旱地小麦在优化施氮田间管理条件下, 籽粒和秸秆氮浓度变化范围分别为1.43%~2.80%和0.29%~1.05%[11], 英格兰冬小麦的籽粒氮浓度为1.08%~2.79%[31]。本研究的籽粒和秸秆氮浓度均低于华北地区和英格兰冬小麦。岳善超的研究结果表明, 随着产量水平的提高籽粒氮浓度逐渐降低, 造成该趋势的主要原因是籽粒中氮积累速率小于同化物积累速率。但是在不同施氮水平下, 随着产量提高籽粒和秸秆氮浓度逐渐提高[11,13]。张青松等[14]认为, 从低产到高产籽粒氮浓度逐渐下降, 但产量再提高, 籽粒氮浓度会逐渐提高。Triboi等[12]研究发现, 在限氮条件下, 籽粒氮浓度对产量变化较为敏感, 产量与籽粒氮浓度之间有较强的负相关关系。在缺氮条件下, 增施氮肥会增加产量, 但对籽粒氮浓度影响不大; 继续增施氮肥, 产量和氮浓度会同时增加; 而再增加施氮量, 籽粒氮浓度会逐渐提高, 而产量不会提高[35]。本研究中籽粒和秸秆氮浓度均随着产量提高呈逐渐上升趋势, 这主要与本研究数据来源中氮肥试验较多有关。籽粒和秸秆氮浓度从低产到高产分别提高了29%和46%, 秸秆氮浓度的增幅高于籽粒氮浓度, 这也表明较高的氮肥施用量易造成小麦氮素的奢侈吸收[11]。氮营养指数是诊断小麦田间氮肥供应的重要指标, 氮营养指数和产量均随施氮量的增加而增加[36,37]。本研究中, 氮营养指数与产量的相关性较大, 氮营养指数随着产量水平的提高逐渐提高, 该结果与前人研究一致。高产水平和中产水平小麦的氮营养指数接近1甚至高于1, 表明氮肥供应充足; 中低产和低产水平的氮营养指数偏低, 在小麦生长关键阶段适当增施氮肥利于小麦进一步提高产量[16,38]。
4 结论
不同产量水平稻茬小麦单位籽粒需氮量间无显著差异, 小麦籽粒产量与植株氮积累量并不是等比例增加。拔节—开花期阶段是小麦干物质积累量和氮积累量最高的阶段, 该阶段保证充足的养分供应有利于小麦取得高产。秸秆氮浓度、籽粒氮浓度和氮营养指数均随着产量水平的提高而提高, 主要与施氮量增加有关, 并且籽粒氮浓度的增幅低于秸秆氮浓度, 意味着过量施氮易造成小麦的奢侈吸收。参考文献 原文顺序
文献年度倒序
文中引用次数倒序
被引期刊影响因子
DOI:10.1007/s13280-010-0076-6URLPMID:21053721 [本文引用: 1]

During the first 35 years of the Green Revolution, Chinese grain production doubled, greatly reducing food shortage, but at a high environmental cost. In 2005, China alone accounted for around 38% of the global N fertilizer consumption, but the average on-farm N recovery efficiency for the intensive wheat-maize system was only 16-18%. Current on-farm N use efficiency (NUE) is much lower than in research trials or on-farm in other parts of the world, which is attributed to the overuse of chemical N fertilizer, ignorance of the contribution of N from the environment and the soil, poor synchrony between crop N demand and N supply, failure to bring crop yield potential into full play, and an inability to effectively inhibit N losses. Based on such analyses, some measures to drastically improve NUE in China are suggested, such as managing various N sources to limit the total applied N, spatially and temporally matching rhizospheric N supply with N demand in high-yielding crops, reducing N losses, and simultaneously achieving high-yield and high NUE. Maximizing crop yields using a minimum of N inputs requires an integrated, interdisciplinary cooperation and major scientific and practical breakthroughs involving plant nutrition, soil science, agronomy, and breeding.
[本文引用: 2]
[本文引用: 2]
[本文引用: 1]
[本文引用: 1]
[本文引用: 2]
[本文引用: 2]
[本文引用: 1]
[本文引用: 1]
[本文引用: 1]
[本文引用: 1]
[本文引用: 1]
[本文引用: 1]
[本文引用: 1]
[本文引用: 2]
[本文引用: 1]
[本文引用: 9]
[本文引用: 9]
[本文引用: 2]
URLPMID:20679251 [本文引用: 2]
[本文引用: 5]
[本文引用: 5]
[本文引用: 3]
[本文引用: 3]
[本文引用: 2]
[本文引用: 2]
[本文引用: 2]
[本文引用: 2]
[本文引用: 2]
[本文引用: 1]
[本文引用: 1]
[本文引用: 1]
[本文引用: 1]
[本文引用: 1]
[本文引用: 1]
[本文引用: 1]
[本文引用: 1]
DOI:10.5846/stxb201106120775URL [本文引用: 2]
2·m-2·s-1),中产和低产品种的平均光合速率分别为4.3 μmolCO2·m-2·s-1和4.0 μmolCO2·m-2·s-1,高产品种功能叶(旗叶)在灌浆期能保持较高的SPAD值和光合速率,因而花后能生产较多的干物质,但其花前干物质转移量、转移率及转移干物质对籽粒的贡献率均没有明显优势。可见,花后较高的叶绿素水平、光合速率和干物质累积是旱地小麦品种高产的重要原因。选择优良品种,采取合理的栽培措施, 特别是通过养分调控保持花后具较高的干物质累积量是西北旱地进一步提高冬小麦产量的重要途径。]]>
[本文引用: 2]
[本文引用: 1]
[本文引用: 1]
DOI:10.1016/S1002-0160(15)60030-3URL [本文引用: 3]
[本文引用: 1]
[本文引用: 1]
[本文引用: 3]
[本文引用: 3]
DOI:10.1016/j.fcr.2018.02.011URL [本文引用: 1]
DOI:10.1016/j.eja.2010.01.005URL [本文引用: 4]
AbstractWinter wheat (Triticum aestivum L.) was grown for 4 years in multi-factorial field trials at Rothamsted, southern England. Thirty nine elite commercial cultivars (primarily short-straw) were grown including those released in the UK over a 25-year period, a selection of continental varieties, and three older, tall varieties. Varieties spanned the quality spectrum from ‘bread’ to ‘feed’. The crops were given ammonium nitrate at five rates in the range 0–350 kg-N/ha as a 3-way split. The aim was to quantify the genotypic variation in total nitrogen uptake by grain and straw (total-Nup), and in nitrogen utilization efficiency for grain yield (grain yield per unit of N taken up) (grain-NutE). Depending on treatment, grain yield ranged from 2.1 to 11.8 t/ha (85% DM), grain %N from 1.1% to 2.8% (in DM), total-Nup from 31 to 264 kg-N/ha, and grain-NutE from 27 to 77 kg-DM/kg-N. There were significant varietal differences in total N-uptake and grain-NutE both between ‘tall’ and ‘short’ varieties and within ‘short’ varieties. The best short varieties took up 31–38 kg/ha more N than the worst, and grain-NutE was 24–42% better, depending on N-rate. Up to 77% of the variation in grain-NutE was accounted for by yield. All interactions between the factors ‘Variety’, ‘Year’, and ‘N-rate’ were highly significant, but only ‘Year × N-rate’ made an important contribution to the variation. There was a near-functional inverse relationship between grain-NutE and grain %N; high-quality wheat (high grain %N) can be expected to have a low grain-NutE. The four key variables determining N-efficiency in a wheat crop – grain yield, grain %N, total N-uptake and nitrogen harvest index (NHI) – are ultimately constrained by the law of conservation of matter. Improving grain-NutE for fixed total-Nup and NHI can only be achieved at the expense of grain %N. To improve grain-NutE and maintain grain %N requires a simultaneous increase in NHI and grain starch yield which may be difficult to achieve in practice. The law of conservation of matter ultimately sets a limit on the physiological and agronomic processes that determine crop N requirements. A high yield of high-quality grain (high grain %N) requires a high input and uptake of nitrogen.]]>
URLPMID:20952627 [本文引用: 1]
DOI:10.2135/cropsci1999.3961611xURL [本文引用: 1]
DOI:10.1078/1433-8319-00083URL [本文引用: 2]
URLPMID:16653383 [本文引用: 1]
DOI:10.3724/SP.J.1006.2016.00909URL [本文引用: 1]
为了验证小麦临界氮稀释曲线在豫中地区的适用性,选择大穗型品种周麦16和多穗型品种豫麦49-198进行了连续3年(2011年10月至2014年6月)的田间定位试验,设置5个氮水平(纯氮0、120、180、240、360 kghm-2),分别构建了小麦地上部生物量临界氮浓度稀释曲线模型和氮营养指数模型。结果表明,地上部生物量随着施氮量增加显著提高,而后趋于平缓;小麦临界氮浓度与地上部生物量符合幂函数关系,其R2分别为0.8203 (豫麦49-198, P<0.01)和0.7981 (周麦16, P<0.01),且模型在年度间具有较好的稳定性。根据模型得到的氮营养指数可以较好地评价小麦植株氮营养状况,且小麦氮营养指数和相对茎基部硝酸盐之间具有显著的线性相关。说明本文所构建的小麦临界氮浓度稀释模型适用于本地区,且可以用来估测小麦植株氮素盈亏水平。]]>
[本文引用: 1]
[本文引用: 1]
[本文引用: 1]
[本文引用: 1]
