 ,*西北农林科技大学农学院/农业部西北黄土高原作物生理生态与耕作重点实验室, 陕西杨凌 712100
Critical nitrogen dilution curves and nitrogen nutrition diagnosis of spring maize under different precipitation patterns in Weibei dryland
LIU Peng-Zhao, SHI Zu-Jiao, NING Fang, WANG Rui, WANG Xiao-Li, LI Jun,*College of Agronomy, Northwest A&F University/Key Laboratory of Crop Physiecology and Tillage Science in Northwestern Loess Plateau, Ministry of Agriculture, Yangling 712100, Shaanxi, China通讯作者:
收稿日期:2020-01-31接受日期:2020-04-15网络出版日期:2020-08-12
| 基金资助: |
Received:2020-01-31Accepted:2020-04-15Online:2020-08-12
| Fund supported: |
作者简介 About authors
E-mail:liupz@foxmail.com。

摘要
关键词:
Abstract
Keywords:
PDF (701KB)元数据多维度评价相关文章导出EndNote|Ris|Bibtex收藏本文
本文引用格式
刘朋召, 师祖姣, 宁芳, 王瑞, 王小利, 李军. 不同降雨状况下渭北旱地春玉米临界氮稀释曲线与氮素营养诊断[J]. 作物学报, 2020, 46(8): 1225-1237. doi:10.3724/SP.J.1006.2020.03007
LIU Peng-Zhao, SHI Zu-Jiao, NING Fang, WANG Rui, WANG Xiao-Li, LI Jun.
玉米生长过程中对氮素需求量高, 关于玉米植株养分累积分配、生长与产量、氮肥优化管理等方面已开展大量研究[1]。农民基于追求作物高产目的, 过量施氮现象非常普遍, 作物生产过程中无法满足氮素供需之间的同步性[2], 导致氮素利用效率偏低, 同时造成温室气体排放加剧和大气污染、土壤酸化及地下水污染。因此, 针对作物不同生育时期氮素营养实际状况优化供氮量, 对于提高氮素利用效率和环境保护具有重要意义。前人围绕植株体氮素精确诊断方面做了大量研究, 如根区养分检测、叶片叶绿素测定以及应用RS技术[3,4,5]等。临界氮浓度被定义为作物一定生长期内最大生物量时的最小氮浓度, 能较好反映作物高产时的最佳需氮量, 是作物氮素诊断的基本方法之一, 临界氮稀释曲线及基于此的氮营养指数可以动态描述作物氮素营养状况的变化, 是实现合理施氮的氮素营养诊断关键技术[6]。国内外****先后建立棉花[7]、小麦[8]、冬油菜[9]、水稻[10]、大蒜[11]、玉米[12,13,14,15,16,17,18,19]等作物的临界氮浓度稀释模型, 发现不同作物品种及生态气候区域均会影响模型参数变化。国内有关玉米临界氮浓度的相关研究主要集中于关中[12]、宁夏[13]、豫中[14]和华北地区[15,16], 且均为基于无水分胁迫条件下的玉米氮稀释曲线。渭北旱塬属于典型雨养农业区, 水资源缺乏, 受季节性降雨分配不均、年际间波动大等因素影响, 旱地春玉米常遭受不同程度干旱胁迫, 导致产量低而不稳。水分亏缺会影响春玉米生长发育和干物质累积, 同步影响植株对氮素吸收利用的能力, 不利于农业可持续性发展。因此明确旱地春玉米不同生育阶段临界氮浓度, 对于科学诊断植株氮营养状况, 指导渭北旱地春玉米种植区合理施氮具有重要意义。本研究通过4年田间定位施氮试验, 建立渭北旱塬不同降雨分布状况下旱地春玉米临界氮素稀释曲线和氮营养指数模型, 以期为渭北旱地春玉米氮营养诊断和生育季精准施氮提供理论依据。
1 材料与方法
1.1 田间试验方法
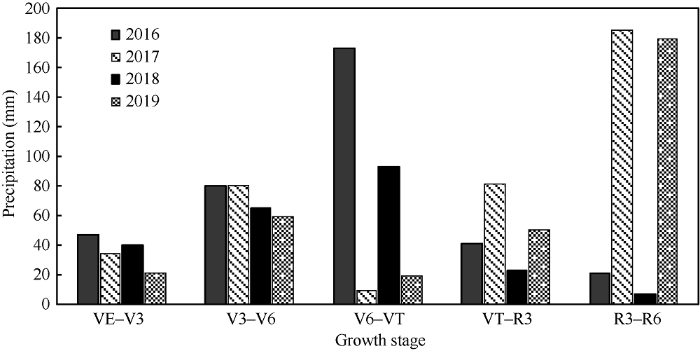
1.1.1 试验地概况 本试验于2016年4月至2019年9月在陕西省合阳县甘井镇西北农林科技大学旱农试验站(35°19'54.45″N, 110°05'58.35″E)进行。该地区海拔877 m, 属典型黄土高原沟壑区, 暖温带半干旱型大陆性季风气候, 年均降雨量为536.6 mm, 60%以上集中在7月至9月。供试地块土壤为黑垆土, 试验地耕层0~20 cm土壤有机质含量11.38 g kg-1, 全氮含量0.98 g kg-1, 全磷含量0.79 g kg-1, 全钾含量11.15 g kg-1, 速效磷含量28.39 mg kg-1, 速效钾含量277.36 mg kg-1。1.1.2 试验年份降雨分布状况 2016—2019年试验期间春玉米全生育期降雨量分别为357.5、362.6、224.9、320.1 mm, 不同生育时期降雨量如图1所示(VE-V3、V3-V6、V6-VT、VT-R3、R3-R6分别代表出苗期—三叶期、三叶期—拔节期、拔节期—抽雄期、抽雄期—乳熟期、乳熟期—完熟期)。根据4年试验期间春玉米穗期(拔节期至抽雄期)和花粒期(抽雄期到完熟期)降雨分布状况分为两种干旱年型: 2016年和2018年为“穗期多雨, 花粒期干旱”型; 2017年和2019年为“穗期干旱, 花粒期多雨”型, 文中分别用“a. 穗期多雨”和“b. 穗期干旱”来表示。
图1
 新窗口打开|下载原图ZIP|生成PPT
图12016-2019年春玉米各生育阶段降雨量分布
VE-V3: 出苗期-三叶期; V3-V6: 三叶期-拔节期; V6-VT: 拔节期-抽雄期; VT-R3: 抽雄期-乳熟期; R3-R6: 乳熟期-完熟期。
Fig. 1Precipitation distributions at the different growth stages from 2016 to 2019
VE-V3: from emergence stage to third leaf stage; V3-V6: from third leaf stage to jointing stage; V6-VT: from jointing stage to tasseling stage; VT-R3: from tasseling stage to milk stage; R3-R6: from milk stage to maturity stage.
1.1.3 试验设计 采取施氮量与品种二因素裂区设计, 施氮量为主处理, 设5个施氮量水平, 品种为副处理, 设2个品种类型, 共组成10个处理, 小区面积43.2 m2 (8.0 m×5.4 m), 重复3次。供试玉米品种为郑单958 (ZD958)和陕单8806 (SD8806)。设置5个施氮量处理, 分别以N0、N1、N2、N3、N4表示。2016—2017年5个施氮量处理为纯氮0、75、150、270和360 kg hm-2, 2018—2019年施氮量处理调整为0、90、180、270和360 kg hm-2。氮肥全部基施, 统一配施P2O5 120 kg hm-2, K2O 45 kg hm-2, 氮、磷、钾肥分别为尿素(含N 46.4%)、过磷酸钙(含P2O5 12%)、硫酸钾(含K2O 50%)。每年均于4月下旬播种, 9月中下旬收获。种植密度为67,500株hm-2, 人工播种控制行距50 cm, 株距29.6 cm。全生育期无灌溉, 其他管理措施与当地农户保持一致。
1.1.4 测定项目与方法 1)植株样品采集与测定: 分别于玉米拔节期(V6)、抽雄期(VT)、乳熟期(R3)和完熟期(R6)取样, 每个小区选取长势具有代表性的植株2株。将植株去根, 按器官分开在105℃下杀青 30 min, 然后85℃烘干至恒重, 测定其干物质重后, 粉碎过60目筛, 用H2SO4-H2O2消煮法, 凯氏定氮仪测定植株全氮。2)产量测定: 玉米收获期, 每个小区选取4.5 m2, 统计穗数, 然后从中选取能代表该小区的10株作为代表样带回实验室考种, 调查穗部性状, 脱粒后风干, 称取百粒重计算籽粒产量。
1.2 模型建立方法
1.2.1 临界氮浓度稀释曲线模型构建 临界氮浓度是指在一定作物生长期内获得最大干物质量所需的最小氮素浓度。建立临界氮浓度稀释曲线, 先需要确定关键数据点, 参照Justes等[20]构建临界氮浓度稀释曲线步骤如下:1) 对比分析不同氮水平下每个测定生育时期的地上部生物量及相对应的氮浓度值, 根据方差分析(P≤0.05)将作物生长受氮素的影响分为限制和不限制2类;
2) 对于施氮量不能满足作物生长需求的观察数据, 将地上部生物量(DM)与植株氮含量(g kg-1)进行线性曲线拟合;
3) 对于生长状况不受氮素影响的施氮水平, 则地上部生物量的平均值代表地上部生物量的最大值。
4) 每个作物采样时期的理论临界氮浓度由上述线性曲线与以最大地上生物量为横坐标的垂线的交点的纵坐标决定。临界氮浓度稀释曲线模型为:
式中, Nc为临界氮含量, g kg-1; 参数a为地上部生物量为1 t hm-2时植株的临界氮浓度[21]; DM为春玉米地上部生物量的最大值, t hm-2; 参数b为决定临界氮浓度稀释曲线斜率的统计学参数[20]。
1.2.2 临界氮稀释曲线模型的检验 模型验证采用国际通用的回归估计标准误差均方根误差RMSE和标准化均方根误差n-RMSE [23,24]来检测模型的拟合度。RMSE和n-RMSE的计算公式分别为:
式中: Si、Mi分别为临界氮测定值和模拟值; n 为样本量; S为实测数据的平均值。参照Jamiesom等[25]提出的标准来衡量模型稳定性: n-RMSE<10%, 模型稳定性极好; 10%<n-RMSE<20%, 模型稳定性较好; 20%<n-RMSE<30%, 模型稳定性一般; n- RMSE>30%, 模型稳定性较差。
1.2.3 氮素营养指数(NNI)模型的构建 为进一步明确作物的氮素营养状况, Lemaire等[21]提出氮素营养指数(nitrogen nutrition index, NNI)的概念, 可用公式(4)来表示:
式中, NNI为氮素营养指数, Na为氮浓度实测值, g kg-1; Nc为临界氮浓度值, g kg-1。NNI可直观反映作物体内氮素的营养状况, NNI=1, 表明作物氮素营养状况适宜; NNI>1, 表明作物氮素营养过剩; NNI<1, 表现为氮素营养缺失。
1.2.4 相对氮吸收量、相对地上部生物量和相对产量计算 相对吸氮量(relative nitrogen uptake, RNupt) = 吸氮量/同一生育时期同一干旱年型吸氮量最大值; 相对地上部生物量(relative dry biomass, RDW) = 地上部生物量/同一生育时期同一干旱年型地上部生物量的最大值; 相对产量(relative yield, RY) = 实际产量/同一干旱年型产量的最大值。
1.3 数据处理与分析
根据4年玉米试验年份降水季节分布状况, 2016年和2018年为“穗期多雨, 花粒期干旱”型; 2017年和2019年为“穗期干旱, 花粒期多雨”型。本文利用2016年和2017年试验数据分别建立2种降雨状况下旱地春玉米临界氮浓度稀释曲线模型, 利用2018年和2019年独立试验数据分别对2016年和2017年构建的模型进行验证。将2个玉米品种数据合并处理, 每个模型筛选出8个临界数据点, 每个模型建立和模型验证的样本数n=8。同时, 分别选取2016年和2017年的施氮量最高(N4处理)的数据建立最大氮浓度稀释曲线(Nmax), 选取2016年和2017年无氮肥投入(N0处理)的数据建立最小氮浓度稀释曲线(Nmin)。试验数据和图表采用Microsoft Excel 2016和Origin 2015软件处理, 使用SPSS 19.0软件进行统计分析, 多重比较采用Duncan’s法, 差异显著性水平设为P≤0.05。
2 结果与分析
2.1 不同施氮量处理对旱地春玉米干物质积累和产量的影响
以郑单958为例, 由表1可知, 适量施肥可以显著提高春玉米籽粒产量, 随着氮肥用量增加, 不同年份下春玉米籽粒产量均表现为先增加后降低的趋势。同一生育时期随氮素水平提高, 干物质量呈逐渐增加趋势, 施氮效果显著, 但同一取样时期N270和N360处理之间地上部干物质积累量基本没有显著差异, 说明施氮过量并不能提高地上部干物质积累量。雨养农业区生育期内降雨对作物地上部生物量和产量影响显著, 由于降雨造成不同年际间玉米生物量和产量变化较大。以2018年和2019年为例, 2018年属于穗期多雨年, 地上部生物量和籽粒产量变化范围分别2.23~23.14 t hm-2和5.67~10.26 t hm-2, 最高产量施氮量为270 kg hm-2, 且施氮270 kg hm-2处理生物量显著高于180 kg hm-2; 2019年属于穗期干旱年, 地上部生物量和籽粒产量变化范围分别为2.01~14.07 t hm-2和3.21~5.05 t hm-2, 最高产量施氮量为180 kg hm-2, 且施氮180 kg hm-2和270 kg hm-2生物量无显著差异。可以看出不同干旱年型中玉米地上部生物量和籽粒产量对不同施氮量处理的响应程度差异明显, 在相同施氮量处理下, 穗期干旱年地上部生物量和籽粒产量分别仅为穗期多雨年的60.6%和51.4%。Table 1
表1
表1不同施氮处理下旱地春玉米不同生育时期地上部生物量和籽粒产量
Table 1
| 年份 Year | 品种 Varieties | 施氮量 N rates | 地上部生物量 Aboveground biomass (t hm-2) | 籽粒产量 Grain yield (t hm-2) | |||
|---|---|---|---|---|---|---|---|
| V6 | VT | R3 | R6 | ||||
| 2016 | 郑单958 | N0 | 2.17 d | 4.78 e | 9.67 d | 18.22 d | 9.98 c |
| ZD958 | N75 | 3.13 c | 5.68 d | 11.39 c | 20.13 c | 10.89 b | |
| N150 | 3.39 b | 6.18 c | 13.36 b | 21.4 b | 11.87 a | ||
| N270 | 3.46 a | 7.02 b | 14.91 a | 21.93 a | 12.22 a | ||
| N360 | 3.31 b | 7.85 a | 15.25 a | 22.22 a | 11.89 a | ||
| 陕单8806 | N0 | 2.07 c | 4.94 e | 10.47 e | 18.17 d | 9.77 b | |
| SD8806 | N75 | 2.41 b | 5.46 d | 12.39 d | 19.42 c | 10.14 b | |
| N150 | 2.46 b | 6.11 c | 13.36 c | 20.58 b | 10.68 a | ||
| N270 | 2.67 a | 7.11 b | 14.61 b | 20.97 b | 10.97 a | ||
| N360 | 2.86 a | 7.55 a | 17.25 a | 22.64 a | 10.99 a | ||
| 2017 | 郑单958 | N0 | 2.10 d | 3.78 d | 4.97 d | 10.22 d | 2.22 e |
| ZD958 | N75 | 2.13 d | 4.68 c | 6.98 c | 12.13 c | 2.78 d | |
| N150 | 2.39 c | 5.20 b | 8.96 b | 13.40 b | 4.47 a | ||
| N270 | 2.86 b | 6.35 a | 9.03 b | 14.93 a | 4.12 b | ||
| N360 | 3.31 a | 6.78 a | 9.24 a | 15.22 a | 3.43 c | ||
| 陕单8806 | N0 | 2.23 c | 3.78 d | 4.87 d | 9.17 e | 2.31 e | |
| SD8806 | N75 | 2.31 c | 4.68 c | 5.98 c | 10.42 d | 3.02 d | |
| N150 | 2.49 b | 5.13 b | 8.98 b | 12.59 c | 4.17 b | ||
| N270 | 2.43 b | 6.35 a | 9.01 b | 13.97 b | 4.29 a | ||
| N360 | 3.08 a | 6.71 a | 9.14 a | 14.64 a | 3.80 c | ||
| 2018 | 郑单958 | N0 | 2.23 d | 5.11 d | 9.97 e | 13.45 d | 6.72 d |
| ZD958 | N90 | 2.81 c | 6.16 c | 12.39 d | 17.42 c | 9.68 bc | |
| N180 | 3.09 c | 6.90 b | 13.36 c | 22.29 b | 9.82 ab | ||
| N270 | 3.33 b | 7.22 a | 14.61 b | 23.03 a | 10.12 a | ||
| N360 | 3.48 a | 7.65 a | 15.25 a | 23.14 a | 9.42 c | ||
| 陕单8806 | N0 | 1.91 c | 4.62 d | 8.93 d | 15.06 d | 5.67 d | |
| SD8806 | N90 | 2.69 b | 5.11 c | 12.72 d | 18.02 c | 7.64 c | |
| N180 | 3.11 a | 6.86 b | 13.51 c | 20.80 b | 9.75 b | ||
| N270 | 3.22 a | 7.10 a | 15.99 b | 21.90 a | 10.26 a | ||
| N360 | 3.24 a | 7.22 a | 16.29 a | 21.3 a | 9.83 ab | ||
| 2019 | 郑单958 | N0 | 2.08 d | 3.78 e | 4.57 d | 9.87 d | 3.21 d |
| ZD958 | N90 | 2.41 c | 4.68 d | 5.98 c | 10.02 c | 3.85 c | |
| N180 | 2.85 b | 5.83 c | 9.76 a | 13.98 a | 5.05 a | ||
| N270 | 2.86 b | 7.35 a | 9.62 a | 13.97 a | 4.61 b | ||
| N360 | 2.96 a | 6.80 b | 9.24 b | 13.64 b | 4.44 b | ||
| 陕单8806 | N0 | 2.01 c | 3.48 d | 4.97 d | 9.87 e | 2.85 d | |
| SD8806 | N90 | 2.69 b | 4.58 c | 6.98 c | 10.42 d | 3.75 c | |
| N180 | 2.81 a | 6.23 b | 8.76 b | 12.58 c | 4.32 b | ||
| N270 | 2.91 a | 6.35 b | 8.83 b | 14.07 a | 4.91 a | ||
| N360 | 2.84 a | 6.61 a | 9.03 a | 13.84 b | 4.03 bc | ||
新窗口打开|下载CSV
2.2 不同降雨状况下旱地春玉米植株氮浓度动态变化
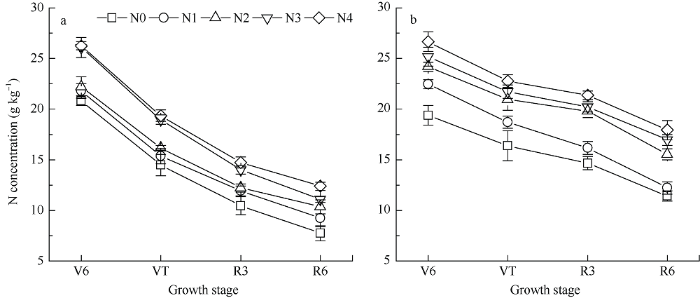
以郑单958品种为例, 利用2016—2019年田间数据, 分析2种降雨状况下旱地春玉米植株氮浓度动态变化。玉米植株氮含量随生育时期推进逐渐下降(图2)。2种降雨状况下植株氮含量变化范围分别为7.74~26.45 g kg-1和11.43~26.65 g kg-1。不同干旱年型间植株氮浓度变化趋势不一致: 穗期多雨年植株长势较好, 抽雄吐丝期降雨量较多, 籽粒灌浆充足, 叶片和茎秆中氮素及时向籽粒转运; 穗期干旱年植株拔节至抽雄期受到水分胁迫, 影响植株授粉、受精, 籽粒灌浆受阻, 植株氮素下降速率缓慢, 后期雨水较多, 但错过最佳水热资源, 导致大量氮素存在植株体内。图2
 新窗口打开|下载原图ZIP|生成PPT
图2不同降雨状况下旱地春玉米不同生育时期植株氮含量变化
a: 穗期多雨; b: 穗期干旱。V6: 拔节期; VT: 抽雄期; R3: 乳熟期; R6: 完熟期。N0、N1、N2、N3、N4依次表示: 2016-2017年施氮量分别为0、75、150、270和360 kg hm-2, 2018-2019年为0、90、180、270和360 kg hm-2。
Fig. 2Plant N concentrations at different stages of dryland spring maize under the different precipitation patterns
a: rainy at the ear stage; b: dry at the ear stage. V6: jointing stage; VT: tasseling stage; R3: milk stage; R6: maturity stage. Nitrogen was applied at N0, N1, N2, N3, and N4, that is, 0, 75, 150, 270, and 360 kg hm-2 from 2016 to 2017, and at 0, 90, 180, 270, and 360 kg hm-2 from 2018 to 2019.
方差分析表明(表2), 不同施氮量、不同年际间旱地玉米地上部生物量、植株含氮量和籽粒产量存在显著或极显著差异, 但两品种之间不存在显著差异。可以说明利用两个品种的数据建立模型的可行性。
Table 2
表2
表2旱地玉米不同生育时期地上部生物量、植株含氮量和籽粒产量的方差分析
Table 2
| 因子 Factors | V6 | VT | R3 | R6 | 籽粒产量 Grain yield (t hm-2) | ||||
|---|---|---|---|---|---|---|---|---|---|
| DM | Na | DM | Na | DM | Na | DM | Na | ||
| 郑单958 ZD958 | 2.82 | 23.50 | 6.11 | 18.49 | 10.43 | 15.56 | 16.53 | 12.49 | 7.04 |
| 陕单8806 SD8806 | 2.71 | 23.78 | 5.78 | 18.05 | 10.52 | 15.67 | 16.02 | 11.98 | 6.66 |
| 2016 | 2.79 | 23.43 | 6.27 | 16.87 | 13.27 | 12.67 | 20.57 | 10.16 | 10.94 |
| 2017 | 2.53 | 23.56 | 7.72 | 20.11 | 7.72 | 18.45 | 12.67 | 16.81 | 3.46 |
| 2018 | 2.91 | 23.63 | 6.41 | 17.27 | 13.31 | 12.07 | 19.64 | 10.36 | 8.89 |
| 2019 | 2.64 | 23.48 | 6.57 | 20.51 | 7.78 | 18.85 | 12.23 | 16.41 | 4.10 |
| N0 | 2.10 | 20.11 | 4.28 | 15.43 | 7.30 | 12.55 | 13.01 | 9.59 | 5.34 |
| N1 | 2.57 | 22.13 | 5.13 | 17.04 | 9.35 | 14.05 | 14.75 | 10.73 | 6.47 |
| N2 | 2.82 | 23.19 | 6.06 | 18.57 | 11.26 | 16.02 | 17.20 | 12.94 | 7.52 |
| N3 | 2.97 | 25.63 | 6.86 | 20.35 | 12.08 | 17.12 | 18.11 | 14.02 | 7.69 |
| N4 | 3.14 | 26.45 | 7.15 | 21.06 | 12.59 | 18.05 | 18.33 | 15.15 | 7.23 |
| F-value | |||||||||
| 年份Year(Y) | 6.10** | 0.22NS | 164*** | 219*** | 4938*** | 831*** | 5133*** | 885*** | 11735*** |
| 品种Variety(V) | 0.59NS | 0.85NS | 1.11NS | 0.96NS | 1.31NS | 0.37NS | 0.72 NS | 0.38 NS | 143*** |
| 施氮量Nitrogen(N) | 33*** | 1675*** | 714*** | 278*** | 1947*** | 335*** | 1110*** | 414*** | 654*** |
| 年份×品种Y×V | 0.29NS | 0.28NS | 0.71NS | 0.32NS | 0.45NS | 0.12NS | 0.81NS | 0.13NS | 34*** |
| 年份×施氮量Y×N | 1.74NS | 35*** | 9.31** | 4.61* | 35*** | 14*** | 58*** | 11.21** | 44*** |
| 品种×施氮量V×N | 0.08NS | 2.39NS | 3.32* | 1.03NS | 13.72** | 0.04NS | 11.21** | 0.11NS | 8.92** |
| 年份×品种×施氮量Y×V×N | 0.05NS | 1.13NS | 3.71* | 0.34NS | 15.21** | 0.01NS | 8.91** | 0.04NS | 17.12** |
新窗口打开|下载CSV
2.3 旱地春玉米临界氮浓度稀释曲线模型建立
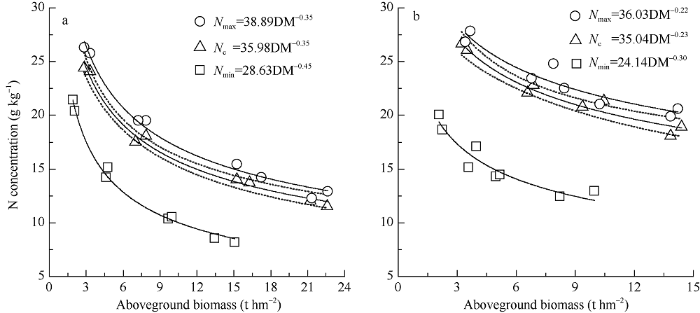
采用2016年和2017年试验数据分别建立“穗期多雨”和“穗期干旱”2种降雨状况下旱地春玉米临界氮浓度稀释曲线模型。通过玉米各生育时期地上部生物量和植株含氮量计算得出每个时期临界氮浓度, 发现随着地上部生物量增加, 临界氮浓度呈下降趋势。分别对2种干旱年型地上部生物量和植株氮浓度进行幂函数拟合, 建立玉米整个生育时期的临界氮浓度稀释曲线(图3), 两种干旱年型的拟合方程均达到显著水平(a. 穗期多雨: Nc=35.98DM-0.35; b. 穗期干旱: Nc=35.04DM-0.23), 决定系数分别为0.989和0.956, 表明该模型可以用来表征两种干旱年型春玉米地上部生物量和植株氮浓度的关系。由于年际间降雨波动大, 2种年型玉米干物质积累量取值范围分别介于2.8~22.6 t hm-2、2.4~13.4 t hm-2 之间, 2016年和2018年春玉米全生育期地上部干物质积累量显著高于2017年和2019年, 这主要与2017年和2019年拔节至抽雄期干旱(降雨量分别仅为8.8 mm和19.2 mm), 导致作物授粉、受精严重受阻, 从而错失最佳水热资源, 最终导致干物质增长缓慢有关。参数a的95%的置信区间在2016年为[34.97, 36.97], 2017年为[33.97, 36.31], 可以看出参数a基本相同, 两者平均值为35.51 g kg-1, 此外, 参数b值2016年明显大于2017年。由此可见, 干旱年型不会改变参数a值的大小。图3
 新窗口打开|下载原图ZIP|生成PPT
图3不同降水状况下旱地玉米植株氮浓度与地上部生物量的关系
a: 穗期多雨; b: 穗期干旱。Nc、Nmin和Nmax分别代表为春玉米植株氮浓度临界值、最小值和最大值。
Fig. 3Relationships between the plant N concentrations and aboveground biomass of dryland spring maize under the different precipitation patterns
a: rainy at the ear stage; b: drought at the ear stage. Nc, Nmin, and Nmax are critical nitrogen concentration, minimum, and maximum of nitrogen concentration in spring maize.
通过对春玉米地上生物量和氮浓度的结果分析, 地上生物量对应的氮浓度值存在很大的氮含量变异性(图3), 本研究利用每个取样时期所测植株氮浓度的最小值(Nmin)、最大值(Nmax), 得到2种降雨状况下旱地春玉米氮素稀释边界模型: (a. 穗期多雨: Nmin = 28.63.98DM-0.45, R2 = 0.991; Nmax = 38.89DM-0.35, R2 = 0.988; b.穗期干旱: Nmin = 24.14DM-0.30, R2 = 0.891, Nmax = 36.03DM-0.22, R2 = 0.898)。
2.4 旱地春玉米临界氮浓度稀释曲线验证
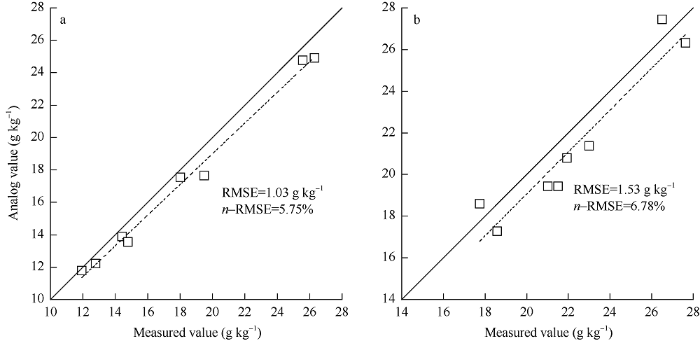
为验证上述模型的稳定性和可靠性, 使用2018年和2019年独立试验数据分别对2016年和2017年构建的模型校验精度(a. 穗期多雨: n=8; b. 穗期干旱: n=8)。具体步骤为: 将独立数据中的最大干物质带入临界氮浓度稀释曲线模型后, 对比计算值与实测值, 通过1:1等值图来显示模型的拟合度(图4)。根据公式得出穗期多雨年曲线的RMSE=1.03, n-RMSE=5.75%; 穗期干旱年曲线的RMSE=1.53, n-RMSE=6.78%, 标准化均方根误差(n-RMSE)均小于10%, 模型稳定性极好。可知所构建的 2 种降雨状况下临界氮稀释曲线模型具有较好精度, 表明本研究所建立的临界氮稀释曲线可进一步用于玉米植株氮营养诊断。图4
 新窗口打开|下载原图ZIP|生成PPT
图4不同降水状况下旱地玉米临界氮浓度稀释曲线的验证
a: 穗期多雨; b: 穗期干旱。
Fig. 4Validations of critical nitrogen dilution curve with independent data under different precipitation patterns in dryland spring maize
a: rainy at the ear stage; b: drought at the ear stage.
2.5 不同生育时期旱地春玉米氮营养指数动态变化
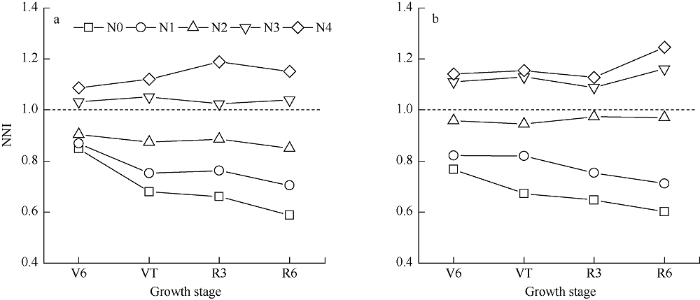
施氮量和降雨年型显著影响氮营养指数NNI的变化, NNI随着施氮量增加而增加(图5)。穗期多雨年各生育时期NNI变化区间为0.58~1.18, 其中N0、N1和N2处理NNI均小于1, 其值分别为0.69、0.77和0.88, 说明氮素不足抑制春玉米的干物质累积过程, N3处理下不同生育时期NNI (NNI=1.03)均略高于1, 说明适宜施氮量位于N2~N3之间, N4处理NNI值明显大于1, 表明植株氮营养过剩, 超过作物最大生物量累积所需的临界氮浓度。穗期干旱年整个生育时期NNI变化区间为0.60~1.24, 其中N0和N1处理NNI小于1, 氮素供应不足, 其值分别为0.67和0.79, N2处理下NNI (NNI=0.94)略低于1, 表明施氮适宜, N3和N4处理NNI值均显著高于1, 表现为氮素奢侈吸收。综合考虑春玉米全生育期植株氮营养状况, 穗期多雨年适宜施氮量介于N2~N3之间(180~270 kg hm-2), 穗期干旱年适宜施氮量为N2 (150~180 kg hm-2)。图5
 新窗口打开|下载原图ZIP|生成PPT
图5不同降雨状况下旱地春玉米氮营养指数(NNI)动态变化
a: 穗期多雨; b: 穗期干旱。缩写同
Fig. 5Dynamic changes of nitrogen nutrition index (NNI) under different precipitation patterns in dryland spring maize
a: rainy at the ear stage; b: drought at the ear stage. Abbreviations are the same as those given in
2.6 氮营养指数与相对吸氮量、相对地上部干物质量和相对产量之间的关系
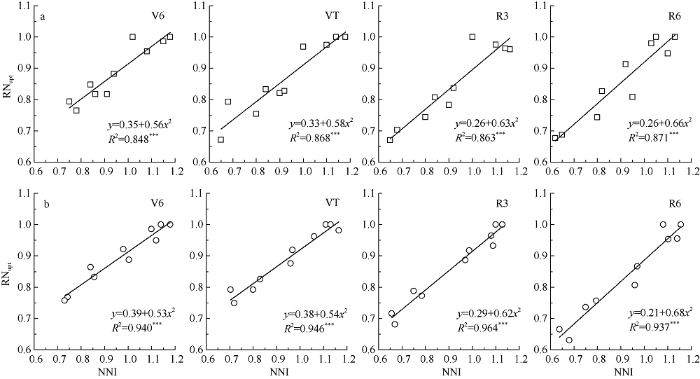
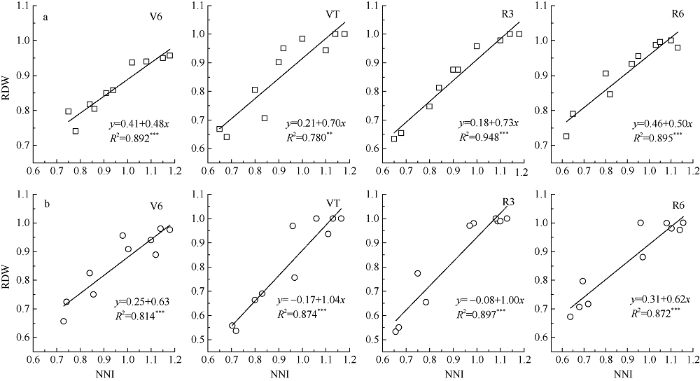
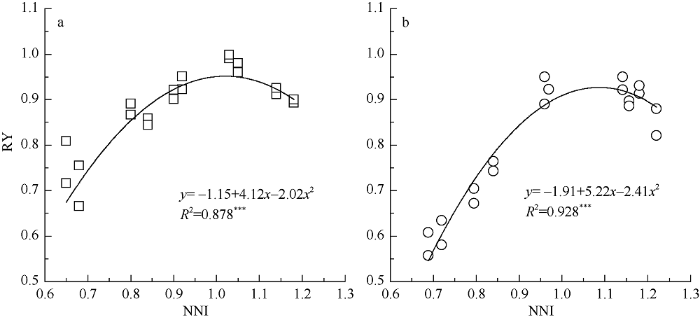
为了评价 NNI 在预测植株氮素盈亏上的可行性, 利用2018年和2019年独立的数据点分别研究2种降雨状况下旱地玉米氮营养指数(NNI)与相对吸氮量(RNupt)、相对地上部干物质量(RDW)和相对产量(RY)的关系。从图6可以看出, 不同干旱年型下旱地春玉米不同生育时期的NNI-RNupt均表现为线性相关, RNupt随NNI 的增加而增加, 穗期多雨年V6-R6各生育时期方程决定系数分别为0.848、0.868、0.863、0.871, 穗期干旱年V6-R6各生育时期方程决定系数分别为0.940、0.946、0.964、0.937, 均达到极显著水平。从图7可以看出, 旱地玉米不同生育时期NNI与RDW均表现为线性相关, RDW随着NNI的增加而增加, 穗期多雨年V6-R6各生育时期方程决定系数分别为0.892、0.780、0.948、0.895, 穗期干旱年V6-R6各生育时期方程决定系数分别为0.814、0.874、0.897、0.872, 均达到极显著水平。可以看出NNI与RY二者间呈二次函数关系(图8), 即RY随NNI的增加先升高后降低, 两种降水状况下决定系数分别为0.878和0.928, 均达到极显著水平。穗期多雨年NNI值为1.02时, RY获得最大值, 为0.95; 穗期干旱年NNI值为1.08时, RY获得最大值, 为0.92。图6
 新窗口打开|下载原图ZIP|生成PPT
图6不同降雨状况下旱地春玉米氮营养指数(NNI)与相对吸氮量(RNupt)的关系
a: 穗期多雨; b: 穗期干旱。缩写同
Fig. 6Relationships between nitrogen nutrition index (NNI) and relative nitrogen uptake (RNupt) under different precipitation patterns in dryland spring maize
a: rainy at the ear stage; b: drought at the ear stage. Abbreviations are the same as those given in
图7
 新窗口打开|下载原图ZIP|生成PPT
图7不同降雨状况下旱地春玉米氮营养指数(NNI)与相对地上部生物量(RDW)的关系
a: 穗期多雨; b: 穗期干旱。缩写同
Fig. 7Relationships between nitrogen nutrition index (NNI) and relative aboveground dry biomass (RDW) under different precipitation patterns in dryland spring maize
a: rainy at the ear stage; b: drought at the ear stage. Abbreviations are the same as those given in
图8
 新窗口打开|下载原图ZIP|生成PPT
图8不同降雨状况下旱地春玉米氮营养指数(NNI)与相对产量(RY)的关系
a: 穗期多雨; b: 穗期干旱。
Fig. 8Relationships between nitrogen nutrition index (NNI) and relative yield (RY) under different precipitation patterns in dryland spring maize
a: rainy at the ear stage; b: drought at the ear stage.
3 讨论
3.1 旱地春玉米临界氮浓度稀释曲线特征
本研究利用4年田间定位试验数据建立渭北旱地春玉米生长季2种降雨状况下的临界氮稀释曲线, 两种干旱年型下参数a值基本相同, 平均为35.51 g kg-1, 而参数b介于0.23~0.35之内。参数a代表当干物质为1 t hm-2时的植株氮含量, 表征的是作物生育初期内在的需氮特性。首先, 参数a值偏高, 原因可能是: 与李正鹏等[12]和Yue等[16]构建的模型相比受到气候因素影响, 关中平原和华北平原属于暖温带季风半湿润气候, 夏季炎热, 以种植夏玉米为主, 而渭北旱地属于暖温带半干旱型大陆性季风气候, 以种植春玉米为主。依据积温学说原理[26], 渭北旱地春玉米生育期(150 d)远高于关中和华北地区(110 d), 生育期延长意味着植株吸氮量增加[27]。其次, 与欧洲国家[17]春玉米种植区相比, 参数a相近, 但仍存在一定差异, 可能与土壤、玉米品种和气候条件有关。参数b描述的是植株氮含量随地上部干物质增加的递减关系, 其大小主要决定于氮素吸收量与干物质量的关系, 本研究所得参数b在穗期多雨年(2016年和2018年)为0.35, 与前人研究结果相比属于合理范围内; 而在穗期干旱年(2017年和2019年)参数b为0.23, 明显偏小, 可能是由于拔节期至抽雄期严重干旱, 抑制作物生长发育, 干旱对茎秆干物质积累影响较叶片更为严重[28], 导致茎叶比变大, 而叶片是活跃氮素存在的主要载体, 故植株氮含量下降缓慢; 在灌浆期至成熟期, 与多年相同阶段降雨量相比, 2017年和2019年降雨量明显偏多, 水分充足导致玉米根系活力衰弱过程减慢, 加大根系对土壤氮素利用能力, 从而减缓植株氮含量稀释过程, 最终导致参数b偏小。考虑到品种差异产生的影响, 利用郑单958试验数据构建模型, 用陕单8806独立试验数据对构建的模型进行验证, 发现构建的两个模型中参数a和参数b基本未发生改变(a. 穗期多雨: Nc=36.95DM-0.36; b. 穗期干旱: Nc=34.11DM-0.23)。但由于本试验参试品种较少, 所得模型的普适性可能不足, 在今后渭北旱地玉米生产实践中, 需要增加旱地施氮试验品种数量, 以便进一步验证和增强模型的普适性。同时, 本研究中构建的临界氮浓度稀释曲线模型, 涉及的降雨状况主要为“穗期多雨, 花粒期干旱”型和“穗期干旱, 花粒期多雨”型, 未涉及全生育期干旱型和全生育期多雨型, 后期试验可补充人工控制干旱胁迫或提供充足水分条件综合全面分析, 进一步不断完善该模型, 从而实现模型预测的通用性。
3.2 根据旱地玉米氮营养指数推荐适宜施氮量
氮营养指数(NNI)是基于作物临界氮稀释模型提出的指标, 以实际氮浓度与临界氮浓度的比值评价氮素营养状况以及定量动态描述作物生育期内氮素营养状况。本研究计算两种降雨干旱年型不同施氮处理下 NNI值发现: 穗期干旱年NNI值总体大于穗期多雨年, 这与2017年和2019年春玉米拔节至抽雄期受到水分胁迫有关, 此期干旱已经导致玉米叶片失水萎蔫, 生物量积累缓慢, 即使生育后期降水较多, 已经难以弥补前期生长亏缺, 授粉灌浆过程受阻, 产量显著降低。比较两种干旱年型下RY最高时的NNI值, 穗期干旱年(NNI=1.08)高于穗期多雨年(NNI=1.02), 可能主要由于2017年和2019年生育前期干旱, 植株氮素吸收量高, 但植株生物量积累少, 导致植株实际含氮量较高, 氮浓度稀释不足所致。不同干旱年型下玉米籽粒产量对不同施氮量处理的响应程度差异明显, 在相同施氮量处理下, 穗期干旱年籽粒产量分别仅为穗期多雨年的51.4%。与宁芳等[29]在渭北旱地推荐的春玉米最佳施氮量相近, 说明基于临界氮稀释曲线模型的NNI来评价植株氮营养状况具有可靠性。由于试验中N2 (180 kg hm-2)和N3 (270 kg hm-2)处理施氮量相差90 kg hm-2, 在不同降水状况下由NNI确定的理论施氮量范围差异很大, 这仅仅只是考虑了旱地玉米植株氮素营养需求的理论最高值, 如果考虑氮肥边际产量和经济收益, 结合两种干旱年型下各生育时期 NNI值和产量表现状况, 实际生产上穗期多雨年旱地玉米施氮量应该为N2和N3处理的平均值, 即施氮量225 kg hm-2相对较为适宜。穗期干旱年N2处理下NNI值略低于“1”, 表明氮素供应量适中, 即施氮量150~180 kg hm-2相对较为适宜。同时, 虽然在渭北旱地玉米实际生产中, 目前多采用氮肥一次性基施方式, 但为了保证玉米适时适量氮肥供给, 避免生育期内遭遇干旱所致的过量施氮和植株氮素奢侈吸收, 应该提倡旱地玉米“因雨精准施氮”管理, 具体施氮管理方案为: 基肥适当减施氮肥(即施氮量150~180 kg hm-2), 依据拔节至抽雄期降水量适量追施氮肥(即穗期多雨年可追施氮肥45~75 kg hm-2, 穗期干旱年不追氮肥), 实现旱地玉米氮肥高效利用和增产增收。4 结论
本研究建立并验证渭北旱地 2 种不同降雨状况下基于地上部干物质的春玉米临界氮稀释曲线(a.穗期多雨: Nc=35.98DM-0.35; b.穗期干旱: Nc=35.04DM-0.23), 就模型参数的变异性来看, 干旱年型对参数a并未产生影响, 但会明显改变参数b的大小。本研究利用氮营养指数评价植株氮营养状况, 2种降雨状况下N0 和N1处理的NNI均小于1, 表明存在氮素亏缺现象, N4处理NNI均明显大于1, 表现为氮素盈余, 存在氮素奢侈吸收现象。根据氮营养指数NNI值和产量表现, 渭北旱地玉米最佳施氮方案为基施氮肥150~180 kg hm-2, 穗期多雨年追施氮肥45~75 kg hm-2, 穗期干旱年不追氮肥。NNI与相对吸氮量(RNupt)、相对干物质量(RDW)和相对产量(RY)等指标间存在极显著相关性。穗期多雨年NNI值为1.02时, RY获得最大值, 为0.95; 穗期干旱年NNI值为1.08时, RY获得最大值, 为0.92。NNI可以直观反映2种降雨状况下旱地春玉米不同生育阶段的氮素盈亏状况。参考文献 原文顺序
文献年度倒序
文中引用次数倒序
被引期刊影响因子
[本文引用: 1]
[本文引用: 1]
[本文引用: 1]
[本文引用: 1]
[本文引用: 1]
[本文引用: 1]
[本文引用: 1]
[本文引用: 1]
[本文引用: 1]
[本文引用: 1]
[本文引用: 1]
[本文引用: 1]
[本文引用: 1]
[本文引用: 1]
[本文引用: 1]
[本文引用: 1]
[本文引用: 1]
[本文引用: 3]
[本文引用: 3]
[本文引用: 2]
[本文引用: 2]
[本文引用: 2]
[本文引用: 2]
[本文引用: 2]
[本文引用: 2]
[本文引用: 3]
[本文引用: 2]
[本文引用: 1]
[本文引用: 1]
[本文引用: 2]
[本文引用: 2]
DOI:10.1093/jexbot/53.370.789URLPMID:11912222

The rate of N uptake of crops is highly variable during crop development and between years and sites. However, under ample soil N availability, crop N accumulation is highly related to crop growth rate and to biomass accumulation. Critical N concentration has been defined as the minimum N concentration which allows maximum growth rate. Critical N concentration declines during crop growth. The relationship between critical N concentration and biomass accumulation over the growth period of a crop is broadly similar within major C(3) and C(4) cultivated species. Therefore, the critical N concentration concept is widely used in agronomy as the basis of the diagnosis of crop N status, and allows discrimination between situations of sub-optimal and supra-optimal N supply. The relationship between N and biomass accumulation in crops, relies on the interregulation of multiple crop physiological processes. Among these processes, N uptake, crop C assimilation and thus growth rate, and C and N allocation between organs and between plants, play a particular role. Under sub-optimal N supply, N uptake of the crop depends on soil mineral N availability and distribution, and on root distribution. Under ample N supply, N uptake largely depends on growth rate via internal plant regulation. Carbon assimilation of the crop is related to crop N through the distribution of N between mature leaves with consequences for leaf and canopy photosynthesis. However, although less commonly emphasized, carbon assimilation of the crop also depends on crop N through leaf area development. Therefore, crop growth rate fundamentally relies on the balance of N allocation between growing and mature leaves. Nitrogen uptake and distribution also depends on C allocation between organs and N composition of these organs. Within shoots, allocation of C to stems generally increases in relation to C allocation to the leaves over the crop growth period. Allocation of C and N between shoots and roots also changes to a large extent in relation to soil N and/or crop N. These alterations in C and N allocation between plant organs have implications, together with soil availability and carbon assimilation, on N uptake and distribution in crops. Therefore, N uptake and distribution in plants and crops involves many aspects of growth and development. Regulation of nitrogen assimilation needs to be considered in the context of these interregulatory processes.
[本文引用: 1]
[本文引用: 1]
DOI:10.1016/0378-4290(91)90040-3URL [本文引用: 1]
DOI:10.2134/agronj2013.0404URL [本文引用: 1]
Film mulching is a very common technique in agriculture worldwide, but few studies have focused on the dry matter (DM) and N accumulation of mulched crops. Understanding the grain yield (GY) associated with DM and N accumulation is essential for improving crop production. We conducted a 3-yr field experiment with six N fertilizer rates (0, 100, 200, 250, 300, and 400 kg ha(-1)) in the semiarid climate of northwest China to determine the GY and DM and N accumulation of film-mulched maize (Zea mays L.). The results showed that relatively high GYs (13.1-15.1 Mg ha-1) were obtained using N fertilizer rates of 200 to 400 kg ha(-1) in the 3 yr despite large year-to-year differences in rainfall. When the N rate was below 250 kg ha(-1), the GY, DM, and N accumulation increased significantly as the N fertilizer rate increased. A linear-plateau model best described the relationship between the GY and the DM and N accumulation during the pre-silking stage and a linear model the relationship during the post-silking stage. We conclude that optimizing N management to improve DM and N accumulation (especially post-silking) is the key to ensuring a high yield of film-mulched maize.
DOI:10.1016/j.eja.2005.10.001URL [本文引用: 1]
Abstract
Between flowering and maturity, leaf senescence reduces green leaf area while grains are filled from photosynthesis, nitrogen (N) uptake by roots and remobilisation from shoots. The question arises of possible effects of leaf senescence on photosynthesis, N uptake and remobilisation and their modification through genetic variations in senescence. To address this question, we compared three cultivars showing different behaviours. Tarro and Nicco are two modern hybrids presenting the same important grain sink but showing different time course of senescence, the former being normally senescent the latter “stay-green”. Déa hybrid, very well known by many previous experiments was the reference hybrid.The purpose was to monitor precisely the carbon (C) and N repartition in the main organs of the plant in connection with the progress of leaf senescence (experiment 1) and to measure the changes created by variations of N supply and soil-climate conditions (experiment 2).
In experiment 1, time course of leaf senescence of the different leaf stages and weight of leaves, shoots and grains and N concentration of shoots and grain were measured weekly. In experiment 2, the same three cultivars were grown at limiting and non-limiting N supply in four locations in France during 2 years. At flowering, silage and harvest stage, dry matter and N concentration were measured in the main parts of the plant, and leaf senescence was evaluated at silage stage.
On soil well supplied with N, Tarro had an identical rate of leaf senescence than Nicco for leaves below the ear, but higher for leaves above the ear. After flowering, Nicco accumulated more biomass than Tarro, but kept a larger part of this total biomass in the stem. In contrast, Tarro accumulated a larger part of total biomass in the grain.
After flowering, N uptake was larger in Nicco than Tarro. Shoot N concentration decreased earlier and more completely in Tarro than Nicco, indicating a larger remobilisation to the grain. Though Tarro began and finished grain filling simultaneously with Nicco, it reached 70% of final grain weight 25 °C d sooner than Nicco.
The senescence due to N stress differed from the physiological senescence of a senescent hybrid. The time course of the reproductive phase and the N repartition in the plant suggest that a threshold in grain filling or in shoot nitrogen decrease could be the internal signal triggering senescence of uppermost leaves.
[本文引用: 1]
DOI:10.3724/SP.J.1006.2019.83055URL [本文引用: 1]
水分不足是旱地玉米生长主要限制因素, 渭北旱塬雨养玉米种植区降水季节波动大, 干旱频繁发生, 已严重影响春玉米正常生长发育及产量稳定性。于2016—2018年在渭北旱塬合阳县进行旱地玉米施氮量定位试验, 设置5个施氮量处理, 2016—2017年包括0、75、150、270、360 kg hm -2(分别以N0、N75、N150、N270、N360表示), 2018年施氮量处理为0、90、180、270、360 kg N hm -2(分别以N0、N90、N180、N270、N360表示), 供试品种为郑单958 (ZD958)和陕单8806 (SD8806)。分析了不同降水分布年份施氮量对春玉米生育期土壤水分变化动态、干物质积累动态、产量构成、经济效益及水分利用效率(WUE)的影响。结果表明, 试验年份降水分布可分为穗期多雨、粒期干旱型(2016年和2018年)和穗期干旱、粒期多雨型(2017年)。生长季降水量及其分布显著影响土壤蓄水量和玉米地上部干物质积累, 从而影响玉米产量及其构成因素, 穗期干旱显著降低地上部干物质积累量和穗粒数, 粒期干旱会明显降低粒重。不同降水分布年份施氮处理较N0增产6.72%~91.23%不等, 施氮量对玉米产量、水分利用效率(WUE)影响呈现二次曲线关系, 穗期多雨、粒期干旱型以N270处理籽粒产量和WUE最高, 而穗期干旱、粒期多雨型以N150处理产量和WUE最好。籽粒产量与“休闲至抽雄期降水(FP2)”、“播前土壤蓄水量+播种至抽雄期降水(SP2)”相关性较强(FP2: R 2=0.839 **; SP2: R 2=0.837 **)。根据产量、水分利用和经济收益综合评价, 渭北旱地玉米最适施氮方案为基施氮肥150 kg hm -2, 再根据休闲至抽雄期降水量或播前土壤蓄水量与播种至抽雄期降水量之和预测产量, 估算并及时追施适宜施氮量。
