

1 山西农业大学 生命科学学院,山西 太谷 030801
2 山西农业大学 动物科技学院,山西 太谷 030801
网络出版时间:2016-06-12
基金项目:“十二五”国家科技支撑计划子课题(No. 2012BAD12B06-2),山西省科技攻关项目(No.20140311025-3),山西省自然科学基金(No. 2013011028-2),山西省高等学校教学改革项目(No. J2012026)资助
摘要: 为了评估转基因玉米和大豆在山西动物饲料市场的占有率和标识情况,采用改良十六烷基三甲基溴化铵法(Hexadecyltrimethy ammonium bromide, CTAB)提取山西市场抽取的30份鸡和猪饲料,通过定性PCR打包筛查,对检测阳性结果打包饲料拆包并检测CaMV35S启动子、NOS终止子、玉米内标zSSⅡb、大豆内标Lectin和CryIA (b)基因。同时检测玉米和大豆转化体事件MON810和GTS40-3-2。结果表明,83.3%的饲料含有转基因成分。所抽取的玉米、大豆、猪饲料和鸡饲料转基因成分阳性率分别为6.67%、100%、93.3%和73.3%。实时荧光定量PCR检测结果与定性PCR一致。结果提示,鸡和猪饲料中转基因成分在山西市场的占有率较高。
关键词: 商业化鸡饲料 商业化猪饲料 转基因玉米 转基因大豆 定性PCR 实时荧光定量PCR 转化体事件MON810和GTS40-3-2
Detection of transgenic components in animal feeds on Shanxi markets
Jianqin Yuan1, Hong Chang1, Jianghe Zhao1, Zhongwei Tang1, Zongyong Shi1, Jundong Wang2


1 College of Life Science, Shanxi Agricultural University, Taigu 030801, Shanxi, China;
2 College of Animal Science and Veterinary Medicine, Shanxi Agricultural University, Taigu 030801, Shanxi, China
Received: March 24, 2016; Accepted: May 3, 2016
Supported by:Key Projects in the National Science and Technology Pillar Program during the Twelfth Five-Year Plan Period of China (No. 2012BAD12B06-2), Science and Technology Key Program of Shanxi Province (No. 20140311025-3), Natural Science Foundation of Shanxi Province (No. 2013011028-2), Higher School Teaching Reform Project of Shanxi Province (No. J2012026)
Corresponding authors:Jundong Wang. Tel: +86-354-6288206; Fax: +86-354-6222942; E-mail: wangjd53@outlook.com
Abstract: To assess the presence of genetically modified (GM) maize and soybean in a range of commercialized feed in Shanxi province of China in 2015, improved hexadecyltrimethy ammonium bromide (CTAB) method was used to extract DNA. The screening of packed feeds was carried out by qualitative PCR. Then positive feeds were unpacked and detected by the CaMV35S promoter, NOS terminator, zSSⅡb, Lectin and CryIA (b) genes. The identified maize and soybean events were confirmed by event-specific MON810 and GTS40-3-2. Results showed that 83.3% of the feeds was tested positive for GMOs, in which positive rates of maize, soybean, pig and layer feeds were 6.67%, 100%, 93.3% and 73.3%, respectively. The results of real-time PCR were consistent with qualitative PCR. These results indicated that commercialized GM feed had a wide positive product scope in Shanxi province of China. Further studies are necessary to study effects of feeding livestock and poultry with feed containing GM ingredients on animals and their products.
Key words: commercialized layer feed commercialized pig feed genetically modified maize genetically modified soybean qualitative PCR real-time PCR event-specific MON810 and GTS40-3-2
IntroductionBy gene modification technique, compositions of plants, animals or microorganisms were altered to gain new characteristics, such as insect resistance, herbicide tolerance, modified nutritional composition or an enhanced shelf life, we call them genetically modified organisms (GMOs)[1-2]. Roundup ReadyTM soybean (RRS) was firstly produced by the Monsanto Company in Canada in 1996, which was approved for consumption[3-4]. According to the final reports of 2014, the planting of GM crops worldwide had reached 181.5 million hectares and constantly increased 106-fold since that first crop in global area[5-6]. Although GMOs had many advances, consumer had very strong reaction[3]. In China, regulations have come into force, which are the labeling and traceability of GM food. The regulations stipulate the requirement of labeling containing GM material, such as soybean seed, soybean flour, soybean, soybean oil, soybean meal, maize seeds, maize, maize oil and maize flour etc[7]. To comply with the requirements of legislation, usually reliable and practical detection methods is required[1, 8-13]. Before either GMO quantification or event identification, the starting point of GMO detection is generally evaluation of the screening method[2, 14]. Most of the PCR screening methods usually are to detect either CaMV 35S promoter (the cauliflower mosaic virus) or NOS terminator (the nopaline synthase) or both, because most GM products contain two or one of these sequences[8, 15]. zSSⅡb for maize and Lectin for soybean are species-specific PCR testing genes, which are present in both GM and non GM maize and soybean. For discrimination between non-approved and approved traits, event-specific PCR methods are used to identify the GMO event (for example GTS40-3-2 and MON810). PAT (Phosphinothricin acetyltransferase) gene mediates tolerance to the herbicide phosphinotricin (glufosinate). A number of soil bacteria naturally possess the PAT gene. Transgenic plants expressing the PAT gene are able to degrade the herbicide agent phospinotricin (glufosinate). BAR gene coding for phosphinothricin acetyltransferase had been isolated from Bacillus amylolique facions. PAT and BAR genes are widely used as selective markers for the transformation of higher plants. CryIA (b) gene is a synthetic gene encoding the 648 amino acids, insecticidal-active truncated product identical to CryIA (b) gene of Bacillus thuringiensis subsp (General Administration of Qality Spervision, Ispection and Quarantine of the People's Republic of China, SN/T 1202-2003).
Because GMOs have the worldwide high production and fairly uncertain of the current status of the foods, people pay particular attention to them. Soybean and maize were chosen because they were the staple constituents of feed[8, 16]. The study objective was to determine the ratio of GM-containing soybean and maize feed obtained from local feed manufacturer and retail shops in Shanxi of China in 2015.
1 Materials and methods1.1 FeedThirty soybean-and maize-containing feeds were purchased from 24 random local retail shops (20 feed manufacturers) in Shanxi of China in May 2015. In the 30 feeds (serial number: 01-30, there were layer feed and pig feed in three periods. Every period there were five different feed manufacturers or brands). In different periods, 5 kinds of feed manufacturers (brand) might be overlapping or different.), 15 layer feeds (including adding concentrate), accounted for about 50.0% of the total feeds, 15 pig feeds accounted for about 50% of the total feeds (Table 1).
Table 1 The composition of feed
| Pig feeds | Layer feeds | ||||
| Suckling pig feed | Mid-pig feed | Pregnancy sow feed | Early layer feed | Youth layer feed | Feed in laying period |
| 5 (01-02, 04-06) | 5 (07-11) | 5 (12-15, 24) | 5 (16-20) | 5 (21-23, 25-26) | 5(03, 27-30) |
表选项
1.2 Qualitative PCR1.2.1 Reference materialsCertified reference samples (CRS) (GTS40-3-2 1% soybean flour, MON810 1% maize flour and flour mixture -Bt176 1%, Bt11 1% and kefeng6 1% positive sample mixture flour), which were provided by the science and technology development center of China’s ministry of agriculture, were used as the positive controls in the study.
1.2.2 DNA extractionFor DNA isolation from feed and CRS, an improved version of the cetyltrimethyl ammonium bromide (CTAB) method was used. The collected DNA quantification (concentration and purity) was achieved by measuring the UV absorption at 260 nm and 280 nm using a biophotometer (Eppendorf.AG, Germany) and stored at -20 ℃ until used.
1.2.3 PCR primersThe CaMV 35S promoter and the NOS terminator for amplifying the specific DNA sequences were used for the GMO screening of the products[17]. The amplification of extracted DNA was verified using plant-specific primers targeting the zSSⅡb for maize, the Lectin for soybean, specific sequences present in MON 810 event and RRS (GTS40-3-2) for specific GMO detection[18-19]. Primers for amplifying CryIA (b), BAR and PAT genes were used[20-21]. The primer names, orientation, sequences and length synthesized by TAKARA BIOTECHNOLOGY (Dalian, China) in the study were summarized in Table 2.
Table 2 The primers used in the study
| Primers | Orientation | Sequence (5′-3′) | Fragment length (bp) |
| zSSⅡb | Sense | CGGTGGATGCTAAGGCTGATG | 88 |
| Anti-sense | AAAGGGCCAGGTTCATTATCCTC | ||
| Lectin | Sense | GCCCTCTACTCCACCCCCATCC | 118 |
| Anti-sense | GCCCATCTGCAAGCCTTTTTGTG | ||
| CaMV 35S | Sense | GCTCCTACAAATGCCATCATTGC | 195 |
| Anti-sense | GATAGTGGGATTGTGCGTCATCCC | ||
| NOS | Sense | GAATCCTGTTGCCGGTCTTG | 180 |
| Anti-sense | TTATCCTAGTTTGCGCGCTA | ||
| PAT | Sense | GTCGACATGTCTCCGGAGAG | 191 |
| Anti-sense | GCAACCAACCAAGGGTATC | ||
| BAR | Sense | ACAAGCACGGTCAACTTCC | 175 |
| Anti-sense | ACTCGGCCGTCCAGTCGTA | ||
| CryIA (b) | Sense | CTGGTGGACATCATCTGGGGCATCTTCG | 146 |
| Anti-sense | TTGGTACAGGTTGCTCAGGCCCTCC | ||
| MON810 | Sense | CAAGTGTGCCCACCACAGC | 106 |
| Anti-sense | GCAAGCAAATTCGGAAATGAA | ||
| GTS40-3-2 | Sense | TTCAAACCCTTCAATTTAACCGAT | 370 |
| Anti-sense | AAGGATAGTGGGATTGTGCGTC |
表选项
1.3 Real-time PCR of feed samples1.3.1 Reference materialsCertified reference material (CRM) (Soya seed powder-GTS40-3-2 Soya (10%), Catalog Number: ERM-BF410GK, IRMM).
1.3.2 PCR primersThe names, orientation, sequences and length of the primer and probe (synthesized by TAKARA BIOTECHNOLOGY, Dalian, China) were summarized in Table 3[17, 22]. The amplifications were performed with using Code NO. RR390A from TAKARA BIOTECHNOL (Dalian, China).
Table 3 Real-time PCR primer sequences
| Detection genes | Sequence (5′-3′) | Amplicon size (bp) |
| GTS40-3-2 | CAT TTG GAG AGG ACA CGC TGA | 74 |
| GAG CCA TGT TGT TAA TTT GTG CC | ||
| FAM-CAA GCT GAC TCT AGC AGA TCT TTC-TAMRA | ||
| Lectin | CCA GCT TCG CCG CTT CCT TC | 74 |
| GAAGGCAAGCCCATCTGCAAGCC | ||
| FAM-CTT CAC CTT CTA TGC CCC TGA CAC-TAMRA |
表选项
1.3.3 Calculating transformant contentThe experiment observed and analyzed standard curve and amplification curve, calculated transformant content.
2 Results and discussion2.1 Concentration and purity of DNAIn our study, an appropriate quality and quantity of DNA could be extracted from the feed samples using the improved CTAB method (Fig. 1).The date showed that DNA concentration and purity (A 260/A 280) extracted by improved CTAB method ranged from 120.9 μg/mL to 778.3 μg/mL and 1.7 to 1.99, respectively. The results showed that improved CTAB method gave sufficient yield of DNA.
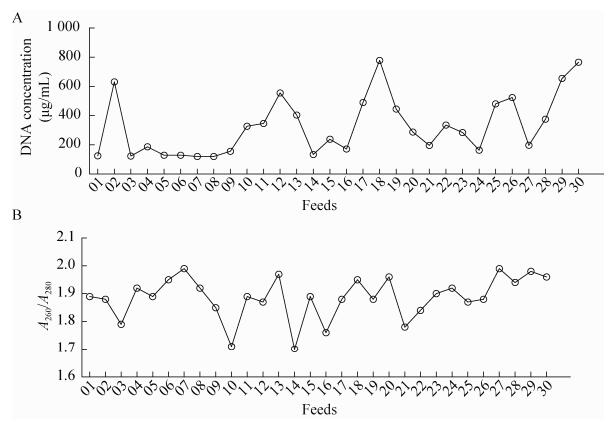 |
| Figure 1 The concentration and purity of DNA extracted from feeds. The graph A and B respectively on behalf of concentration and purity of DNA extracted from feeds; 01-30: 01-30 feed samples. |
| 图选项 |
In order to isolate DNA from feeds with different components of GMOs, the improved CTAB were used (Fig. 1). According to the characteristics of the feed production and processing steps in the traditional, the CTAB method was simplified, reagents used commonly in laboratory could be done. Compared to the (high) cost of the kit (40 RMB per time), the cost of the improved CTAB method was 2 RMB per time. Simultaneously, the improved CTAB method could reduce the extraction time of the kit method by at least 50 min. With the improved CTAB method, successful species-specific PCR testing (zSSⅡb for maize and Lectin for soybean) and high amplification success rate were achieved with 30 different kinds of feeds extracts just one time, which confirmed that these extracts contained a sufficient amount of amplifiable DNA. In our work, the improved CTAB method was more effective and less time-consuming in comparison with the existing kit methods for isolation of DNA from plant-derived foods and feed.
2.2 Screening of GMOs by packing feedsThe 30 feeds mentioned above were packaged as 5 packages (6 samples in each package) for detecting by the CaMV 35S promoter, NOS terminator, CryIA (b), BAR and PAT genes by PCR, all DNA of feeds were run in duplicate. A 195 bp fragment (CaMV 35S promoter) was detected in all 5 packages feeds produced through PCR amplification. Through the process of detecting, feeds of 5 packages gave 180 bp positive amplification signal of NOS gene. Both packed feeds 01-06, 19-24 amplified 146 bp CryIA (b) gene signal. The target fragments of BAR (175 bp) and PAT (191 bp) genes could not be detected in all feeds (Fig. 2).
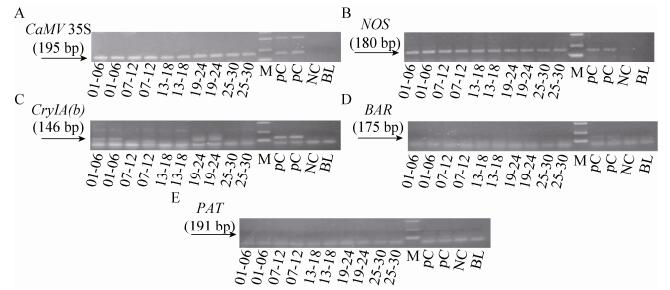 |
| Figure 2 The electrophoregram of CaMV 35S, NOS, CryIA (b), BAR and PAT genes of packing feeds. The electrophoregram A, B, C, D and E respectively on behalf of detecting CaMV 35S, NOS, CryIA (b), BAR and PAT genes; 01-30: 01-30 feed samples; positive control (PC): Bt176 1%, Bt11 1% and kefeng6 1% positive sample mixture flour; negative control (NC): negative sample (maize flour); blank (BL): ultrapure water; M: DL2 000 marker (2 000 bp, 1 000 bp, 750 bp, 500 bp, 250 bp, 100 bp). |
| 图选项 |
2.3 Specific gene detection of GMOsAccording to the results, the positive-packed feeds were subsequently unpacked and detected by CaMV 35S promoter, NOS terminator, CryIA (b), Lectin and zSSⅡb genes. All DNA of feeds were run in duplicate excepting for zSSⅡb gene (simple sample).
2.3.1 CaMV 35S promoter PCR30 feed samples were detected by CaMV 35S promoter. 01-23, 25-26 feed samples gave 195 bp positive amplification signal (Fig. 3).
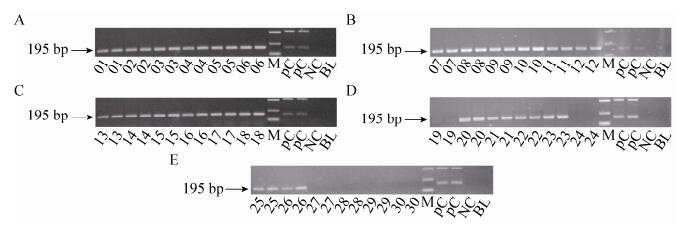 |
| Figure 3 The electrophoregram of CaMV 35S promoter. 01-30: 01-30 feed samples; positive control (PC): Bt176 1%, Bt11 1% and kefeng6 1% positive sample mixture flour; negative control (NC): negative sample (maize flour); blank (BL): ultrapure water, respectively; M: DL2 000 marker (2 000 bp, 1 000 bp, 750 bp, 500 bp, 250 bp, 100 bp). |
| 图选项 |
2.3.2 NOS terminator PCR01-30 feed samples were detected by NOS terminator. 180 bp fragment of NOS terminator for 01-18, 20-23 and 25-26 feed samples were produced through PCR amplification (Fig. 4).
 |
| Figure 4 The electrophoregram of NOS terminator. 01-30: 01-30 feed samples; positive control (PC): Bt176 1%, Bt11 1% and kefeng6 1% positive sample mixture flour; negative control (NC): negative sample (maize flour); blank (BL): ultrapure water, respectively; M: DL2 000 marker (2 000 bp, 1 000 bp, 750 bp, 500 bp, 250 bp, 100 bp). |
| 图选项 |
2.3.3 CryIA (b) gene PCR01-30 feed samples were detected by CryIA (b) gene. The target fragments of CryIA (b) gene could be detected in 03 and 19 feeds (Fig. 5).
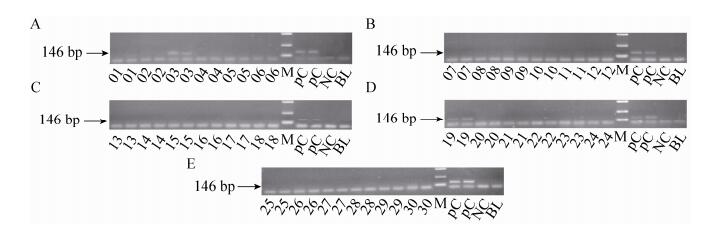 |
| Figure 5 The electrophoregram of CryIA (b) gene. 01-30: 01-30 feed samples; positive control (PC): Bt176 1%, Bt11 1% and kefeng6 1% positive sample mixture flour; negative control (NC): negative sample (maize flour); blank (BL): ultrapure water, respectively; M: DL2 000 marker (2 000 bp, 1 000 bp, 750 bp, 500 bp, 250 bp, 100 bp). |
| 图选项 |
2.3.4 Lectin gene PCR01-30 feed samples were detected by Lectin gene. 01-18, 20-23, 25-26 feeds gave 118 bp positive amplification signal of Lectin gene (Fig. 6).
 |
| Figure 6 The electrophoregram of Lectin gene of 01-30 feed samples. 01-30: 01-30 feed samples; PC: GTS40-3-2 event flour; NC: negative sample (soybean flour) and BL: ultrapure water, M: DL2 000 marker (2 000 bp, 1 000 bp, 750 bp, 500 bp, 250 bp, 100 bp). |
| 图选项 |
2.3.5 ZSSⅡb gene PCRThe 30 feed samples (01-30) were unpacked for detecting by the zSSⅡb gene. The target fragments of 88 bp zSSⅡb gene could be detected in all feed (Fig. 7).
 |
| Figure 7 The electrophoregram of zSSⅡb gene. 01-30: 01-30 feed samples; positive control (PC): Bt176 1%, Bt11 1% and kefeng6 1% positive sample mixture flour; negative control (NC): negative sample (maize flour); blank (BL): ultrapure water, respectively; M: DL2 000 marker (2 000 bp, 1 000 bp, 750 bp, 500 bp, 250 bp, 100 bp). |
| 图选项 |
2.4 Event-specific qualitative PCRAccording to the results, the positive feeds were unpacked and detected by specific MON810 and GTS40-3-2 events.
2.4.1 GTS40-3-2 event PCRThe 24 positive feeds (01-18, 20-23 and 25-26) containing soybean (Lectin gene) were detected for the presence of specific GM GTS40-3-2 event. All these feeds gave 370 bp positive amplification signal of GTS40-3-2 (Fig. 8). DNA of feeds were run in single sample.
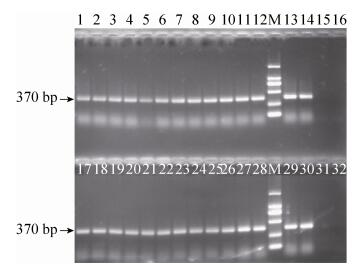 |
| Figure 8 The electrophoregram of GTS40-3-2. 1-12 lanes: 01-12 feed samples; 17-28 lanes: 13-18, 20-23, 25-26 feed samples; 13-14, 29-30 lanes: GTS40-3-2 positive sample flour; 15, 31 lanes: negative sample (soybean flour); 16, 32 lanes: ultrapure water; M: DL2 000 marker (2 000 bp, 1 000 bp, 750 bp, 500 bp, 250 bp, 100 bp). |
| 图选项 |
2.4.2 MON810 event PCRFeeds (03 and 19) were detected by MON810 event. By detecting, 106 bp amplification signal of MON810 was produced for both feeds (Fig. 9). DNA of feeds was run in triple.
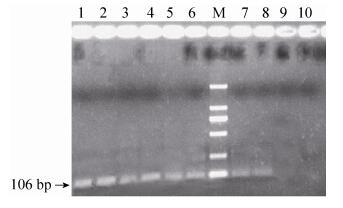 |
| Figure 9 The electrophoregram of MON810 of 03 and 19 feed samples. 1-3 lanes: 03 feed sample; 4-6 lanes: 19 feed sample; 7-8 lanes: MON810 1% positive sample flour; 9 lane: negative sample (maize flour); 10 lane: ultrapure water; M: DL2 000 marker (2 000 bp, 1 000 bp, 750 bp, 500 bp, 250 bp, 100 bp). |
| 图选项 |
2.5 The summary of detecting results of feedsIn 30 feeds, 25 feeds contained GM ingredients. 01-02, 04-18, 20-23, 25-26 feeds contained CaMV 35S promoter, NOS terminator, GTS40-3-2 event, zSSⅡb and Lectin genes. 03 feed contained CaMV 35S promoter, NOS terminator, MON810 event, zSSⅡb, Lectin and CryIA (b) genes. 19 feed contained CaMV 35S promoter, MON810 event, zSSⅡb and CryIA (b) genes. 24, 27-30 feeds were non GM, only contained zSSⅡb (Fig. 10). The overall results of GMO screening of 5 packed feeds were 100% for CaMV 35S promoter, 100% for NOS terminator, 20% for CryIA (b) and 0% for BAR gene and PAT gene. The detecting results of 30 feed samples showed that 83.3% of the feeds were tested positive for GMOs, in which positive rates of maize, soybean, pig and layer feeds were 6.67%, 100%, 93.3% and 73.3%, respectively. In conclusion, commercialized GM feed had a wide positive product scope in Shanxi province of China. The composition and positive rate of feeds were as shown (Fig. 11).
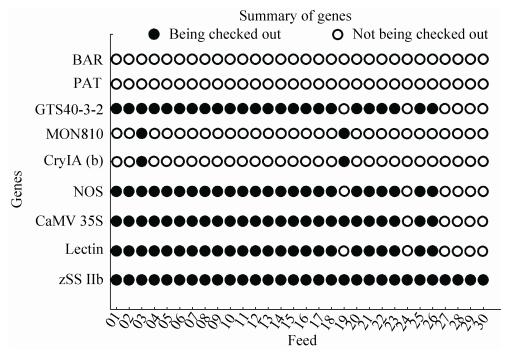 |
| Figure 10 The summary of detecting results of 01-30 feed samples. |
| 图选项 |
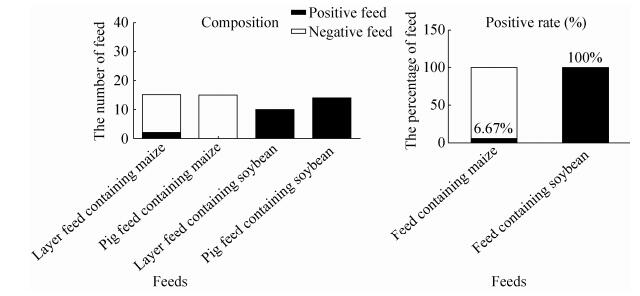 |
| Figure 11 The composition and positive rate of 30 feed samples. |
| 图选项 |
2.6 Real-time PCR of feed samplesAccording to the qualitative results, 24 feed samples of containing genes of Lectin and GTS40-3-2 were detected by real-time PCR.
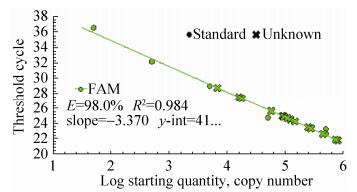
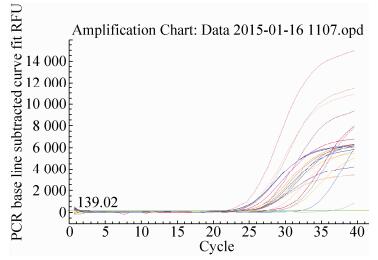
2.6.1 Lectin gene real-time PCRThe quantitative results of Lectin gene from identified 24 feeds DNA were presented in Fig. 12 and Fig. 13. The obtained real-time PCR results were according to those requirements since the correlation coefficient (R2) of standard curves was, generally, ≥0.98, while PCR efficiencies ranged, on average, from 93.9% to 100.6%, indicating the adequacy of the standard curves for quantification. In Fig. 12, standard of Lectin gene had a typical amplification curve. Amplification efficiency was 98.0%, R2 of standard curves was 0.984 > 0.98, slope of standard curve was -3.370 > -3.6 and < -3.1, indicating the adequacy of the standard curves for quantification. In Fig. 13, negative control (salmon sperm DNA) and blank control (water) had not typical amplification curve of Lectin gene, the DNA of all feed samples in Lectin gene amplification curve appeared typical amplification curve. In amplification results (generated by the Excel table), Ct values and copy numbers of all feed samples were in Table 4.
 |
| Figure 12 Lectin gene standard curve. |
| 图选项 |
 |
| Figure 13 Lectin gene amplification curve. |
| 图选项 |
Table 4 The Ct value and copy number of Lectin gene from 24 feed samples
| Sample number | Ct value | Copies/2 μL | Sample number | Ct value | Copies/2 μL |
| 01 | 27.33 | 1.77E+04 | 13 | 24.24 | 1.46E+05 |
| 02 | 28.89 | 2.06E+04 | 14 | 24.68 | 1.08E+05 |
| 03 | 27.08 | 7.05E+04 | 15 | 24.94 | 9.05E+04 |
| 04 | 26.75 | 8.83E+04 | 16 | 23.26 | 5.00E+05 |
| 05 | 27.30 | 6.07E+04 | 17 | 22.63 | 5.00E+05 |
| 06 | 25.61 | 5.73E+04 | 18 | 24.73 | 5.00E+04 |
| 07 | 27.49 | 1.59E+04 | 20 | 23.47 | 2.48E+05 |
| 08 | 24.89 | 9.35E+04 | 21 | 28.74 | 6.76E+03 |
| 09 | 24.50 | 1.22E+05 | 22 | 21.87 | 7.37E+05 |
| 10 | 24.87 | 9.49E+04 | 23 | 23.30 | 2.77E+05 |
| 11 | 21.87 | 7.37E+05 | 25 | 24.95 | 8.99E+04 |
| 12 | 22.61 | 4.46E+05 | 26 | 21.75 | 7.99E+05 |
表选项
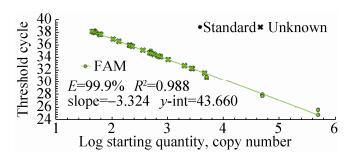
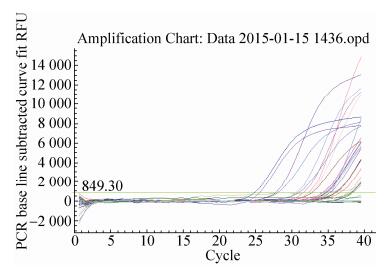
2.6.2 GTS40-3-2 gene real-time PCRThe quantitative results of special event GTS40-3-2 gene from identified 24 feeds DNA were presented in Fig. 14 and Fig. 15. In Fig. 14, standard of GTS40-3-2 gene had a typical amplification curve. Amplification efficiency was 99.9%, R2 of standard curves was 0.988 > 0.98, slope of standard curve was -3.324 > -3.6 and < -3.1, indicating the adequacy of the standard curves for quantification. In Fig. 15, negative control (salmon sperm DNA) and blank control (water) had not typical amplification curve of GTS40-3-2, the DNA of all feed samples in GTS40-3-2 gene amplification curve appeared typical amplification curve. In amplification results (generated by the Excel table), Ct values and copy numbers of all feed samples were in Table 5.
 |
| Figure 14 GTS40-3-2 gene amplification curve. |
| 图选项 |
 |
| Figure 15 GTS40-3-2 gene amplification curve. |
| 图选项 |
Table 5 The Ct value and copy number of GTS40-3-2 gene from 24 feed samples
| Sample number | Ct value | Copies/2 μL | Sample number | Ct value | Copies/2 μL |
| 01 | 36.17 | 2.03E+02 | 13 | 35.16 | 3.61E+02 |
| 02 | 34.30 | 7.39E+02 | 14 | 34.51 | 5.67E+02 |
| 03 | 32.47 | 2.62E+03 | 15 | 34.11 | 7.48E+02 |
| 04 | 34.68 | 5.69E+02 | 16 | 32.84 | 2.02E+03 |
| 05 | 34.78 | 5.29E+02 | 17 | 31.65 | 4.60E+03 |
| 06 | 34.63 | 5.20E+02 | 18 | 34.44 | 6.69E+02 |
| 07 | 34.11 | 7.48E+02 | 20 | 32.68 | 2.01E+03 |
| 08 | 34.51 | 5.67E+02 | 21 | 32.47 | 2.62E+03 |
| 09 | 32.22 | 2.78E+03 | 22 | 31.65 | 4.60E+03 |
| 10 | 32.26 | 2.68E+03 | 23 | 34.75 | 4.80E+02 |
| 11 | 34.24 | 6.84E+02 | 25 | 35.96 | 2.07E+02 |
| 12 | 35.96 | 2.07E+02 | 26 | 31.49 | 4.59E+03 |
表选项
2.6.3 The content of the special event GTS40-3-2 in the feedsThe content of the special event GTS40-3-2 in the feeds was calculated according to the following formula:
| ${\rm{C}} = \frac{{{n_{GTS40 - 3 - 2}}}}{{{n_{Lectin}}}} \times 100\% $ |
Table 6 The GTS40-3-2 transformant content of 24 feed samples
| Sample number | Transformant content (%) | Sample number | Transformant content (%) |
| 01 | 1.15 | 13 | 0.25 |
| 02 | 3.59 | 14 | 0.53 |
| 03 | 3.72 | 15 | 0.83 |
| 04 | 0.64 | 16 | 0.40 |
| 05 | 0.87 | 17 | 0.92 |
| 06 | 0.91 | 18 | 1.34 |
| 07 | 4.70 | 20 | 0.81 |
| 08 | 0.61 | 21 | 0.39 |
| 09 | 2.28 | 22 | 0.62 |
| 10 | 2.82 | 23 | 0.17 |
| 11 | 0.09 | 25 | 0.23 |
| 12 | 0.05 | 26 | 0.57 |
表选项
In our study, all 30 feeds were packed (6 feeds of each package) and screened, 5 packages (100%) were determined to be positive for two or three of the novel sequences which indicated the presence of GMOs. The dispersion of these positive packed feeds within soybean and maize were as follows: 25 of the 30 total (83.3%) detected all feeds, 11 of the 15 total (73.3%) detected layer feeds, 14 of the 15 total (93.3%) detected pig feeds were positive (Fig. 11). All 30 feeds contained maize composition, 2 of 30 feeds (6.7%) which were layer feeds were positive of MON810. 30 feeds had 24 feeds containing soybean composition, 24 feeds (10 for chicken feed, 14 for pig feed) containing soybean (100%) tested positive for GTS40-3-2 event, that came mostly from soybean meal of oil residue from imported soybean. Layer feeds had 2 positive feeds of MON810 event, pig feeds had not been detected positively for the composition of MON810 event. The data showed maize sources varied in different feed manufacturers. The ratio of positive feed containing layer feed seemed to be lower than that of the pig feed, which was a different result than was expected. In fact, there were 4 concentrate supplements of layer feeds including DDGS protein feed, dry maize lees protein feed and shoetree maize husk powder and maize feed (raw material-layer), which were also included in the layer feeds. According to the test results, a positive rate of transgenic maize in feed was very low in the market of Shanxi. The results in which we did not detect genetically modified ingredients in these concentrate supplement were also normal. In this study, positive feeds only had one feed (soybean meal) marked as “genetically modified” composition; genetically modified product identification rate was only 3.33%. Furthermore, we also found that on the identified feed products’ packaging logo, the font was very small and hard to recognize.
Amplification of the maize-specific zSSⅡb sequence in 30 feeds and the soybean-specific Lectin sequence in 24 feeds confirmed that the feeds containing 5 negative feeds and 1 positive feed were negative for Lectin, which indicated that these feeds did not contain soybean DNA. The above mentioned 24 CaMV 35S and/or 23 NOS positive soybean feeds were analyzed for RRS and all of them gave positive amplification signal (GTS40-3-2 event) (Fig. 8). The other 2 positive feed samples containing CryIA (b) were screened for the presence of specific GM maize events. For this purpose, PCR detections of specific sequences of MON 810 event (containing zSSⅡb, CaMV 35S, CryIA (b) and MON 810 genes) was performed (Fig. 9). 03 and 19 positive feeds (containing zSSⅡb, CaMV 35S, CryIA (b) and MON810) were identified as containing MON810 event. The results of our study showed that 1 feed (19) was negative for the NOS terminator while positive for the CaMV 35S promoter (maize containing feed). In our study, the NOS negative feed was determined to be MON810 maize feed and thus confirmed that the feed was true positive although they did not give any amplification signal with the NOS. In case of maize, it could also be related to the lack of the NOS terminator common in several maize events, for example MON810. Similarly, detection of both the CaMV 35S and the NOS sequences in another feed (03) confirmed the GM maize MON810 event (containing CaMV 35S) and GM soybean GTS40-3-2 event (containing NOS) presence.
By real-time PCR, 24 feed samples of containing genes of Lectin and GTS40-3-2 were detected. The results showed that they contained different content of GTS40-3-2 transformant (0.05%-4.70%, Table 6). The results were consistent with qualitative PCR (Fig. 10).
In this study, we demonstrated that many layer and pig feeds containing GM GTS40-3-2 event and a small number of layer feeds containing GM MON810 event were sold commercially in Shanxi of China.
参考文献
| [1] | Greiner R, Konietzny U. Presence of genetically modified maize and soy in food products sold commercially in Brazil from 2000 to 2005.Food Control,2008, 19(5): 499–505.DOI: 10.1016/j.foodcont.2007.05.016 |
| [2] | Arun ??, Y?lmaz F, Murato?lu K. PCR detection of genetically modified maize and soy in mildly and highly processed foods.Food Control,2013, 32(2): 525–531.DOI: 10.1016/j.foodcont.2013.01.023 |
| [3] | Ujhelyi G, Vajda B, Béki E, et al. Surveying the RR soy content of commercially available food products in Hungary.Food Control,2008, 19(10): 967–973.DOI: 10.1016/j.foodcont.2007.10.004 |
| [4] | Fernandes TJR, Amaral JS, Oliveira MBPP, et al. A survey on genetically modified maize in foods commercialised in Portugal.Food Control,2014, 35(1): 338–344.DOI: 10.1016/j.foodcont.2013.07.017 |
| [5] | James C.Global status of commercialized Biotech/GM crops:2014.ISAAA Brief No.47.Ithaca, NY:ISAAA, 2014. |
| [6] | Huang DF. Review of transgenic crop breeding in China.Chin J Biotech,2015, 31(6): 892–900.(in Chinese). 黄大昉. 我国转基因作物育种发展回顾与思考.生物工程学报, 2015, 31(6): 892-900. |
| [7] | Ministry of Agriculture of the People's Republic of China.Chinese Agriculture Department Public Announcement No.10-2002 Agricultural genetically modified organism's identity management measures[EB/OL].[2010-07-15].http://www.moa.gov.cn/ztzl/zjyqwgz/zcfg/201007/t20100717_1601302.htm. |
| [8] | Forte VT, Di Pinto A, Martino C, et al. A general multiplex-PCR assay for the general detection of genetically modified soya and maize.Food Control,2005, 16(6): 535–539.DOI: 10.1016/j.foodcont.2004.05.010 |
| [9] | Zhu YZ.Study on transgenic detection with PCR and feeding safety of glyphosate-tolerant soybeans[D].Beijing:China Agricultural University, 2004(in Chinese). 朱元招.抗草甘膦大豆转基因PCR检测及其饲用安全研究[D].北京:中国农业大学, 2004. |
| [10] | Zhu YZ, Yin JD, Li DF, et al. Study on metabolism of exogenous DNA from transgenic soybean meal in grower pigs.Acta Vet Zootech Sin,2005, 36(10): 1083–1086.(in Chinese). 朱元招, 尹靖东, 李德发, 等. 生长猪对转基因豆粕外源DNA的代谢研究.畜牧兽医学报, 2005, 36(10): 1083-1086. |
| [11] | Zhao ZH, Yang LT, Ai XJ, et al. Analysis of the influence on physiological metabolism and genetic horizontal transformation of rats fed roundup ready soybean meal.J Nanjing Agr Univ,2006, 29(1): 77–80.(in Chinese). 赵志辉, 杨立桃, 艾晓杰, 等. 转基因抗草苷膦大豆对大鼠生理代谢的影响及外源基因水平转移研究.南京农业大学学报, 2006, 29(1): 77-80. |
| [12] | Tan JZ.The feed safety assessment of glyphosate-tolerant soybean meal in broilers[D].Beijing:Chinese Academy of Agriculture Sciences, 2011(in Chinese). 谭建庄.抗草甘膦转基因豆粕对肉仔鸡的饲用安全性评定[D].北京:中国农业科学院, 2011. |
| [13] | Lu CB, Zhang W, Liu B, et al. Effects of transgenic soybean feed on proliferation of spleen lymphocyte in male mice.Soybean Sci,2012, 31(2): 291–294.(in Chinese). 芦春斌, 张伟, 刘标, 等. 抗草甘膦转基因大豆饲料对雄性小鼠脾淋巴细胞体外增殖的影响.大豆科学, 2012, 31(2): 291-294. |
| [14] | Gryson N, Dewettinck K, Messens K. Detection of genetically modified soy in doughs and cookies.Cereal Chem,2007, 84(2): 109–115.DOI: 10.1094/CCHEM-84-2-0109 |
| [15] | Miraglia M, Berdal KG, Brera C, et al. Detection and traceability of genetically modified organisms in the food production chain.Food Chem Toxicol,2004, 42(7): 1157–1180.DOI: 10.1016/j.fct.2004.02.018 |
| [16] | GMO Compass, GMO Database.Genetically modified food and feed:authorization in the EU[EB/OL].[2006-06-02].http://www.gmo-compass.org/eng/regulation/regulatory_process/156.european_regulatory_system_genetic_engineering.html. |
| [17] | Ministry of Agriculture of the People's Republic of China. Chinese Standard Agriculture Department Public Announcement No.1782-3-2012.Detection of genetically modified plants and derived products.Qualitative PCR method for the regulatory elements CaMV 35S promoter, FMV 35S promoter, NOS promoter, NOSterminator and CaMV 35S terminator.Beijing: China Agriculture Press, 2012: 1-9(in Chinese). 中华人民共和国农业部. 农业部1782号公告-3-2012转基因植物及其产品成分检测调控元件CaMV 35S启动子、FMV 35S启动子、NOS启动子、NOS终止子和CaMV 35S终止子定性PCR方法.北京: 中国农业出版社, 2012: 1-9. |
| [18] | Ministry of Agriculture of the People's Republic of China. Chinese Standard Agriculture Department Public Announcement No.869-9-2007.Detection of genetically modified plants and derived products qualitative PCR method for insect-resistant maize MON810 and its derivates.Beijing: China Agriculture Press, 2014: 69-74(in Chinese). 中华人民共和国农业部. 农业部869号公告-9-2007转基因植物及其产品成分检测抗虫玉米MON810及其衍生品种定性PCR方法.北京: 中国农业出版社, 2014: 69-74. |
| [19] | Ministry of Agriculture of the People's Republic of China. Chinese Standard Agriculture Department Public Announcement No.1861-2-2012.Detection of genetically modified plants and derived products.Qualitative PCR method for herbicide-tolerant soybean GTS 40-3-2 and its derivates.Beijing: China Agriculture Press, 2013: 1-5(in Chinese). 中华人民共和国农业部. 农业部1861号公告-2-2012转基因植物及其产品成分检测耐除草剂大豆GTS 40-3-2及其衍生品种定性PCR方法.北京: 中国农业出版社, 2013: 1-5. |
| [20] | General Administration of Quality Supervision, Inspection and Quarantine of the People's Republic of China, China National Standardization Management Committee. SN/T 1201-2003 protocol of PCR for detection of genetically modified feed.Beijing: China Standards Press, 2004: 1-8(in Chinese). 中华人民共和国国家质量监督检验检疫总局. SN/T 1201-2003植物性饲料中转基因成分定性PCR检测方法.北京: 中国标准出版社, 2004: 1-8. |
| [21] | General Administration of quality supervision, inspection and Quarantine of the people's Republic of China, China National Standardization Management Committee. SN/T 1202-2003 Protocol of the qualitative polymerase chain reaction for detecting genetically modified plant components in food.Beijing: China Standards Press, 2004: 1-10(in Chinese). 中华人民共和国国家质量监督检验检疫总局. SN/T 1202-2003食品中转基因植物成分定性PCR检测方法.北京: 中国标准出版社, 2004: 1-10. |
| [22] | General Administration of Quality Supervision, Inspection and Quarantine. GB/T 19495.5-2004 Detection of genetically modified organisms and derived products-quantitative nucleic acid based methods.Beijing: China Standards Press, 2007: 5-9(in Chinese). 国家质量监督检验检疫总局. GB/T 19495.5-2004转基因产品检测核酸定量PCR检测方法.北京: 中国标准出版社, 2007: 5-9. |
