 , 杨圣文2, 陈岩1, 杨桂朋1

1. 中国海洋大学化学化工学院, 青岛 266100;
2. 哈尔滨工业大学(威海校区), 威海 264209
收稿日期: 2020-09-15; 修回日期: 2020-10-18; 录用日期: 2020-10-18
基金项目: 国家重点研发计划(No.2016YFA0601300);国家自然科学基金重点项目(No.41830534)
作者简介: 巩春燕(1995-), 女, E-mail: gongcy07@163.com
通讯作者(责任作者): 杨桂朋, E-mail: gpyang@ouc.edu.cn
摘要:为探究海洋中一氧化碳(CO)的排放对全球碳循环的意义,于2019年冬季采用顶空法对黄海和东海CO的分布和海-气通量进行了研究.结果表明,调查海域大气中CO的体积分数为239×10-9~941×10-9,平均值为(588±155)×10-9.大气中CO体积分数最高值出现在北黄海近岸站位,最低值出现在东海南部,整体呈现黄海高、东海低的特点,且表现出明显的由近岸向外海降低趋势.表层海水CO浓度为0.39~2.80 nmol·L-1,平均值为(1.23±0.45)nmol·L-1.表层海水CO浓度高值区出现在东海东部,低值区出现在东海南部,受太阳光辐射和水团影响较大.CO的垂直分布上,浓度最大值一般出现在表层,随深度增加呈现逐渐降低的趋势.表层海水中过饱和系数α为0.99~8.67,平均值为2.61±1.42.CO海-气通量的变化范围为-0.05~41.38 nmol·m-2·h-1,平均值为(9.80±9.70)nmol·m-2·h-1.表层海水中CO浓度大多是过饱和的,表明冬季黄海和东海是其上方大气的源.这些数据对于估算全球碳排放具有重要作用.
关键词:一氧化碳分布海气通量黄海东海
Distribution and sea-to-air flux of carbon monoxide in the Yellow Sea and East China Sea in winter
GONG Chunyan1
 , YANG Shengwen2, CHEN Yan1, YANG Guipeng1

1. College of Chemistry and Chemical Engineering, Ocean University of China, Qingdao 266100;
2. Harbin Institute of Technology, Weihai 264209
Received 15 September 2020; received in revised from 18 October 2020; accepted 18 October 2020
Abstract: In order to explore the significance of carbon monoxide (CO) emission from the ocean on the global carbon cycle, the distribution and sea-to-air flux of carbon monoxide were studied the Yellow Sea and East China Sea during winter in 2019. Atmospheric CO mixing ratios ranged from 239×10-9 to 941×10-9, with an average of (588±155)×10-9. The highest value of atmospheric concentration appeared in the coastal waters of the North Yellow Sea, and the lowest value appeared in the southern part of the East China Sea, showing the characteristics of high values in the Yellow Sea and low values in the East China Sea. The concentrations of CO decreased generally from coast to open sea in the atmosphere. In the surface seawater, CO concentrations were measured from 0.39 to 2.80 nmol·L-1, with an average of (1.23±0.45) nmol·L-1. The high value area appeared in the east of the East China Sea, and the low value appeared in the south of the East China Sea, which were greatly affected by solar radiation and water mass. The results of vertical distributions showed that the maximum concentration appeared in the surface layer, and the concentration decreased gradually with the increase of depth. The saturation factor α of CO ranged from 0.99 to 8.67 with an average of 2.61±1.42. As an important removal method, the sea-to-air fluxes of CO ranged from -0.05 to 41.38 nmol·m-2·h-1 with an average of (9.80±9.70) nmol·m-2·h-1. Compared with the atmosphere, CO in surface seawater was mostly supersaturated, indicating that the Yellow Sea and East China Sea were the sources of CO atmospheric. These data were important for estimating global carbon emissions.
Keywords: carbon monoxidedistributionsea-to-air fluxYellow SeaEast China Sea
1 引言(Introduction)一氧化碳(CO)作为大气中一种重要的痕量气体, 能够与羟基自由基发生反应, 干扰大气的氧化能力, 从而影响甲烷等温室气体的浓度, 因此, CO被认为是一种间接的温室气体(Thompson, 1992; Park et al., 2016).海水中CO主要是通过有色溶解有机物(Colored/Chromophoric Dissolved Organic Matter, CDOM)的光氧化产生(Conrad et al., 1982; Zuo et al., 1995), 太阳辐射会对其产生重要影响, 因此, 海水中CO具有很强的周日变化特征.海-气扩散是海水中CO去除的一个重要途径(Bates et al., 1993; Zafiriou et al., 2003; Xie et al., 2005).早期的研究表明, 表层海水中的CO是过饱和的, 因此, 海洋被广泛认为是大气CO的源(Lamontagne et al., 1971; Bates et al., 1995).在过去的几十年里, 海洋每年释放的CO量为3.7~600 Tg·a-1(Erickson et al., 1989; Stubbins et al., 2006a; Ludivine et al., 2019), 约占全球CO总供应量的0.3%~77% (相当于每年770~1230 Tg CO-C) (Prather et al., 2001).这些数据主要是基于公海计算得出的, 有关河口和陆架海域的数据较为匮乏.因此, 在河口和陆架海域研究CO对估算碳排放量是非常重要的.
国际上对CO的研究起步较早, 可以追溯到20世纪60年代. Kawagucci等(2014)在夏季日本本州岛附近海域的研究表明, CO浓度分布存在明显的日变化趋势, 在没有光诱导CO生成和光抑制消耗的情况下, 夜间CO浓度降低主要归因于微生物的消耗. Zafirious等(2008)在春季马尾藻海域发现, 海水中CO浓度具有较好的垂直分布特征, 当海水深度大于200 m时, CO浓度小于0.1 nmol·L-1.国内对于CO浓度的研究主要集中在黄海、东海和渤海的个别季节.例如, Yang等(2010)在秋季南黄海和东海的调查中发现大气CO浓度为297×10-9, 南黄海大气CO浓度明显高于东海, 表层海水CO浓度和Chl-a浓度之间没有明显的相关性.Yang等(2011)在春季东海和黄海的研究表明, 大气CO浓度为190×10-9, 表层海水CO浓度为2.24 nmol·L-1, CO浓度最大值一般出现在午后2:00左右, 最小值出现在凌晨; 从表层到底层CO浓度总体呈降低的趋势.Zhang等(2019)报道了秋季黄渤海大气CO浓度(465×10-9)和表层海水CO浓度(1.22 nmol·L-1), 且表层海水CO浓度与大气CO浓度的比值表明渤海和黄海是大气中CO的来源.
黄海和东海位于太平洋西侧, 以长江口北岸的启东角和韩国济州岛西南角的连线为界, 是中国重要的边缘陆架海, 主要受到长江冲淡水、黄海暖流和黑潮水的影响(Chen, 2009).黄海和东海是海洋生产力最高的地区之一, 尽管前人已经对中国沿海地区CO分布进行了研究, 但主要集中在春、夏季节.考虑到海域和季节的变化, 有必要进行更多的观测, 以准确估计海洋CO排放量.因此, 本研究于2019年12月—2020年1月对黄海和东海CO的分布和海-气通量进行现场研究, 这些数据将有助于加深对CO的海洋生物地球化学循环的认识和理解.
2 材料与方法(Materials and methods)2.1 仪器装置与试剂仪器装置:Ta 3000痕量气体分析仪(美国Ametek公司); 氮气纯化仪(先普半导体技术有限公司); 轨道式振荡器(江苏盛蓝仪器制造有限公司); 聚四氟乙烯(PTFE)疏水滤膜(0.2 μm, 美国Millipore公司); 玻璃气密注射器(10 mL, 美国VICI公司).
试剂:高纯氮, 纯度>99.999%(青岛豪森气体有限公司); CO标准气体(97.2 × 10⁻⁹, 大连大特气体有限公司).
2.2 样品采集于2019年12月24日—2020年1月18日跟随“东方红3号”科考船对黄海和东海进行现场调查, 调查区域和采样站位如图 1所示.本航次共设14个断面、69个大面站, 所有站位均采集大气和表层海水样品, 对具有复杂水文条件特征的B、P断面及深水站位T5进行垂直分布研究.
图 1(Fig. 1)
 |
| 图 1 黄海和东海采样站位图 Fig. 1Sampling stations in the Yellow Sea and the East China Sea |
在现场调查中, 海水样品由配备直读式温盐深仪的24 L Niskin采水器采集, 然后通过硅胶管注入到先后经10% HCl和Milli-Q水润洗过的50 mL玻璃瓶底部, 最后用压盖器迅速将聚四氟乙烯瓶盖压紧, 保证瓶内无气泡.玻璃瓶和聚四氟乙烯瓶盖均需润洗2~3次, 采水时要注意控制水流速度以避免有气泡和旋涡产生.大气CO样品在船头距海平面约10 m处的甲板上采集, 为避免船体滑行带来的污染, 所有大气样品均在船走航时用10 mL的气密注射器迎风采集(任春艳, 2010).风速和气压等参数由船舶气象仪获得.部分站位的采样时间和风速如表 1所示.
表 1(Table 1)
| 表 1 部分站位采样时间和风速 Table 1 Sampling time and anemometer of some stations | ||||||||||||||||||||||||||||||||||||||||||||||||||||||||||||||||||||||||||||||||||
表 1 部分站位采样时间和风速 Table 1 Sampling time and anemometer of some stations
| ||||||||||||||||||||||||||||||||||||||||||||||||||||||||||||||||||||||||||||||||||
2.3 分析方法CO浓度的测定:使用Ta 3000痕量气体分析仪进行CO浓度测定, 海水样品采用顶空平衡法.现场采集的海水样品注入50 mL样品瓶, 然后经由气密注射器向样品瓶中注入6 mL经过氮气纯化仪纯化的高纯氮(>99.9999%), 样品瓶中会出现6 mL的顶空.将样品瓶放到轨道式振荡器以300 r·min-1振荡5 min(Tolli et al., 2005), 然后再用气密注射器抽取平衡气6 mL, 经聚四氟乙烯疏水滤膜注入到Ta 3000痕量气体分析仪中进行测定.大气样品直接用气密注射器采集后注入Ta 3000仪器中进行测定.仪器每隔24 h用CO标准气体校正一次(陆小兰等, 2010).
Chl-a的测定:从24 L Niskin采水器中取300 mL海水样品于棕色瓶中, 用0.7 μm Whatman GF/F玻璃纤维滤膜过滤, 将过滤完的滤膜折叠放入用锡纸包裹的15 mL离心管中, 避光冷冻带回实验室进行测定.测定时, 将离心管中注入10 mL 90%的丙酮溶液, 在低温避光的条件下萃取24 h, 然后在4000 r·min-1条件下离心10 min, 取上层清液用F-4500荧光光度计测定其荧光值(Parsons et al., 1984).
数据分析:采用SPSS 23.0软件对两组数据进行相关性分析(p < 0.05证明两组数据存在相关性), 通过T检验判定两组数据是否存在显著性差异(p < 0.05证明两组数据存在显著性差异) (孙逸敏, 2007).
2.4 海-气通量与过饱和系数的测定CO的瞬时海-气交换通量F(nmol·m-2·h-1)可由式(1)进行计算(Johnson et al., 1996).
 | (1) |
 | (2) |
 | (3) |
海水中CO原始浓度[CO]surf由式(4)计算得出(Xie et al., 2009).当大气与海水中的CO达到平衡时, 海水中CO的浓度[CO]eq通过式(5)计算(Linnenbom et al., 1973).
 | (4) |
 | (5) |
采用α表示海水的过饱和系数, 具体由式(6)计算(任春艳, 2010).
 | (6) |
3 结果与讨论(Results and discussion)3.1 大气中CO的浓度大气中CO浓度为239×10-9~941×10-9, 平均值为(588±155)×10-9, 最大值是最小值的3.94倍.如图 2所示, 由南向北大气中CO浓度呈现明显的升高趋势.大气中CO浓度最大值(941×10-9)出现在北黄海近岸H12站位, 该站位毗邻辽宁地区.由72 h后向轨迹图(图 3a)推测, 来自西伯利亚的气流自西北方向途经内蒙古和辽宁地区进入黄海, 在陆地停留时间较长, 另外, 北方冬季煤炭的不完全燃烧, 使得陆源的输入造成该海域上空大气CO浓度偏高.除此之外, 在山东半岛和江苏沿岸的海域, 由于受人类活动影响较大, 均出现了CO浓度高值区.大气中CO浓度最小值出现在东海T3站位(239×10-9).据后向轨迹(图 3b)分析调查时段, 该海域受来自海洋的东南风影响; 另一方面, 该站位于南方, 相较于冬季北方地区, 人类生活排放的污染较低.在本次调查中, 冬季大气中CO浓度总体上呈现出从近岸到远海逐渐降低的趋势.相对于东海(493×10-9), 黄海(717×10-9)上方大气的CO浓度更高.这是由于冬季北方取暖燃煤的不完全燃烧所致, 同时黄海上方大气受陆源气团影响较大, 而东海上方大气受海洋气团的影响较大.方差分析表明, 本研究与Yang等(2011)研究中的大气CO浓度之间存在显著性差异(p=0.002), 且本次调查结果高于Yang等(2011)在春季黄东海的结果(190×10-9), 这可能与调查季节和近些年来工业的发展有关, 但整体大气CO浓度由近岸到远海逐渐降低的趋势与Yang等的结果相同.
图 2(Fig. 2)
 |
| 图 2 大气CO的水平分布 Fig. 2Horizontal distribution of the CO concentrations in the atmospheric |
图 3(Fig. 3)
 |
| 图 3 黄东海上方气团的72 h后向轨迹 Fig. 372 hours backward trajectories of air mass over the Yellow Sea and the East China Sea |
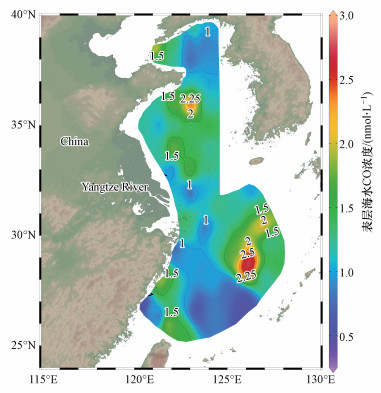
3.2 海水中CO的浓度3.2.1 CO的水平分布调查海域表层海水中CO浓度为0.39~2.80 nmol·L-1, 平均值为(1.23±0.45) nmol·L-1, 最大值为最小值的7.23倍.各站位表层海水中的CO浓度分布见图 4.表层海水中CO浓度最大值(2.80 nmol·L-1)出现在远海的P6站位, 采样时间为14∶36, 此时太阳辐射强度较高, 且该站位处于受黑潮水影响较大的海域, 高温高盐使该海域细菌丰度较低, 微生物消耗速率低, 由于微生物消耗占海水CO去除的86%(Zhang et al., 2008), 因而该地区成为CO浓度高值区.在山东半岛的东南部出现CO浓度的次高值区, 主要受黄海暖流和采样时间影响较大.此外, 在台湾北部地区的海域, 由于暖流的出现, 使得该片海域CO浓度相对较高. 表层海水CO浓度最小值(0.38 nmol·L-1)出现在T1站位, 取样时间为凌晨0:56, 同时该站位取样时风速为8.69 m·s-1, 海-气扩散损失较大.从不同海域来看, 黄海表层海水的CO浓度范围为0.73~2.65 nmol·L-1, 平均值为(1.28±0.42) nmol·L-1, 东海表层海水的CO浓度范围为0.39~2.80 nmol·L-1, 平均值为(1.19±0.69) nmol·L-1.冬季黄东海表层海水中CO浓度的平均值低于Yang等(2011)报道的春季黄东海表层海水CO浓度(2.24 nmol·L-1), 低于徐冠球等(2014)研究的夏季东海表层海水CO浓度(1.48 nmol·L-1), 也低于赵保振(2014)报道的秋季黄渤海表层海水CO浓度(1.22 nmol·L-1).冬季[CO]surf浓度低是由于太阳光辐射强度相对较弱, 且冬季白天光照时间较短, CDOM的光降解较低造成的, 这与Wang等(2017)对胶州湾4个不同季节的调查结果一致.
图 4(Fig. 4)
 |
| 图 4 表层海水中CO的水平分布 Fig. 4Horizontal distribution of the CO concentrations in the surface seawater |
海水中的CO主要来自于陆源CDOM和海洋浮游植物有机体的化学降解, 另外, 藻类也会释放少量CO (Gros et al., 2009).在本航次中, 相关性分析表明表层海水中CO浓度与Chl-a之间不存在相关性(r=0.269, n=69, p=0.130), 这一结果与Ohta(1997)在太平洋上升流地区的观察结果一致.但Conrad等(1982)在大西洋赤道附近的研究表明, 表层海水的CO浓度与Chl-a之间存在正相关关系, Seiler等(1980)认为Chl-a可以作为光敏剂在光敏化过程中产生CO.关于CO与Chl-a之间的关系, 目前还没有定论.这表明除Chl-a之外的其他因素, 如CDOM的光降解、海洋异养生物的氧化和水团的垂直混合都是影响CO浓度的重要因素(Yang et al., 2010).
将所有站位按照采样时间进行划分, 发现采样时间与表层海水的CO浓度之间存在一定的关系.白天组(6:00—18:00)的平均浓度为(1.43±0.48) nmol·L-1, 夜晚组(19:00—6:00)的平均浓度为(0.98±0.26) nmol·L-1, 白天组的CO平均浓度显著大于夜晚.方差分析表明, 白天组和夜晚组CO浓度之间存在显著性差异(p=0.001), 这进一步说明光照对CO具有重要影响.
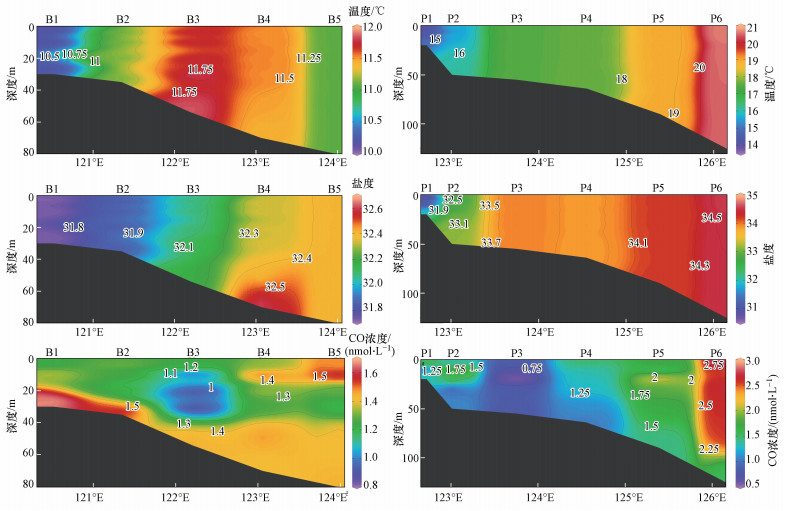
3.2.2 垂直分布为了研究黄海暖流对黄海海域的影响, 本研究选取B断面进行研究.在B断面西侧, 由于受湍流作用的影响, 温度和盐度混合均匀; 在断面东侧, 盐度混合存在弱层化现象, 说明水体的垂直混合作用未到达底层.近岸站位的温度和盐度低于远海, 这是由于近岸站位主要受到南下携带低温低盐的黄海沿岸流的影响, 远海受北上携带高温高盐水的黄海暖流的影响更大(Chen, 2001).在该断面的东侧, CO浓度普遍偏高, 这可能与采样时间和水团有关.在B4和B5站位, CO浓度最大值出现在次表层, 这主要是由于采样时风速较大(大于6 m·s-1), 通过海-气扩散损失掉一部分.在该断面其它站位, CO浓度高值主要出现在底部.这表明CO存在其他来源, 如细菌等海洋生物生产(Gros et al., 2009)和海洋有机物在热力学的作用下通过暗反应分解产生CO(Xie et al., 2005).
为了讨论水团对东海CO分布的影响, 本研究选取从长江入海口的西北部到冲绳群岛的东南部的P断面(P1~P6站位)进行研究.断面西部受长江冲淡水的影响, 中部受台湾暖流的影响, 东部陆架边缘地区受黑潮水的影响(时迪等, 2017). P断面的温度、盐度和CO浓度如图 5所示, 整个P断面的温度和盐度分布较均匀, 无明显层化现象, 说明冬季近岸水体的垂直混合作用较为强烈.在水深低于50 m的P1、P2站位, 温度和盐度均较低, 说明冬季长江冲淡水主要汇入闽浙沿岸流. P3~P6站位的温度和盐度较高, 受黑潮水入侵的影响较大.从总体上看, 该断面CO浓度从表层到底层呈现逐渐降低的趋势, 这是不同光照强度作用的结果.CO浓度的高值区出现在P6站位, 这与采样时间(14:36)密切相关.在近岸站位P1、P2中, CO浓度并未呈现明显的高值, 一方面与采样时间有关; 另一方面可能是由于冬季长江口的径流量较小, 携带有机物较少, 使得陆源输入产生的CO浓度较小(王腾等, 2014).
图 5(Fig. 5)
 |
| 图 5 B断面和P断面的温度、盐度与CO浓度垂直分布图 Fig. 5Vertical distribution of temperature, salinity and concentration of CO in section B and P |
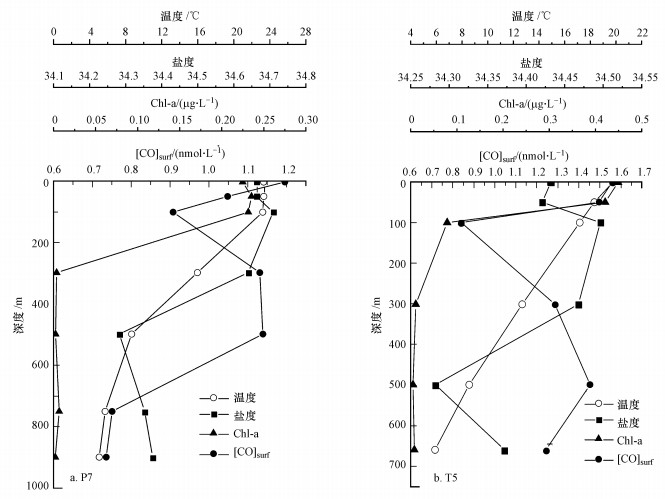
本航次还对部分深水站位进行了垂直研究, 结果如图 6所示.在P7和T5站位, CO浓度最大值均出现在表层, 这是由于表层光辐射最强, CDOM的光降解速率最快.两站位CO浓度具有相同的变化趋势, 均在水深约300 m处出现升高的趋势, 且涨幅较大, 这与在秋季东海(He et al., 2015)和冬季黄渤海(赵保振, 2014)的调查结果一致, 这进一步验证CO还存在其他来源(Gros et al., 2009; Xie et al., 2005).在P7站位, Chl-a浓度最大值(0.235 μg·L-1)出现在50 m处, 在T5站位, Chl-a浓度在表层有最大值(0.449 μg·L-1). Chl-a浓度随深度增加逐渐降低, 当深度大于300 m时, Chl-a浓度基本不变且达到最低值, 这表明CO浓度与Chl-a浓度之间不存在相关性.
图 6(Fig. 6)
 |
| 图 6 P7和T5站位温度、盐度、Chl-a和[CO]surf的垂直分布 Fig. 6Vertical distribution of temperature, salinity, Chl-a and [CO]surf at station P7 and T5 |
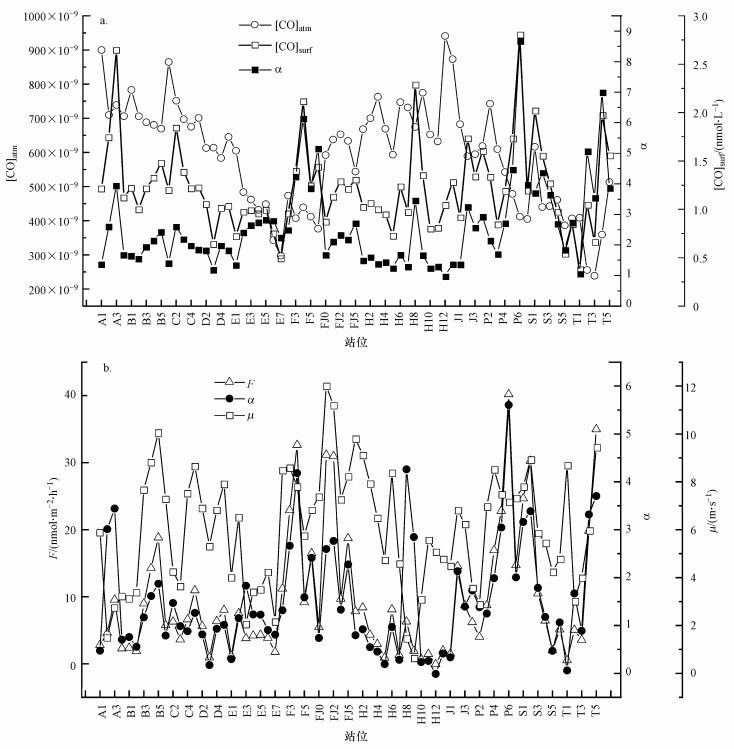
3.2.3 CO的海-气通量CO的过饱和系数如图 7a所示, 变化范围为0.99~8.67, 平均值为2.61±1.42, 最大值是最小值的8.75倍.在整个调查海域, 仅有H12站位的CO过饱和系数低于1, 这说明在98%的调查海域中, 海水中的CO浓度是过饱和的, 即黄海和东海是其上方大气CO的源.在黄海海域, CO的过饱和系数为0.99~3.95, 平均值为1.84±0.11(n=29).东海的CO过饱和系数为1.07~8.67, 平均值为3.12±0.12(n=30).当表层海水浓度[CO]surf较大, 大气浓度[CO]atm较小时, 过饱和系数α较大, 这说明α的大小与表层海水CO浓度和大气CO浓度等因素有关.过饱和系数α白天(3.02)大于夜晚(1.97), 说明表层海水中CO浓度存在明显的周日变化.本次调查的CO过饱和系数与赵保振(2014)报道的11月份黄渤海的CO过饱和系数(2.0)相近, 但低于王敬等(2014)报道的夏季东海和南黄海的CO过饱和系数(α=29.36).
图 7(Fig. 7)
 |
| 图 7 海水和大气CO浓度与过饱和系数α的关系(a)及过饱和系数α和风速μ与海-气通量F的关系(b) Fig. 7Relationship between the concentrations of seawater and atmosphere and the saturation factor α(a) and saturation factor α, wind speed and sea-to-air fluxes(b) |
瞬时海-气通量的变化范围为-0.05~41.38 nmol·m-2·h-1, 平均值为(9.80±9.70) nmol·m-2·h-1.从图 7b可以看出, 瞬时海-气通量的变化趋势与风速和过饱和系数α的变化趋势基本一致, 说明风速和过饱和系数α是影响海-气通量的重要因素.从不同海域来看, 黄海((5.77±5.23) nmol·m-2·h-1)的瞬时海-气通量低于东海((12.72±11.06) nmol·m-2·h-1).瞬时海-气通量最大值出现在P6站位, 该站位过饱和系数α最大, 温度(20.62 ℃)和风速(7.17 m·s-1)也较大; 最小值出现在H12站位, 为-0.05 nmol·m-2·h-1, 这表明该站位海水CO浓度处于不饱和状态.H12站位的过饱和系数α最低(0.99), 取样时温度(2.1 ℃)和风速(5.1 m·s-1)都相对较低, 使得海-气扩散较慢, 所以出现海水CO浓度相对于大气不饱和状态.
冬季黄东海的CO日海-气通量为0.0027~0.031 μmol·m-2·d-1, 平均值为0.013 μmol·m-2·d-1.而Wang等(2015)在黄海的调查结果为0.08 μmol·m-2·d-1, Xie等(2009)在秋季Beaufort Sea海域的调查结果为0.35 μmol·m-2·d-1.与上述研究结果相比, 本研究结果较低.这可能是因为冬季黄海和东海受陆源气团影响较大, 大气CO浓度较高, 而冬季太阳光辐射较弱, 海水中CO浓度相对较低, 海-气交换刚好达到过饱和的状态, 使得本研究CO海-气通量计算值远低于上述文献值.此外, 这与调查海域和季节, 以及不同物理、化学和生物各种因素都有一定的关系.结合东海和黄海的总面积为1.15 × 10⁶ km2, 由此估算出黄海和东海每年向大气输送碳约0.067 Gg·a-1.
4 结论(Conclusions)1) 冬季黄海和东海大气中CO浓度受陆源输入影响明显, 黄海上空大气CO浓度普遍高于东海.总体看来, 大气中CO浓度由近岸到沿海呈现降低的趋势.
2) 表层海水中CO浓度受光照辐射和水团影响较大, 高值出现在东海东部, 低值出现在东海南部.白天组与夜晚组的表层海水CO浓度之间存在显著性差异.表层海水CO浓度与Chl-a并未表现出显著相关性.
3) 垂直分布表明, 海水CO浓度最大值主要出现在表层, 随深度的增加而降低.
4) 在东海和黄海98%的调查站位中, 表层海水中的CO浓度处于过饱和状态, 说明黄海和东海是其上方大气CO的源.
致谢(Acknowledgement):感谢“东方红3号”船长和船员在现场调查期间提供的帮助.本文参考的Chl-a数据由厦门大学的高亚辉老师提供, 特致谢忱.
参考文献
| Bates T S, Kelly K C, Johnson J E. 1993. Concentrations and fluxes of dissolved biogenic gases (DMS, CH4, CO, CO2) in the equatorial Pacific during the SAGA 3 experiment[J]. Journal of Geophysical Research: Earth Surface, 98(D9): 16969-16977. DOI:10.1029/93JD00526 |
| Bates T S, Kelly K C, Johnson J E, et al. 1995. Regional and seasonal variations in the flux of oceanic carbon monoxide to the atmosphere[J]. Journal of Geophysical Research Atmospheres, 100(D11): 23093-23101. DOI:10.1029/95JD02737 |
| Chen J F. 2001. Hydrographic condition and variability in the Yellow Sea and East China Sea during winter[J]. Marine Fisheries Research, 4: 21-28. |
| Chen C T. 2009. Chemical and physical fronts in the Bohai, Yellow and East China seas[J]. Journal of Marine Systems, 78(3): 394-410. DOI:10.1016/j.jmarsys.2008.11.016 |
| Conrad R, Seiler W, Bunse G, et al. 1982. Carbon monoxide in seawater (Atlantic Ocean)[J]. Journal of Geophysical Research Oceans, 87(C11): 8839-8852. DOI:10.1029/JC087iC11p08839 |
| Edson J B, Fairall C W, Bariteau L, et al. 2011. Direct covariance measurement of CO2 gas transfer velocity during the 2008 Southern Ocean Gas Exchange Experiment: Wind speed dependency[J]. Journal of Geophysical Research Oceans, 116(C4): 1943-194. |
| Erickson, David J. 1989. Ocean to atmosphere carbon monoxide flux: Global inventory and climate implications[J]. Global Biogeochemical Cycles, 3(4): 305-314. DOI:10.1029/GB003i004p00305 |
| Gros Valérie V, Peeken I I, Bluhm K K, et al. 2009. Carbon monoxide emissions by phytoplankton: Evidence from laboratory experiments[J]. Environmental Chemistry, 6(5): 369-379. DOI:10.1071/EN09020 |
| He Z, Xu G Q, Yang G P. 2015. Distribution and cycling of carbon monoxide in the east china sea and the marine atmosphere in autumn[J]. Journal of Ocean University of China, 14(6): 994-1002. DOI:10.1007/s11802-015-2889-1 |
| Johnson J E, Bates T S. 1996. Sources and sinks of carbon monoxide in the mixed layer of the tropical South Pacific Ocean[J]. Global Biogeochemical Cycles, 10(2): 347-359. DOI:10.1029/96GB00366 |
| Kawagucci S, Narita T, Obata H, et al. 2014. Molecular hydrogen and carbon monoxide in seawater in an area adjacent to Kuroshio and Honshu Island in Japan[J]. Marine Chemistry, 164(20): 75-83. |
| Lamontagne R A, Swinnerton J W, Linnenbom V J. 1971. Nonequilibrium of carbon monoxide and methane at the air-sea interface[J]. Journal of Geophysical Research, 76(21): 5117-5121. DOI:10.1029/JC076i021p05117 |
| Linnenbom V J, Swinnerton J W, Lamontagne R A. 1973. The ocean as a source for atmospheric carbon monoxide[J]. Journal of Geophysical Research, 78(24): 5333-5340. DOI:10.1029/JC078i024p05333 |
| Ludivine C, Sophie S, Roland S, et al. 2019. The oceanic cycle of carbon monoxide and its emissions to the atmosphere[J]. Biogeosciences, 16: 881-902. DOI:10.5194/bg-16-881-2019 |
| 陆小兰, 杨桂朋, 王晓蒙. 2010. 顶空法测定海水中一氧化碳[J]. 分析化学, 38(3): 352-356. |
| Ohta K. 1997. Diurnal variations of carbon monoxide concentration in the Equatorial Pacific Upwelling Region[J]. Journal of Oceanography, 53(2): 173-178. |
| Park K, Rhee T S. 2016. Oceanic source strength of carbon monoxide on the basis of basin-wide observations in the Atlantic[J]. Environmental Science Processes and Impacts, 18(1): 104-114. DOI:10.1039/C5EM00546A |
| Parsons T R, Maita Y, Lalli C M. 1984. A Manual of Chemical and Biological Methods for Seawater Analysis[M]. New York: Pergamon Press, 173. |
| Prather M, Ehhalt D, Dentener F, et al. 2001. Atmospheric Chemistry and Greenhouse Gases//Climate Change 2001: The Scientific Basis: Working Group 1 Contribution to the Third Assessment Report of the Intergovernmental Panel on Climate Change[M]. New York: Cambridge University Press. 239-287 |
| 任春艳. 2010. 中国东海和黄海中一氧化碳的生物地球化学研究[D]. 青岛: 中国海洋大学 |
| Seiler W, Conrad R. 1980. Photooxidative production and microbial consumption of carbon monoxide in seawater[J]. Fems Microbiology Letters, 9(4): 61-64. |
| 时迪, 杨桂朋, 孙岩. 2017. 冬季东海海水中碳水化合物的分布及影响因素[J]. 海洋环境科学, 36(4): 481-487. |
| Stubbins A, Günther Uher, Law C S, et al. 2006a. Open-ocean carbon monoxide photoproduction[J]. Deep-Sea Research, Part II: Topical Studies in Oceanography, 53(14/16): 1695-1705. |
| Stubbins A, Uher G, Kitidis V, et al. 2006b. The open-ocean source of atmospheric carbon monoxide[J]. Deep-Sea Research II: Topical Studies in Oceanography, 53(14/16): 1685-1694. |
| 孙逸敏. 2007. 利用SPSS软件分析变量间的相关性[J]. 新疆教育学院学报, 23(2): 125-128. |
| Thompson A M. 1992. The oxidizing capacity of the earth's atmosphere: Probable past and future changes[J]. Science, 256(5060): 1157-1165. DOI:10.1126/science.256.5060.1157 |
| Tolli J D, Taylor C D. 2005. Biological CO oxidation in the Sargasso Sea and in Vineyard Sound, Massachusetts[J]. Limnology and Oceanography, 50: 1205-1212. DOI:10.4319/lo.2005.50.4.1205 |
| 王敬, 陆小兰, 杨桂朋. 2014. 夏季东海和南黄海一氧化碳的浓度分布、海-气通量和微生物消耗研究[J]. 环境科学, 35(11): 4085-4094. |
| 王腾, 刘广鹏, 朱礼鑫, 等. 2014. 长江口邻近海域冬、夏季溶解有机碳分布特征及影响因子研究[J]. 海洋通报, 33(5): 533-540. |
| Wang W L, Yang G P, Lu X L. 2015. Carbon monoxide distribution and microbial consumption in the Southern Yellow Sea[J]. Estuarine, Coastal and Shelf Science, 163: 125-133. DOI:10.1016/j.ecss.2015.06.012 |
| Wang W L, Peng T, Lu X L, et al. 2017. Diurnal, seasonal, and spatial variations and flux of carbon monoxide in Jiaozhou Bay, China[J]. Marine Chemistry, 191(20): 1-8. |
| Wiesenburg D A, Guinasso N L. 1979. Equilibrium solubilities of methane, carbon monoxide, and hydrogen in water and sea water[J]. Journal of Chemical and Engineering Data, 24(4): 356-360. DOI:10.1021/je60083a006 |
| Xie H X, Andrews S S, Martin W R, et al. 2002. Validated methods for sampling and headspace analysis of carbon monoxide in seawater[J]. Marine Chemistry, 77(2): 93-108. |
| Xie H X, Zafiriou O C, Umile T P, et al. 2005. Biological consumption of carbon monoxide in Delaware Bay, NW Atlantic and Beaufort Sea[J]. Marine Ecology Progress, 290(4): 1-14. |
| Xie H X, Bélanger, Demers S, et al. 2009. Photobiogeochemical cycling of carbon monoxide in the southeastern Beaufort Sea in spring and autumn[J]. Limnology and Oceanography, 54(1): 218-226. |
| 徐冠球, 陆小兰, 杨桂朋. 2014. 夏季东海一氧化碳的浓度分布、海-气通量和微生物消耗研究[J]. 海洋学报(中文版), 36(6): 25-32. DOI:10.3969/j.issn.0253-4193.2014.06.004 |
| Yang G P, Wang W L, Lu X L, et al. 2010. Distribution, flux and biological consumption of carbon monoxide in the Southern Yellow Sea and the East China Sea[J]. Marine Chemistry, 122(1/4): 74-82. |
| Yang G P, Ren C Y, Lu X L, et al. 2011. Distribution, flux, and photoproduction of carbon monoxide in the East China Sea and Yellow Sea in spring[J]. Journal of Geophysical Research Oceans, 116(C2): 1-14. |
| Zafiriou O C, Andrews S S, Wang W. 2003. Concordant estimates of oceanic carbon monoxide source and sink processes in the pacific yield a balanced global "blue-water" CO budget[J]. Global Biogeochemical Cycles, 17(1): 1015-1027. |
| Zafiriou, Oliver C, Xie H X, et al. 2008. Diel carbon monoxide cycling in the upper Sargasso Sea near Bermuda at the onset of spring and in midsummer[J]. Limnology and Oceanography, 53(2): 835-850. DOI:10.4319/lo.2008.53.2.0835 |
| Zhang J, Wang J, Zhuang G C, et al. 2019. Carbon monoxide cycle in the Bohai Sea and the Yellow Sea: Spatial variability, sea-Air exchange and biological consumption in autumn[J]. Journal of Geophysical Research: Oceans, 124(6): 4248-4257. DOI:10.1029/2018JC014864 |
| Zhang Y, Xie H X, Fichot C G, et al. 2008. Dark production of carbon monoxide (CO) from dissolved organic matter in the St.Lawrence estuarine system: Implication for the global coastal and blue water CO budgets[J]. Journal of Geophysical Research, 113(C12): 12-20. |
| 赵保振. 2014. 黄渤海一氧化碳的分布及源汇研究[D]. 青岛: 中国海洋大学 |
| Zuo Y, Jones R D. 1995. Formation of carbon monoxide by photolysis of dissolved marine organic material and its significance in the carbon cycling of the oceans[J]. Naturwissenschaften, 82(10): 472-474. DOI:10.1007/BF01131598 |
