 , 王鹏1,2
 , 舒旺1,2, 张华1,2, 丁明军1,2
1. 江西师范大学地理与环境学院, 南昌 330022;
2. 江西师范大学鄱阳湖湿地与流域研究教育部重点实验室, 南昌 330022
收稿日期: 2019-12-10; 修回日期: 2020-01-29; 录用日期: 2020-01-29
基金项目: 国家自然科学基金(No.41201033);江西省重大生态安全问题监控协同创新中心项目(No.JXS-EW-00)
作者简介: 徐启渝(1994-), 男, E-mail:xqy20181214@163.com
通讯作者(责任作者): 王鹏(1982—), 男, 教授, 博士, 主要从事流域水环境和湖泊生态环境的研究.E-mail:wangpengjlu@jxnu.edu.cn
摘要:于2018年7月和2019年1月在袁河干流及支流38个采样点采集水样,测定营养盐离子及重金属等14项水质指标.同时,采用Bioenv分析、Mantle检验与方差分解等方法,揭示土地利用结构与空间格局在子流域和缓冲区对水质变化的影响机制,并基于层次分割理论探讨不同土地利用类型的空间格局特征对水质的影响.结果表明:①袁河流域重金属污染不显著,氮、磷营养盐是水体主要污染物,水质变化具有河段差异,上游污染物浓度低于中、下游.②空间格局在在近距离缓冲区(100 m、300 m)对水质变化的解释率最高(63%),土地利用结构在远距离缓冲区(3000 m)和子流域尺度对水质变化的解释率最高(33%),二者交互作用在过渡带(500 m、1000 m)对水质变化的解释率最高(56%).③在近距离缓冲区和过渡带,单一土地利用类型的空间格局对水质变化的解释能力依次为:林地>农田>建设用地;在远距离缓冲区为:农田≈林地>建设用地;在子流域依次为:农田>林地>建设用地.其中,林地的连通性特征(ENN_MN指数)、农田的边缘密度特征(ED指数)和建设用地的形状特征(LPI、LSI指数)是影响水质变化的关键特征,占各自空间格局解释率的37.8%、31.2%、53.8%.以上结果表明,土地利用结构与空间格局是驱动袁河水质变化的重要因素,加强1000 m缓冲区尺度土地利用的管理对保护流域水质具有重要意义.
关键词:袁河流域土地利用结构空间格局交互作用水质空间尺度
Investigation of the impacts of land use structure and spatial pattern on water quality in the Yuan River
XU Qiyu1,2
 , WANG Peng1,2
 , SHU Wang1,2, ZHANG Hua1,2, DING Mingjun1,2
1. School of Geography and Environment, Jiangxi Normal University, Nanchang 330022;
2. Key Laboratory of Poyang Lake Wetland and Watershed Research, Ministry of Education, Jiangxi Normal University, Nanchang 330022
Received 10 December 2019; received in revised from 29 January 2020; accepted 29 January 2020
Abstract: In this study, water samples were taken from 38 sampling sites in the main stream and tributaries of the Yuan River in July 2018 and January 2019, and concentrations of water quality indicators including nutrient ions and heavy metals were measured. Methods such as Bioenv analysis, Mantle test and Variance partitioning were used to reveal the influence mechanism of land use structure and spatial pattern on water quality in buffer zone and sub-watershed, and to explore the impact of spatial pattern characteristics of different land use type on water quality based on Hierarchical partitioning theory. The results showed that:① The heavy metal pollution in the Yuan River Basin was not serious, while nitrogen and phosphorus nutrient salts were the main pollutants in the water body. The concentrations of contaminant in the upstream were lower than those in the middle stream and downstream. ② The interpretation rates of the spatial pattern to water quality was the highest (63%) in the short distance buffer zone (100 m and 300 m buffer zone) scale. The interpretation rates of the land use structure to water quality was the highest (33%) in the long distance buffer zone (3000 m) and sub-watershed scale. The interpretation rates of the interaction between spatial pattern and land use structure to water quality was the highest (56%) in the transition zone (500 m and 1000 m buffer zone). ③ In the near buffer zone and the transition zone, the order of explaining water quality change by spatial pattern of a single land use type were:forest > farmland > construction; In the remote buffer zone that was:farmland ≈ forest >construction; In the sub-basin that was:farmland > forest > construction land. Among them, the connectivity characteristics of forest, the edge density characteristics of farmland and the shape characteristics of construction land were the key characteristics that would affect the change of water quality, accounting for 37.8%, 31.2% and 53.8% of the respective spatial pattern interpretation rates. Land use structure and spatial pattern were the main driving factors of water quality change in the Yuan River, and their interaction played an important role. Strengthening the management of land use in 1000 m buffer zone scale is of great significance to the protection of water environment quality in the basin.
Keywords: Yuan River Basinland use structurespatial patterninteractionwater qualityspatial scale
1 引言(Introduction)土地利用会影响流域内的水质变化(Lee et al., 2009; Xu et al., 2019).人类活动改变了土地利用的结构和空间格局(Xiao et al., 2016; 曹灿等, 2018), 从而影响了通过排水或径流过程进入河流的污染物.土地利用结构是指流域内不同土地利用类型的占比, 空间格局则包括流域尺度下, 所有景观斑块的空间分布特征, 以及单一土地利用类型在流域内所组成的斑块及其空间分布、形状、距离等特征(Bu et al., 2014; 朱珍香等, 2019).过去的研究往往侧重于某一方面(王鹏等, 2015; Li et al., 2018), 相关研究成果难以扩展到实际规划和管理.为此, 分析二者交互作用的影响机制, 探索不同尺度下水质变化的驱动因素, 是维护水质安全的重要前提.
近年来, 土地利用结构和空间格局与水质之间的关系受到关注(Bu et al., 2014).土地利用结构反映了流域内“源”、“汇”景观类型的组成, 有利于评估特定生态过程下污染物的来源(陈利顶等, 2006);空间格局决定了流域内的能量流动和营养物质循环过程, 深刻影响着流域环境的变化(Alberti et al., 2007).分析二者对水质的影响机制, 构建其交互作用的理论基础, 是探索水质变化的重要方式.已有研究基于多元回归和约束排序(RDA、CCA)等方法分析二者与水质之间的相关性, 探讨不同空间尺度下对水质影响最显著的土地利用类型和空间格局特征(王小平等, 2017; 曹灿等, 2018), 或讨论单一土地利用类型的空间格局特征对水质变化的影响(Ding et al., 2016).这些研究尽管能够获得土地利用结构和空间格局特征对水质变化的解释率, 但由于解释变量之间存在共同解释部分, 相关研究所给出的解释率实际上是将共同解释部分划归到显著性更高的环境变量后剩余的解释率(赖江山, 2013), 会低估弱显著性环境变量对水质的影响.减少不同显著性环境变量对水质解释率的误差, 准确评估其对水质变化的影响程度成为当前的研究热点(Ma et al., 2019).
袁河是赣江下游一级支流, 流域与江西新余-宜春-萍乡城市群高度重叠(雷呈等, 2019).上游多矿山, 中、下游多为农业、化工业基地(万小丽, 2016).水污染已成为该区域亟待解决的环境问题(张晓健等, 2017).已有研究通过分析袁河底栖动物群落结构, 探讨流域生境质量(方红亚等, 2011), 计算其动态纳污能力, 并对水质进行评价(温巍, 2019), 但这些研究均未涉及土地利用变化对水质的影响.本文通过定量分析, 明确在不同空间尺度下驱动袁河水质变化的主要环境变量, 揭示不同环境变量影响袁河水质变化的最佳空间尺度, 并评估土地利用类型的空间格局特征对水质的影响, 以期为管理部门提供切实可行的建议及措施.
2 材料与方法(Materials and methods)2.1 研究区概况与数据采集袁河发源于江西省武功山西麓, 主河道长279 km, 总流域面积约6262 km2, 从源头至宜春市中心城区为上游, 多漂砾卵石, 森林覆盖度高;从宜春市中心城区至新余水位站为中游, 多水利枢纽工程;从新余水位站至河口为下游, 农田宽广, 是江西省重要的工业基地.袁河流域属中亚热带季风湿润气候区, 降水量变化梯度大, 流域多年平均年降水量为1583 mm, 4—6月的降水量占全年降水量的45%.
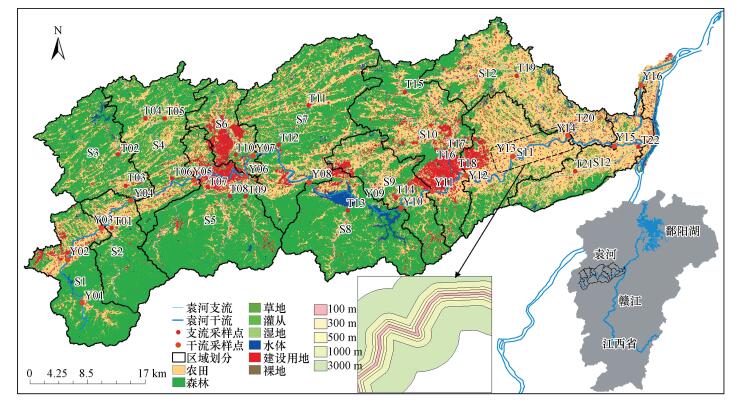
本研究在袁河干流和支流设置38个采样点(图 1, Y表示干流, T表示支流, S表示子流域).根据干流上、中、下游分布特征将子流域S1~S4划分为上游, S5~S9为中游, S10~S13为下游.分别于2018年的8月(夏季)与2019年的1月(冬季)采集河流表层水体(50 cm), 利用便携式水质分析仪(HI9828, HANNA, Italy)现场测定溶解氧(DO), 水样通过0.45 μm孔径的醋酸纤维滤膜过滤后, 装入取样瓶密封, 在0~4 ℃下冷藏, 密封保存.使用TOC分析仪(Shimadzu TOC-L CPH, 日本)测定溶解有机碳(DOC);采用全自动间断分析仪(Smartchem 200 Brookfield, 美国)测定氨态氮(NH4+-N)、硝态氮(NO3--N)和总磷(TP);使用ICS-2100离子色谱系统测定氯离子(Cl-), 使用电感耦合等离子体质谱仪(ICP-MS)测定水体中可溶性重金属元素含量, 样品检测之前, 仪器采样标准物质(SRM AccuStandard Inc, USA)进行3次重复检测并且进行极限检测, 极限检测值分别为:Cr 0.016 μg · L-1、Fe 0.985 μg · L-1、Cu 0.054 μg · L-1、Zn 0.114 μg · L-1、As 0.132 μg · L-1、Cd 0.002 ng · L-1、Pb 0.004 ng · L-1.
图 1(Fig. 1)
 |
| 图 1 研究区区域划分及采样点分布 Fig. 1Regional division of the study area and distribution of sampling sites |
袁河流域土地利用数据为2017年Landsat 8的30 m精度数据, 由国家科技基础条件平台——国家地球系统科学数据共享服务平台(http://www.geodata.cn)提供.研究区土地利用类型划分为农田、林地、水域、建设用地和裸地, 其中, 裸地占比不超过0.06%, 后续分析中予以剔除.基于袁河流域2015年DEM数据, 利用ArcGIS扩展模块ArcSWAT将流域划分为13个区域, 每个区域分布3~4个采样点, 并对河流分别作100、300、500、1000和3000 m的缓冲区.根据已有研究(Sliva et al., 2001)将缓冲区按距离划分为近距离缓冲区(100 m、300 m)、过渡带(500 m、1000 m)和远距离缓冲区(3000 m)
2.2 景观指数选取基于已有研究(黄金良等, 2011; 李明涛等, 2013; Bu et al., 2014; Ma et al., 2019), 本文试图阐明景观破碎度、形状和连通性等对水质恶化的加速和遏制作用, 为未来土地利用管理提供理论基础和科学依据.因此, 从表征流域破碎度、形状变化和连通性等角度选取如表 1所示的8个指数.在Arcgis10.2中提取子流域、缓冲区的栅格地图, 由Fragstats4.0软件分别在景观、类型水平计算获得.
表 1(Table 1)
| 表 1 研究所选取的景观指数 Table 1 Landscape index selected in this study | ||||||||||||||||||||||
表 1 研究所选取的景观指数 Table 1 Landscape index selected in this study
| ||||||||||||||||||||||
2.3 数据分析将同一子流域内所有采样点平均值作为该子流域水质数据, 超出平均值±3倍标准差范围的采样点数据作为异常值剔除.依据地表水环境质量标准GB3838—2002分析水质变化, 采用Shapiro-Wilk检验土地利用结构数据、空间格局数据的正态性, 结果满足正态分布特征.通过R语言“vegan”包中的“bioenv”函数, 选取与水质相关程度最高的组合表征土地利用结构和空间格局, 并通过“Mantel”、“Partial Mantel”函数检验二者与水质相关性的显著水平.
方差分解(Variation partitioning)是将响应变量组成数据表的总方差无偏分解成由各个解释变量所决定的子方差, 基于RDA或CCA约束的特征值, 通过偏分析计算解释变量对响应变量总方差的贡献率(Borcard et al., 1992).本文通过方差分解获取反映土地利用结构和空间格局与水质关系的最佳空间尺度, 并基于层次分割(Hierarchical partitioning)理论(Chevan et al., 1991)获取不同土地利用类型的空间格局特征对水质的解释率, 以上操作均在R语言中完成.
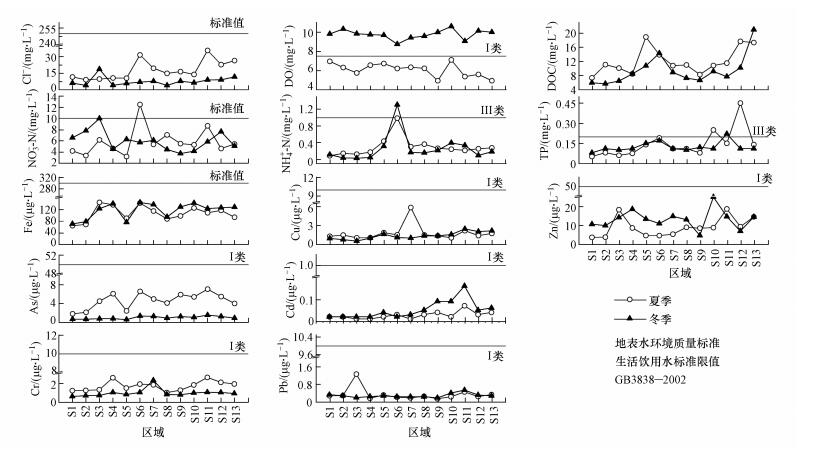
3 结果(Results)3.1 水质指标变化特征参考地表水环境质量标准GB3838—2002, 发现袁河水体主要受到氮、磷营养盐污染(图 2), 其中, 总磷是水体的主要污染物.上游河段Cl-、DOC、NH4+-N、Cr、Cu、Zn、As、Cd等指标显著低于中、下游.夏季T06点TP浓度达1.97 mg · L-1, 冬季T22点Zn浓度达675 μg · L-1且异常偏高, 超出平均值±3倍标准差范围, 为避免异常值掩盖环境与水质间的内在联系, 在后续分析中剔除.
图 2(Fig. 2)
 |
| 图 2 袁河水质变化特征 Fig. 2The characteristics of water quality in the Yuan River |
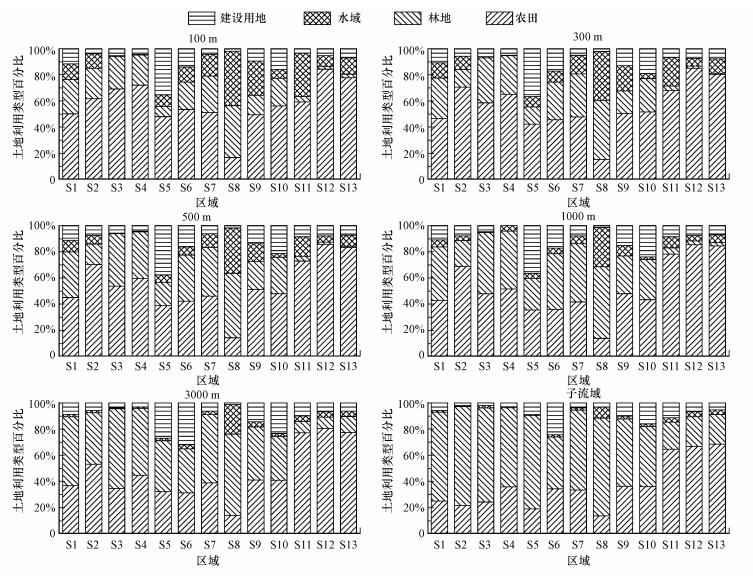
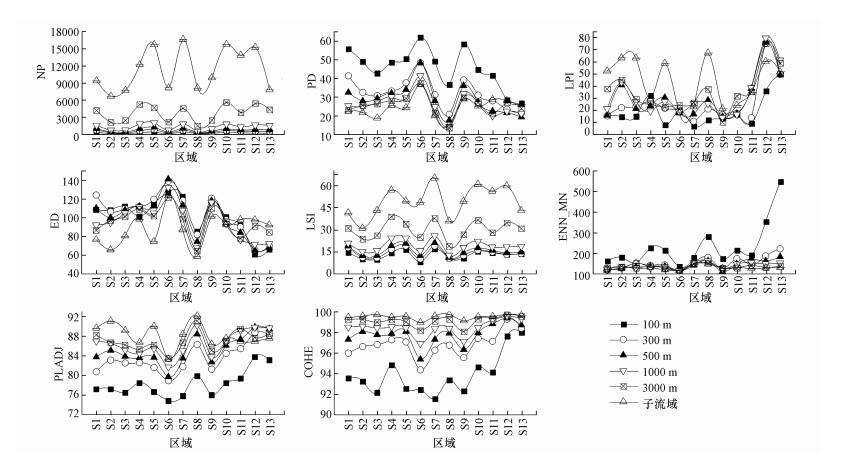
3.2 土地利用结构与空间格局变化特征袁河流域土地利用结构如图 3所示, 在近距离缓冲区(100 m、300 m)农田占主导, 在过渡带(500 m、1000 m)以农田为主, 林地和建设用地次之, 远距离缓冲区(3000 m)和子流域转为农田、林地、建设用地的组合.不同空间尺度下, 从上游到下游PD、ED指数下降, LPI、LSI、ENN_MN、PLADJ、COHES等指数增加(图 4).说明上游以规则高密度的林地等自然景观类型为主, 中、下游受人类活动影响, 斑块向零散不规则多边形方向发展, 景观优势度降低.
图 3(Fig. 3)
 |
| 图 3 不同空间尺度下土地利用结构特征 Fig. 3Characteristics of land use structure in different spatial scales |
图 4(Fig. 4)
 |
| 图 4 袁河流域景观指数变化特征 Fig. 4The characteristics of landscape index in the Yuan River Basin |
3.3 土地利用结构与空间格局和水质的相关性分析通过分析表 2的相关性变化趋势发现, 农田是影响水质变化的重要土地利用类型, 连通性(ENN_MN)是影响水质变化的主要空间格局特征, 此外, 子流域的土地利用结构与100 m缓冲区尺度下的空间格局和水质相关性最高, 对水质的影响达到显著性水平.通过“Partial Mantel Test”控制土地利用结构与空间格局间的相互影响(表 3), 发现与水质的相关性低于“Mantel Test”的结果, 可见二者的交互作用与水质具有较强的相关性.
表 2(Table 2)
| 表 2 基于Bioenv方法的袁河流域土地利用结构和空间格局组合对水质影响 Table 2 Effects of structure and spatial pattern combination on water quality based on Bioenv method in the Yuan River | ||||||||||||||||||||||||||||||||||||||||||||||||||||||||||||||||||||||||||
表 2 基于Bioenv方法的袁河流域土地利用结构和空间格局组合对水质影响 Table 2 Effects of structure and spatial pattern combination on water quality based on Bioenv method in the Yuan River
| ||||||||||||||||||||||||||||||||||||||||||||||||||||||||||||||||||||||||||
表 3(Table 3)
| 表 3 袁河水质与土地利用和空间格局的显著性检验 Table 3 Significance test of water quality with land use and spatial pattern in the Yuan River | ||||||||||||||||||||||||||||||||||||||||||||||||||||||||||||||||||||||||||||||||||||||||||||||||||||||||||||||||||||||||||||||||||||||||||||||
表 3 袁河水质与土地利用和空间格局的显著性检验 Table 3 Significance test of water quality with land use and spatial pattern in the Yuan River
| ||||||||||||||||||||||||||||||||||||||||||||||||||||||||||||||||||||||||||||||||||||||||||||||||||||||||||||||||||||||||||||||||||||||||||||||
3.4 土地利用结构与空间格局对水质贡献率的空间差异农田、林地、建设用地组合作为流域内土地利用结构, 边界密度特征(ED指数)、形状特征(LPI、LSI指数)、连通性特征(ENN_MN指数)组合作为流域内空间格局特征.将二者作为解释变量, 水质指标作响应变量输入方差分解(VPA), 得到土地利用结构与空间格局在不同空间尺度下对水质的独立解释率和共同解释率, 基于表 4统计不同季节数据发现, 空间格局在近距离缓冲区(100 m、300 m)驱动水质变化, 土地利用结构在远距离缓冲区和子流域驱动水质变化, 各自独立解释量平均占总解释量的91.5%和72.5%, 二者交互作用对水质的贡献率在1000 m缓冲区尺度最高.
表 4(Table 4)
| 表 4 不同条件下土地利用结构与空间格局对水质的解释量 Table 4 The contribution rates of land use structure and spatial pattern to the variation of water quality | |||||||||||||||||||||||||||||||||||||||||||||||||||||||||||||||||||||||||||||
表 4 不同条件下土地利用结构与空间格局对水质的解释量 Table 4 The contribution rates of land use structure and spatial pattern to the variation of water quality
| |||||||||||||||||||||||||||||||||||||||||||||||||||||||||||||||||||||||||||||
3.5 不同土地利用类型空间格局特征对水质的影响基于层次分割原理, 分别计算农田、林地、建设用地的空间格局特征对水质的解释率, 结果(表 5)表明, 在近距离缓冲区和过渡带, 林地的空间格局特征对水质变化的解释能力高于农田和建设用地;在远距离缓冲区, 农田对水质变化的解释能力近似于林地, 且均高于建设用地;而在子流域农田的解释能力最强, 远高于林地和建设用地.其中, 林地连通性(ENN_MN指数)、农田边缘密度(ED指数)在近距离缓冲区对水质有较强的解释能力, 随着空间距离增加而下降, 平均占各自空间格局解释量的37.8%和31.2%.建设用地形状特征(LPI、LSI指数)在子流域对水质解释率最高, 对水质解释率随空间距离的增加而增加, 平均占建设用地空间格局解释量的53.8%.
表 5(Table 5)
| 表 5 基于层次分割理论不同土地利用类型的空间格局特征对水质解释率 Table 5 The contribution rates of spatial pattern of different land use types to water quality based on the hierarchical partitioning theory | |||||||||||||||||||||||||||||||||||||||||||||||||||||||||||||||||||||||||||||||||||||||||||||||||||||||||||||||||||||||||||||||||||||||||||||||||||||||||||||||||||||||||||||||||||||||||||||||||||||||||||||||||||||||||||||||||||||||||
表 5 基于层次分割理论不同土地利用类型的空间格局特征对水质解释率 Table 5 The contribution rates of spatial pattern of different land use types to water quality based on the hierarchical partitioning theory
| |||||||||||||||||||||||||||||||||||||||||||||||||||||||||||||||||||||||||||||||||||||||||||||||||||||||||||||||||||||||||||||||||||||||||||||||||||||||||||||||||||||||||||||||||||||||||||||||||||||||||||||||||||||||||||||||||||||||||
4 讨论(Discussion)4.1 土地利用结构与空间格局对水质的影响本次研究发现, 空间格局与土地利用结构分别在近距离缓冲区尺度、远距离缓冲区(3000 m)和子流域尺度驱动水质变化.结果表明, 不同空间尺度下水质变化的驱动因素不同, 这与国内外相关研究结论一致(李明涛等, 2013; Liu et al., 2019; Bawa et al., 2019).空间格局在近距离缓冲区通过影响入河径流污染物浓度驱动水质变化(张大伟等, 2010), 袁河近距缓冲区植被占比较低, 降水过程中缺乏植被的截留作用, 有利于地表径流的形成和养分输出(Shigaki et al., 2007).农业种植过程中未被吸收的营养物质主要附着在农田土壤表层(王瑛等, 2011).农田较高的连通性(表 5)有助于沟通土壤表层分散分布的污染物, 并为远距离扩散和集中输出提供了通道.近距离缓冲区农田的空间格局特征弱化了“汇”景观格局对污染物的截留和削减效应, 加剧了“源”景观格局对水质的威胁程度.坡度等地形因素决定了径流累积量、汇流速度及汇流长度(Staponites et al., 2019), 坡度越大径流在地表滞留时间越短, 汇流速度越快, 空间格局对径流中污染物的作用越弱(Jiang et al., 2017).土地利用结构中林地等“汇”景观类型的增加会削弱农田、建设用地等“源”景观类型对径流输出污染物质的能力(夏品华等, 2016).在远距离缓冲区和子流域尺度下袁河流域多低山、丘陵, 坡度显著增加, 降低了空间格局的影响, 是导致土地利用结构主导水质变化的主要原因.
本次研究发现, 土地利用结构与空间格局的交互作用在过渡带, 尤其是在1000 m缓冲区对水质的贡献率最高.目前, 反映水质变化的最佳空间尺度仍存在争议, 相关研究发现4 km缓冲区(王小平等, 2017)、300 m缓冲区(曹灿等, 2018)和100 m缓冲区(Sliva et al., 2001)均是影响水质变化的重要尺度.袁河流域1000 m缓冲区内土地利用结构趋向于多种组合, 地形多为平原, 坡度较小.土地利用结构与空间格局在这一空间尺度下对水质变化均具有较强的解释能力, 是导致交互作用解释率最高的主要原因.
研究过程中发现水质变化存在大量未解释部分(表 4), 可能与土壤性质差异、土地利用强度有关.土壤理化性质差异对总氮、总磷的输出有显著影响(Wang et al., 2009), 不同区域土壤性质存在差异, 从而影响产出径流水质.Oni等(2014)认为, 仅讨论土地利用结构不同而忽视其强度差异, 将影响土地利用对水污染的解释程度, 即便是子流域具有相似的土地利用结构, 土地利用强度的差异也将导致流域水质的显著差别.尤其是建设用地按照利用强度可划分为农村用地、工矿用地及城镇用地, 然而城镇用地才是水体富营养化的主要驱动因素(Carey et al., 2011).深入分析流域土壤性质、土地利用强度差异有利于减少未解释部分.
4.2 单一土地利用类型的空间格局对水质的影响本次研究发现林地、农田和建设用地, 各自空间格局对水质变化的解释能力在不同空间尺度存在差异.受河岸带林地净化作用影响(孙金伟等, 2017), 农田在近距离缓冲区与过渡带对水质的贡献率低于林地, 在远距离缓冲区与林地相近, 在子流域对水质的贡献率最高.研究发现, 林地连通性特征(ENN_MN指数)是林地影响水质的核心特征.林地作为流域主要的“汇”景观类型, 高度连通的结构特征对入河径流具有较强的净化能力(Yu et al., 2016).然而, 袁河流域随着空间尺度扩大林地连通性逐渐增强, 对水质的解释能力却下降, 这与已有研究(李明涛等, 2013; Yu et al., 2016)结论相反.孙金伟等(2017)发现河岸带林地对水陆生态系统间的物质、能量、信息流发挥着重要的廊道、过滤器和屏障作用.而袁河流域林地分布远离河岸带, 导致林地连通性增强而解释能力却下降.因此, 增加河岸带林地占比, 提高近距离缓冲区林地的连通性, 可以有效提升林地对地表径流中污染物质的沉淀、过滤和降解效果, 是净化水质的重要措施.
研究还发现, 农田边缘密度特征(ED指数)和建设用地形状特征(LPI、LSI指数)是各自影响水质的主要空间格局特征.二者作为人类干扰最强烈的土地利用类型, 是河流污染物的主要来源, 其中, 农田是水体氮、磷营养盐的主要来源(Bawa et al., 2019).袁河近距离缓冲区的农田占比达1/2以上, 较低的边缘密度特征会延长径流在农田表面的滞留时间, 富集污染物浓度, 加速水质恶化.随着缓冲区尺度扩大农田边缘密度增加, 农田趋向于破碎化, 增加了径流流经不同土地利用类型的概率.汇流过程中流经的“汇”景观类型越多, 水质净化程度越高(Zhang et al., 2018).可见增加农田周边“汇”景观类型占比可以有效地降低流域农田对河流氮、磷营养盐的输出.已有研究表明, 城市占比的少量增加就会导致水质的大幅度下降(Zhou et al., 2012), 袁河流域建设用地的优势度及形状的不规则程度随着缓冲区尺度扩大逐渐增加, 对水质贡献率显著提高, 与九龙江流域、后溪河流域(孙芹芹等, 2011; 朱珍香等, 2019)研究结果一致.可见在城镇建设用地规划过程中, 避免城镇用地成片建设, 以绿色隔离带进行阻隔, 使建设用地趋向于更加规则有利于提高水环境质量.
5 结论(Conclusions)1) 不同空间尺度下袁河水质变化的驱动因素不同, 在近距离缓冲区(100 m、300 m)尺度, 空间格局对水质的影响占总解释率的91.5%, 在远距离缓冲区(3000 m)和子流域尺度土地利用结构对水质的影响占总解释率的72.5%, 而在过渡带(500 m、1000 m)水质变化受到空间格局与土地利用结构的交互作用, 在1000 m缓冲区交互作用对水质的解释率最高.
2) 单一土地利用类型的空间格局对水质变化的解释率, 在近距离缓冲区与过渡带按顺序排列为:林地>农田>建设用地;在远距离缓冲区依次为:农田≈林地>建设用地;在子流域依次为:农田>林地>建设用地.
3) 林地的连通性特征(ENN_MN指数)、农田的边缘密度特征(ED指数)和建设用地的形状特征(LPI、LSI指数)是各自影响水质变化的核心特征, 三者对水质变化的影响占各自空间格局解释率的37.8%、31.2%和53.8%.
参考文献
| Alberti M, Booth D, Hill K, et al. 2007. The impact of urban patterns on aquatic ecosystems:An empirical analysis in Puget lowland sub-basins[J]. Landscape and Urban Planning, 80(4): 345-361. DOI:10.1016/j.landurbplan.2006.08.001 |
| Bawa R, Dwivedi P. 2019. Impact of land cover on groundwater quality in the upper Floridan aquifer in Florida, United States[J]. Environmental Pollution, 252: 1828-1840. DOI:10.1016/j.envpol.2019.06.054 |
| Borcard D, Legendre P, Drapeau P. 1992. Partialling out the spatial component of ecological variation[J]. Ecology, 73(3): 1045-1055. DOI:10.2307/1940179 |
| Bu H, Meng W, Zhang Y, et al. 2014. Relationships between land use patterns and water quality in the Taizi River basin, China[J]. Ecological Indicators, 41: 187-197. DOI:10.1016/j.ecolind.2014.02.003 |
| 曹灿, 张飞, 依尼格尔·亚力坤, 等. 2018. 艾比湖区域景观格局与河流水质关系探讨[J]. 环境科学, 39(4): 1568-1577. |
| Carey R O, Migliaccio K W, Li Y, et al. 2011. Land use disturbance indicators and water quality variability in the Biscayne Bay Watershed, Florida[J]. Ecological Indicators, 11(5): 1093-1104. DOI:10.1016/j.ecolind.2010.12.009 |
| 陈利顶, 傅伯杰, 赵文武. 2006. "源""汇"景观理论及其生态学意义[J]. 生态学报, 26(5): 1444-1449. |
| Chevan A, Sutherland M. 1991. Hierarchical partitioning[J]. American Statistician, 45(2): 90-96. |
| Ding J, Jiang Y, Liu Q, et al. 2016. Influences of the land use pattern on water quality in low-order streams of the Dongjiang River basin, China:A multi-scale analysis[J]. Science of the Total Environment, 551. DOI:10.1016/j.scitotenv.2016.01.162 |
| 方红亚, 张方方, 张萌, 等. 2011. 赣江流域袁河底栖动物群落结构及其水质生物学评价[J]. 安徽农业科学, 39(4): 2254-2257. |
| 国家环境保护总局.2002.GB3838-2002地表水环境质量标准[S].北京: 中国环境科学出版社 |
| 黄金良, 李青生, 洪华生, 等. 2011. 九龙江流域土地利用/景观格局-水质的初步关联分析[J]. 环境科学, 32(1): 64-72. |
| Jiang Y, Xie Z, Zhang H, et al. 2017. Effects of land use types on dissolved trace metal concentrations in the Le'an River Basin, China[J]. Environmental Monitoring and Assessment, 189(12): 633. DOI:10.1007/s10661-017-6356-x |
| 赖江山. 2013. 生态学多元数据排序分析软件Canoco5介绍[J]. 生物多样性, 21(6): 765-768. |
| Lee S, Hwang S, Lee S, et al. 2009. Landscape ecological approach to the relationships of land use patterns in watersheds to water quality characteristics[J]. Landscape and Urban Planning, 92(2): 80-89. DOI:10.1016/j.landurbplan.2009.02.008 |
| 雷呈, 黄琪, 倪才英, 等. 2019. 袁河流域河流生境质量评价及其影响因素分析[J]. 江西师范大学学报(自然科学版), 43(4): 425-432. |
| Li C, Zhang Y, Kharel G, et al. 2018. Impact of climate variability and landscape patterns on water budget and nutrient loads in a peri-urban watershed:A coupled analysis using process-based hydrological model and landscape indices[J]. Environmental Management, 61(6): 954-967. DOI:10.1007/s00267-018-1019-4 |
| 李明涛, 王晓燕, 刘文竹. 2013. 潮河流域景观格局与非点源污染负荷关系研究[J]. 环境科学学报, 33(8): 2296-2306. |
| Liu Q, Shi T. 2019. Spatiotemporal differentiation and the factors of ecological vulnerability in the Toutun river basin based on remote sensing data[J]. Sustainability, 11(15): 4160. DOI:10.3390/su11154160 |
| Liu R, Wang J, Shi J, et al. 2014. Runoff characteristics and nutrient loss mechanism from plain farmland under simulated rainfall conditions[J]. Science of the Total Environment, 468-469: 1069-1077. DOI:10.1016/j.scitotenv.2013.09.035 |
| Ma L, Bo J, Li X, et al. 2019. Identifying key landscape pattern indices influencing the ecological security of inland river basin:The middle and lower reaches of Shule River Basin as an example[J]. Science of the Total Environment, 674: 424-438. DOI:10.1016/j.scitotenv.2019.04.107 |
| Oni S K, Futter M N, Molot L A, et al. 2014. Adjacent catchments with similar patterns of land use and climate have markedly different dissolved organic carbon concentration and runoff dynamics[J]. Hydrological Processes, 28(3): 1436-1449. DOI:10.1002/hyp.9681 |
| Shigaki F, Sharpley A, Prochnow L I. 2007. Rainfall intensity and phosphorus source effects on phosphorus transport in surface runoff from soil trays[J]. Science of the Total Environment, 373(1): 334-343. DOI:10.1016/j.scitotenv.2006.10.048 |
| Sliva L, Dudley Williams D. 2001. Buffer zone versus whole catchment approaches to studying land use impact on river water quality[J]. Water Research, 35(14): 3462-3472. DOI:10.1016/S0043-1354(01)00062-8 |
| Staponites L R, Barták V, Bíly M, et al. 2019. Performance of landscape composition metrics for predicting water quality in headwater catchments[J]. Scientific Reports, 9(1): 2045-2322. DOI:10.1038/s41598-018-37209-y |
| 孙金伟, 许文盛. 2017. 河岸植被缓冲带生态功能及其过滤机理的研究进展[J]. 长江科学院院报, 34(3): 40-44. |
| 孙芹芹, 黄金良, 洪华生, 等. 2011. 九龙江流域城镇建设用地与河流水质关系研究[J]. 环境科学, 32(10): 2849-2854. |
| 万小丽.2016.宜春市城区河段工况影响下水质变化分析研究[D].南昌: 南昌工程学院.63 http://cdmd.cnki.com.cn/Article/CDMD-11319-1016056268.htm |
| 王鹏, 齐述华, 袁瑞强. 2015. 赣江流域土地利用方式对无机氮的影响[J]. 环境科学学报, 35(3): 826-835. |
| 王小平, 张飞, 李晓航, 等. 2017. 艾比湖区域景观格局空间特征与地表水质的关联分析[J]. 生态学报, 37(22): 7438-7452. |
| 王瑛, 张建锋.2011.景观格局变化对太湖水质的影响研究综述[C].全国湖泊-湿地-流域生态保护与3S技术应用大会.南昌: 217-220 |
| Wang Y, Zhang X, Huang C. 2009. Spatial variability of soil total nitrogen and soil total phosphorus under different land uses in a small watershed on the Loess Plateau, China[J]. Geoderma, 150(1/2): 141-149. |
| 温巍. 2019. 袁河水质评价及水污染特征分析[J]. 陕西水利, 219(4): 115-116. |
| 夏品华, 孔祥量, 喻理飞. 2016. 草海湿地小流域土地利用与景观格局对氮、磷输出的影响[J]. 环境科学学报, 36(8): 2983-2989. |
| Xiao R, Wang G, Zhang Q, et al. 2016. Multi-scale analysis of relationship between landscape pattern and urban river water quality in different seasons[J]. Sci Rep, 6: 25250. DOI:10.1038/srep25250 |
| Xu L T, Chen S S, Xu Y, et al. 2019. Impacts of land-use change on habitat quality during 1985-2015 in the Taihu Lake Basin[J]. Sustainability, 11(13): 3513. DOI:10.3390/su11133513 |
| Yu S, Xu Z, Wu W, et al. 2016. Effect of land use types on stream water quality under seasonal variation and topographic characteristics in the Wei River basin, China[J]. Ecological Indicators, 60: 202-212. DOI:10.1016/j.ecolind.2015.06.029 |
| 张大伟, 李杨帆, 孙翔, 等. 2010. 入太湖河流武进港的区域景观格局与河流水质相关性分析[J]. 环境科学, 31(8): 1775-1783. |
| Zhang X, Luo Y, Goh K S. 2018. Modeling spray drift and runoff-related inputs of pesticides to receiving water[J]. Environmental Pollution, 234: 48-58. DOI:10.1016/j.envpol.2017.11.032 |
| 张晓健, 林朋飞, 陈超. 2017. 江西新余仙女湖镉铊砷突发环境事件应急供水[J]. 中国给水排水, 33(9): 1-10. |
| Zhou T, Wu J, Peng S. 2012. Assessing the effects of landscape pattern on river water quality at multiple scales:A case study of the Dongjiang River watershed, China[J]. Ecological Indicators, 23: 166-175. DOI:10.1016/j.ecolind.2012.03.013 |
| 朱珍香, 高肖飞, 彭凤, 等. 2019. 厦门后溪水质与流域景观特征沿城乡梯度的变化分析[J]. 生态学报, 39(6): 2021-2033. |
