 , 田浩杞1, 牛秀丽2, 贾世铭1, 刘艳蓉1, 陈学福1, 解众1, 杨德忠1, 李澜1, 史高峰1
 , 张远航3
1. 兰州理工大学石油化工学院, 兰州 730050;
2. 甘肃省食品检验研究院, 兰州 730030;
3. 北京大学环境科学与工程学院, 北京 100084
收稿日期: 2018-04-12; 修回日期: 2018-07-02; 录用日期: 2018-07-02
基金项目: 国家重点研发计划(No.2016YFC0202900);国家自然科学基金项目(No.21567015);甘肃省自然科学基金项目(No.17JR5RA109)
作者简介: 王国英(1983-), 男, 博士, E-mail:gywangcn@126.com
通讯作者(责任作者): 史高峰, E-mail:gaefengshi_Lzh@163.com, shigaofeng@lut.cn
摘要: 通过传统单波长激发/发射荧光光谱法与恒能量同步荧光光谱法进行对比,对大气颗粒物中多环芳烃(PAHs)进行了定性定量分析,采用恒能量同步荧光光谱法在不同能量差下建立了15种典型PAHs成分的恒能量同步荧光法的标准谱库.在各PAHs在最佳能量差下进行定量分析,结果表明,除苊荧光信号响应较差外,其余PAHs的LOD和LOQ分别为0.0580 ~3.18、0.232~12.7 ng·mL-1.15种PAHs的空白和一定浓度下的加标回收率范围在82.8%~120.0%,相对标准偏差范围在0.51%~5.87%之间,以恒能量同步荧光光谱进行了兰州地区大气颗粒物中15种PAHs分布特征分析.
关键词:大气颗粒物多环芳烃恒能量同步荧光光谱特征
Constant-energy synchronous fluorescence spectrum characteristics of 15 polycyclic aromatic hydrocarbons from atmospheric particulate matters
WANG Guoying1
 , TIAN Haoqi1, NIU Xiuli2, JIA Shiming1, LIU Yanrong1, CHEN Xuefu1, XIE Zhong1, YANG Dezhong1, LI Lan1, SHI Gaofeng1
 , ZHANG Yuanhang3
 1. School of Petrochemical Engineering, Lanzhou University of Technology, Lanzhou 730050;
2. Gansu Province Food Inspection Institute, Lanzhou 730030;
3. College of Environmental Sciences and Engineering, Peking University, Beijing 100084
Received 12 April 2018; received in revised from 2 July 2018; accepted 2 July 2018
Abstract: In this paper, traditional single-wavelength excitation/emission fluorescence spectroscopy was compared with constant-energy synchronous fluorescence spectrometry to qualitatively and quantitatively analyze PAHs in atmospheric particles. Constant-energy synchronous fluorescence spectrometry was used to establish 15 PAHs under different energy differences. Standard spectral database of 15 PAHs for constant energy synchrotron fluorescence was developed. Quantitative analysis was performed at the optimal energy difference for each PAHs with LOD and LOQ of 0.0580 ~3.18 and 0.232~12.7 ng·mL-1, respectively. The recoveries of the 15 PAHs in the blank and at certain concentrations ranged from 82.8% to 120.0%, and the relative standard deviations ranged from 0.51% to 5.87%. The actual samples were analyzed at monitoring sites of Lanzhou, China.
Keywords: atmospheric particulate matterspolycyclic aromatic hydrocarbonsconstant-energy synchronous fluorescence spectrometrycharacteristics of fluorescence spectrum
1 引言(Introduction)多环芳烃(PAHs)是指分子中含有两个或两个以上苯环的持久性的有机污染物, 其种类繁多且均是具有“致癌、致畸、致突变”作用的有毒有害物质(Slezakova et al., 2010; Dat et al., 2017; DImitriou et al., 2017).大气中的多环芳烃(PAHs)主要来自化石燃料、木材、烟草和塑料等有机物的不完全燃烧和交通源排放, 同时也可以通过食物链在动物体内累积, 严重危害人类健康(Alves et al., 2011; Slezakova et al., 2013; Wang et al., 2014; Godec et al., 2016), 因此, 大气颗粒物中的PAHs定性定量分析是大气化学与污染控制研究的重要内容.
兰州为西北工业重镇, 是以石油化工、机械制造、金属冶炼为主的工业城市.从2000年开始被列为中国PM10污染最严重的城市之一, 也是最早中国被报道发生光化学烟雾的城市(张凯等, 2017).石化行业、机动车尾气排放及饮食烧烤等因素导致PAHs的大量排放.其地形地貌特征为三面环山的半封闭哑铃式盆地, 造成气流闭塞导致城区大气污染物不易扩散而在城内屯积(王莉, 2017).许多课题组针对兰州大气环境中PAHs进行了研究, 董继元等(2013)研究了兰州城区PAHs的多介质归趋模拟;于云江等(2013)以现场采样监测和问卷调查方式, 结合健康风险评价模型, 对兰州市大气PM10中PAHs及其健康风险进行了研究.李英红等(2016)研究了大气细颗粒物中多环芳烃的污染特征及来源分析.
对于多环芳烃的常用分析方法有高效液相色谱法(HPLC)(Xu and Fang, 1988; Noh, 2002; 常君瑞等, 2016)、气相色谱-质谱法(GC-MS)(Gao et al., 2008; Seo et al., 2009; Dong et al., 2012; Wang et al., 2013; Nikolic et al., 2017)、气相色谱-串联质谱法(GC-MS/MS)(Zhao et al., 2014; Zhao et al., 2015; Haleyur et al., 2016)、高效液相色谱-荧光检测法(HPLC-FLD)(Akyüz and abuk, 2009; Denis et al., 2012; Yu et al., 2014)等.常用的提取技术包括索氏提取、超声波提取、高压加速溶剂提取(ASE)、微波辅助提取(MAE)和超临界流体萃取(SFE)(Itoh et al., 2008; Siebielska, 2008; Saba et al., 2012).以上方法在PAHs检测方面已经较为成熟, 应用回收率和重现性等方法学指标进行衡量, 取得了良好的检测效果, 但色谱分析的预处理过程均需对大气颗粒物样品进行提纯及预先分离, 仪器分析周期长, 溶剂用量大, 过程干扰因素多(蔡小琼等, 2010), 因此, 开发一种高效快速无需分离的PAHs分析方法具有一定的实际意义.
由PAHs的分子结构可知, PAHs具有高共轭体系, 是强荧光物质(Eiroa et al., 2000), 应该具有特征光谱响应.在传统的单波长激发/发射荧光分析法的基础上, 荧光分析技术获得不断发展和完善, 出现了同步荧光分析法, 当激发能量和发射能量刚好匹配这一特定的吸收-发射的跃迁条件时, 该跃迁处于最佳条件, 由此产生的同步荧光信号可达最大强度.其具有谱图简化、选择性提高、光散射干扰少等特点, 它还能从根本上解决拉曼散射的干扰问题, 尤其适合对多组分混合物的分析(许金钩, 2006).已有****尝试用该方法直接对多组分PAHs混合物进行分析(Andrade et al., 2000; Ying et al., 2011; 章汝平等, 2007), 但因实验方法与仪器条件不相同, 得到的结果图谱也存在较大差异.
本研究中, 通过传统单波长激发/发射荧光法与恒能量同步荧光法进行方法比对, 建立大气颗粒物中15种PAHs的荧光特征谱库, 采用超声提取法对采集的大气颗粒物进行样品前处理, 实现无需分离即可快速恒能量同步荧光光谱定性定量分析.在此基础上, 定量检测了兰州市大气PAHs的污染组成特征及其含量水平.
2 材料与方法(Materials and methods)2.1 实验材料甲醇(AR级)、荧蒽(Ft)、蒽(Ant)、苯并[a]芘(Bap)、苯并[g, h, i]苝(Bghip)、苯并(k)荧蒽(BkF)、苯并[A]蒽(BaA)、苯并[b]荧蒽(BbF)、(Chry)、茚并[1, 2, 3-cd]芘(Ind)、菲(Phen)、芘(Pyr)、萘(Naph)、苊(Acen)、芴(Flu), 以上PAHs均购自百灵威科技有限公司.AL204型电子天平(梅特勒-托利仪器公司), PerkinElmer-LS55型荧光分光光度计(美国珀金埃尔默公司)配1 cm四通石英比色皿, TH-3150型大气与颗粒物组合采样器(武汉天虹仪器公司), SB-5200超声波清洗机(宁波新芝生物科技公司).
2.2 标准溶液制备将固体标准PAHs用电子微量天平准确称量1.00 mg, 在10 mL容量瓶中用甲醇定容, 配备成0.100 mg · mL-1标准储备液, 所有标准储备液存放于棕色玻璃瓶内, 使用时用甲醇进行逐级稀释至所需浓度, 配置一系列不同浓度的标准溶液.
2.3 分析方法激发和发射单色器狭缝分别为2.5 nm和5.0 nm, 扫描速度为500 nm · min-1, 因不同种类PAHs的荧光灵敏度不同, 故设置光电倍增管(PMT)工作电压为750 V和800 V各扫描一遍以获得合适范围的荧光信号.针对不同成分设定不同的激发/发射波长进行扫描, 选择在1500、3000、3600、5200、7500、8800 cm-1的能量差进行恒能量同步荧光光谱扫描, 绘制特征图谱.
2.4 样品的收集和预处理使用TH-3150型大气与颗粒物组合采样器在兰州七里河和兰州东方红广场进行大气颗粒物样品采集, 采样流量为100 L · min-1, 时间为8 h.将采样后的玻璃纤维滤膜剪碎置于250 mL锥形瓶中, 用50 mL甲醇分两次分别超声提取40 min, 之后定容待测.
2.5 质量控制为去除有机物本底及增加滤膜韧性, 用铝箔包裹滤膜在400 ℃马弗炉中灼烧5 h, 将滤膜置于干燥器中备用.配置的标准储备液避光冷藏.为了减少实验误差的干扰, 每个图谱重复扫描不少于3次.
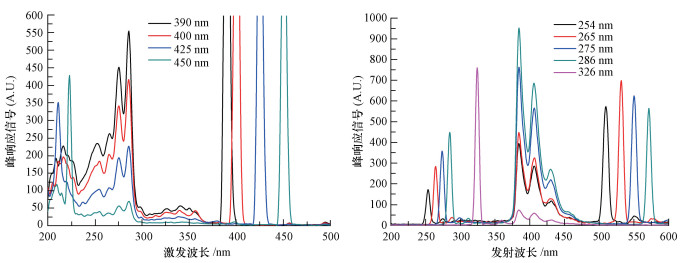
3 结果与讨论(Results and discussion)3.1 方法比对绘制15种PAHs的单波长激发/发射的特征谱图, 获得其特征峰位.其中苯并[A]蒽图谱如图 1所示.
图 1(Fig. 1)
 |
| 图 1 BaA的单波长激发/发射荧光光谱 Fig. 1Single wavelength excitation/emission fluorescence spectra of BaA |
由图 1可见具有明显的特征激发/发射峰, 其中激发和发射光谱呈现良好的镜像关系.其他PAHs单波长激发/发射图谱特征峰位如表 1所示.
表 1(Table 1)
| 表 1 PAHs单波长激发/发射荧光光谱特征谱带 Table 1 PAHs single-wavelength excitation/emission fluorescence spectral signature bands | |||||||||||||||||||||||||||||||||||||||||||||||||||
表 1 PAHs单波长激发/发射荧光光谱特征谱带 Table 1 PAHs single-wavelength excitation/emission fluorescence spectral signature bands
| |||||||||||||||||||||||||||||||||||||||||||||||||||
由表 1可见单波长激发/发射光谱特征谱带宽, 在混合体系中易造成谱带重叠严重, 选择性差, 不利于分辨.由图 1还可以看出拉曼散射严重.
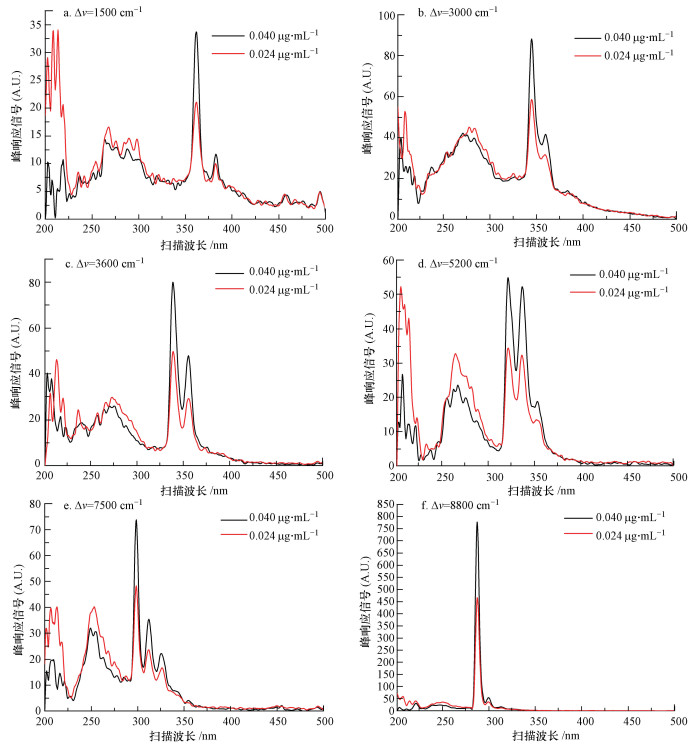
分别在1500、3000、3600、5200、7500、8800 cm-1的不同能量差条件下测定了15种PAHs的恒能量同步荧光光谱, 其中BaA的图谱如图 2所示.
图 2(Fig. 2)
 |
| 图 2 BaA不同能量差特征光谱 Fig. 2BaA different energy difference characteristic spectrum |
由图 1和图 2对比可知, 采用恒能量同步荧光光谱法可使PAHs的谱图得到简化, 并且可解决溶液的瑞利散射干扰.由图 2可知, PAHs在合适能量差下可使特征谱带窄化, 呈单峰状态, 并且信号响应值也增强, 灵敏度增加, BaA最佳检测条件能量差为8800 cm-1, 在此能量差下, 检出限最低.其他PAHs恒能量同步荧光光谱特征峰位如表 2所示.
表 2(Table 2)
| 表 2 PAHs恒能量同步荧光光谱特征谱带 Table 2 PAHs constant-energy synchronous fluorescence spectrum characteristic bands | ||||||||||||||||||||||||||||||||||||||||||||||||||||||||||||||||||||||||||||||||||||||||||||||||||||||||||||||||
表 2 PAHs恒能量同步荧光光谱特征谱带 Table 2 PAHs constant-energy synchronous fluorescence spectrum characteristic bands
| ||||||||||||||||||||||||||||||||||||||||||||||||||||||||||||||||||||||||||||||||||||||||||||||||||||||||||||||||
3.2 定量分析根据仪器灵敏度、峰形窄化程度、谱带宽度、减少谱带重叠等原则挑选出各PAHs最佳检测能量差, 确定了各物质的最佳检测能量差, 表 3为各PAHs最佳检测能量差, 在此条件下进行定量分析.
表 3(Table 3)
| 表 3 各PAHs最佳检测能量差 Table 3 The best detection energy difference of PAHs | ||||||||||||||
表 3 各PAHs最佳检测能量差 Table 3 The best detection energy difference of PAHs
| ||||||||||||||
由于各PHAs荧光强度不同, 若物质荧光强度较小采用高电压以增强荧光信号响应, 反之采用低电压检测, 以免出现信号过载失去定量依据和信号响应弱低于检出限.检出限(LOD)和最低定量限(LOQ)是衡量该方法优劣的指标, 因此对方法的最低检出限(LOD)和定量限(LOQ)进行了测试.LOD为3倍空白标准偏差除以标准曲线的斜率进行计算, 以4倍检出限作为定量限(中国环境科学研究院等, 2010).表 4为各PAHs的标准曲线、检出限和定量限.
表 4(Table 4)
| 表 4 PAHs标准曲线与检出限 Table 4 PAHs standard curve and detection limit | |||||||||||||||||||||||||||||||||||||||||||||||||||||||||||||||||||||||||||||||||||||||||||||||||||||||||||||||||||||||
表 4 PAHs标准曲线与检出限 Table 4 PAHs standard curve and detection limit
| |||||||||||||||||||||||||||||||||||||||||||||||||||||||||||||||||||||||||||||||||||||||||||||||||||||||||||||||||||||||
由表 4可知苊的线性方程R2为0.962, LOD与LOQ较其他样品高2个数量级, 这是因为苊荧光响应较弱.其余样品标准曲线R2在0.991~1.00之间, 说明其线性关系良好.LOD和LOQ分别为0.0580 ~3.18、0.232~12.7 ng · mL-1.
3.3 方法精密度在预处理过的空白玻璃纤维滤膜上, 考察空白和一定浓度水平的PAHs标准物质(均匀地涂抹于滤膜上)不同加标量的回收试验, 与样品采用相同的超声提取法进行提取后进行测定, 每个加标样品平行测定7次, 考察方法的回收率和精密度.
表 5(Table 5)
| 表 5 方法的加标回收率及相对标准偏差(n=7) Table 5 Method spike recovery and relative standard deviation (n=7) | ||||||||||||||||||||||||||||||||||||||||||||||||||||||||||||||||||||||||||||||||||||||||||||||||||||||||||||||||||||||||||||||||||||||||||||||||||||||||||||||||||||||||||||||||||||||||||||||||||||||||||||||||||||||||||||||||||||||||||||||||||||||||||||||||||||
表 5 方法的加标回收率及相对标准偏差(n=7) Table 5 Method spike recovery and relative standard deviation (n=7)
| ||||||||||||||||||||||||||||||||||||||||||||||||||||||||||||||||||||||||||||||||||||||||||||||||||||||||||||||||||||||||||||||||||||||||||||||||||||||||||||||||||||||||||||||||||||||||||||||||||||||||||||||||||||||||||||||||||||||||||||||||||||||||||||||||||||
15种多环芳烃的空白和一定浓度下的加标回收率范围在82.8%~120%, 相对标准偏差(n=7)除Ance为5.87%, 其余范围在0.51%~3.93%之间.回收率和重现性等方法学指标均能满足颗粒物中多环芳烃的检测要求, 说明超声提取-恒能量同步荧光光谱法能够达到准确测定多环芳烃的要求.
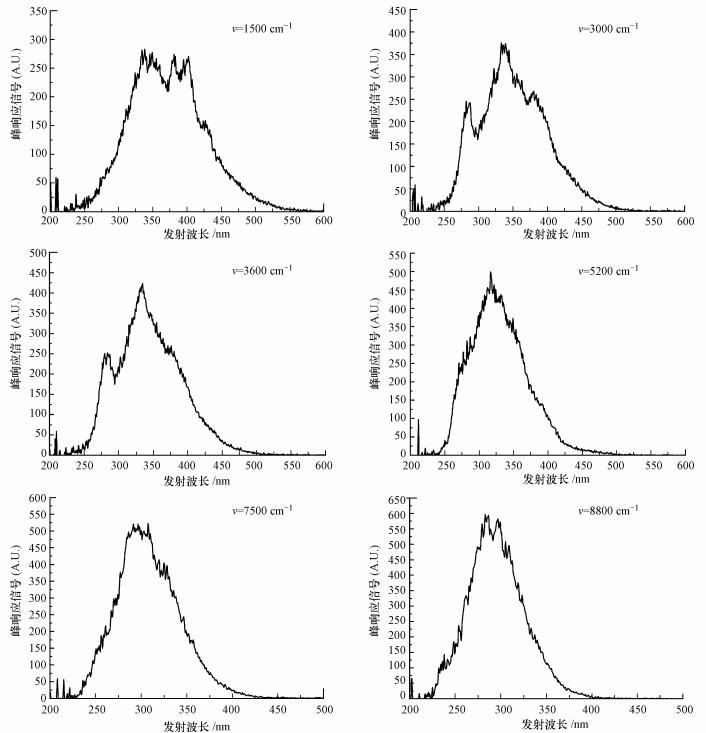
3.4 兰州市大气颗粒物PAHs的组成特征分析将来自不同采样点的大气颗粒物样品通过超声提取的方式进行预处理后进行恒能量同步荧光法进行分析.对某一实际大气颗粒物样品在不同能量差下扫描结果如图 3所示, 同时结合表 2、3、4与PAHs恒能量同步荧光光谱特征谱带比对进行定性, 将特征峰位信号值代入标准方程, 再根据样品采样气体体积进行环境中PAHs的浓度定量分析.将两个采样点6个样品采用同样的方法进行处理分析结果如表 6所示.
图 3(Fig. 3)
 |
| 图 3 实际样品不同能量差下扫描结果 Fig. 3Scan results of actual samples with different energy differences |
表 6(Table 6)
| 表 6 分析大气颗粒物样品中PAHs的浓度 Table 6 Analysis of PAHs concentration in atmospheric particulate samples | ||||||||||||||||||||||||||||||||||||||||||||||||||||||||||||||||||||||||||||||||||||||||||||||||||||||||||||||||||||||||||||||||||||
表 6 分析大气颗粒物样品中PAHs的浓度 Table 6 Analysis of PAHs concentration in atmospheric particulate samples
| ||||||||||||||||||||||||||||||||||||||||||||||||||||||||||||||||||||||||||||||||||||||||||||||||||||||||||||||||||||||||||||||||||||
由分析结果可知, 所有样品中检测到绝大多数目标分析物的存在.其中两个采样点PAHs污染浓度相差较大, 在兰州七里河监测点采集的样品PAHs污染物浓度明显小于东方红广场, 这是因为广场被交通主干道包围, 交通主干道上来往车辆多, 且广场边缘有公交站台, 机动车尾气排放量较大, 交通源为主要污染源, 其次广场商业区存在较多的餐饮业, 也会造成广场采集的样品PAHs浓度较高.其中S6样品较S4、S5浓度较低, 是因为采集S6样品时前一天晚上天气有降雪现象, 降水会导致污染物水平较低, 并且由于天气原因采样当天道路上机动车数量减少.
4 结论(Conclusions)采用恒能量同步荧光光谱法对兰州地区大气颗粒物中15种PHAs进行分析, 通过与传统的单波长激发/发射荧光光谱进行对比, 在6种不同能量差下建立了15种PAHs的恒能量同步荧光法的标准谱库.许多PAHs单体具有同分异构体(Jiang et al., 2014), 其光谱特性并不易分辨, 故该方法可以考虑与串联质谱进行联用以完善方法的排他性.另外该方法样品预处理步骤简单、仪器分析时间更短(40~50 s), 并能减少环境不友好的溶剂的使用.各PAHs在最佳能量差下进行定量分析, 除苊荧光信号响应较弱外, 其余PAHs的LOD和LOQ分别为0.058~3.18 ng · mL、0.232~12.7 ng · mL-1.对方法进行精密度探讨, 15种多环芳烃的空白和一定浓度下的加标回收率范围在82.8%~120%, 相对标准偏差(n=7)范围在0.51%~5.87%, 并对实际样品进行分析.由于采样区域内污染源不同, 兰州七里河监测点采集的样品PAHs污染物浓度明显小于东方红广场.
参考文献
| Akyüz M, ?abuk H. 2009. Meteorological variations of PM2.5/PM10 concentrations and particle-associated polycyclic aromatic hydrocarbons in the atmospheric environment of Zonguldak, Turkey[J]. Journal of Hazardous Materials, 170(1): 13–21.DOI:10.1016/j.jhazmat.2009.05.029 |
| Alves C A, Vicente A, Monteiro C, et al. 2011. Emission of trace gases and organic components in smoke particles from a wildfire in a mixed-evergreen forest in Portugal[J]. Science of the Total Environment, 409(8): 1466–1475.DOI:10.1016/j.scitotenv.2010.12.025 |
| Andrade E A, Vázquez B E, López M P, et al. 2000. Determination of polycyclic aromatic hydrocarbons (PAHs) in a complex mixture by second-derivative constant-energy synchronous spectrofluorimetry[J]. Talanta, 51(4): 677–684.DOI:10.1016/S0039-9140(99)00328-8 |
| 蔡小琼, 王伯光, 唐小东, 等. 2010. 大气气溶胶中多环芳烃的特征光谱检测技术研究[J]. 分析测试学报, 2010, 29(9): 888–894.DOI:10.3969/j.issn.1004-4957.2010.09.004 |
| 常君瑞, 李娜, 徐春雨, 等. 2016. 超声提取-高效液相色谱法测定PM2.5中的多环芳烃[J]. 实用预防医学, 2016, 23(3): 267–270.DOI:10.3969/j.issn.1006-3110.2016.03.004 |
| 董继元, 王金玉, 张本忠, 等. 2013. 兰州城区多环芳烃的多介质归趋模拟研究[J]. 环境科学学报, 2013, 33(2): 570–578. |
| Dat N D, Chang M B. 2017. Review on characteristics of PAHs in atmosphere, anthropogenic sources and control technologies[J]. Science of the Total Environment, 609: 682.DOI:10.1016/j.scitotenv.2017.07.204 |
| Denis E H, Toney J L, Tarozo R, et al. 2012. Polycyclic aromatic hydrocarbons (PAHs) in lake sediments record historic fire events: Validation using HPLC-fluorescence detection[J]. Organic Geochemistry, 45(2): 7–17. |
| Dimitriou K, Kassomenos P. 2017. Aerosol contributions at an urban background site in Eastern Mediterranean - Potential source regions of PAHs in PM10 mass[J]. Science of the Total Environment, 598: 563.DOI:10.1016/j.scitotenv.2017.04.164 |
| Dong C D, Chen C F, Chen C W. 2012. Determination of polycyclic aromatic hydrocarbons in industrial harbor sediments by GC-MS[J]. International Journal of Environmental Research & Public Health, 9(6): 2175. |
| Eiroa A A, Huckins S R, Blanco E V, et al. 2000. Optimizing resolution in constant-energy synchronous spectrofluorimetry[J]. Applied Spectroscopy, 54(10): 1534–1538.DOI:10.1366/0003702001948466 |
| Gao S, Zhang Y, Li Y, et al. 2008. A comparison between the vacuum ultraviolet photoionization time-of-flight mass spectra and the GC/MS total ion chromatograms of polycyclic aromatic hydrocarbons contained in coal soot and multi-component PAH particles[J]. International Journal of Mass Spectrometry, 274(1): 64–69. |
| Godec R, Jakovljevic' I K. 2016. Carbon species in PM10 particle fraction at different monitoring sites[J]. Environmental Pollution, 216: 700–710. |
| Haleyur N, Shahsavari E, Mansur A A, et al. 2016. Comparison of rapid solvent extraction systems for the GC-MS/MS characterization of polycyclic aromatic hydrocarbons in aged, contaminated soil[J]. Methodsx, 3: 364–370.DOI:10.1016/j.mex.2016.04.007 |
| 李英红, 饶志国, 谭吉华, 等. 2016. 兰州大气细颗粒物中多环芳烃污染特征及来源分析[J]. 环境科学, 2016, 37(7): 2428–2435. |
| Itoh N, Numata M, Aoyagi Y, et al. 2008. Comparison of low-level polycyclic aromatic hydrocarbons in sediment revealed by Soxhlet extraction, microwave-assisted extraction, and pressurized liquid extraction[J]. Analytica Chimica Acta, 612(1): 44.DOI:10.1016/j.aca.2008.02.012 |
| Jiang B, Liang Y, Xu C, et al. 2014. Polycyclic aromatic hydrocarbons (PAHs) in ambient aerosols from Beijing: characterization of low volatile PAHs by positive-ion atmospheric pressure photoionization (APPI) coupled with Fourier transform ion cyclotron resonance[J]. Environmental Science & Technology, 48(9): 4716–4723. |
| Nikolic J S, Jovanovic V P S, Dimitrijevic M V, et al. 2017. Dispersive solid-phase extraction clean up combined with Soxhlet extraction for the determination of 16 PAHs in soil samples by GC-MS[J]. International Journal of Environmental Analytical Chemistry, 97(2): 112–123.DOI:10.1080/03067319.2017.1290801 |
| Noh I. 2002. HPLC analysis of Polycyclic Aromatic Hydrocarbons(PAHs) in Mussels(Mytilus edulis) living in the Intertidal Zone of Kori, Korea[J]. Journal of Environmental Science International, 11(5): 455–461.DOI:10.5322/JES.2002.11.5.455 |
| Saba B, Hashmi I, Nasir H, et al. 2012. Comparison of Soxhlet and direct ultrasonic techniques for determination of polycyclic aromatic hydrocarbons in agricultural and urban soils of pakistan[J]. Journal- Chemical Society of Pakistan, 34(34): 1312–1316. |
| Seo Y K, Park D K, Baek S O. 2009. Evaluation of a Method for the Measurement of PAHs in the Ambient Atmosphere - Focusing on High Volume Sampling and GC/MS Analysis[J]. Korean Journal of Environmental Health Sciences, 35(4): 322–333.DOI:10.5668/JEHS.2009.35.4.322 |
| Siebielska I. 2008. Comparative analysis of the methods used for polycyclic aromatic hydrocarbons extraction from sewage sludge[J]. Ochrona Srodowiska, 30(1): 51–54. |
| Slezakova K, Castro D, Delerue Matos C, et al. 2013. Impact of vehicular traffic emissions on particulate-bound PAHs: Levels and associated health risks[J]. Atmospheric Research, 127(6): 141–147. |
| Slezakova K, Castro D, Pereira M C, et al. 2010. Influence of traffic emissions on the carcinogenic polycyclic aromatic hydrocarbons in outdoor breathable particles[J]. Journal of the Air & Waste Management Association, 60(4): 393–401. |
| Wang J, Geng N B, Xu Y F, et al. 2014. PAHs in PM2.5 in Zhengzhou: concentration, carcinogenic risk analysis, and source apportionment[J]. Environmental Monitoring & Assessment, 186(11): 7461–7473. |
| Wang M, Zhang S, Zhang X, et al. 2013. Determination of Gaseous Phase Polycyclic Aromatic Hydrocarbons Emitted from a Diesel Engine by GC-MS with Novel Sample Preparation[J]. Analytical Letters, 46(12): 1951–1961.DOI:10.1080/00032719.2013.777922 |
| 王莉. 2017.中国西部兰州盆地多环芳烃大气污染特征及其健康风险[D].兰州: 兰州大学http://cdmd.cnki.com.cn/Article/CDMD-10730-1017714223.htm |
| 许金钩. 2006. 荧光分析法[M]. 北京: 科学出版社. |
| Xu B X, Fang Y Z. 1988. Determination ofpolynuclear aromatic hydrocarbons in water by flotation enrichment and HPLC[J]. Talanta, 35(11): 891–894.DOI:10.1016/0039-9140(88)80208-X |
| Ying W, Wanga Y S, Yanga H M, et al. 2011. Simultaneous determination of a-naphthol, b-naphthol and 1-hydroxypyrene in urine by synchronous fluorescence spectrometry using b-cyclodextrin as a sensitiser[J]. International Journal of Environmental and Analytical Chemistry, 91(1): 87–96. |
| 于云江, 杨林, 李良忠, 等. 2013. 兰州市大气PM10中重金属和多环芳烃的健康风险评价[J]. 环境科学学报, 2013, 33(11): 2920–2927. |
| Yu Y, Wang Y, Jin Q, et al. 2014. Polycyclic aromatic hydrocarbons in edible oils: Analysis by molecularly imprinted solid-phase extraction with HPLC-FLD[J]. Agro Food Industry Hi Tech, 25(3): 19–22. |
| Zhao B, Li Y, Zhang S, et al. 2014. Analysis of polycyclic aromatic hydrocarbons in air samples by gas chromatography-triple quadrupole mass spectrometry[J]. Chinese Journal of Chromatography, 32(9): 960–966.DOI:10.3724/SP.J.1123.2014.05027 |
| Zhao B, Zhang S, Zhou Y, et al. 2015. Characterization and quantification of PAH atmospheric pollution from a large petrochemical complex in Guangzhou: GC-MS/MS analysis[J]. Microchemical Journal, 119(119): 140–144. |
| 张凯, 于周锁, 高宏, 等. 2017. 兰州盆地人为源大气污染物网格化排放清单及其空间分布特征[J]. 环境科学学报, 2017, 37(4): 1227–1242. |
| 章汝平, 陈克华, 何立芳, 等. 2007. 大气飘尘中多环芳烃的超声波萃取-恒能量同步荧光法测定[J]. 分析测试学报, 2007, 26(6): 830–832.DOI:10.3969/j.issn.1004-4957.2007.06.015 |
| 中国环境科学研究院, 国家环境分析测试中心, 江苏省环境监测中心.2010.环境监测.分析方法标准制修订技术导则[S].行业标准-环保 |
