 , 云龙2, 苏翠平1, 曹礼明1, 曾立武1, 黄晓锋1

1. 北京大学深圳研究生院, 环境与能源学院, 城市人居环境科学与技术重点实验室, 深圳 518055;
2. 深圳市环境监测中心站, 深圳 518049
收稿日期: 2018-03-12; 修回日期: 2018-04-13; 录用日期: 2018-04-13
基金项目: 国家自然科学基金(No.91744202);深圳市科技计划(No.JCYJ20170412150626172)
作者简介: 雷建容(1993-), 女, E-mail:ljr1119@qq.com
通讯作者(责任作者): 黄晓锋(1978—), 男, 教授, 主要从事大气污染机理研究., E-mail:huangxf@pku.edu.cn
摘要: 大气PM2.5中很多金属元素危害人体健康,且具有源示踪性,因此,开展PM2.5中金属在线监测对污染来源分析和大气污染防治有着重要意义.本研究于2017年4—5月使用美国Cooper环境空气多金属在线监测仪对深圳城市大气PM2.5中金属元素进行连续观测.与同步离线采样测量的金属数据进行比对表明,10种元素(K、Zn、Cu、Mn、Fe、V、Ni、Ti、Pb、Cr)呈现良好的相关性,因而用于后续分析.观测期间大气PM2.5的平均浓度24.8 μg·m-3,其中10种金属元素总浓度为0.72 μg·m-3,占比2.9%.Mn、Fe、Cu、Zn和Ti的浓度日变化显示了日间高、夜间低的特征,表明受到本地人为源的显著影响;而K、Pb、Cr浓度日变化无明显波动,说明受区域传输影响较大;Ni与V日变化趋势一致,主要来源为船舶排放.主成分因子分析结果表明,观测期间PM2.5中金属污染来源主要为交通和扬尘源、工业排放/废物燃烧和船舶污染,方差贡献依次为54.3%、19.8%和8.8%.
关键词:PM2.5金属在线监测日变化主成分分析
On-line measurement and source characteristics of metals in PM2.5 urban Shenzhen
LEI Jianrong1
 , YUN Long2, SU Cuiping1, CAO Liming1, ZENG Liwu1, HUANG Xiaofeng1

1. Key Laboratory for Urban Habitat Environmental Science and Technology, School of Environment and Energy, Peking University Shenzhen Graduate School, Shenzhen 518055;
2. Shenzhen Environment Monitoring Center, Shenzhen 518049
Received 12 March 2018; received in revised from 13 April 2018; accepted 13 April 2018
Abstract: Some metals in PM2.5 are harmful to human health and can be tracers to some particular pollution sources. Therefore, it is very important to carry out on-line monitoring of metals in atmospheric PM2.5 for analysis of pollution sources and prevention of atmospheric pollution. In this study, the Cooper automated multi-metals monitor was used to continuously observe the metals in the atmospheric PM2.5 in Shenzhen from April to May in 2017. The comparisons with simultaneous off-line sampling and measurement of metal data indicated that 10 elements (K, Zn, Cu, Mn, Fe, V, Ni, Ti, Pb, Cr) exhibited good correlation and were therefore used for subsequent analysis. During the observation period, the average concentration of PM2.5 was 24.8 μg·m-3, and the total concentration of 10 metal elements was 0.72 μg·m-3, accounting for 2.9% of the total. The diurnal variation of Mn, Fe, Cu, Zn, and Ti showed the characteristics of higher in the daytime and lower in the evening, indicating that they were significantly influenced by the anthropogenic activities, while the diurnal variation of K, Pb, and Cr concentrations did not show significant fluctuations, indicating mainly affected by regional transport. The diurnal variation of Ni was consistent with V, implying their main source was ship emissions. The results of principal component analysis showed that the sources of metal pollution in PM2.5 during the observation period were mainly traffic/dust, industrial emissions/waste burning, and ship emissions, contributing 54.3%, 19.8%, and 8.8%, respectively.
Keywords: PM2.5metalson-line monitoringdiurnal variationprincipal component analysis
1 引言(Introduction)随着工业化的发展和城市化进程加快, PM2.5成为了我国城市大气首要污染物.PM2.5降低了大气能见度, 影响视觉感受.PM2.5作为有毒有害物质的载体和反应器, 通过呼吸系统进入人体, 对人体健康构成威胁(Samet et al., 2000; Watson et al., 2002; Pope et al., 2006; 方凤满, 2010).金属元素作为PM2.5的重要组成部分, 其中部分金属具有不可自然降解性和生物富集性(谢华林等, 2002), 特别是As、Cd、Hg、Cr、Ni、Co、Se等更是被列为致癌物质(USEPA, 1990).现有的研究认为大气金属元素的主要来源有工业排放、车辆活动、道路扬尘和燃煤、燃油等(李丽娟等, 2014; 刘佳等, 2015).
虽然PM2.5中监测到的金属总量通常较少, 比如在北京、上海的PM2.5中质量占比分别为0.75%(许栩楠等, 2016)、4.10%(王晓浩等, 2015), 但这些微量金属具有较强的污染源示踪性, 如K作为生物质燃烧的示踪物, Ni、V是燃油的特征元素, Mn和Fe在钢铁冶炼排放中较为突出(Pancras et al., 2006).传统的PM2.5中金属研究方法需在长时间膜采样(24 h)后, 进行实验室电感耦合等离子体质谱仪(ICP-MS)或Epsilon5光谱仪等分析, 造成了污染来源的叠加、获悉污染水平的时间延迟和数据的低时间分辨率, 也使得金属数据不能有效地与气象变化或短期的排放变化相关联, 不利于掌握其大气来源和迁移特征.因此, 需要高时间分辨率的在线仪器来更精细地分析金属污染的来源(Richard et al., 2011; Dall′Osto et al., 2013; Jeong et al., 2016), 特别是本地源的变化, 例如道路扬尘、车辆和工业源.目前国外对环境空气多金属在线监测仪的监测数据评估研究较少(Park et al., 2014; Furger et al., 2017; Tremper et al., 2017), 而国内相关研究亦极少.
本研究以深圳大气为例, 在对进口的环境空气多金属在线监测仪数据进行比对评估的基础上筛选出监测质量较高的金属元素, 结合高时间分辨率金属浓度与黑碳(BC)数据、气象条件分析它们的污染特征与来源, 为城市大气金属污染控制提供科学依据.
2 材料与方法(Material and methods)2.1 采样方法与仪器研究点位于大学城北大园区(22°35′45"N, 113°58′23"E)环境楼4层楼顶(距离地面20 m左右), 周边无局地污染源, 远离交通干道.Xact-625型环境空气多金属在线监测仪(Cooper Environmental Services LLC)于2017年4月1日—5月31日采集并分析PM2.5中24种金属(K、Fe、Zn、Ca、Te、Sb、Sn、Pb、Mn、Ti、Cu、V、Cd、Ni、Ag、Ba、As、Cr、Se、Mo、Co、Hg、Tl、Pd), 元素检出限范围0.06~5.2 ng · m-3, 时间分辨率为1 h.Xact-625采用空气动力学原理, 切割流量16.7 L · min-1, PM2.5通过切割器富集到滤纸上, 卷轮将其移送至检测区域, X射线无损分析滤膜样品, 并输出浓度值.样品采集湿度控制在45%以下, 采样与分析同步进行.夜间0:00—0:30进行自动化质量保证, 包含能量校准(Cu)和仪器的稳定性测试(Cd、Cr和Pd).更多仪器原理详见文献(Furger et al., 2017).
2.2 Xact-625与离线分析方法比对为了确保探讨的Xact-625监测数据可靠, 本研究在Xact-625连续采样期间选取2017年4月3—23日的数据与同步离线采样膜的ICP-MS、Epsilon5光谱仪的金属分析结果进行比对, 筛选出比对较好的Xact-625监测的金属数据进行下一步探讨.其中, 离线采样使用PM2.5四通道采样器(THA-16, 武汉天虹)和Teflon膜(美国Whatman公司)进行隔天采样, 采样时长设置24 h, 共获得11套样品.
一张Teflon膜前处理为微波消解, 用称重法在消解罐中加入约4 mL HNO3(67%~70%, FISHER Scientific UK Limited)、1 mL HCl(36%~38%, 分析纯, 国药集团化学试剂有限公司)、1 mL HF(47%~51%, FISHER Scientific UK Limited), 放入微波消解仪消解, 冷却后去除HF, 再次冷却后用去离子水将消解液转移至样品瓶中, 加入去离子水称重定容至25 mL.ICP-MS进行分析24种金属(Ti、V、Ni、Cu、Zn、Pb、K、Mn、Fe、Cr、Co、Cd、Ca、Ba、As、P、Se、Mo、Tl、Th、U、Na、Mg、Al); 另外一张Teflon膜使用Epsilon5光谱仪(Panalaytical Co.)(Jeong et al., 2017)无损分析21种金属(Ti、V、Ni、Cu、Zn、Pb、K、Mn、Fe、Cr、Co、Cd、Ca、Ba、As、Al、Si、S、Cl、Sb、Sn).
3种检测方法比对结果显示(表 1), 9种元素(Ti、V、Ni、Cu、Zn、Pb、K、Mn、Fe)的R2≥0.75, 斜率在0.71~1.23.除了ICP-MS和Epsilon5光谱仪比对的Cr相关性较弱外, Cr的另两类比对结果较好, R2分别为0.84和0.90.其他元素的监测数据比对存在较高差异性, 故以下的讨论只采用以上10种金属元素.
表 1(Table 1)
| 表 1 Xact-625监测数据与离线分析数据比对结果 Table 1 Result for the comparison of Xact-625 and offline data | ||||||||||||||||||||||||||||||||||||||||||||||||||||||||||||||||||||||||||||||||||||
表 1 Xact-625监测数据与离线分析数据比对结果 Table 1 Result for the comparison of Xact-625 and offline data
| ||||||||||||||||||||||||||||||||||||||||||||||||||||||||||||||||||||||||||||||||||||
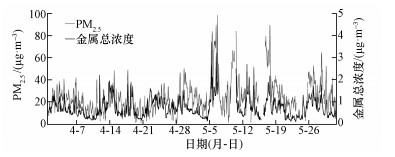
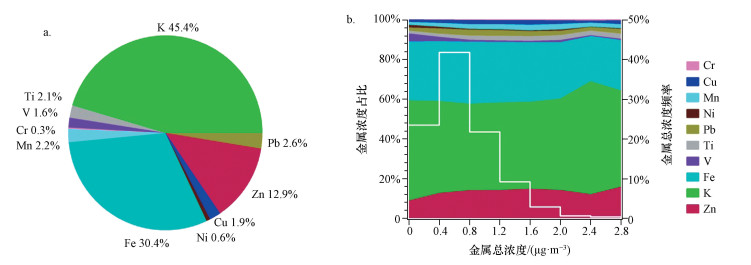
3 结果与讨论(Results and discussion)3.1 PM2.5中金属污染水平如图 1所示, 受天气形势变化影响, 深圳城市大气PM2.5质量浓度与金属总浓度随时间变化趋势总体相似(R2=0.39), 但在5月16—17日, PM2.5增长幅度高于金属, 说明此时二次污染源对PM2.5的贡献增大.观测期间PM2.5的平均浓度为24.8 μg · m-3, Xact-625测得10种金属浓度为0.72 μg · m-3, 占PM2.5的2.9%.金属平均浓度最高的3种元素为K (0.33 μg · m-3)、Fe(0.27 μg · m-3)、Zn(0.09 μg · m-3), 占到了金属总浓度的88.8%, 如图 2a所示.研究期间, 随着金属污染加重, K占比先下降后上升, Fe占比略有下降, Zn从占比8.7%上升至15.7%, 比重增长了80%, 说明该时期金属污染加重与Zn所代表的一次人为源关系密切, 见下文讨论.
图 1(Fig. 1)
 |
| 图 1 观测期间深圳大气PM2.5浓度与金属总浓度时间序列 Fig. 1Concentrations of PM2.5 and total metal time series in Shenzhen during the observation period |
图 2(Fig. 2)
 |
| 图 2 观测期间PM2.5中金属元素占比(a)及占比变化情况(b) Fig. 2The proportion(a) and variation in the proportion(b) of metals in PM2.5 during the observation period |
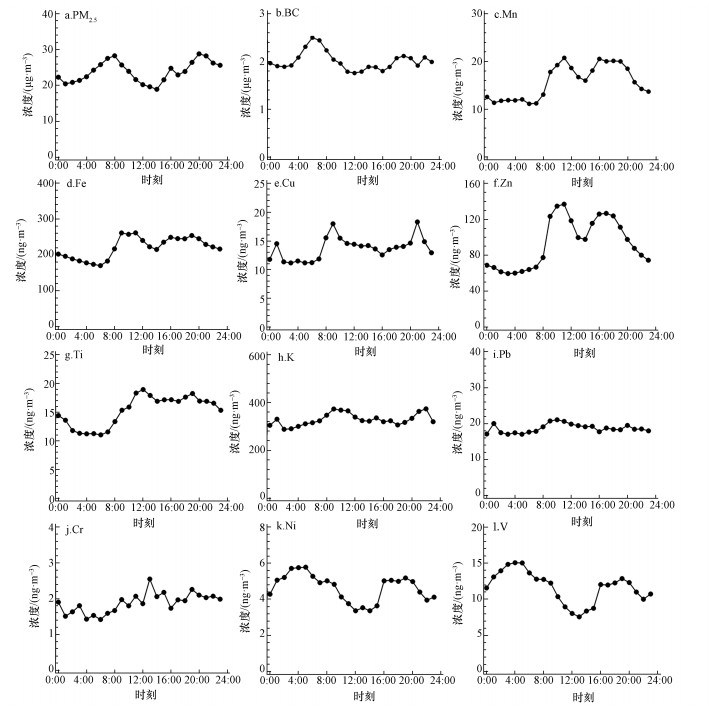
3.2 金属元素日变化特征金属元素日变化特征如图 3所示.PM2.5日变化呈现显著的“两峰”污染特征, 由车辆交通早、晚高峰排放引起(齐冰等, 2015).相比PM2.5, BC的早高峰出现的时间更早, 推测与深圳市的货柜车运营有关.以往的深圳大气源解析研究也证实了机动车是深圳大气PM2.5中BC的主要来源(黄晓锋等, 2014).Mn、Fe的浓度在日间显著高于夜间, 且与BC观测期间的浓度值呈现中等强度相关性(R2分别为0.66和0.69), 说明三者存在共同的交通来源(Gietl et al., 2010), 但Mn和Fe日间峰值时间晚于BC的峰值, 表明二者还有其他重要的污染来源.Cu日变化的峰值与BC浓度高值出现时间不同, 且在观测期间的浓度与BC相关性较弱(R2=0.30), 表明机动车排放并非Cu的主要来源.Cu在4月13日夜间20:00—14日清晨6:00曾出现短时高浓度值, 说明本地某些工业源可能对其具有较大贡献(周雪明等, 2017).Zn日变化出现明显双峰, 但早高峰时间晚于BC, 与BC观测期间的浓度值相关性亦较弱(R2=0.44), 说明其可能主要来自工业排放(Li et al., 2017a).Ti主要来源于地壳或者土壤源(杨怀金等, 2016), 其浓度在日间开始上升并持续至午夜, 与人为活动时间一致, 推测与人为活动引起的扬尘相关.
图 3(Fig. 3)
 |
| 图 3 观测期间PM2.5、BC和金属浓度日变化趋势 Fig. 3Diurnal variation trends of PM2.5, BC and metal concentrations during the observation period |
K、Pb和Cr浓度日变化相对不明显, 且与风速无相关性(R2=0), 说明其在大气中已混合较为均匀, 受区域传输影响较为明显.在观测期间K与Pb的浓度呈现中等强度相关性(R2=0.67), 其可能为垃圾焚烧来源(Yuan et al., 2006).在汽油无铅化后, Pb可能来自塑料焚烧、涂料和冶金等工业来源(Balasuramanian et al., 2004; Haritash et al., 2007).工业、垃圾焚烧等则是Cr的可能来源(Pant et al., 2012; Bullock et al., 2008; 谭吉华等, 2013).
Ni与V浓度日变化特征一致, 均在清晨5:00和夜间19:00出现显著峰值, 且二者在观测期间的浓度呈现出很强的相关性(R2=0.95).XRF荧光法检测的Ni和V能级不同, 不存在方法上的误差造成Ni和V的浓度趋势相近.研究(Park et al., 2014; Ogulei et al., 2005)表明Ni和V浓度存在较强相关性时, 共同作为重油燃烧的示踪, 且在有港口的区域重油燃烧一般来源于船舶(庄马展, 2016).
3.3 主成分分析利用主成分分析法对4—5月深圳城市PM2.5中金属来源进行解析(表 2), 选取特征因子值为0.6, 提取出3个因子, 方差贡献率达到82.9%.因子1包含了Ti、Cr、Mn、Fe和BC, 由于在珠三角地区城市BC的主要来源是机动车(Hagler et al., 2006; Cao et al., 2004), Ti主要为扬尘源(杨怀金等, 2016), 因此, 因子1代表了交通/扬尘源, 包括尾气和道路尘, 方差贡献达到54.3%.Cu、Zn和Pb在因子2中具有较高的载荷, 说明此源具有工业废气的特征(Zou et al., 2017).此因子中K也存在一定的载荷, 且当K和Pb在同一因子时, 显示出包括生物质燃烧在内的废物焚烧的特征(Yuan et al., 2006), 因此, 因子2主要代表工业排放和废物燃烧(Li et al., 2017; 庄马展, 2016), 方差贡献为19.8%.虽然K常被认为是生物质燃烧的示踪物, 但由于深圳潮湿的春季受生物质燃烧影响较小(Li et al., 2018), 因此, K在因子1中比在因子2中具有更高的载荷.因子3中Ni和V载荷极高, 为重油燃烧排放微量元素(And et al., 2002).PMF模型对深圳PM2.5主要来源识别研究中同样确定了V为重油燃烧排放(黄晓锋等, 2014), 且解释这类排放与船舶密切相关.在珠三角地区只有远洋船舶通常使用重油, 而船舶活动主要发生在南海(Zou et al., 2017).深圳4—5月受来自南部季风的影响, 造成了船舶排放污染.因此, 因子3指示为船舶排放, 方差贡献占到8.8%.
表 2(Table 2)
| 表 2 观测期间PM2.5中金属污染来源主成分分析 Table 2 Principal component analysis of metal pollution sources in PM2.5 during the observation period | ||||||||||||||||||||||||||||||||||||||||||||||||||||
表 2 观测期间PM2.5中金属污染来源主成分分析 Table 2 Principal component analysis of metal pollution sources in PM2.5 during the observation period
| ||||||||||||||||||||||||||||||||||||||||||||||||||||
4 结论(Conclusions)1) Xact-625型环境空气多金属在线监测仪与离线分析方法比对结果显示, 10种金属(Ti、V、Ni、Cu、Zn、Pb、K、Mn、Fe、Cr)比对结果较好, R2≥0.75.
2) 2017年4—5月深圳城市大气PM2.5平均浓度24.8 μg · m-3, Xact-625监测获得的金属元素总浓度为0.72 μg · m-3占比2.9%, 浓度最高的3种元素为K、Fe、Zn, 占测量的金属总质量的88.8%.随着金属污染加大, Zn比重增长80%, 说明金属污染加重与Zn所代表的一次人为污染关系密切.
3) Mn、Fe、Cu、Zn、Ti日变化趋势总体呈日间高、夜晚低的特征, 表明与本地人为源排放密切相关; K、Pb、Cr浓度日变化无明显波动, 主要受区域传输影响; Ni与V日变化趋势一致, 具有共同的船舶排放来源.
4) 主成分因子分析结果表明, 观测期间PM2.5中金属污染源主要有交通/扬尘源、工业排放/废物燃烧、船舶污染, 方差贡献依次为54.3%、19.8%和8.8%.
参考文献
| And J C C, Watson J G. 2002. Review of PM2.5 and PM10 apportionment for fossil fuel combustion and other sources by the chemical mass balance receptor model[J]. Energy & Fuels, 16(2): 222–260. |
| Balasubramanian R, Qian W B. 2004. Characterization and source identification of airborne trace metals in Singapore[J]. Journal of Environmental Monitoring, 6(10): 813–818.DOI:10.1039/b407523d |
| Bullock K R, Norris D G A, Mcdow S R, et al. 2008. Evaluation of the CMB and PMF models using organic molecular markers in fine particulate matter collected during the Pittsburgh Air Quality Study[J]. Atmospheric Environment, 42(29): 6897–6904. |
| Cao J J, Lee S C, Ho K F, et al. 2004. Spatial and seasonal variations of atmospheric organic carbon and elemental carbon in Pearl River Delta Region, China[J]. Atmospheric Environment, 38: 4447–4456. |
| Dall′Osto M, Querol X, Amato F, et al. 2013. Hourly elemental concentrations in PM2.5 aerosols sampled simultaneously at urban background and road site during SAPUSS-diurnal variations and PMF receptor modelling[J]. Atmospheric Chemistry & Physics, 13(8): 4375–4392. |
| 方凤满. 2010. 中国大气颗粒物中金属元素环境地球化学行为研究[J]. 生态环境学报, 2010, 19(4): 979–984.DOI:10.3969/j.issn.1674-5906.2010.04.042 |
| Furger M, Minguillón M C, Yadav V, et al. 2017. Elemental composition of ambient aerosols measured with high temporal resolution using an online XRF spectrometer[J]. Atmospheric Measurement Techniques, 10(6): 1–26. |
| Gietl J K, Lawrence R, Thorpe A J, et al. 2010. Identification of brake wear particles and derivation of a quantitative tracer for brake dust at a major road[J]. Atmospheric Environment, 44(2): 141–146.DOI:10.1016/j.atmosenv.2009.10.016 |
| Hagler G S, Bergin M H, Salmon L G, et al. 2006. Source areas and chemical composition of fine particulate matter in the Pearl River Delta region of China[J]. Atmospheric Environment, 40: 3802–3815.DOI:10.1016/j.atmosenv.2006.02.032 |
| Haritash A K, Kaushik C P. 2007. Assessment of seasonal enrichment of heavy metals in respirable suspended particulate matter of a sub-urban Indian City[J]. Environmental Monitoring & Assessment, 128(1/3): 411–420. |
| 黄晓锋, 云慧, 宫照恒, 等. 2014. 深圳大气PM2.5来源解析与二次有机气溶胶估算[J]. 中国科学:地球科学, 2014, 44(4): 723–734. |
| Jeong C H, Wang J M, Evans G J. 2016. Source apportionment of urban particulate matter using hourly resolved trace metals, organics, and inorganic aerosol components[J]. Atmospheric Chemistry & Physics: 1–32. |
| Jeong J H, Shon Z H, Kang M, et al. 2017. Comparison of source apportionment of PM2.5, using receptor models in the main hub port city of East Asia:Busan[J]. Atmospheric Environment, 148: 115–127.DOI:10.1016/j.atmosenv.2016.10.055 |
| Li L, Tan Q, Zhang Y, et al. 2017. Characteristics and source apportionment of PM2.5 during persistent extreme haze events in Chengdu, southwest China[J]. Environmental Pollution, 230: 718–729. |
| Li H, Huang X, Cao L, et al. 2018. Development of an on-line measurement system for water-soluble organic matter in PM 2.5 and its application in China[J]. Journal of Environmental Sciences, 69: 33–40.DOI:10.1016/j.jes.2017.03.038 |
| 李丽娟, 温彦平, 彭林, 等. 2014. 太原市采暖季PM2.5中元素特征及重金属健康风险评价[J]. 环境科学, 2014, 35(12): 4431–4438. |
| 刘佳, 翟崇治, 许丽萍, 等. 2015. 灰霾天气下重庆地区秋冬金属污染特征及来源分析[J]. 生态环境学报, 2015, 24(10): 1689–1694. |
| Ogulei D, Hopke P K, Zhou L, et al. 2005. Receptor modeling for multiple time resolved species:The Baltimore supersite[J]. Atmospheric Environment, 39(20): 3751–3762.DOI:10.1016/j.atmosenv.2005.03.012 |
| Pancras J P, Ondov J M, Poor N, et al. 2006. Identification of sources and estimation of emission profiles from highly time-resolved pollutant measurements in Tampa, FL[J]. Atmospheric Environment, 40(2): 467–481. |
| Pant P, Harrison R M. 2012. Critical review of receptor modelling for particulate matter:A case study of India[J]. Atmospheric Environment, 49(3): 1–12. |
| Park S, Cho S, Jo M, et al. 2014. Field evaluation of a near-real time elemental monitor and identification of element sources observed at an air monitoring supersite in Korea[J]. Atmospheric Pollution Research, 5(1): 119–128.DOI:10.5094/APR.2014.015 |
| Pope C A, Dockery D W. 2006. Health effects of fine particulate air pollution: lines that connect[J]. Journal of the Air & Waste Management Association, 56(6): 709–742. |
| 齐冰, 杜荣光, 于之锋, 等. 2015. 杭州地区大气细颗粒物浓度变化特征分析[J]. 环境化学, 2015, 34(1): 77–82. |
| Richard A, Gianini M F D, Mohr C, et al. 2011. Source apportionment of size and time resolved trace elements and organic aerosols from an urban courtyard site in Switzerland[J]. Atmospheric Chemistry & Physics, 11(17): 8945–8963. |
| Samet J M, Dominici F, Curriero F C, et al. 2000. Fine particulate air pollution and mortality in 20 U.S.cites, 1987-1994[J]. The New England Journal of Medicine, 343(24): 1742–1749.DOI:10.1056/NEJM200012143432401 |
| 谭吉华, 段菁春. 2013. 中国大气颗粒物重金属污染、来源及控制建议[J]. 中国科学院大学学报, 2013, 30(2): 145–155. |
| Tremper A H, Font A, Priestman M, et al. 2017. Field and laboratory evaluation of a high time resolution x-ray fluorescence instrument for determining the elemental composition of ambient aerosols[J]. Atmospheric Measurement Techniques, 11(6): 3541–3557. |
| USEPA (United States Environmental Protection Agency).1990.The clean air act amendments of 1990 list of hazardous air pollutants [OL].2017-12-15, http://www.epa.gov/ttnatw01/orig189 |
| 王晓浩, 赵倩彪, 崔虎雄. 2015. 基于在线监测的上海郊区冬季PM2.5来源解析[J]. 南京大学学报(自然科学), 2015, 51(3): 517–523. |
| Watson J G. 2002. Visibility:science and regulation[J]. Journal of the Air & Waste Management Association, 52(6): 628–713. |
| 谢华林, 张萍, 贺惠, 等. 2002. 大气颗粒物中重金属元素在不同粒径上的形态分布[J]. 环境工程, 2002, 20(6): 55–57.DOI:10.3969/j.issn.1000-8942.2002.06.018 |
| 许栩楠, 曾立民, 张远航, 等. 2016. 北京市怀柔区冬季大气重金属污染状况分析[J]. 环境化学, 2016, 35(12): 2460–2468.DOI:10.7524/j.issn.0254-6108.2016.12.2016042905 |
| 杨怀金, 杨德容, 叶芝祥, 等. 2016. 成都西南郊区春季PM2.5中元素特征及重金属潜在生态风险评价[J]. 环境科学, 2016, 37(12): 4490–4503. |
| Yuan Z, Lau A K H, Zhang H, et al. 2006. Identification and spatiotemporal variations of dominant PM10, sources over Hong Kong[J]. Atmospheric Environment, 40(10): 1803–1815.DOI:10.1016/j.atmosenv.2005.11.030 |
| 周雪明, 郑乃嘉, 李英红, 等. 2017. 2011—2012北京大气PM2.5中重金属的污染特征与来源分析[J]. 环境科学, 2017, 38(10): 4054–4060. |
| 庄马展. 2016. 厦门大气PM2.5中元素特征及重金属健康风险评价[J]. 环境化学, 2016, 35(8): 1723–1732. |
| Zou B B, Huang X F, Zhang B, et al. 2017. Source apportionment of PM2.5, pollution in an industrial city in southern China[J]. Atmospheric Pollution Research, 8(6): 1193–1202.DOI:10.1016/j.apr.2017.05.001 |
