 ,1, Hanshuang Chen21School of Mathematics and Physics,
 2School of Physics and Optoelectronics and Engineering,
Received:2021-06-18Revised:2021-08-10Accepted:2021-08-11Online:2021-09-14

Abstract
KeywordsЃК
PDF (633KB)MetadataMetricsRelated articlesExportEndNote|Ris|BibtexFavorite
Cite this article
Chuansheng Shen, Hanshuang Chen. The interplay of diffusion and heterogeneity in nucleation of the networked Ising model. Communications in Theoretical Physics, 2021, 73(11): 115601- doi:10.1088/1572-9494/ac1c68
1. Introduction
Nucleation is a fluctuation-driven process from the decay of a metastable state to the formation of either a new thermodynamic phase or a new structure via self-assembly or self-organization [1]. Thus it is extremely slow but has a potentially widespread impact. Many important and obvious phenomena in nature and society, including (but not limited to) crystallization [2, 3], fractures [4, 5], glass formation [6], protein folding [7], etc are inherently associated with nucleation. In the last few decades, our understanding of nucleation has been dominated by the classical nucleation theory (CNT), which has been applied to many regular lattices in Euclidean space. For instance, in two-dimensional lattices, Allen et al [8] discovered that the nucleation rate shows a non-monotonic feature selection for the shear rate. Sear [9] found that a single impurity may considerably enhance the nucleation rate. Page and Sear [10] reported that due to the existence of a pore, the system undergoes two-stage nucleation, and the overall nucleation rate reaches a maximum level at an intermediate pore size. Concerning three-dimensional lattices, the nucleation pathway of the Ising model has been studied by Sear and Pan [11, 12]. Moreover, the validity of CNT has been tested in other Euclidean space [13–19].Since many real systems can be properly described by complex networks [20–22], such as acquaintance networks, traffic networks, protein interaction networks, gene regulatory networks and so on, it is thus interesting to explore nucleation processes in complex networks. Recently, we studied the nucleation dynamics of the Ising model in scale-free (SF) networks [23], in which we found that nucleation starts from nodes with lower degrees, and the nucleation rate decreases exponentially with network size. We subsequently compared and demonstrated the distinct features of nucleation pathways between degree-homogeneous and degree-heterogeneous networks [24]. Furthermore, we found that, as the network modularity worsens, the nucleation undergoes a transition from a two-step to one-step process [25]. Interestingly, the nucleation rate shows a nonmonotonic dependence on the modularity. More recently, we have studied the heterogeneous nucleation of the Ising model on complex networks and found that the nucleation rate shows resonance-like behavior with the motion bias of impurities [26].
However, in our previous work, spins are considered to be fixed at every node. In fact, activity is ubiquitous in real-world scenarios, and may drastically influence the dynamical evolution, such as promoting synchronization [27–30], enhancing signal response [31], affecting the epidemic threshold [32], and tuning biodiversity [33]. All in all, active matter systems have been of great interest to physicists due to the ability to capture rich phenomenology from bacterial ratchets [34–38] to self-propelled clusters [39–41]. Especially, Solon and Tailleur employed an active Ising lattice model to show that, flocking transition is a a standard liquid-gas transition in the canonical ensemble with an infinite critical density [42], and at the phase diagram in the density-velocity parameter plane there exists a critical point at zero velocity which belongs to the Ising universality class [43]. Motivated by this, one may ask: how would diffusion influence the nucleation rate and pathway of the Ising model on small-world networks?
In the present work, we apply the forward flux sampling (FFS) [44] method to complex networks, and employ the diffusing Ising model to study the nucleation rate and pathways. The Ising model is a paradigm for many phenomena in statistical physics and has been widely used to study the nucleation process, and has even become the canonical description for the analysis of nucleation. By analyzing the effects of diffusion on the nucleation rate for different network topologies, we find that, for regular and small world networks, the nucleation rate decreases as diffusion probability increases, but for random networks, the nucleation rate increases with the diffusion probability increasing. Interestingly, the nucleation rate of the diffusing Ising model shows a nonmonotonic dependence on rewiring probabilities. We identify the critical nucleus for different topology networks with and without diffusion, and demonstrate the distinct features of nucleating clusters along the pathways to reveal the underlying mechanism for such a nontrivial phenomenon.
2. Model and method
2.1. The nonequilibrium diffusing Ising model
We consider a variant of the Ising model on complex networks consisting of N nodes, where each node carries a spin variable si that can be +1 (up), or −1 (down), and each spin can randomly diffuse between the nearest-neighboring nodes. The Hamiltonian of the system is given byThe dynamics of our model is consisted of two elementary steps: spin-flip and spin diffusion. More specifically, in each time step, we attempt to perform the following two types of dynamics. (i) Spin-flip: we randomly chose a node and attempt to flip its spin according to the Metropolis acceptance probability $\min (1,{{\rm{e}}}^{-\beta {\rm{\Delta }}E})$ [45], where β = 1/(kBT) with the Boltzmann's constant kB and the temperature T, and ΔE is the energy change due to the flipping process; (ii) Spin diffusion: after the spin of a node i has been attempted to be flipped, we then randomly choose one of the nearest neighboring nodes j and attempt to exchange the spin si with sj according to the diffusion probability D, hereinafter we call it activity. Notice that D ∈ [0, 1], and D = 0, it recovers to the original networked Ising model.
In the absence of an external field, h = 0, as T increases the system undergoes a second-order phase transition from an ordered state to a disordered one at the critical temperature TC. For T < TC, the system prefers to stay at either of two states: one state with a positive magnetization, in which most spins are pointing up, and the other state with a negative magnetization. For a small h and below TC, one of these two states will become metastable, and if initiated predominantly in this metastable state, the system will remain for a significantly long time before it decays to the thermodynamically stable state through nucleation and growth processes. We are interested in the influence of activity on this nucleation rate and pathways.
2.2. FFS method on complex networks
Since nucleation is an activated process that occurs extremely slowly, brute-force simulations are quite expensive and hence computationally prohibited. To overcome this difficulty, we will extend the FFS method to complex networks. This method has been successfully used to calculate rate constants and transition paths for rare events in equilibrium and non-equilibrium systems [8–10, 44, 46, 47]. The main idea is as follows: to achieve high efficiency in the simulation and capture the main features of the nucleation process, the FFS method uses a series of interfaces λi in phase space between the initial state A(λ0) and the final state B(λM) to force the system from A to B in a ratchet-like manner. The transition rate R from A to B is calculated byThe main steps are summarized as follows.
Step 1. Choice of an order parameter. Here, we select the order parameter λ as the total number of up spins in the network, which can identify the initial state (almost down spins) A and the final state (almost up spins) B, if λ < λ0 the system will be in A and if λ > λM, the system in B, here λ0 = 3 for regular ring networks, λ0 = 80 for other networks, and λM = 800 for all networks are used.
Step 2. Definition of the nonintersecting interfaces. Between A and B, we define a series of nonintersecting interfaces λi satisfying λ0 < λ1 ⋯ < λi−1 < λi < λi+1 ⋯ < λM, such that any path from A to B must cross each interface without reaching λi+1 before λi. In addition, an appropriate spacing between adjacent interfaces should also be defined, here this number is fixed at 3 up spins, but the computed results do not depend on this spacing.
Step 3. Estimation of the initial flux. We first run a long-time simulation which gives an estimate of the initial flux ${\bar{{\rm{\Phi }}}}_{A,0}$ escaping from the basin of A and save the configurations which successfully crossing the interface λ0.
Step 4. Calculation of conditional probability. We randomly choose a configuration from the collection at λ0 and use it to initiate a trial run which is continued until it either reaches λ1 or returns to λ0. If λ1 is reached, the configuration of the end point of the trial run is stored. This process is repeated. The fraction of successful trial runs gives an estimate of the probability $P\left({\lambda }_{1}| {\lambda }_{0}\right)$ of reaching λ1 without going back into A. The rest can be done in the same manner, step by step, we can obtain each $P\left({\lambda }_{i+1}| {\lambda }_{i}\right)$, until λM is reached.
Step 5. Computation of the nucleation rate. According to equation (
3. Results and discussions
We perform Monte Carlo simulations and use the FFS method to study nucleation rate and pathways of the non-equilibrium phase transition from the metastable spin state. Specifically, we employ the Watts-Strogatz (WS) network model [49] with rewiring probability p ∈ [0, 1]. We fix network size N = 1000 and average node degree ⟨k⟩ = ∑iki/N = 6, set a low temperature (T < TC in unit of J/kB) and a low external field (h < 0.5), and start from an initial state with s = − 1 for most of spins. We perform 1000 trials per interface for each FFS sampling, from which at least 200 configurations are saved in order to investigate the statistical properties along the nucleation pathway. The results are obtained by averaging over 50 independent FFS samplings and 20 different network realizations.3.1. Nucleation rate
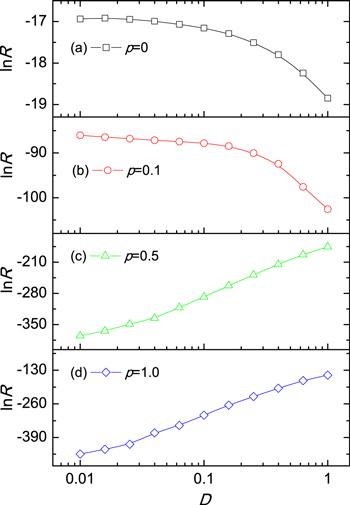
First of all, we fix the rewiring probabilities p to study how the transition rate R depends on diffusion rate D. Figure 1 shows the logarithm of nucleation rate $\mathrm{ln}R$ (in units of MCstep−1spin−1) as a function of D for different p. One can observe that, for small values of p, say p = 0 and 0.1, $\mathrm{ln}R$ decreases with increasing D, as shown in figures 1(a) and 1(b), while for big values of p, say p = 0.5 and 1, $\mathrm{ln}R$ increases with the increment of D, as shown in figures 1 (c) and 1 (d). Furthermore, the influences of diffusion on the nucleation rate for other parameters, such as T and h, have also been investigated; the qualitative results are the same and not shown here. Since that for p = 0 one recovers to regular ring network, small values of p to small world networks, and large p to random networks, one thus concludes that for regular and small world networks, the diffusion is against nucleation, while for random networks the diffusion is in favor of nucleation. Therefore, one may naturally ask: how does the crossover happens when p changes from 0 to 1, and what is the physical significance of such a crossover phenomenon?Figure 1.
 New window|Download| PPT slide
Figure 1.The dependence of the logarithm of nucleation rate $\mathrm{ln}R$ on diffusion rate D for different rewiring probabilities p. (a) p = 0 (regular ring network) at T = 1.5 and h = 0.1. (b) p = 0.1 (small world network) at T = 2 and h = 0.1. (c) p = 0.5 (random network) at T = 2 and h = 0.2, and (d) p = 1 (completely random network) at T = 2 and h = 0.2. Other parameters are N = 1000 and ⟨k⟩ = 6.
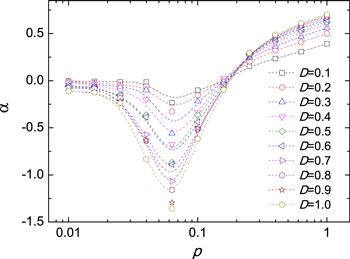
To quantitatively measure the difference of $\mathrm{ln}R$ for different D, we introduce a parameter α as a relative change of $\mathrm{ln}R$, defined as
Figure 2.
 New window|Download| PPT slide
Figure 2.The dependence of α on the rewiring probability p for different diffusion rates D. The parameters are N = 1000, ⟨k⟩ = 6, T = 2 and h = 0.2.
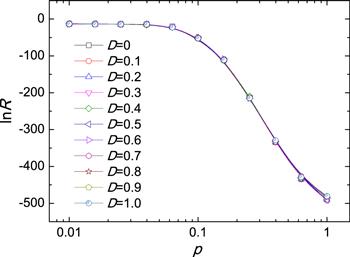
However, it is worth noting that, such a nontrivial dependence of nucleation rate on p does not occur when the microdynamics of diffusion satisfies the detailed balance. To the end, we adopt the Metropolis dynamics to the diffusion, with acceptance probability $\min (1,{{\rm{e}}}^{-\beta {\rm{\Delta }}E})$ [45] to exchange nearest-neighboring spins. As shown in figure 3, $\mathrm{ln}R$ decreases monotonically with p. For different D, all curves collapse implying that the equilibrium diffusion does not affect the nucleation rate.
Figure 3.
 New window|Download| PPT slide
Figure 3.The dependence of the logarithm of nucleation rate $\mathrm{ln}R$ on the rewiring probability p for Metropolis diffusion with different D. The parameters are the same as figure
3.2. Nucleation pathway
To reveal the underlying mechanism of the nontrivial dependence of α on the different network topologies, we save a sufficiently large number of configurations generated by FFS and then perform detailed analysis on the nucleating clusters, which can characterize the evolution of the model in the nucleation process. According to the CNT, a critical size λc of nucleus in the nucleation process exists, and once it is reached, the system will rapidly grow to the new thermodynamic phase. In this regard, the difference of the nucleation rate of the diffusion Ising model for different network topologies may be relevant to λc. In the present work, we determine λc by computing the committor probability PB, which is the probability of reaching the thermodynamic stable state before returning to the metastable state. As commonly reported in the literature [12, 18], the critical nucleus appears at PB(λc) = 0.5. Table 1 gives the values of λc for different networks with and without diffusion. Obviously, for p < 0.17, λc with diffusion is larger than that without diffusion, suggesting that the formation of critical nucleus with diffusion is more difficult than that without diffusion; while for p > 0.17, λc in the diffusion models are less than those in the absence of diffusion, indicating that the formation of critical nucleus in the diffusing model is easier than that without diffusion. For p = 0.17, λc in both models (with and without diffusion) are almost the same. This picture is consistent with the results of figure 2.Table 1.
Table 1.Size λc of critical nucleus of the Ising model on WS networks with different rewiring probabilities p and BASF networks. Other parameters are N = 1000 and ⟨k⟩ = 6.
| Rewiring | Critical nucleus λc | Temperature | Field | |
|---|---|---|---|---|
| probability p | D = 1 | D = 0 | T | h |
| 0 | 20 | 11 | 1.5 | 0.1 |
| 0.01 | 53 | 17 | 1.5 | 0.1 |
| 0.025 | 393 | 171 | 1.5 | 0.1 |
| 0.063 | 384 | 274 | 2 | 0.2 |
| 0.1 | 422 | 358 | 2 | 0.2 |
| 0.17 | 433 | 433 | 2 | 0.2 |
| 0.25 | 444 | 458 | 2 | 0.2 |
| 0.63 | 454 | 490 | 2 | 0.2 |
| 1 | 457 | 499 | 2 | 0.2 |
| BASF | 471 | 516 | 2 | 0.2 |
New window|CSV
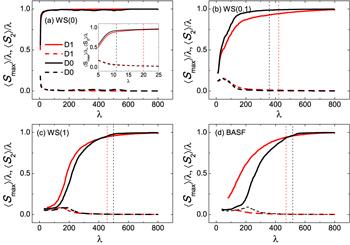
Let us now consider how the largest and second-largest nucleating clusters evolve in the nucleation process in the active and inactive model, which can shed more light on the system's behavior, as shown in figure 4. On the one hand, the average relative size of the largest nucleating cluster $\langle {S}_{\max }/\lambda \rangle $ (solid lines) is always far larger than that of the secondly largest cluster ⟨S2/λ⟩ (dashed lines), which means that nucleation is dominated by the largest nucleating cluster. On the other hand, for regular and small world networks, $\langle {S}_{\max }/\lambda \rangle $ in the active model is less than that without activity, as indicated by the solid red lines and black lines respectively in figures 4(a), (b), hinting that the largest nucleating cluster in the former is more difficult to grow up than that in the latter. This is due to the fact that regular networks and small world networks have a high clustering coefficient, and the activity of spins breaks the nucleating cluster and thus suppresses the formation of nucleus. While for random networks, the opposite happens, as shown in figure 4(c). This is because that random networks have lower clustering coefficient, small diameter and a dominant nucleating cluster [24], such that activity can not destroy the nucleating cluster. On the contrary, activity drives nodes inside the dominant cluster to exchange with those outside, thereby accelerating the growth of the largest nucleating cluster by decaying the new-entrance nodes one by one. As regards Barabási-Albert scale-free (BASF) networks, the degree distribution follows power-law. Consequently, there exist many hubs with intermediate degrees and a few hubs with large degrees. Usually, many leaf nodes are connected to relatively small hubs, which are further connected to large hubs. Note that nucleation tends to begin with leaf nodes [23], so without activity, many isolated small clusters grow separately which then suddenly merge together to form the critical nucleus [24]. Whereas in the active model, these leaf nodes prefer to move to their neighboring hub nodes. As a consequence, those hub nodes that connected with leaf nodes are more easily to turn into new phase than those without activity, and thus form a more larger cluster to which relatively small clusters are attached gradually to become the critical nucleus, as shown in figure 4(d).
Figure 4.
 New window|Download| PPT slide
Figure 4.Average relative size of the largest $\langle {S}_{\max }/\lambda \rangle $ (solid lines) and second-largest ⟨S2/λ⟩ (dashed lines) nucleating clusters as a function of the order parameter λ for different topology networks with and without activity. ⟨ · ⟩ represents averaging over the ensemble at each interface. (a) Regular ring network WS(0), inset: same plot for the largest and second largest nucleating clusters zoomed into small values of λ at the very early nucleation stage. (b) Small world network WS(0.1). (c) Random network WS(1), and (d) BASF network. The color coding is the same for the first- and second-largest clusters with respect to the active and inactive model. Vertical dashed lines mark the locations of critical nucleus with and without diffusion. Other parameters are the same as figure
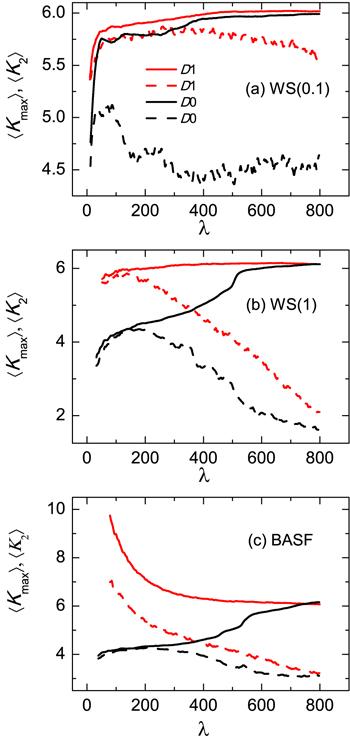
Figure 5 displays the behavior of the average degree of nodes inside the largest $\langle {K}_{\max }\rangle $ (solid lines) and second largest ⟨K2⟩ (dashed lines) nucleating clusters as a function of order parameter λ. It is clear that, without activity, $\langle {K}_{\max }\rangle $ for different networks, always increase from lower values, and gradually approaches the average node degree ⟨k⟩ of the network, which means that nucleation starts from nodes with small degree. However, activity plays different roles in the nucleation pathways for different network topologies. For a small world network, $\langle {K}_{\max }\rangle $ also increases from a lower value (red solid line), and close to ⟨k⟩, but it grows faster than that without activity. It is worth noting that ⟨K2⟩ is almost run in parallel with $\langle {K}_{\max }\rangle $ up to a critical nucleus coming into being. Beyond the critical nucleus ⟨K2⟩ decreases gradually, and $\langle {K}_{\max }\rangle $ increases, as indicated by the red line in figure 5(a). This implies that hub nodes are separated into different nucleating clusters by activity, thereby inhibiting the growth of nucleus. For random network, nodes with high degrees that are connected with the largest nucleus are more likely to be pulled into the nucleating cluster, this is because that the probability of these nodes being moved is larger than other lower degree nodes. As a result, a jump of $\langle {K}_{\max }\rangle $ in the active model is observed at first, as shown in figure 5(b), and then it approaches to ⟨k⟩. Meanwhile, ⟨K2⟩ decreases rapidly, which accelerates the growth of the largest nucleating cluster. For BASF network, since hub nodes are often connected with many small degree nodes, nucleation thus begins with small degree nodes and almost together with hub nodes being connected with new phase nodes through activity. Therefore, it turns out that, at the very beginning of nucleation, both $\langle {K}_{\max }\rangle $ and ⟨K2⟩ are larger than ⟨k⟩, which is significantly different from the observation in the inactive case. Nevertheless, with proceeding of nucleation, $\langle {K}_{\max }\rangle $ decreases rapidly and approaches to ⟨k⟩ eventually, as shown in figure 5(c).
Figure 5.
 New window|Download| PPT slide
Figure 5.Average degree of nodes inside the largest $\langle {K}_{\max }\rangle $ (solid lines) and second-largest ⟨K2⟩ (dashed lines) nucleating clusters as a function of order parameter λ for different topology networks with and without activity. The color coding is the same for the first- and second-largest clusters with respect to the active and inactive case. ⟨ · ⟩ represents averaging over the ensemble at each interface. (a) Small world network WS(0.1), (b) Random network WS(1), and (c) BASF network. Other parameters are the same as figure
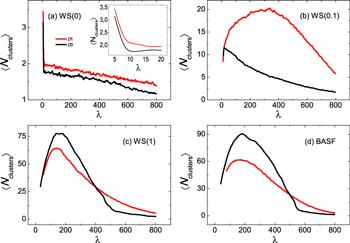
To better understand the different roles of activity in the nucleation process in more detail, in figure 6 we show the dependence of the average number of nucleating clusters ⟨Ncluster⟩ on order parameter λ for different network topologies. Except to regular circular networks, at the early stage of nucleation process, a large number of small nucleating clusters appear, and then this number decreases with the process of nucleation. While for regular circular networks, ⟨Ncluster⟩ decreases monotonically with λ, but at the early stage the number shows a sharp decrease. However, they exhibit various features in different networks with and without activity. To be specific, for regular networks, ⟨Ncluster⟩ in the active models are only slightly larger than those without activity, as indicated by the solid red line in figure 6(a). But for small world networks in figure 6(b), ⟨Ncluster⟩ in the active models is drastically increased since spins can more easily escape from the nucleating clusters through shortcuts. As expected, for both kinds of networks, activity always fosters the division of nucleating cluster: the larger D is, the faster breaking down can occur. This picture explains again the decrease of nucleation rate in figures 1(a)–(b). The scenarios of random and BASF networks, however, as shown in figures 6(c) and (d), are strikingly in contrast with the cases of regular and small world networks: ⟨Ncluster⟩ in the active models are less than those without activity up to the formation of critical nucleus. Without activity, the new phase clusters grow from nodes with lower degree and lead to a large number of separated nucleating clusters at the early nucleation stage [23]: nodes with new phase may be distant on the network and not be able to coalesce together. Due to the presence of activity, those leaf nodes with new phase would more likely to move to the nearest neighboring hub nodes and form the nucleus together. As a consequence, the average node degree of the largest and secondly largest nucleating clusters in the active model is significantly larger than that without activity, which shows fairly consistency with the picture of figures 5(b) and (c).
Figure 6.
 New window|Download| PPT slide
Figure 6.Average number of nucleating clusters ⟨Ncluster⟩ as a function of the order parameter λ for different topology networks with and without activity. ⟨ · ⟩ represents averaging over the ensemble at each interface. (a) Regular circular network WS(0), inset: same plot for the number of nucleating clusters zoomed into small values of λ at the very early nucleation process, (b) Small world network WS(0.1), (c) random network WS(1), and (d) BASF network. The color coding is the same for the number of nucleating clusters with respect to the active and inactive model. Other parameters are the same as in figure
The above results can be qualitatively understood in terms of the CNT, although nucleation of the active Ising model is involved in the nonequilibrium process. The CNT assumes that the probability of a nucleus forming is proportional to $\exp (-{\rm{\Delta }}{G}^{* }/{kT})$, where ΔG* is the free energy cost of the nucleus. In the present work, ΔG* may be written as ΔG*(λ) = − 2hλ + σλ, where the first part denotes the bulk energy loss of creating λ up spins which favor the growth of the nucleus, whereas the second part represents the interfacial energy gain, an opposing factor, resulting from the creation of new boundary links between up and down spins, and σ indicates the effective interfacial free energy, which mainly depends on the average number of boundary links that an up-spin node has. Therefore, the formation of a nucleus lies in the two competing factors: bulk term and interface term. For regular network, activity breaks the nucleating clusters and leads to the interfacial links increasing while not lowers the bulk energy loss. On the other hand, small-world network has similar local structure with regular network, and has only a small number of long-range links, thus activity also destroys the formation of the nucleus by separating the largest and secondly largest nucleating clusters, and thereby resulting in the decrease of bulk energy, which can be seen from figures 4(a) and (b). While for random and scale-free networks, the easier spins can move, the larger range spins can interact: spins can more easily search for other spins with whom they can collaborate, and enhance the bulk energy loss via coalescence, which is akin to self-organization, so that the formation of critical nucleus is favored by activity, and the larger activity is, the faster nucleation becomes. This picture is further validated by those results shown in the above figures.
4. Conclusions
In summary, we have studied the effects of nonequilibrium exchanges of spins on the nucleation of the Ising model on complex networks. By numerical and analytical methods, we demonstrate that the nonequilibrium activity plays a nontrivial role in the nucleation for different network topologies. For regular and small world networks, activity can decrease the nucleation rate and increase critical nucleus size, and thus destroys the formation of the largest nucleus and grows the number of nucleating clusters. Whereas in random and scale-free networks, activity promotes nucleation, such as elevating nucleation rate, decreasing critical nucleus size, fostering the formation of the largest nucleus and cutting down the number of nucleating clusters. Since a wide variety of real-world networks, such as social, biological, and technological networks, display substantial non-trivial topological features, and many dynamics in these networked systems are associated with nucleation, our findings may provide valuable insights into the dynamics of first-order phase transition and the processes of self-assembly or self-organization.Acknowledgments
This work is supported by the National Natural Science Foundation of China (Grants No. 11 975 025 and 11 875 069). C. S. was also funded by the Key Laboratory of Modeling, Simulation and Control of Complex Ecosystem in Dabie Mountains of Anhui Higher Education Institutes, and the International Joint Research Center of Simulation and Control for Population Ecology of Yangtze River in Anhui.Reference By original order
By published year
By cited within times
By Impact factor
[Cited within: 1]
DOI:10.1063/1.474721 [Cited within: 1]
DOI:10.1021/am9000858 [Cited within: 1]
DOI:10.1038/350039a0 [Cited within: 1]
DOI:10.1103/PhysRevLett.79.3202 [Cited within: 1]
DOI:10.1103/PhysRevE.57.5707 [Cited within: 1]
DOI:10.1073/pnas.92.24.10869 [Cited within: 1]
DOI:10.1063/1.2981052 [Cited within: 2]
DOI:10.1021/jp056377e [Cited within: 1]
DOI:10.1103/PhysRevLett.97.065701 [Cited within: 2]
DOI:10.1063/1.2992160 [Cited within: 1]
DOI:10.1021/jp0471249 [Cited within: 2]
DOI:10.1007/s100510050480 [Cited within: 1]
DOI:10.1063/1.479985
DOI:10.1063/1.482003
DOI:10.1103/PhysRevE.71.031601
DOI:10.1103/PhysRevLett.103.225703
DOI:10.1103/PhysRevE.81.030601 [Cited within: 1]
DOI:10.1103/PhysRevE.82.011603 [Cited within: 1]
DOI:10.1103/RevModPhys.74.47 [Cited within: 1]
DOI:10.1080/00018730110112519
DOI:10.1137/S003614450342480 [Cited within: 1]
DOI:10.1103/PhysRevE.83.031110 [Cited within: 3]
DOI:10.1063/1.4790832 [Cited within: 3]
DOI:10.1103/PhysRevE.83.046124 [Cited within: 1]
DOI:10.1209/0295-5075/111/48005 [Cited within: 1]
[Cited within: 1]
DOI:10.1103/PhysRevLett.110.114101
DOI:10.1088/1478-3975/9/3/036006
DOI:10.1103/PhysRevE.87.032814 [Cited within: 1]
DOI:10.1209/0295-5075/102/38004 [Cited within: 1]
DOI:10.1038/nphys1944 [Cited within: 1]
DOI:10.1038/nature06095 [Cited within: 1]
DOI:10.1128/JB.01033-07 [Cited within: 1]
DOI:10.1209/0295-5075/86/60002
DOI:10.1103/PhysRevLett.102.048104
[Cited within: 1]
[Cited within: 1]
DOI:10.1103/PhysRevLett.108.268303
DOI:10.1126/science.1230020 [Cited within: 1]
DOI:10.1103/PhysRevLett.111.078101 [Cited within: 1]
DOI:10.1103/PhysRevE.92.042119 [Cited within: 1]
DOI:10.1103/PhysRevLett.94.018104 [Cited within: 2]
[Cited within: 2]
DOI:10.1063/1.2767625 [Cited within: 1]
DOI:10.1063/1.2140273 [Cited within: 1]
DOI:10.1088/0953-8984/21/46/463102 [Cited within: 1]
DOI:10.1038/30918 [Cited within: 1]
