HTML
--> --> -->We rely on the realistic effective interactions, obtained starting from the nuclear forces, to get a microscopic understanding of the nuclear structure. In this paper, we perform a theoretical study of the structure of neutron-rich calcium isotopes in the shell model with several realistic interactions. The Kuo-Brown interaction is a pioneering realistic interaction, proposed by Gerry Brown and Tom Kuo in 1966, derived from the reaction-matrix G method using the Hamada-Johnston nucleon-nucleon potential [11, 12]. Other nuclear potentials have been obtained later, such as the Argonne V18 potential [13], CD-Bonn potential [14], chiral effective field theory potential at next-to-next-to-next-to-leading-order (N3LO) [15], etc. Methods of renormalizing the nuclear potentials in the valence space have also been developed, such as the Lee-Suzuki method [16], unitary transformation method [17], etc. The model-independent low momentum nucleon-nucleon interaction
Previously, we have studied [19-22] the systematics of the shell model effective interactions, and the effects of monopole components on the shell evolution. We have found that the three-body (3bd) force is essential for a good description of the neutron-rich oxygen isotopes, and that it involves a central force and an increased spin-orbit splitting [23]. In the present study, we focus on neutron-rich calcium isotopes and use realistic interactions. It has been demonstrated that it is difficult to get a reasonable description of calcium isotopes without the inclusion of the 3bd force [5,7]. We also test whether a phenomenological way of including the three-body force can give reasonable results for the nuclear structure of calcium isotopes. The present paper is organized as follows. We introduce the basic concepts in Section 2. In Section 3, we provide the analysis of the effective interactions and perform shell model calculations. Conclusions are drawn in Section 4.
$ PH_{\rm eff}P |\Psi_{\alpha}> = E_{\alpha} P |\Psi_{\alpha}>, $  | (1) |
$ H_{\rm eff} = \sum^d_{i = 1} \varepsilon_i a^{\dagger}a + V_{\rm eff}, $  | (2) |
Many-body perturbation theory (MBPT) provides a diagrammatic way to calculate
The shell model effective interaction
The angular momentum averaged TBMEs can be expressed as
$ V(jj';T) = \frac{\sum_{J}(2J+1)V(jj'jj';JT)}{\sum_{J}(2J+1)}, $  | (3) |
$ \tilde{ \varepsilon}_{j} = \varepsilon_{j}+\sum_{j'}V_{jj'}\langle\psi|\widehat{N}_{j'}|\psi\rangle, $  | (4) |
The exact treatment of the three-body diagram is involved, and is often missing when calculating TBMEs. Thus, the use of realistic interactions usually leads to incorrect spectroscopy. A simple 3bd term, which introduces corrections to the monopole elements, was shown to be powerful, as seen in Ref. [28].
We also use the spin-tensor decomposition method [29-32] to decompose the effective interaction into the central force, tensor force and spin-orbit interaction.
To fit SPEs for the
| CD-Bonn | CD-Bonn' | KB | KB' | KB'' | KB3G | GXPF1B5 | |
| 1f7/2 | ?8.224 | ?7.787 | ?8.602 | ?8.033 | ?8.536 | ?8.6 | ?8.624 |
| 2p3/2 | ?5.415 | ?5.844 | ?4.552 | ?6.090 | ?5.832 | ?6.6 | ?5.679 |
| 2p1/2 | ?2.623 | ?4.173 | ?2.327 | ?4.419 | ?4.162 | ?4.6 | ?3.837 |
| 1f5/2 | 0.285 | ?5.211 | 0.168 | ?5.457 | ?1.689 | ?2.1 | ?1.883 |
Table1.SPEs used for the effective interactions. SPEs for the CD-Bonn, KB and KB'' interactions are fitted to 47, 49Ca, and SPEs for the CD-Bonn' and KB' interactions are fitted to 41Ca. All SPEs are shifted so as to reproduce the binding energy of 49Ca. The shifts are the absolute values of SPEs of the 1
The monopole matrix elements are shown in Fig. 1 central, spin-orbit, and tensor forces are also shown. As we focus on neutron-rich calcium isotopes, the neutron-neutron parts are shown only. KB3G is the KB interaction after monopole correction [35]. As a test, we also perform a monopole correction by replacing the KB' monopole elements with the GXPF1B5 elements, labeled KB''. SPEs for the KB'' interaction are fixed to 47, 49Ca, as in Table 1.
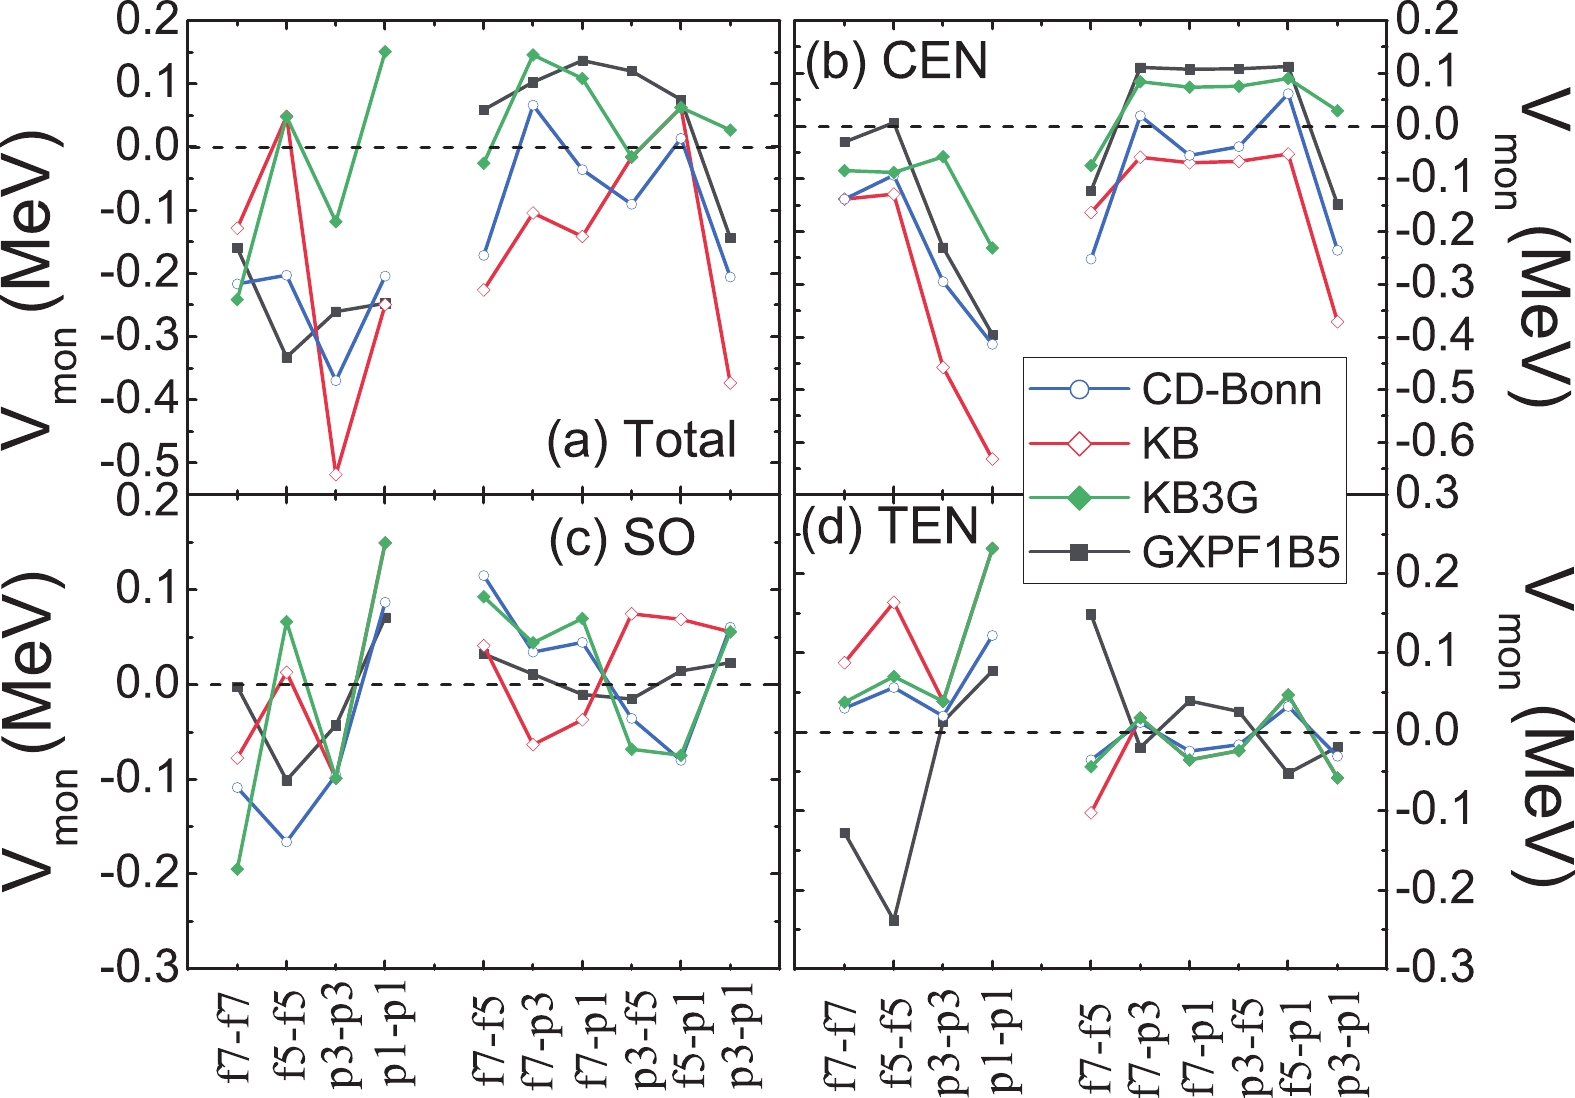 Figure1. (color online) Monopole terms of the effective interactions. Panel (a) shows the total interaction. Panels (b-d) show the central, spin-orbit and tensor forces, respectively.
In general, for neutron-neutron interactions, the monopole parts of the realistic interactions are more attractive than for the effective interactions adjusted to the experimental data. The discrepancies are mainly due to the central force, as seen in Fig. 1 (b). The interaction derived from the CD-Bonn potential contains more correlations than from the KB interaction, which includes core-polarization due to the expansion up to the second order of the perturbation [11,12]. Thus, the effective interactions from the CD-Bonn potential are closer to the empirical interactions. For the spin-orbit interactions in Fig. 1 (c), it is seen that the CD-Bonn interaction is close to KB3G. Tensor forces in realistic interactions are quite similar.
ESPEs of calcium isotopes are shown in Fig. 2. The empirical interactions are fitted to the experimental data, which may be seen as a phenomenological way of incorporating effectively the three-body forces and other many-body correlations. Thus, by comparing the results for the CD-Bonn or KB interactions with those for GXPF1B5 or KB3G, it may be seen whether the effects of the three-body force can be included as a simple adjustment of SPEs. It can be seen in Fig. 2 (c-d) that after fitting SPEs to 41Ca, the resulting shell gap at
 Figure2. (color online) Neutron ESPEs of calcium isotopes. The dashed line in panels (c) and (d) are for the effective interactions with single particle energies fitted to 41Ca, and the solid lines are for the same interactions but with single particle energies fitted to 47, 49Ca.
The adjustments of SPEs simply shift the EPSE curves, as seen in Eq. (4). After fitting of SPEs to 47, 49Ca, the shell structure around 48Ca becomes quite close to that for the empirical interactions. As listed in Table 1 , SPEs for the realistic interactions obtained by fitting to 47, 49Ca are close to the empirical SPEs. One can also note that the gap at
As can be seen from Eq. (4), the interplay between SPEs and the monopole interactions determines the shell structure. In Fig. 1, it is seen that although the derived CD-Bonn interaction from MBPT contains more correlations than the KB interaction, there are still systematic discrepancies from the empirical interactions, especially for the central force. Thus, ESPEs for the CD-Bonn and KB interactions differ in detail from the empirical ones. For example, with an increasing number of neutrons, the
The binding energies of calcium isotopes are shown in Fig. 3. As shown in Refs. [5,7] the binding energies of neutron-rich calcium isotopes, for realistic interactions without the 3bd force, increase almost linearly with the neutron number. This is also the case if SPEs are fitted to 41Ca, as shown for the CD-Bonn' and KB' interactions in Fig. 3. When SPEs are adjusted to the single particle states in 47, 49Ca, the binding energies for the CD-Bonn and KB interactions are close to the experimental data. Thus, 3bd correlations can be included as an adjustment of SPEs. All other interactions show a similar trend as the experimental data.
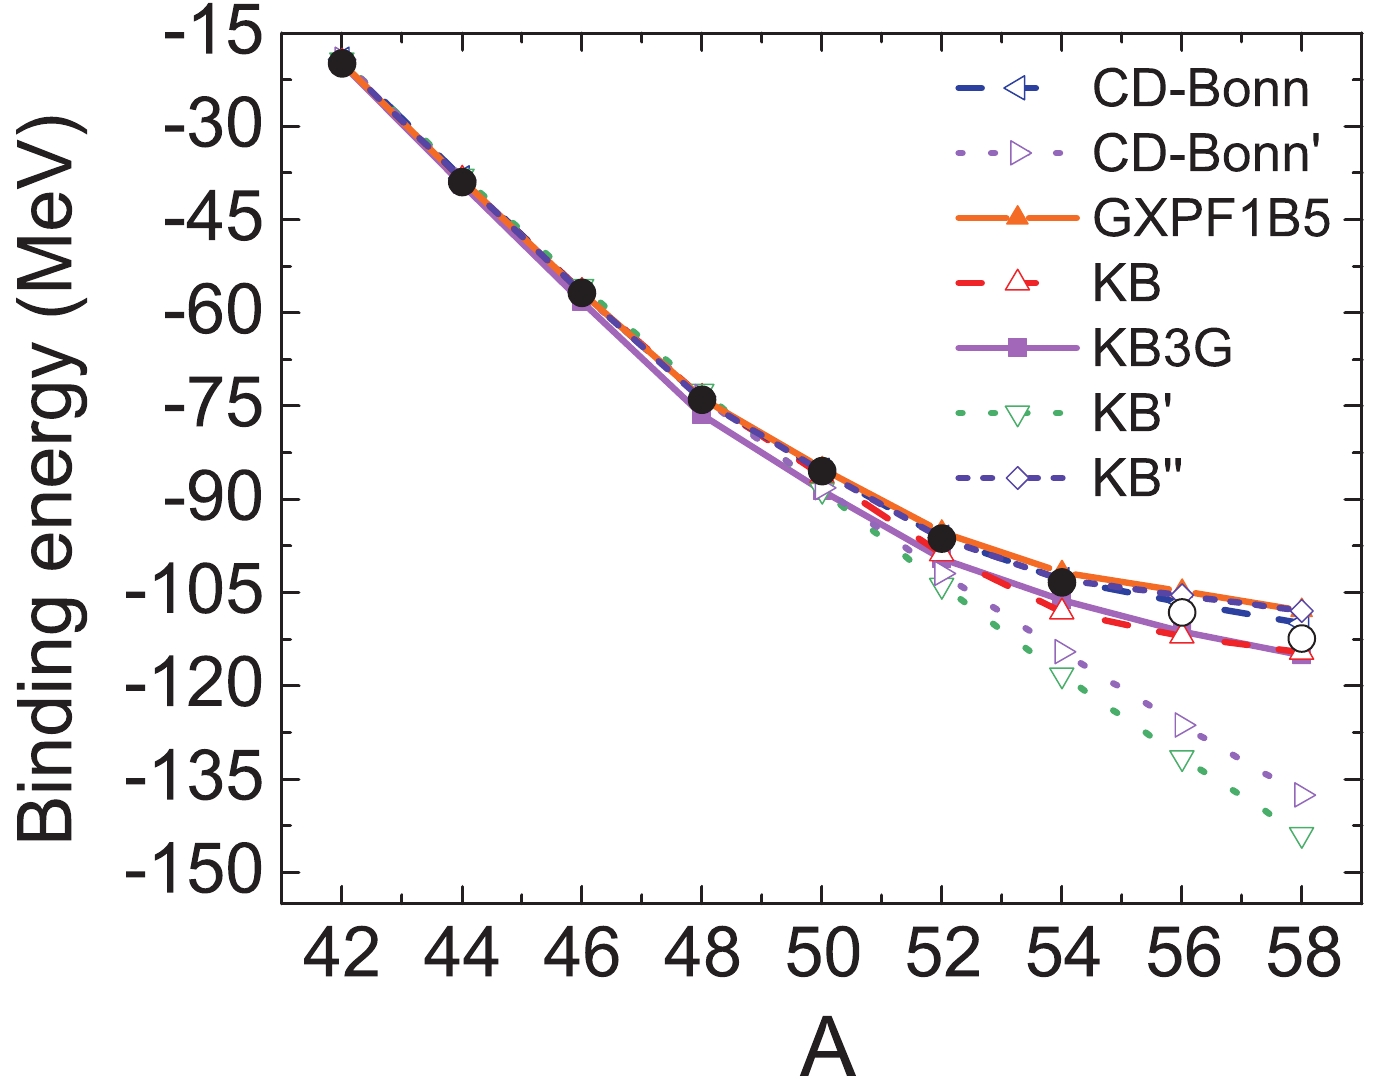 Figure3. (color online) Ground state energy of calcium isotopes relative to 40Ca for different interactions. The experimental values are given by solid points, and the extrapolated values are shown as open circles, taken from Ref. [38].
The two-neutron separation energy S
 Figure4. (color online) Same as Fig. 2, but for the two-neutron separation energy.
The excitation energy of the 2
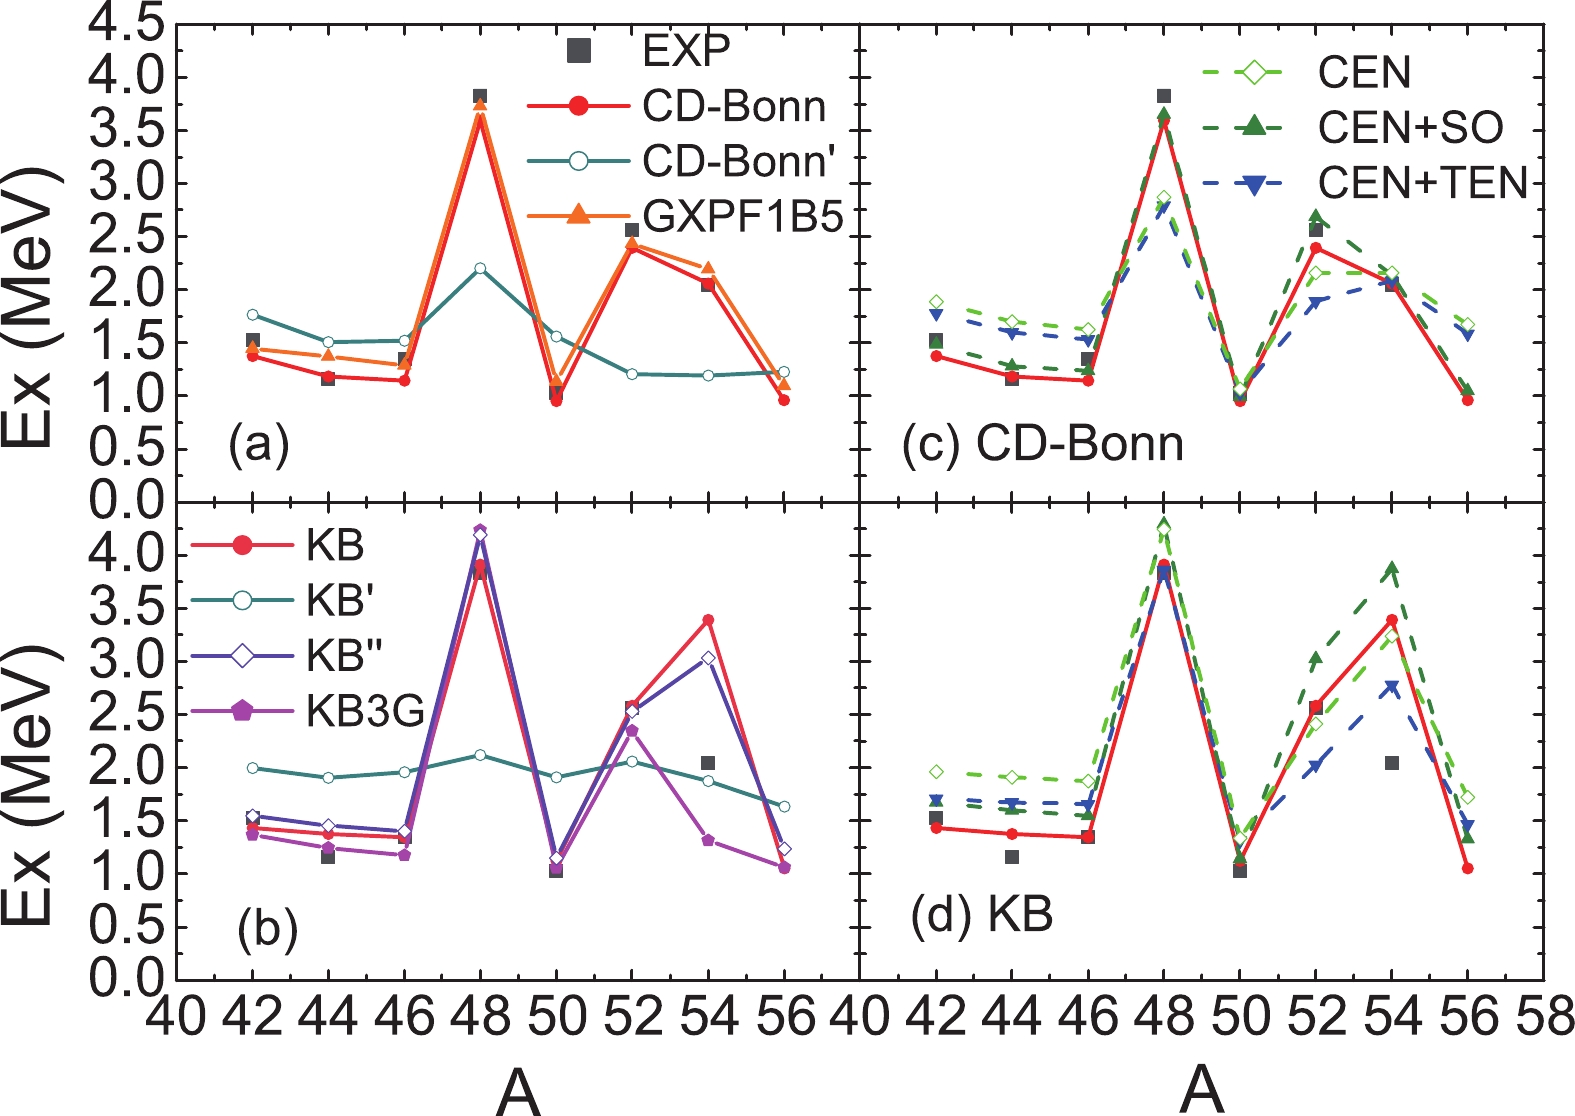 Figure5. (color online) The first 2+ excitation energy of calcium isotopes. The results for different effective interactions are shown in panels (a) and (b). The results for the central force (“CEN”), central plus spin-orbit force (“CEN+SO”), and central plus tensor force (“CEN+TEN”) for the CD-Bonn and KB interactions are shown in panels (c) and (d), respectively.
SPEs for the CD-Bonn' and KB' interactions are simply fitted to 41Ca, and it seems that many-body correlations can not be included in these SPEs. The results for the binding energy are poor, which is commonly the case for realistic interactions without the 3bd force. Furthermore, from the results for the 2
In Fig. 5 (c) and (d), we show the effect of the central, spin-orbit and tensor forces on the systematics of the 2
The excitation energies of bound states in 48Ca and 49Ca are shown in Figs. 6 and 7, respectively. In these figures, SPEs have been adjusted to the single particle states in 47, 49Ca. Thus, as seen in Fig. 7, the excitation energies of the
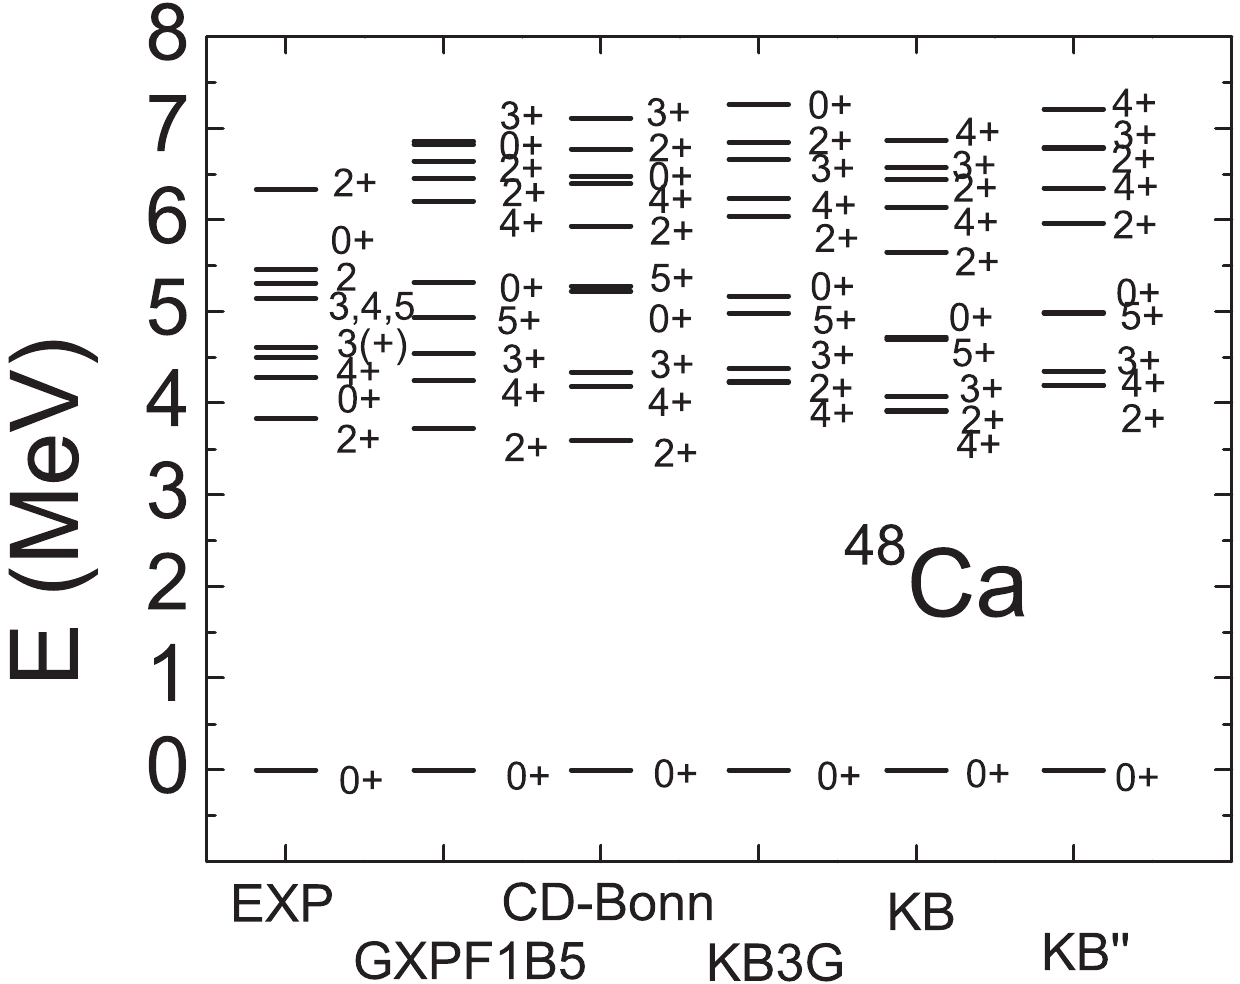 Figure6. Excitation energies of 48Ca compared to the experimental data [39].
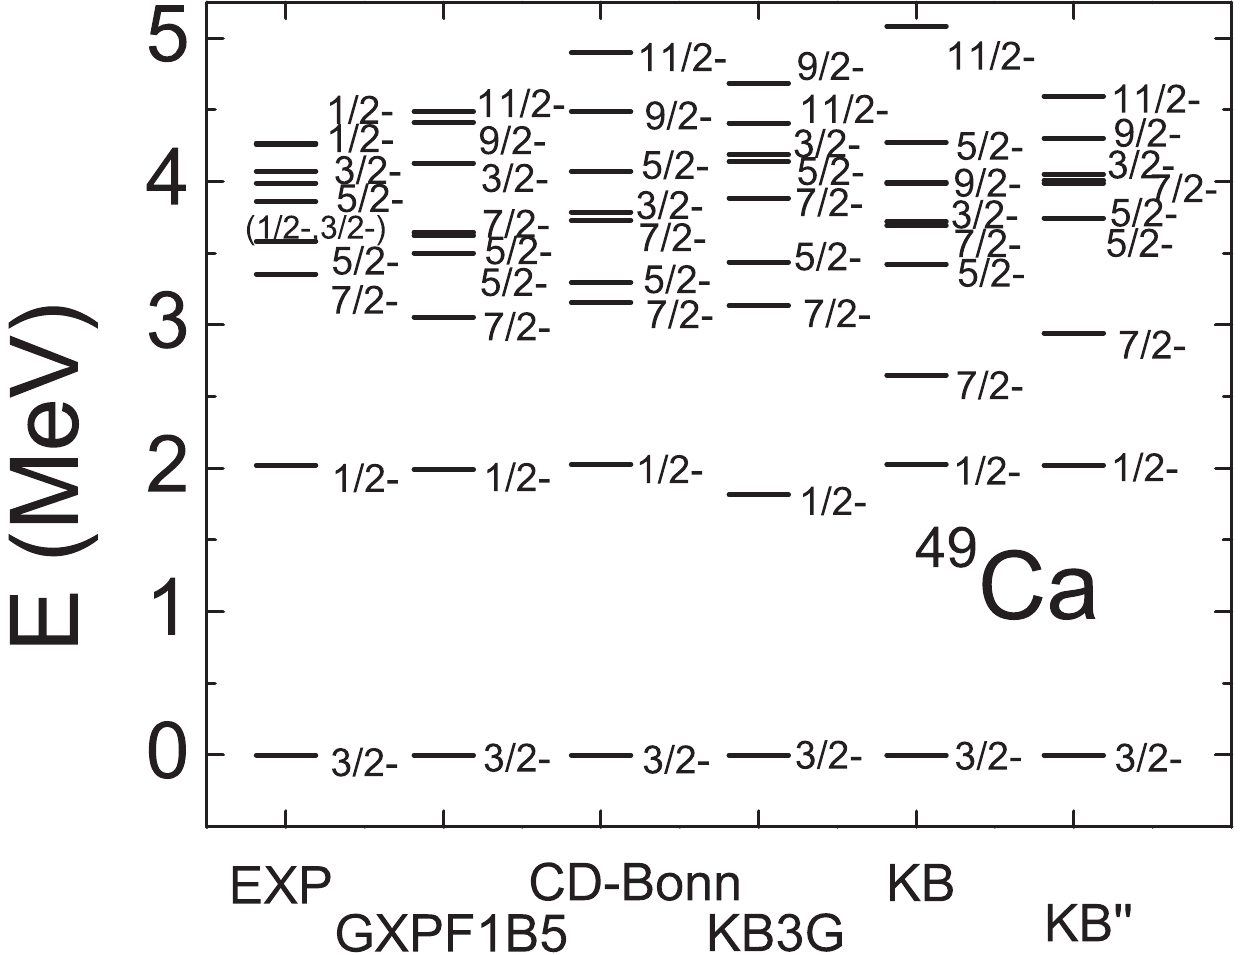 Figure7. Excitation energies of 49Ca compared to the experimental data [39].
The energy of the yrast states of 51-57Ca is shown in Fig. 8. Since most experimental data for the yrast states of 51-57Ca are missing, we take the results for the empirical interactions as a guideline, especially for the GXPF1B5 interaction which has been fitted to the most recent experimental data. It is seen that the results for 51Ca are quite close. However, clear discrepancies can be seen for 53-57Ca. In particular, the energy of the yrast states for the KB interaction is systematically higher than for the GXPF1B5 and KB3G interactions. Thus, the adjustment of SPEs is not sufficient to cure the KB interaction. The energy for the CD-Bonn interaction is only slightly higher and fairly close to the empirical interactions.
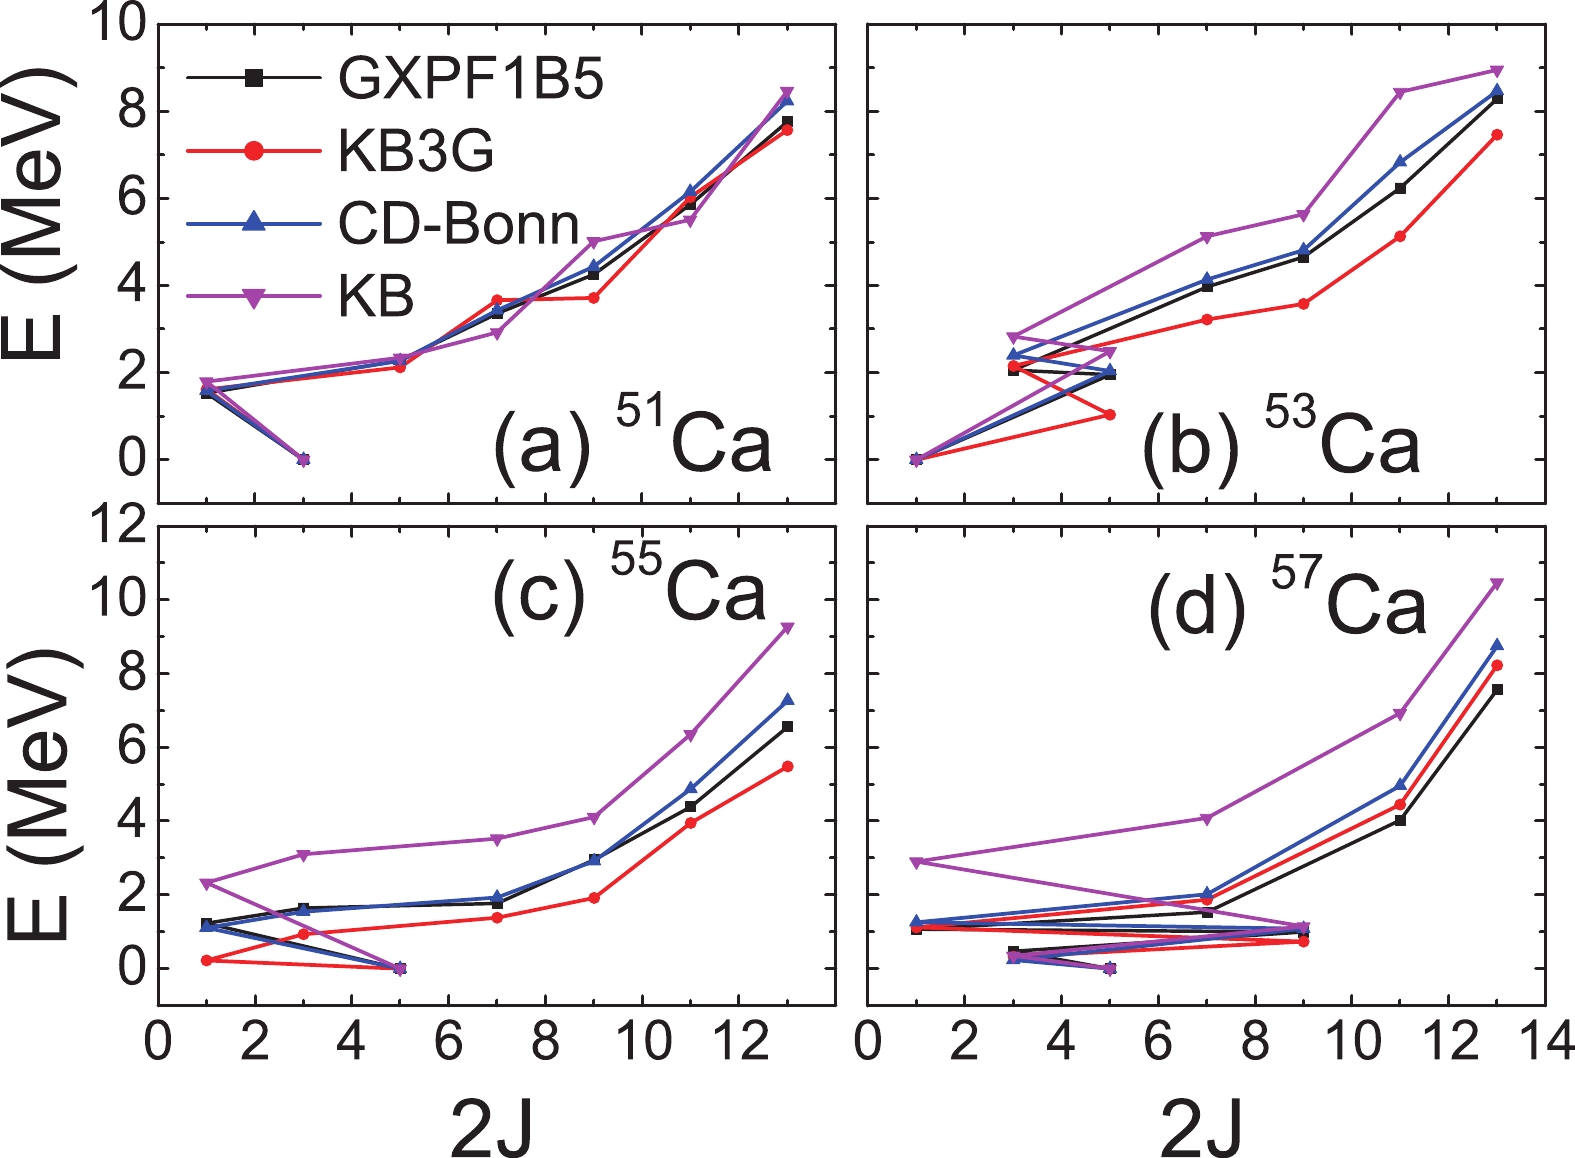 Figure8. (color online) Calculated yrast states of 51-57Ca.
We also calculated the one-neutron pickup spectroscopic factors (SFs), listed for 49C in Table 2. A spectroscopic factor of unity indicates a single particle nature. From the table, one can see that all interactions give SFs very close to unity for the
  |   |   |   | |
| Exp. | 0.84 | 0.91 | 0.11 | 0.84 |
| CD-Bonn | 0.86 | 0.92 | 0.00 | 0.86 |
| CD-Bonn' | 0.60 | 0.68 | 0.68 | 0.05 |
| KB | 0.94 | 0.96 | 0.00 | 0.94 |
| KB' | 0.69 | 0.77 | 0.67 | 0.00 |
| KB" | 0.95 | 0.96 | 0.00 | 0.94 |
| KB3G | 0.95 | 0.97 | 0.95 | 0.00 |
| FPD6 [40] | 0.92 | 0.94 | 0.93 | 0.01 |
| GX1A [41] | 0.95 | 0.97 | 0.02 | 0.94 |
| GX1B [34] | 0.95 | 0.96 | 0.02 | 0.94 |
| GXPF1B5 [33, 34] | 0.95 | 0.96 | 0.56 | 0.41 |
Table2.The one-neutron pickup spectroscopic factors for 49Ca. The experimental values are from Ref. [42].
We adjusted their SPEs to the single particle states, identified by a spectroscopic factor of unity, as suggested in Ref. [8]. From the studies of ESPEs, it was found that the evolution of the shell structure for the CD-Bonn and KB interactions is similar to the empirical interactions, especially around 48Ca. After fixing SPEs, the calculated binding energy, two-neutron separation energy and excitation energies in neutron-rich isotopes for the CD-Bonn interaction were found to be very close to the experimental data.
The KB interaction, which was the first realistic interaction derived around half a century ago, contains less correlations than the CD-Bonn interaction. The adjustment of SPEs for the KB interaction improves the results considerably, but there are still significant discrepancies with respect to the experimental data. As suggested in Refs. [28, 35], the correction of the monopole can also be seen as an inclusion of 3bd correlations. Thus, we used KB3G, the monopole-corrected version of the KB interaction, and another version of KB (labeled KB''), where the monopole term is replaced by the term from GXPF1B5. The KB3G interaction is one of the most popular
The effective interaction from the CD-Bonn potential contains more correlations than the traditional KB interaction. We found that the monopole matrix elements for the CD-Bonn interaction are fairly similar to the empirical interactions. This is the reason why ESPEs for the CD-Bonn interaction are close to those for the GXPF1B5 and KB3G interactions. Of course, the common monopole problems still exist. For example, the central channel of the monopole elements is still systematically more attractive for the CD-Bonn interaction. Thus, when adding neutrons to calcium isotopes, the orbital becomes more bound. Discrepancies were also found for the energy of the yrast states of 51-57Ca, since those for the CD-Bonn interaction are slightly higher than for the empirical interactions for 53-57Ca.
Thus, the real 3bd forces have to be used as a reliable way to consistently include many-body correlations. In cases where it is difficult to include the 3bd force microscopically, or if there is insufficient experimental data to systematically correct the effective interactions or their monopole terms, the prescription proposed here is an economical way of including correlations from the 3bd force, at least for the energies and spectroscopy. The problem of transitions, such as the M1 strength in 48Ca, where both the 3bd force and the g-orbit contributions were found to be important [7], is left to future investigations.
We also tested the systematics of the 2
