HTML
--> --> -->Mullins et al. [5] was the first to propose the low level scheme of 135Sm. They have identified the yrast band composed of α=?1/2 and α=+1/2 signatures of the 1νg7/2 band. They have also proposed the possibility for the band head spin of this yrast band at Iπ= 7/2+. Furthermore, they proposed the negative parity band to be based on a neutron in the h11/2 orbital. The α=?1/2 component of this negative parity band comes lower in energy. The α=+1/2 signature component of this band has been identified as much weaker signature. The authors of Ref. [5] have proposed the band head spin of this negative parity band at Iπ=9/2?.
In case of 137Sm, the yrast band is based on a coupled neutron orbital from the upper h11/2 mid-shell [6], and built on the [514]9/2? Nilsson orbital. Both signature components of this orbital were observed in this nucleus. Paul et al. [7] have predicted deformation for this single h11/2 quasi-neutron state as ε2~0.20 and ε4~0.026. Later on Alvarez et al. [8] have identified a positive parity band based on Nilsson configuration [400]1/2+ in 137Sm.
After analyzing the literature, it is found that no single theoretical framework has been used in the past to study the band spectra in all the odd mass 133,135,137Sm. Moreover, it is desired that odd mass Sm nuclei can be consistently described alongside even even Sm isotopes [9,10], which is a strict test for microscopic models. In the present work, an attempt has been made to study spectroscopic properties of 133-137Sm isotopes by using projected shell model and to reproduce the ground state band, excited bands, their relative band head energies, transition energies between two angular momentum states and electromagnetic transition strengths. Further, it is of interest to determine the extent to which the present calculation can account for the ground state and excited state deformations of 133-137Sm isotopes by using projected shell model. In this model, both pairing and deformation are treated self consistently. The pairing interaction is extended to incorporate both monopole and quadrupole terms. Therefore, it is necessary to test this model in a wider context within this mass region A~130-140 and also to investigate the role of proton configurations at higher spins.
The structure of the paper is as follows. In Section 2, a brief outline of the projected shell model is given. Results for calculated energy level schemes, transition energies between two angular momentum states, kinetic moment of inertia and discussion on band diagrams are presented in Section 3. Section 4 deals with the electromagnetic transition strength ratios for the yrast bands of 133-137Sm isotopes. In Section 5, the work is summarized and the conclusions are presented.
2
2.1.Brief outline of the calculational framework
In this section, a brief introduction of the theory is presented. The complete description of the theory is given in the Refs. [11-18]. The projected shell model builds its model basis by using deformed quasiparticle-basis (qp), but selection of deformed basis involves violation of rotational symmetry of wave functions. The broken rotational symmetry in the wavefunction is restored by angular momentum projection technique [19]. The PSM, wavefunction can be written as $\left. {|\sigma ,IM} \right\rangle = \sum\limits_{K\kappa } {f_{IK\kappa }^\sigma \hat P_{MK}^I\left. {|{\varphi _\kappa }} \right\rangle }, $ | (1) |
$\left. {|{\varphi _\kappa }} \right\rangle = a_\nu ^{\rm{\dagger }}|0\rangle ,a_\nu ^{\rm{\dagger }}a_{\pi 1}^{\rm{\dagger }}a_{\pi 2}^{\rm{\dagger }}|0\rangle. $ | (2) |
$\mathop \sum \limits_{K'\kappa '} \left( {H_{K\kappa ,K'\kappa '}^I - E_I^\sigma N_{K\kappa ,K'\kappa '}^I} \right)f_{IK'\kappa '}^\sigma = 0$  | (3) |
$\mathop \sum \limits_{K\kappa K'\kappa '} f_{IK\kappa }^\sigma N_{K\kappa ,K'\kappa '}^If_{IK'\kappa '}^{\sigma '}{\rm{ = }}{\delta _{\sigma \sigma '}},$  | (4) |
${E_\kappa }(I) = \frac{{\left\langle {{\varphi _\kappa }\left| {\hat H\hat P_{KK}^I} \right|{\varphi _\kappa }} \right\rangle }}{{\left\langle {{\varphi _\kappa }\left| {\hat P_{KK}^I} \right|{\varphi _\kappa }} \right\rangle }} = \frac{{H_{K\kappa K'\kappa '}^I}}{{N_{K\kappa K'\kappa '}^I}}. $ | (5) |
The total Hamiltonian in the present study is of the form
$\hat H = {\hat H_0} - \frac{1}{2}\chi \sum\limits_\mu {\hat Q_{2\mu }^{\rm{\dagger }}{{\hat Q}_{2\mu }}} - {G_M}{\hat P^{\rm{\dagger }}}\hat P - {G_Q}\sum\limits_\mu {\hat P_{2\mu }^{\rm{\dagger }}{{\hat P}_{2\mu }}}. $ | (6) |
| Nuclei | 133Sm | 135Sm | 137Sm |
| ε2 | 0.330 | 0.275 | 0.20 |
| ε4 | 0.035 | 0.070 | 0.04 |
Table1.Deformation parameters used for both positive and negative parity bands of 133?137Sm.
The Nilsson diagram obtained for neutrons by taking Nilsson parameters of [23] for quadrupole deformations (ε2) is displayed in Fig. 1. In this Fig., the positive parity and negative parity states are represented by solid and dotted lines, respectively. The states in the dotted rectangle represent the range of Nilsson states near the fermi surface and range of deformation ε2=0.20?0.33 within which the 133-137Sm isotopes lie. It can be seen from Fig.1, that the positive parity K=5/2 from 2d5/2; K=3/2,5/2,7/2 from 1g7/2; K=1/2,3/2 from 2d3/2; K=1/2 from 3s1/2, orbitals and negative parity, K=3/2,5/2,7/2/,9/2 from 1h11/2; K=1/2 from 2f7/2,1h9/2 orbitals lie inside the rectangle in the deformation range 0.20?0.33 for normally deformed bands of 133?137Sm. However, beyond ε2 =0.36, K=1/2 from i13/2 orbital crosses the K=5/2,7/2 from the 1g7/2 orbital. In the present work, the normally deformed bands from the N=4 and 5 oscillator shells, that lie in the range ε2=0.20-0.33 of deformation in 133?137Sm are discussed. The highly deformed (HD) and super deformed (SD) neutron [660]1/2+ (νi13/2) bands [4,5,8,26,27] appear at enhanced quadrupole deformations and are not studied here due to the limitation of present calculations.
 Figure1. (color online) The Nilsson diagram for neutrons, obtained by using Nilsson parameters of Ref. [23].
The monopole pairing interaction constant GM is taken as
${G_M} = \left( {{G_1} \mp {G_2}\frac{{N - Z}}{A}} \right)\frac{1}{A}\;{\rm{MeV}},$ | (7) |
3.1.133Sm
Experimentally seven energy bands have been identified in this nucleus, out of which six are coupled bands designated as bands 1,2; 3,4; 5,6 and a decoupled band 7 [4]. Two bands are said to be coupled if they are linked with each other by dipole transitions M1. In case of 133Sm, band 7 is isolated and is not connected with any other neighboring band and therefore is called a decoupled band. The two pairs of bands 1,2 and 5,6 are strongly coupled bands, as indicated by large experimental B(M1)/B(E2) ratios [4] for the low spin transitions in the two pairs of bands. In the case of decoupled bands, M1/E2 transitions are either absent or weak, depending on the amount of decoupling. Two pairs of bands 1,2 and 3,4 are of positive parity and three bands 5,6 and 7 are of negative parity.3
3.1.1.Strongly coupled bands 1 and 2
The band spectra for 133Sm nucleus have been obtained with quadrupole and hexadecapole deformation parameters ε2=0.330 and ε4=0.035 for all the bands of 133Sm. These values of deformation parameters are close to the values of 0.31 and 0.040, predicted for this nucleus by the authors of Ref. [24]. The calculations of Ref. [4] suggest a quadrupole deformation of 0.33 for the decoupled band 7 of 133Sm. Therefore, to obtain all the bands 1-7 of 133Sm, the value of ε2 is chosen as 0.33. In a band diagram [11], rotational behavior of each configuration as well as its relative energy compared to other configurations is easily visualized. In these band diagrams, only low-lying projected bands are shown as the essence of physics of interest is satisfactorily reflected from these low-lying bands.In Fig. 2, we plot the relevant low lying 1-qp and 3-qp positive parity bands in 133Sm, along with their configurations. From the Fig. 2, it is seen that 1-qp neutron band built on K=5/2 and having configuration 1ν5/2+ [413] (2d5/2), is lowest in energy up to the spin (I) = 31/2+.
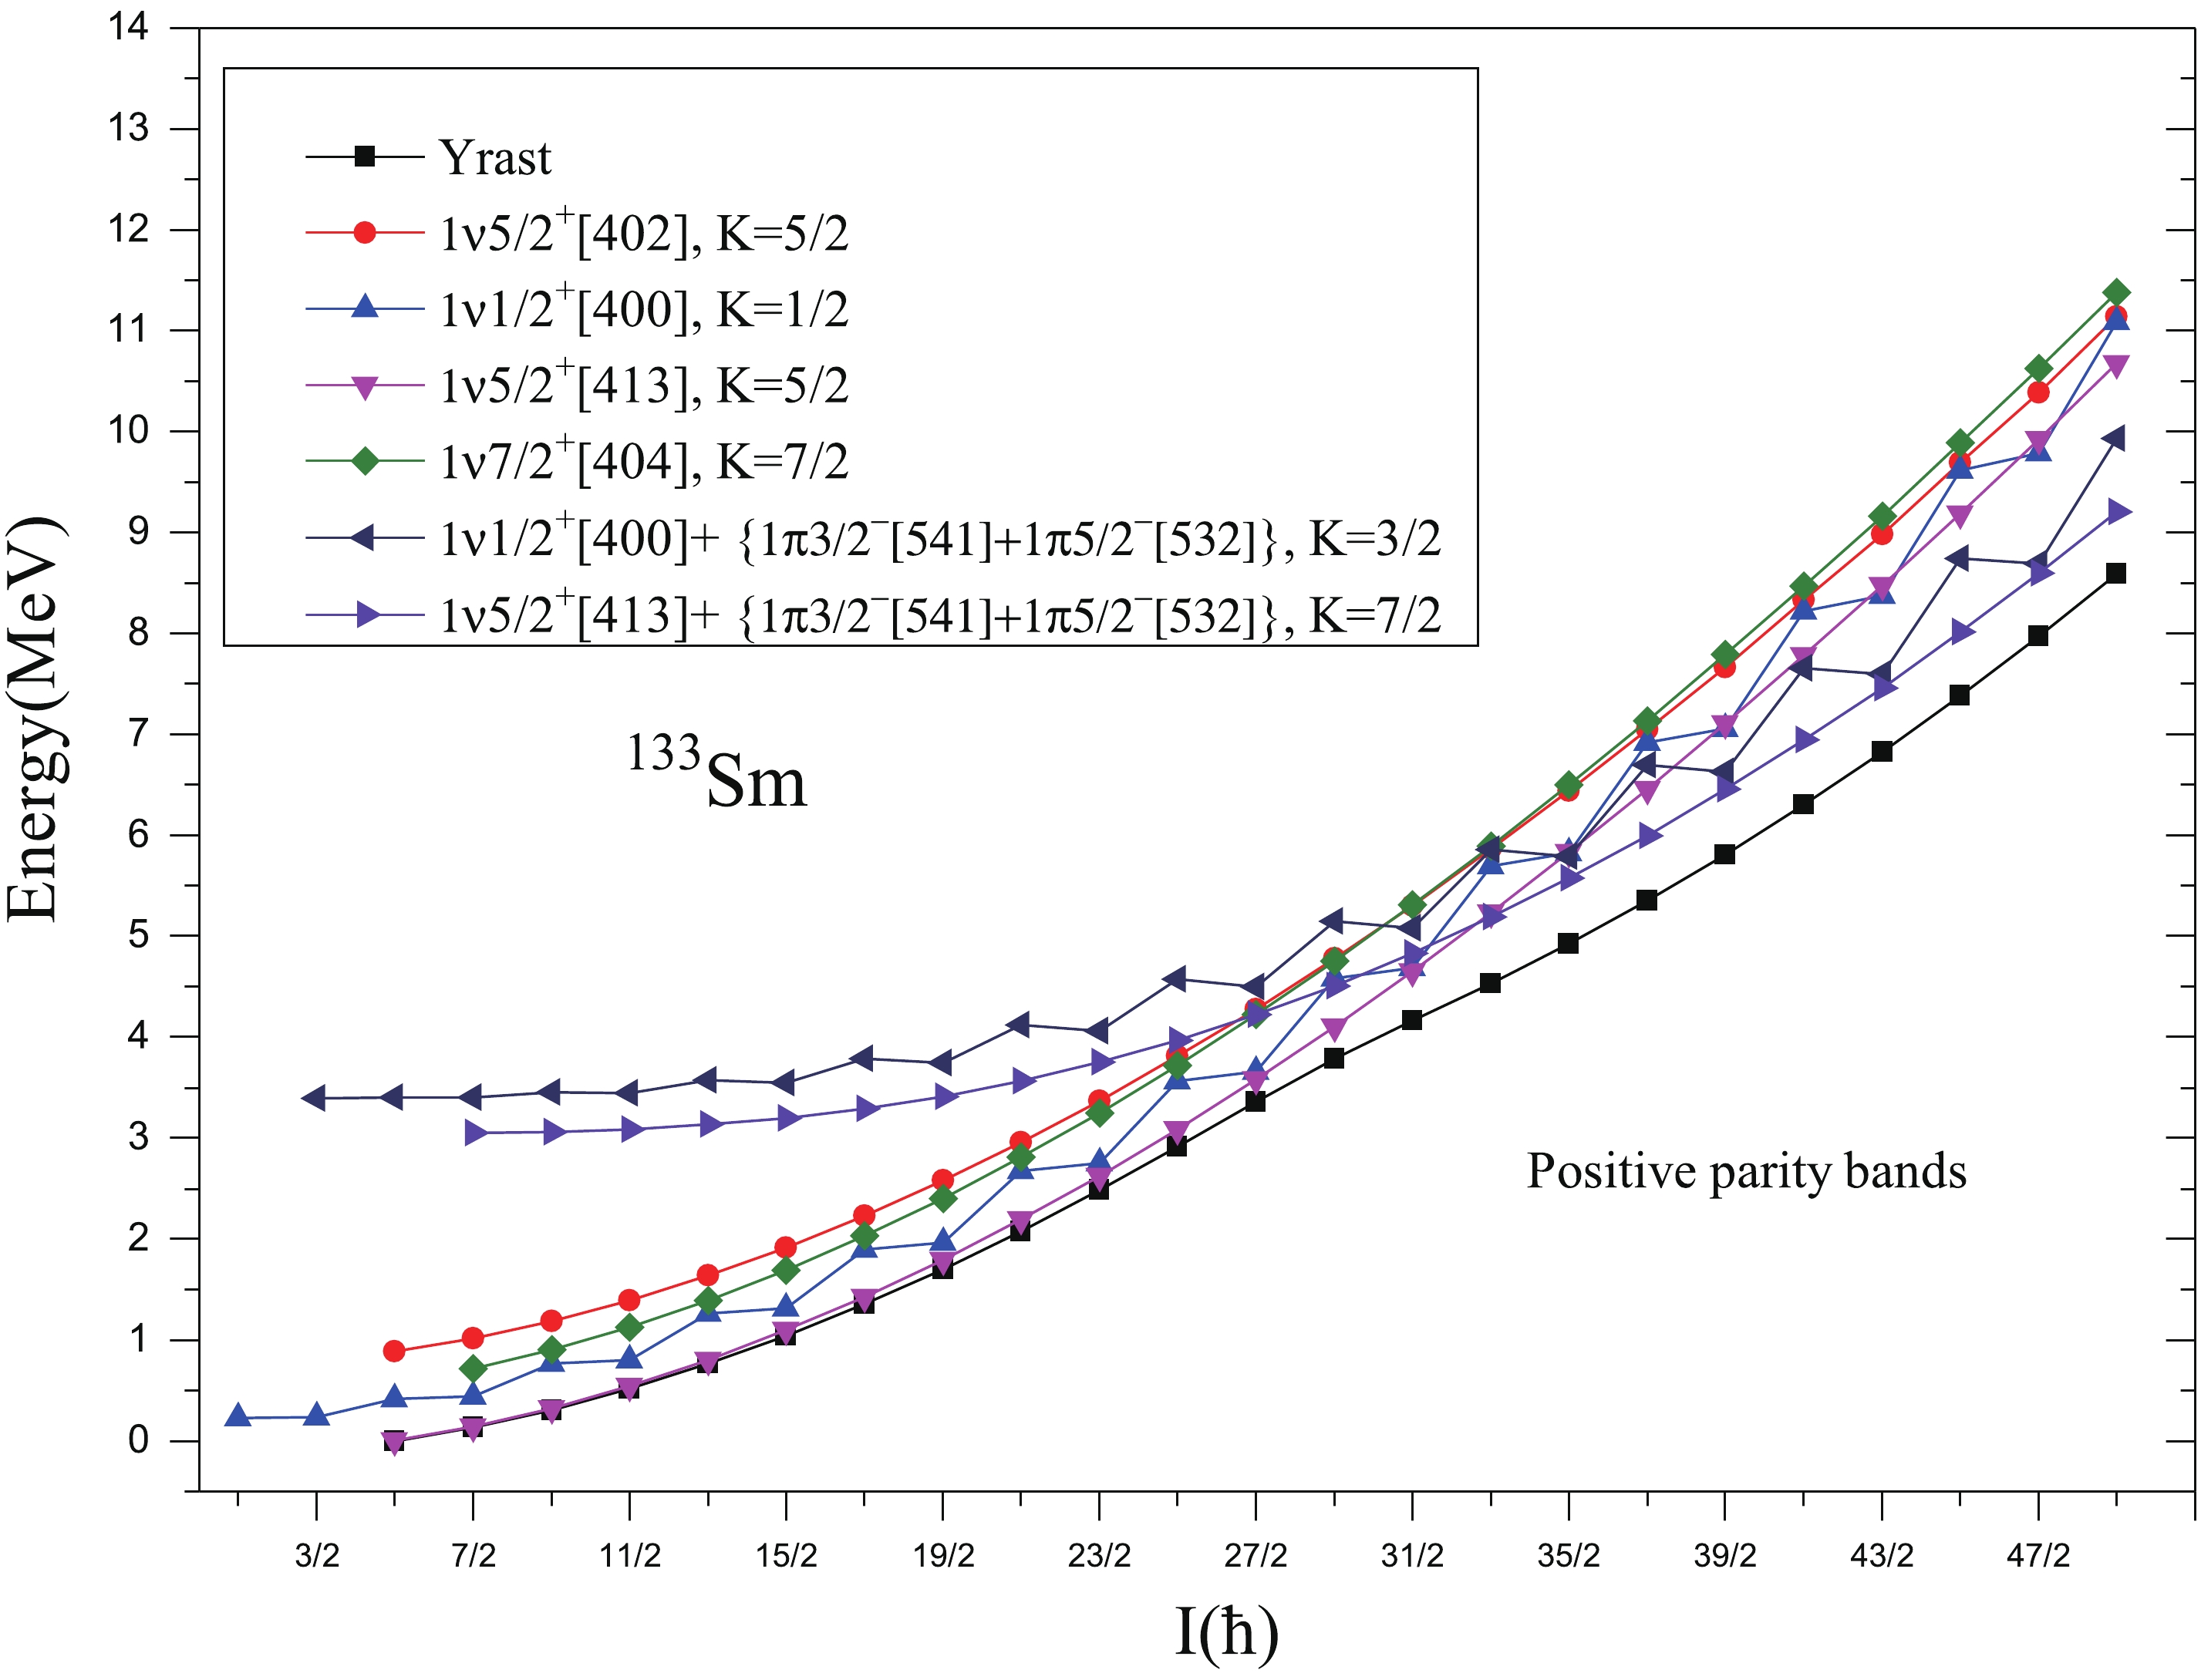 Figure2. (color online) Band diagram for positive parity bands for 133Sm. Only low-lying and significant bands are taken.
Experimentally, bands 1 and 2 shown in Fig. 3 are lowest positive parity energy bands available for comparison with theoretical results. We can, therefore, identify them with the bands obtained by us theoretically. The calculated results also support and are consistent with the band head spin and configuration assigned to the lowest positive parity band built on K=5/2 by the authors of Refs. [3,4]. Also, from the comparison of calculated and experimental energy spectra given in Fig. 3, it is clear that the agreement between calculated and experimental spectra [4,28] of band 1 and 2 (α=±1/2) is reasonably good. The difference between calculated and experimental values at the highest known spin I=29/2+ (α=+1/2) of band 1 is 0.261 MeV and the difference at the highest known spin I=27/2+ (α=?1/2) of band 2 is 0.293 MeV. At spin 33/2+, this ground state band is crossed by two 3-qp bands (as shown in the band diagram of Fig.2). This crossing by 3-qp bands causes a significant change in the yrast structure from 33/2+ onwards. The yrast states from 33/2+ onwards are predicted to arise from the superposition of two 3-qp bands having configurations 1ν5/2+[413]+{1π3/2?[541]+1π5/2?[532]}, K=7/2 and 1ν1/2+[400]+ {1π3/2?[541]+1π5/2?[532]}, K=3/2.
 Figure3. (color online) Comparison of theoretical (Th.) energy levels with the available experimental (Exp.) data [28] for positive parity bands of 133Sm.
3
3.1.1.1.Kinetic moment of inertia of bands 1 and 2
Rotational spectra in deformed nuclei can be better discussed in terms of moment of inertia. It is well known that the moment of inertia is sensitive to nuclear properties, like the pairing strength and the specific orbitals active at the Fermi surface. As moment of inertia depends upon the angular momentum, therefore its variation can impart some valuable information about the change in nuclear structure. Back-bending in moment of inertia can be calculated by using the formulae given in Ref. [29] and is a well-known phenomenon in understanding the nuclear structure at high-spins, which is expected to occur in rotating nuclei.Calculated results on kinetic moment of inertia of bands 1-7 of 133Sm are displayed in Fig. 4.
 Figure4. (color online) Comparison of calculated and experimental kinetic moment of inertia J(1), for bands 1-7 as a function of rotational frequency (ω) in 133Sm.
The calculated results on back-bending phenomenon in bands 1 and 2, based on the calculation of the kinematic moment of inertia J(1) and the rotational frequency (ω) are compared with the available experimental data in Fig. 4. The calculated J
3
3.1.2.Coupled bands 3 and 4
From the Fig. 2, it is seen that 1-qp neutron band built on K=1/2 and having configuration 1ν1/2+[400] (2d3/2) is the first excited positive parity band. Experimentally, first excited positive parity band is observed to be built upon Nilsson orbital [411]1/2+(d3/2) [4,28]. The present calculations have well reproduced the band head spin and configuration of this band. The present calculations show proximity of this excited band built on K=1/2 with the ground state band built on K=5/2 and both these bands are taken over by 3-qp bands having one neutron coupled to two h11/2 protons at spin 33/2+ as can be seen in the Fig. 2. After band crossing, the first excited positive parity states are predicted to arise from the superposition of two 1-qp neutron bands having configurations 1ν5/2+[413](2d5/2) and 1ν1/2+[400](2d3/2). The band head energy of excited positive parity bands is not confirmed experimentally. However, the present calculations predict the band head energy of band 3 as 0.226 MeV with respect to positive parity yrast band 1. As the band head energies of these bands are not confirmed experimentally, the band spectra of these bands are not plotted for comparison. For comparison with experimental data [4,28], the transition energies E(I)-E(I-2) and E(I)-E(I-1) of bands 3 and 4 are plotted in Fig. 5. From this figure, it can be seen that E2 transition energies are reasonably reproduced at the lower spins for both bands 3 and 4. However, there is decrease in calculated E2 transitions around the spins 29/2+ and 35/2+, while as experimental values show no decrease in E2 transitions. The decrease in calculated E2 transitions at higher spins may be due to the crossing of 1-qp excited positive parity band by 3-qp bands. It is worthwhile to mention here that staggering in dipole transition energies M1 connecting bands 3 and 4 is well reproduced by the present calculations as shown in Fig. 5. Figure5. (color online) Comparison of theoretical (Th.) and experimental (Exp.) [4,28] transition energy E(I)-E(I-2) versus angular momentum (I) for positive parity bands 3 and 4 and dipole transitions E(I)-E(I-1) versus angular momentum (I) connecting bands 3 and 4.
3
3.1.2.1.Kinetic moment of inertia of bands 3 and 4
The comparison of calculated kinetic moment of inertia J(1) versus ω with the experimental ones for positive parity bands 3 and 4 is presented in Fig. 4. The calculated and experimental J(1) values show the phenomenon of staggering in these bands due to the low value, K=1/2 of the band. The experimental band 3 (α=+1/2), shows an alignment around spin I=33/2 at3
3.1.3.Strongly coupled bands 5 and 6
Bands 5 and 6 have been assigned as being 1-qp structure built upon the neutron [523]7/2?(h11/2) Nilsson orbital [4,28]. The experimental Routhians [4] show that both bands 5 and 6 have very little signature splitting up to the highest frequencies observed as would be expected from the high K assignments. The relative band head energies of negative parity bands 5,6 and 7 with respect to the ground state positive parity band are not confirmed experimentally. The present calculations predict the band head energy of band 5 as 0.179 MeV with respect to positive parity band 1. In Fig. 6, we plot the relevant low lying 1-qp and 3-qp negative parity bands in 133Sm, along with their configurations. From the Fig. 6, it is seen that 1-qp neutron band built on K=7/2 and having configuration 1ν7/2?[523] (1h11/2) is lowest in energy out of all other negative parity bands, up to the spin I=39/2?. The calculated results are very much consistent with the experimentally observed band head spin and configuration assigned to this band by the authors of Refs. [4,28]. Around spin 41/2?, this pure 1-qp neutron band is crossed by one 3-qp band consisting of one neutron h11/2 coupled to two proton h11/2 orbitals with 1ν7/2?[523]+{1π3/2?[541]+1π5/2?[532]}, K=5/2 as dominant configuration. Fig. 7 represents E(I)-E(I-2) transitions of bands 5 and 6 and dipole transitions E(I)-E(I-1), connecting these two bands. The calculated results show good agreement between theoretical and experimental transition energy values. There is decrease in calculated E2 and M1 transition energies around the spin 39/2? which is due to the crossing of lowest negative parity band by the two 3-qp bands (as shown shown in Fig. 6). Figure6. (color online) Band diagram for negative parity bands for 133Sm. Only low-lying and significant bands are taken.
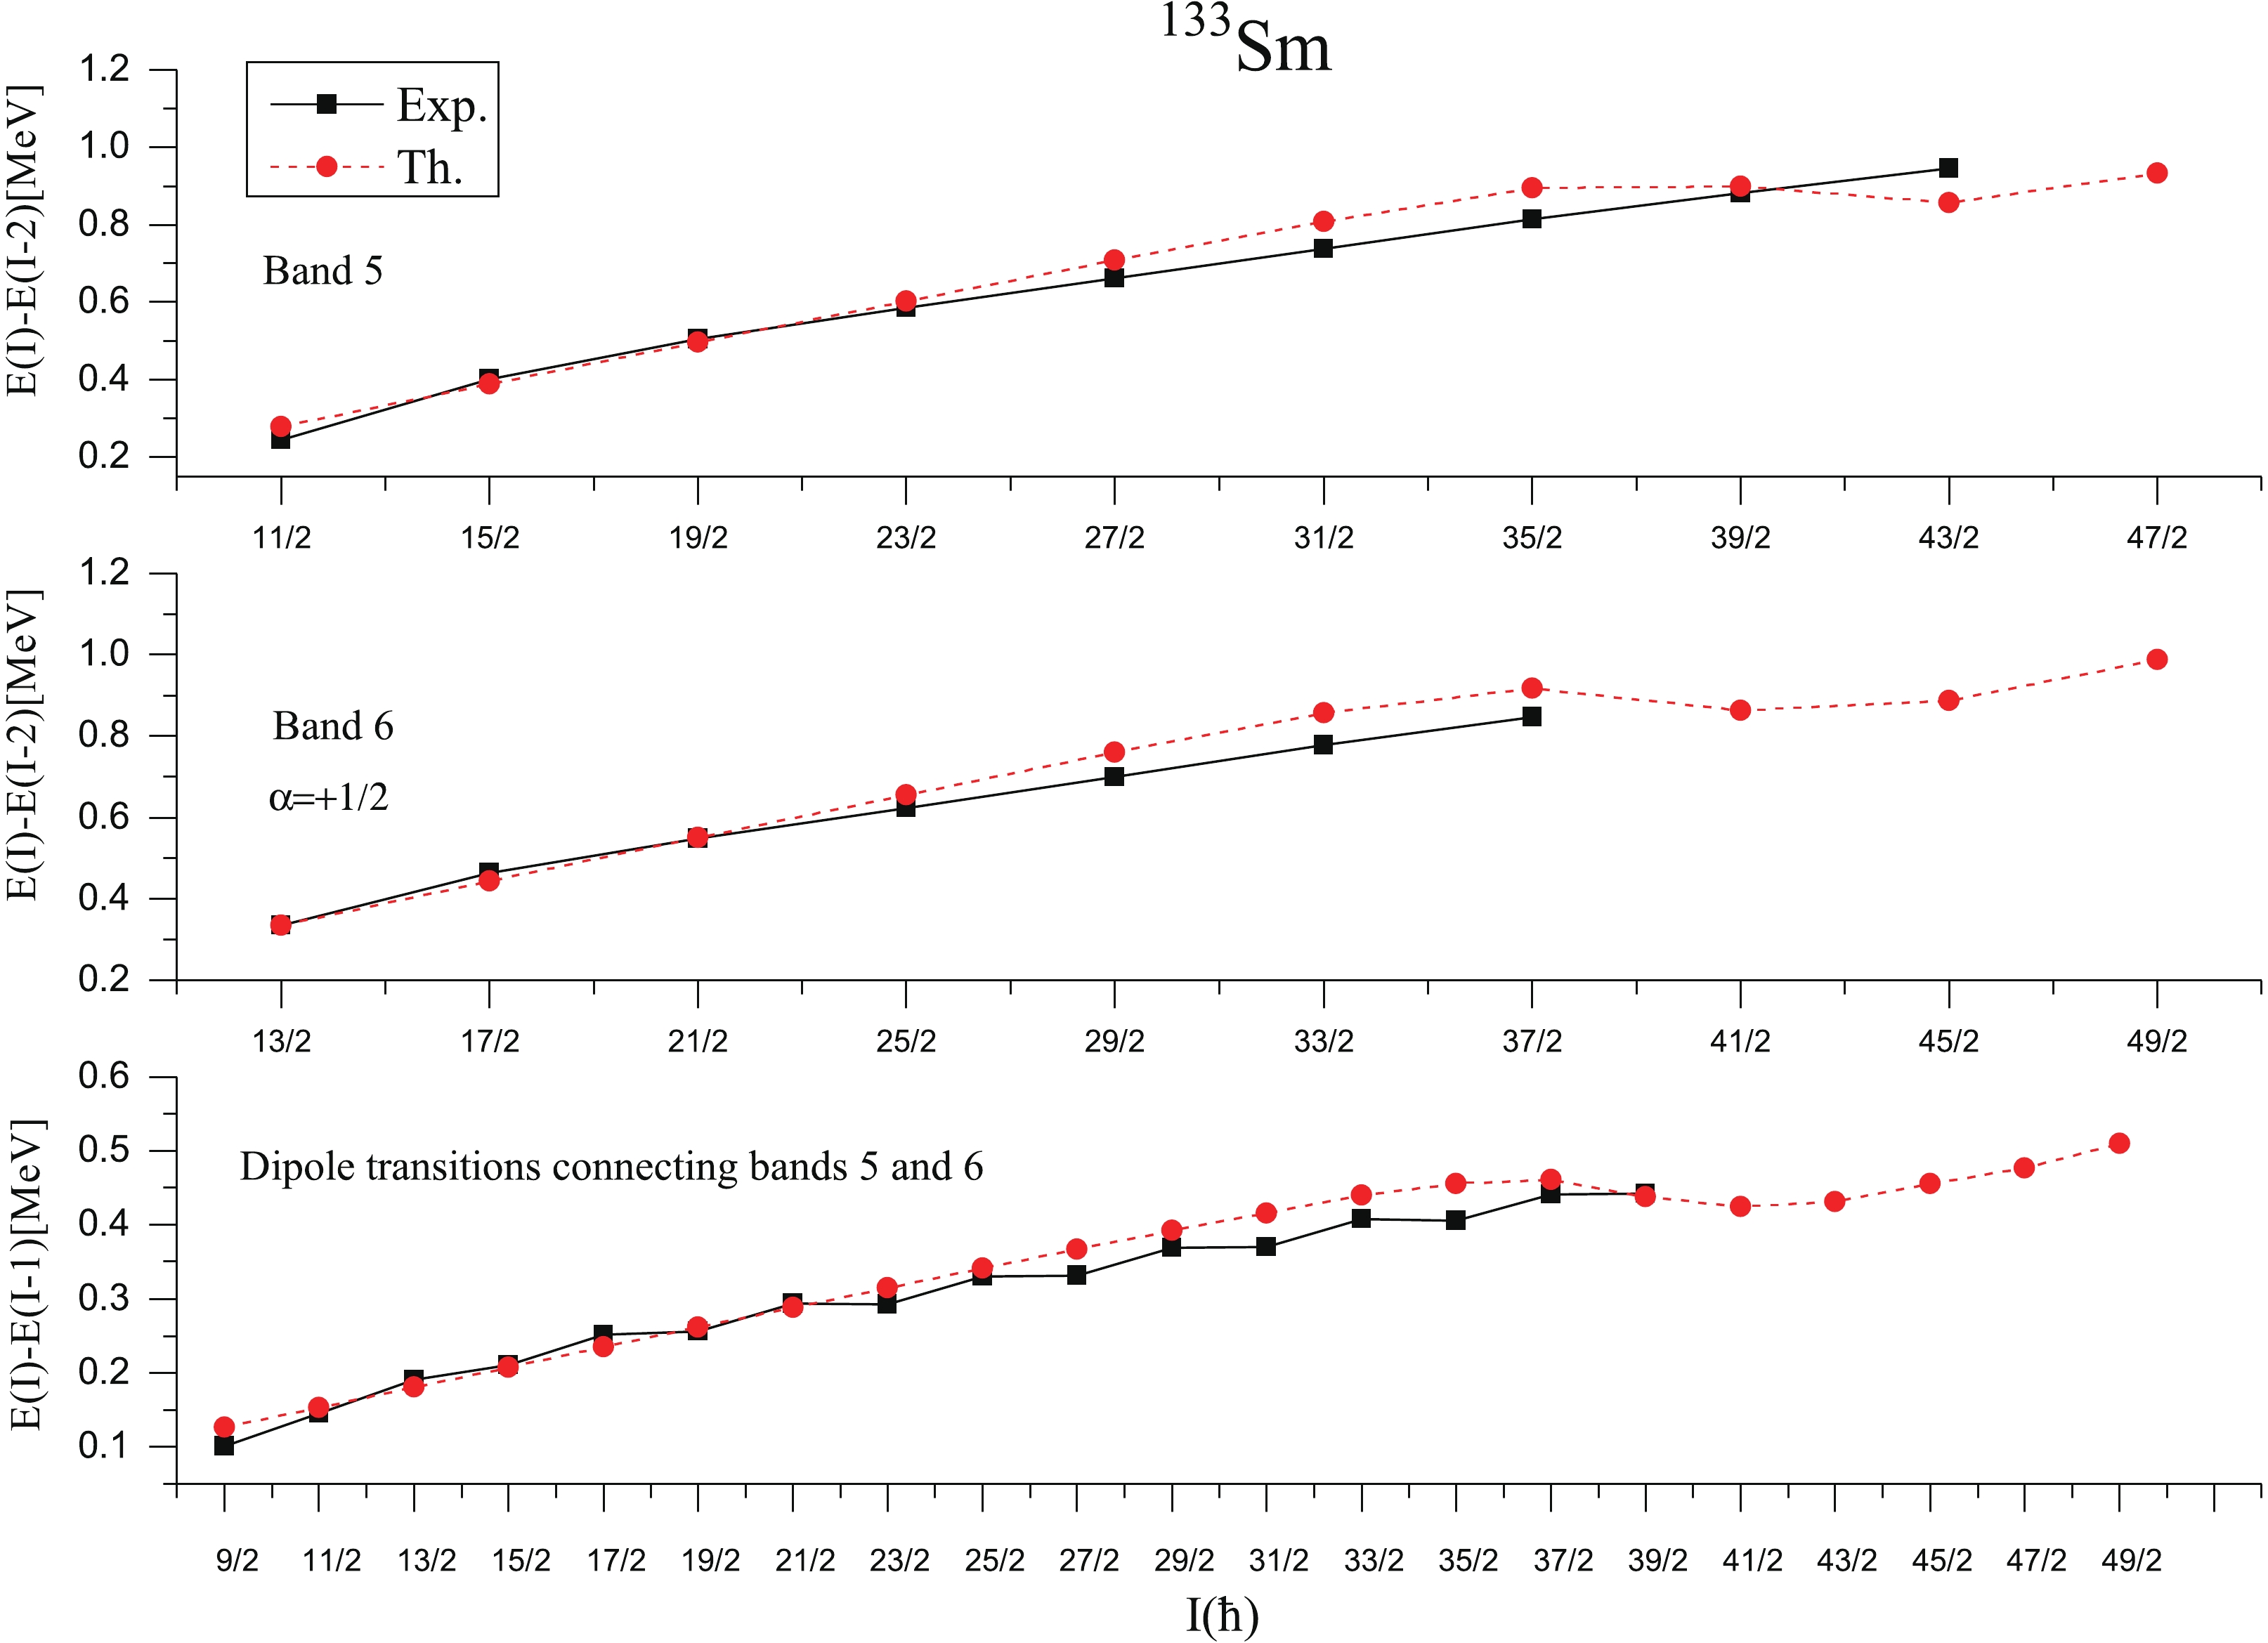 Figure7. (color online) Comparison of theoretical (Th.) and experimental (Exp.) [4,28] transition energy E(I)-E(I-2) versus angular momentum (I) for negative parity bands 5 and 6 and dipole transitions E(I)-E(I-1) versus angular momentum (I) connecting bands 5 and 6.
3
3.1.3.1.Kinetic moment of inertia of bands 5 and 6
The comparison of calculated kinetic moment of inertia J(1) versus ω with the experimental ones for negative parity bands 5 and 6 is presented in Fig. 4. The agreement between calculated and experimental curves at lower spins is good. The experimental curve of J(1) versus ω show an increase around spin I=25/2? at3
3.1.4.Decoupled band 7
Experimentally, this band 7 has been observed and assigned [541]1/2- (h9/2) configuration by authors of Refs. [3,4,28]. The calculations of Ref. [4] suggest that this structure should have a quadrupole deformation β2~0.33 which is nearly equal to the value of ε2=0.33 used in the present study of bands 1-7. From the Fig. 6, the band built on K Figure8. (color online) Comparison of theoretical (Th.) and experimental (Exp.) [4,28] transition energy E(I)-E(I-2) versus angular momentum (I) of band 7.
3
3.1.4.1.Kinetic moment of inertia of band 7
The comparison of calculated kinetic moment of inertia J(1) versus ω with the experimental ones for negative parity band 7 is presented in Fig. 4. The calculated values reproduce the decreasing trend of experimental data up to I=37/2. The experimental curve of J(1) versus ω show an increase around spin I=29/2? at2
3.2.135Sm
33.2.1.Discussion on band spectra
The review of experimental literature [5,26] reveals that the energies of band spectra of yrast positive and negative parity bands of 135Sm are not confirmed experimentally yet and are tentative. In the present work, the band spectra have been obtained for 135Sm with deformation parameters ε2=0.275 and ε4=0.070. The value of quadrupole deformation parameter ε2 taken in the present calculation is consistent with the values of deformation parameters predicted for 135Sm by the authors of Refs. [24,25]. However, the value of ε4 has been increased from 0.033(0.020) to 0.070 to reproduce the experimental staggering in energies of yrast negative parity band 2. Fig. 9, shows the calculated energy levels for the positive parity 7/2+ band represented by band 1 and negative parity 9/2? band represented by band 2, together with the experimental data [26]. As one can see, the data is reproduced rather well by the calculations up to the spin I= 19/2+. In conformation with the suggestion of authors of Ref. [5], the 1-qp pure neutron configuration with K=7/2 from g7/2 orbital is found to be lowest in energy defining the yrast sequence up to I=23/2+. The difference between calculated and experimental value at the highest known spin I=39/2+ (α=?1/2) of this band 1 is 0.532 MeV. This difference at the highest known spin I=29/2+ (α=+1/2) of this band 1 is 0.731 MeV. Figure9. (color online) Comparison of theoretical (Th.) energy levels with the available experimental (Exp.) data [26] for positive parity band 1 and negative parity band 2 of 135Sm.
Now coming to the discussion of negative parity band spectra of 135Sm, the calculated band spectra of 1-qp h11/2 neutron orbital with K=9/2 represented as band 2 in Fig. 9 is a negative parity band of 135Sm. The calculated energy levels corresponding to each angular momentum state of band 2 are in reasonable agreement with the tentative experimental data of Ref. [26]. The approximate band head energy of band 2 at band head spin I=9/2? is 0.10 MeV, whereas the present calculations predict it as 0.17 MeV. The difference between calculated and tentative experimental values at the band head spin I=9/2? is 0.07 MeV and this difference at the highest known spin 31/2? is 0.145 MeV. As mentioned in the preceding discussion, the level energies of these bands are tentative, therefore, one cannot comment on the level of agreement precisely. Further, the transition energies of bands 1 and 2 of 135Sm are confirmed experimentally, therefore these energies are compared with experimental data in Figs. 10 and 11 for positive and negative parity bands 1 and 2, respectively. From these figures, it is observed that, E(I)-E(I-2) transition energies show reasonably good agreement with the experimental data at low spins and show a decrease at spins I=27/2 and 29/2 in positive and negative parity bands, respectively. However, the E(I)-E(I-1) transition energies show good agreement with the available experimental data of both bands 1 and 2.
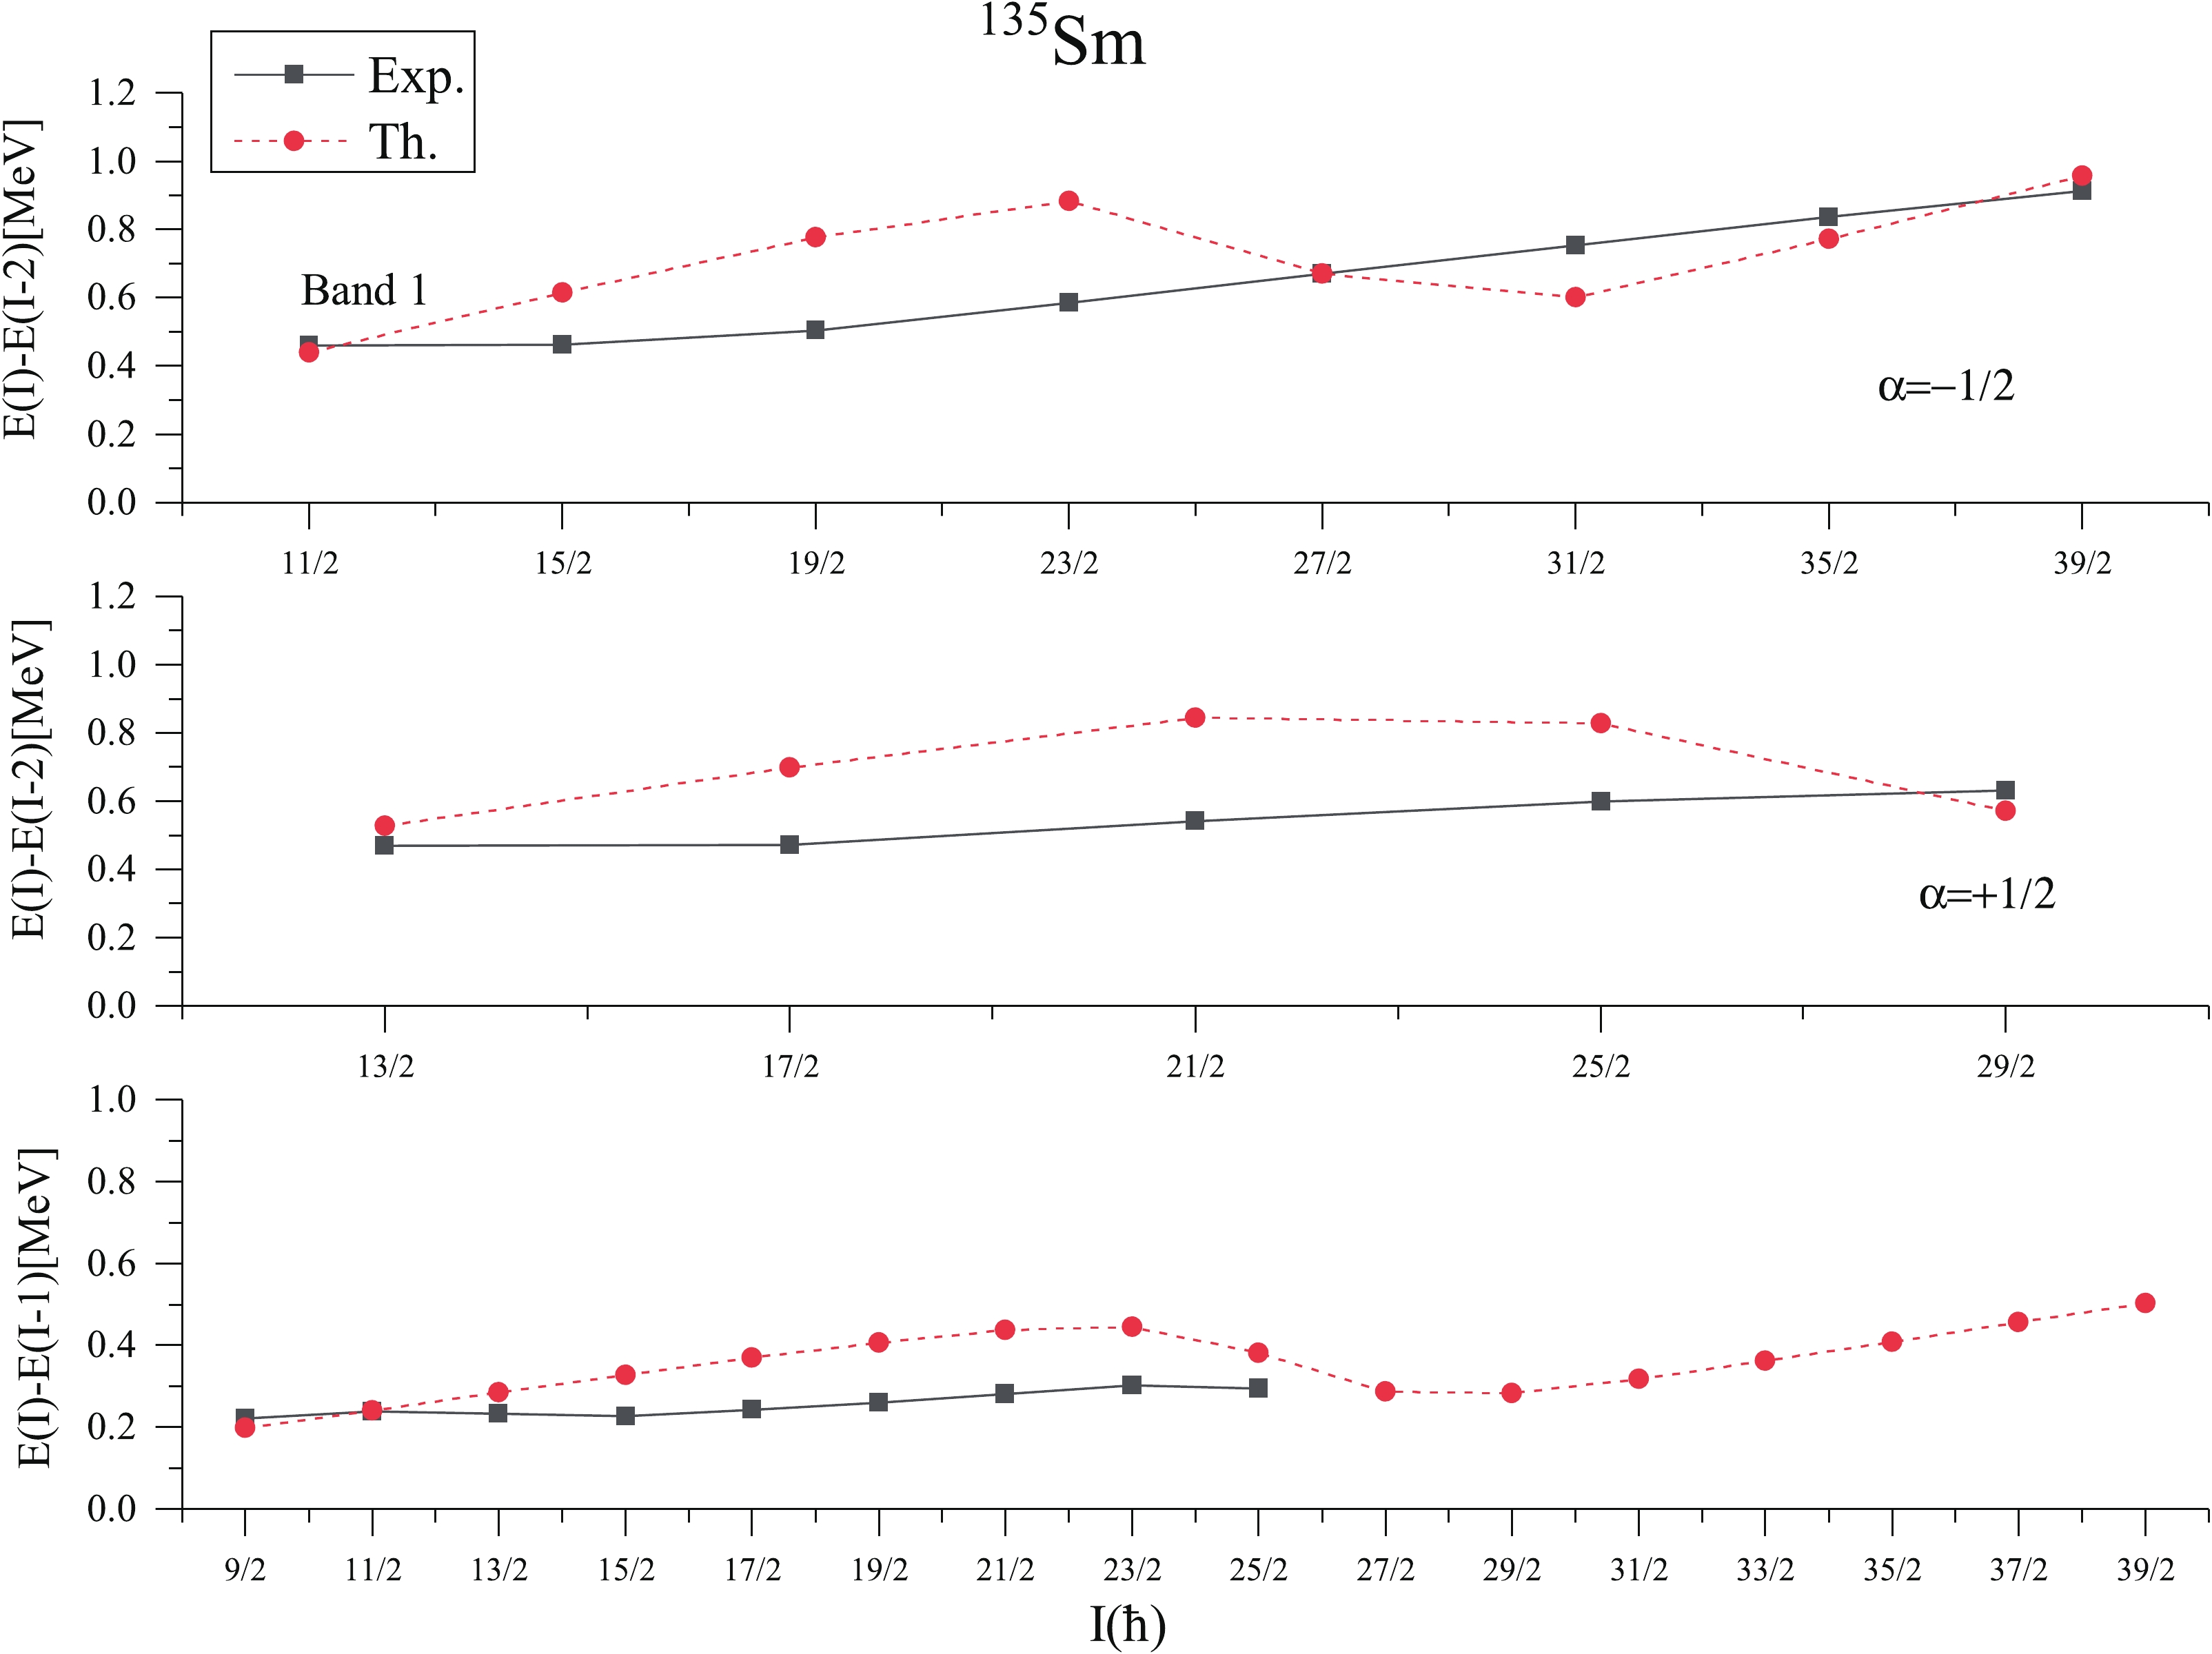 Figure10. (color online) Comparison of theoretical (Th.) and experimental (Exp.) [26] transition energy E(I)-E(I-2) and E(I)-E(I-1) of band 1 versus spin angular momentum (I) of 135Sm.
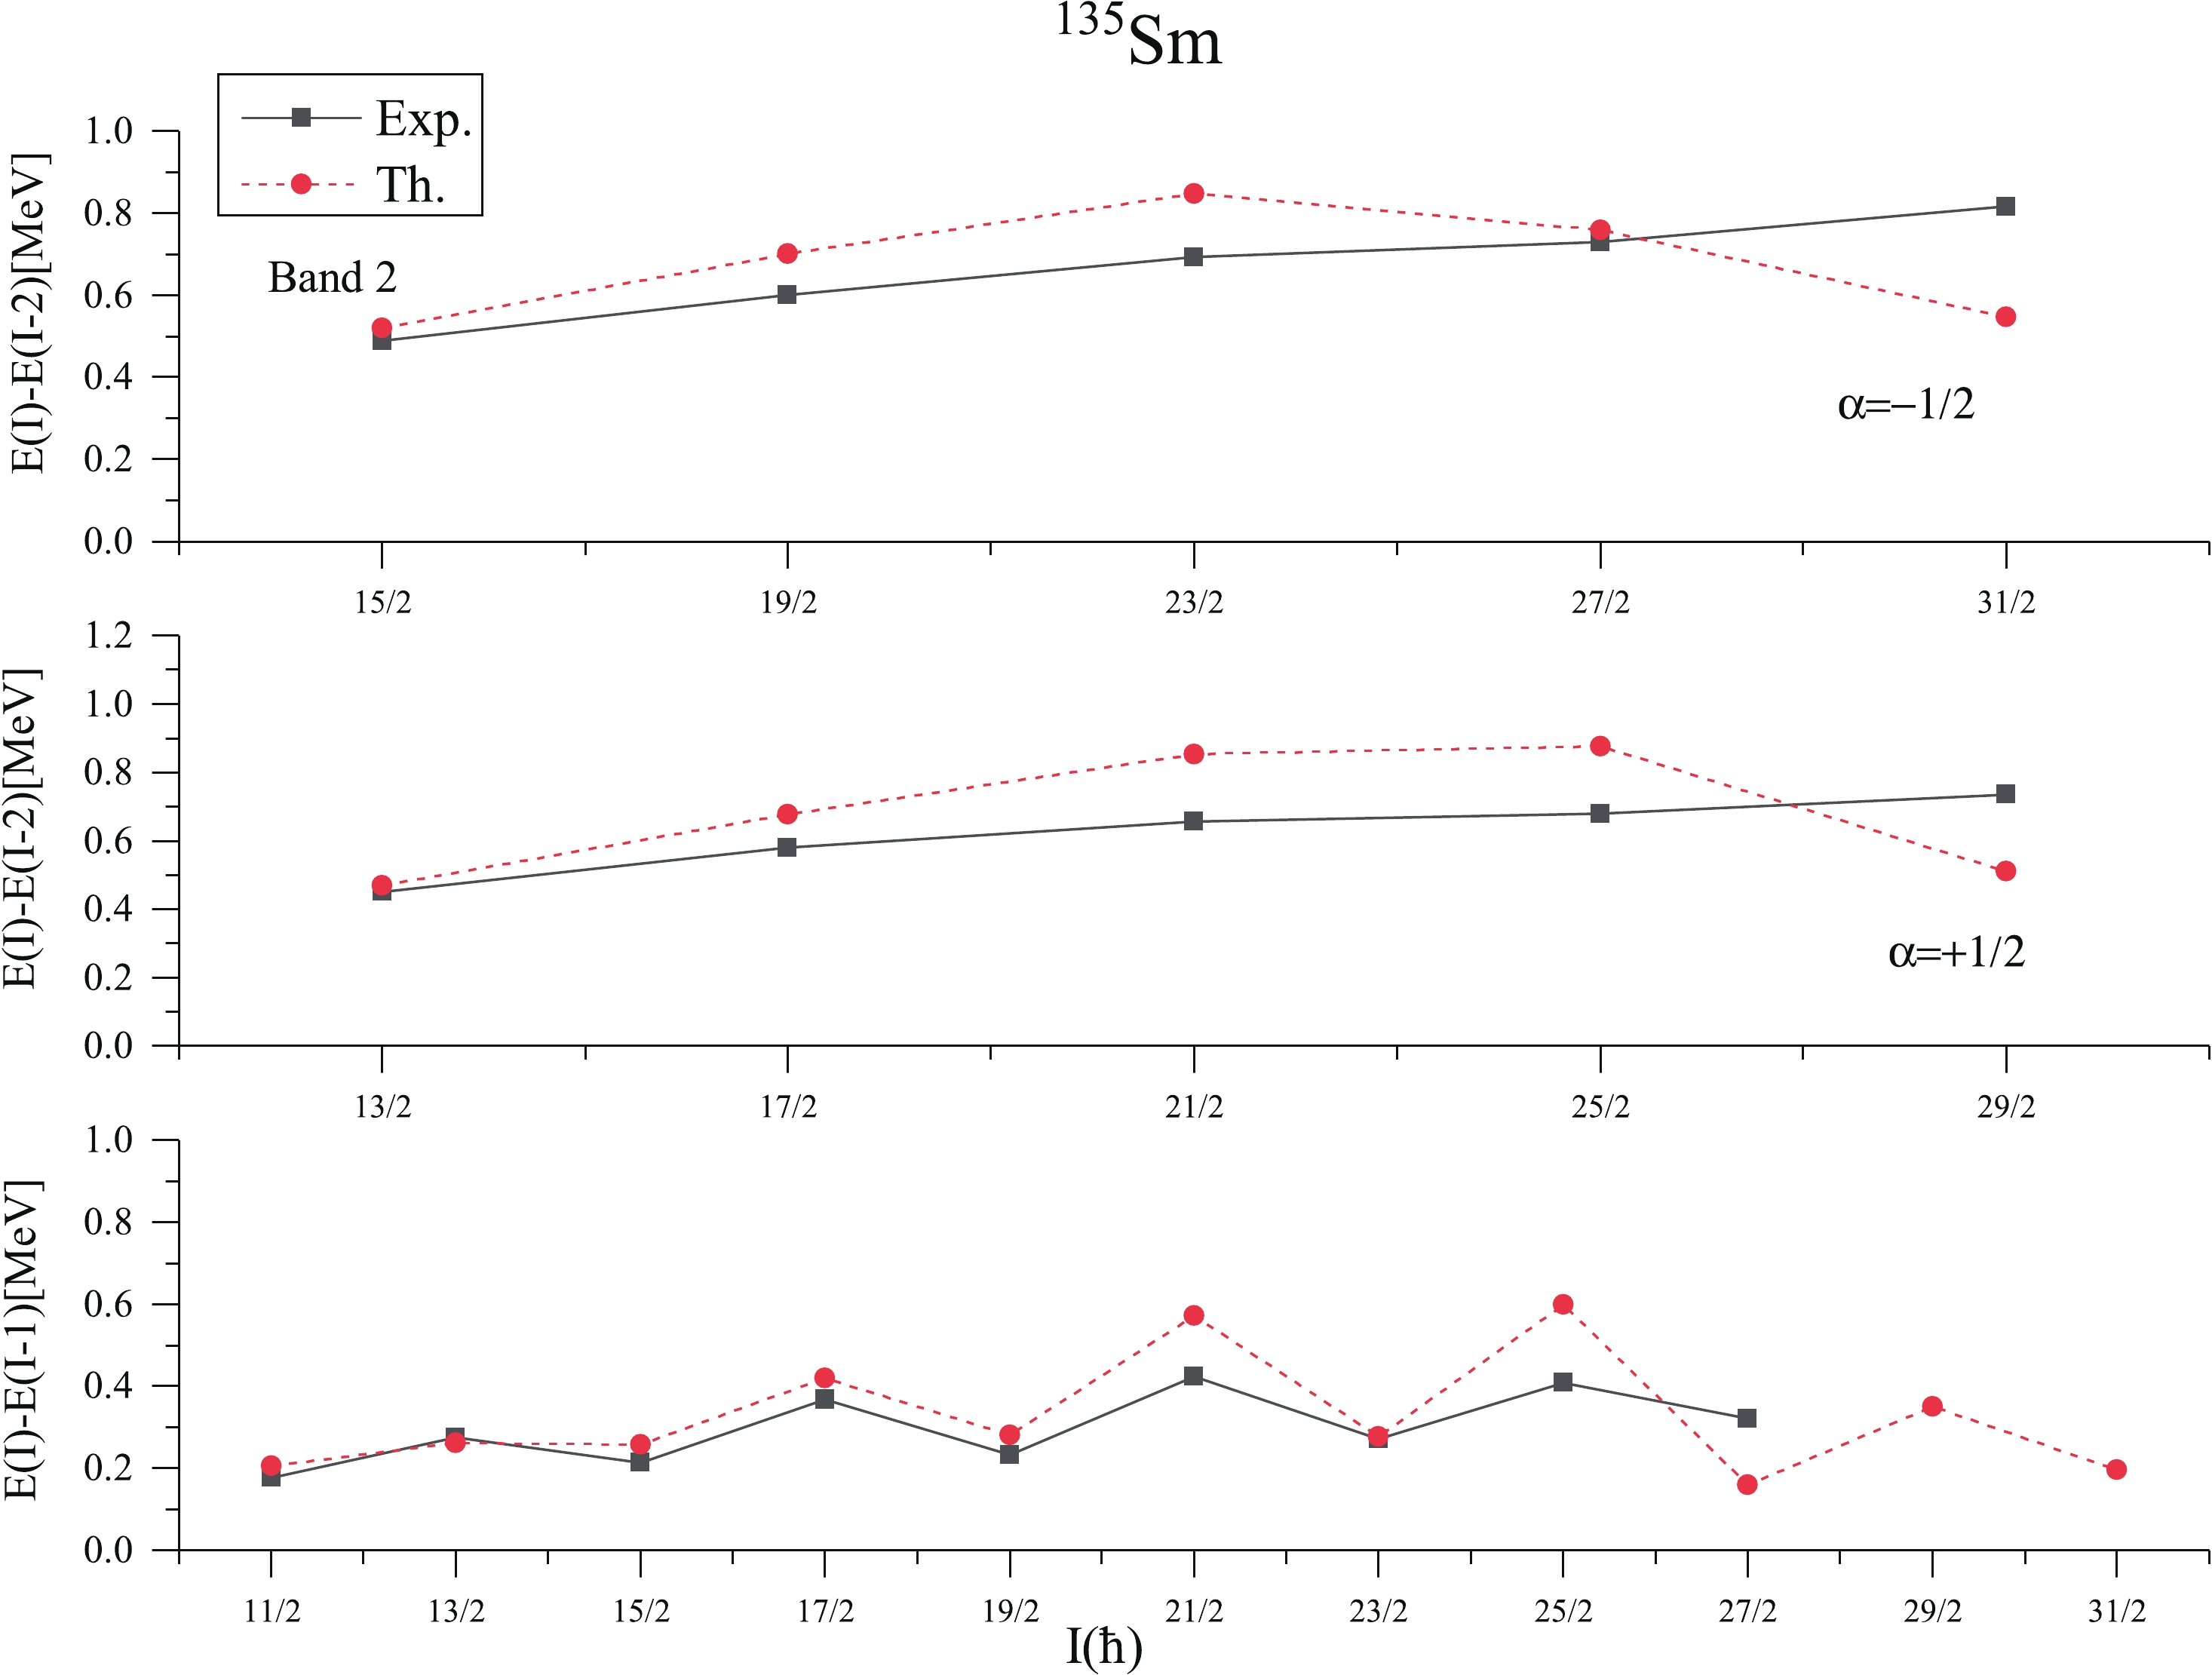 Figure11. (color online) Comparison of theoretical (Th.) and experimental (Exp.) [26] transition energy E(I)-E(I-2) and E(I)-E(I-1) versus spin angular momentum (I) for band 2 (
3
3.2.2.Discussion on band diagrams
In Fig. 12, we plot the relevant 1-qp and 3-qp positive parity bands in 135Sm, along with their configurations. From the Fig. 12, it is seen that 1-qp neutron band built on K=7/2 and having configuration 1ν7/2+[404](1g7/2) is lowest in energy up to the spin I=25/2+. This observation is consistent with the band head spin and configuration assigned to it by the authors of Ref. [5]. The yrast states of this band arise from 1ν7/2+[404](1g7/2) configuration up to I=23/2. However, at the spin 27/2+ band crossing occurs and 3-qp bands consisting of one neutron coupled to a pair of protons and having configurations 1ν7/2+[404]+{1π1/2?[550]+1π5/2?[532]}, K=13/2; 1ν7/2+[404]+{1π3/2?[541]+1π5/2?[532]}, K=9/2 and 1ν5/2+[413]+{1π3/2?[541]+1π5/2?[532]}, K=7/2, crosses the 1-qp, K=7/2 band. This band crossing causes a significant change in the yrast structure of 135Sm. Figure12. (color online) Band diagram for positive parity bands for 135Sm. Only low-lying and significant bands are taken.
The band diagram for negative parity states is shown in Fig. 13, in which only important 1-qp and 3-qp bands along with their configurations are shown. The dominant structure of the lowest negative parity band is K=9/2 state of the neutron 1h11/2 orbital up to the spin 13/2?. This is consistent with the band head spin and configuration assigned to this band by the authors of Ref. [26]. From the spin 15/2? to 23/2?, the lowest energy states are formed due to the contribution of different 1-qp bands having configurations 1ν7/2?[523](1h11/2), 1ν9/2?[514](1h11/2) and 1ν1/2?[541](2f7/2). It may be because of this configuration mixing at low spins, the calculated results show staggering in energies, which increases in magnitude with increase in spin up to the spin I=25/2?. This staggering in calculated ΔI=1 transition energies are well supported by the experimentally observed staggering in ΔI=1 transition energies (shown in Fig. 11). The staggering pattern is more clear from the plots of kinetic moment of inertia J(1) versus ω, presented in Fig. 14 for band 2.
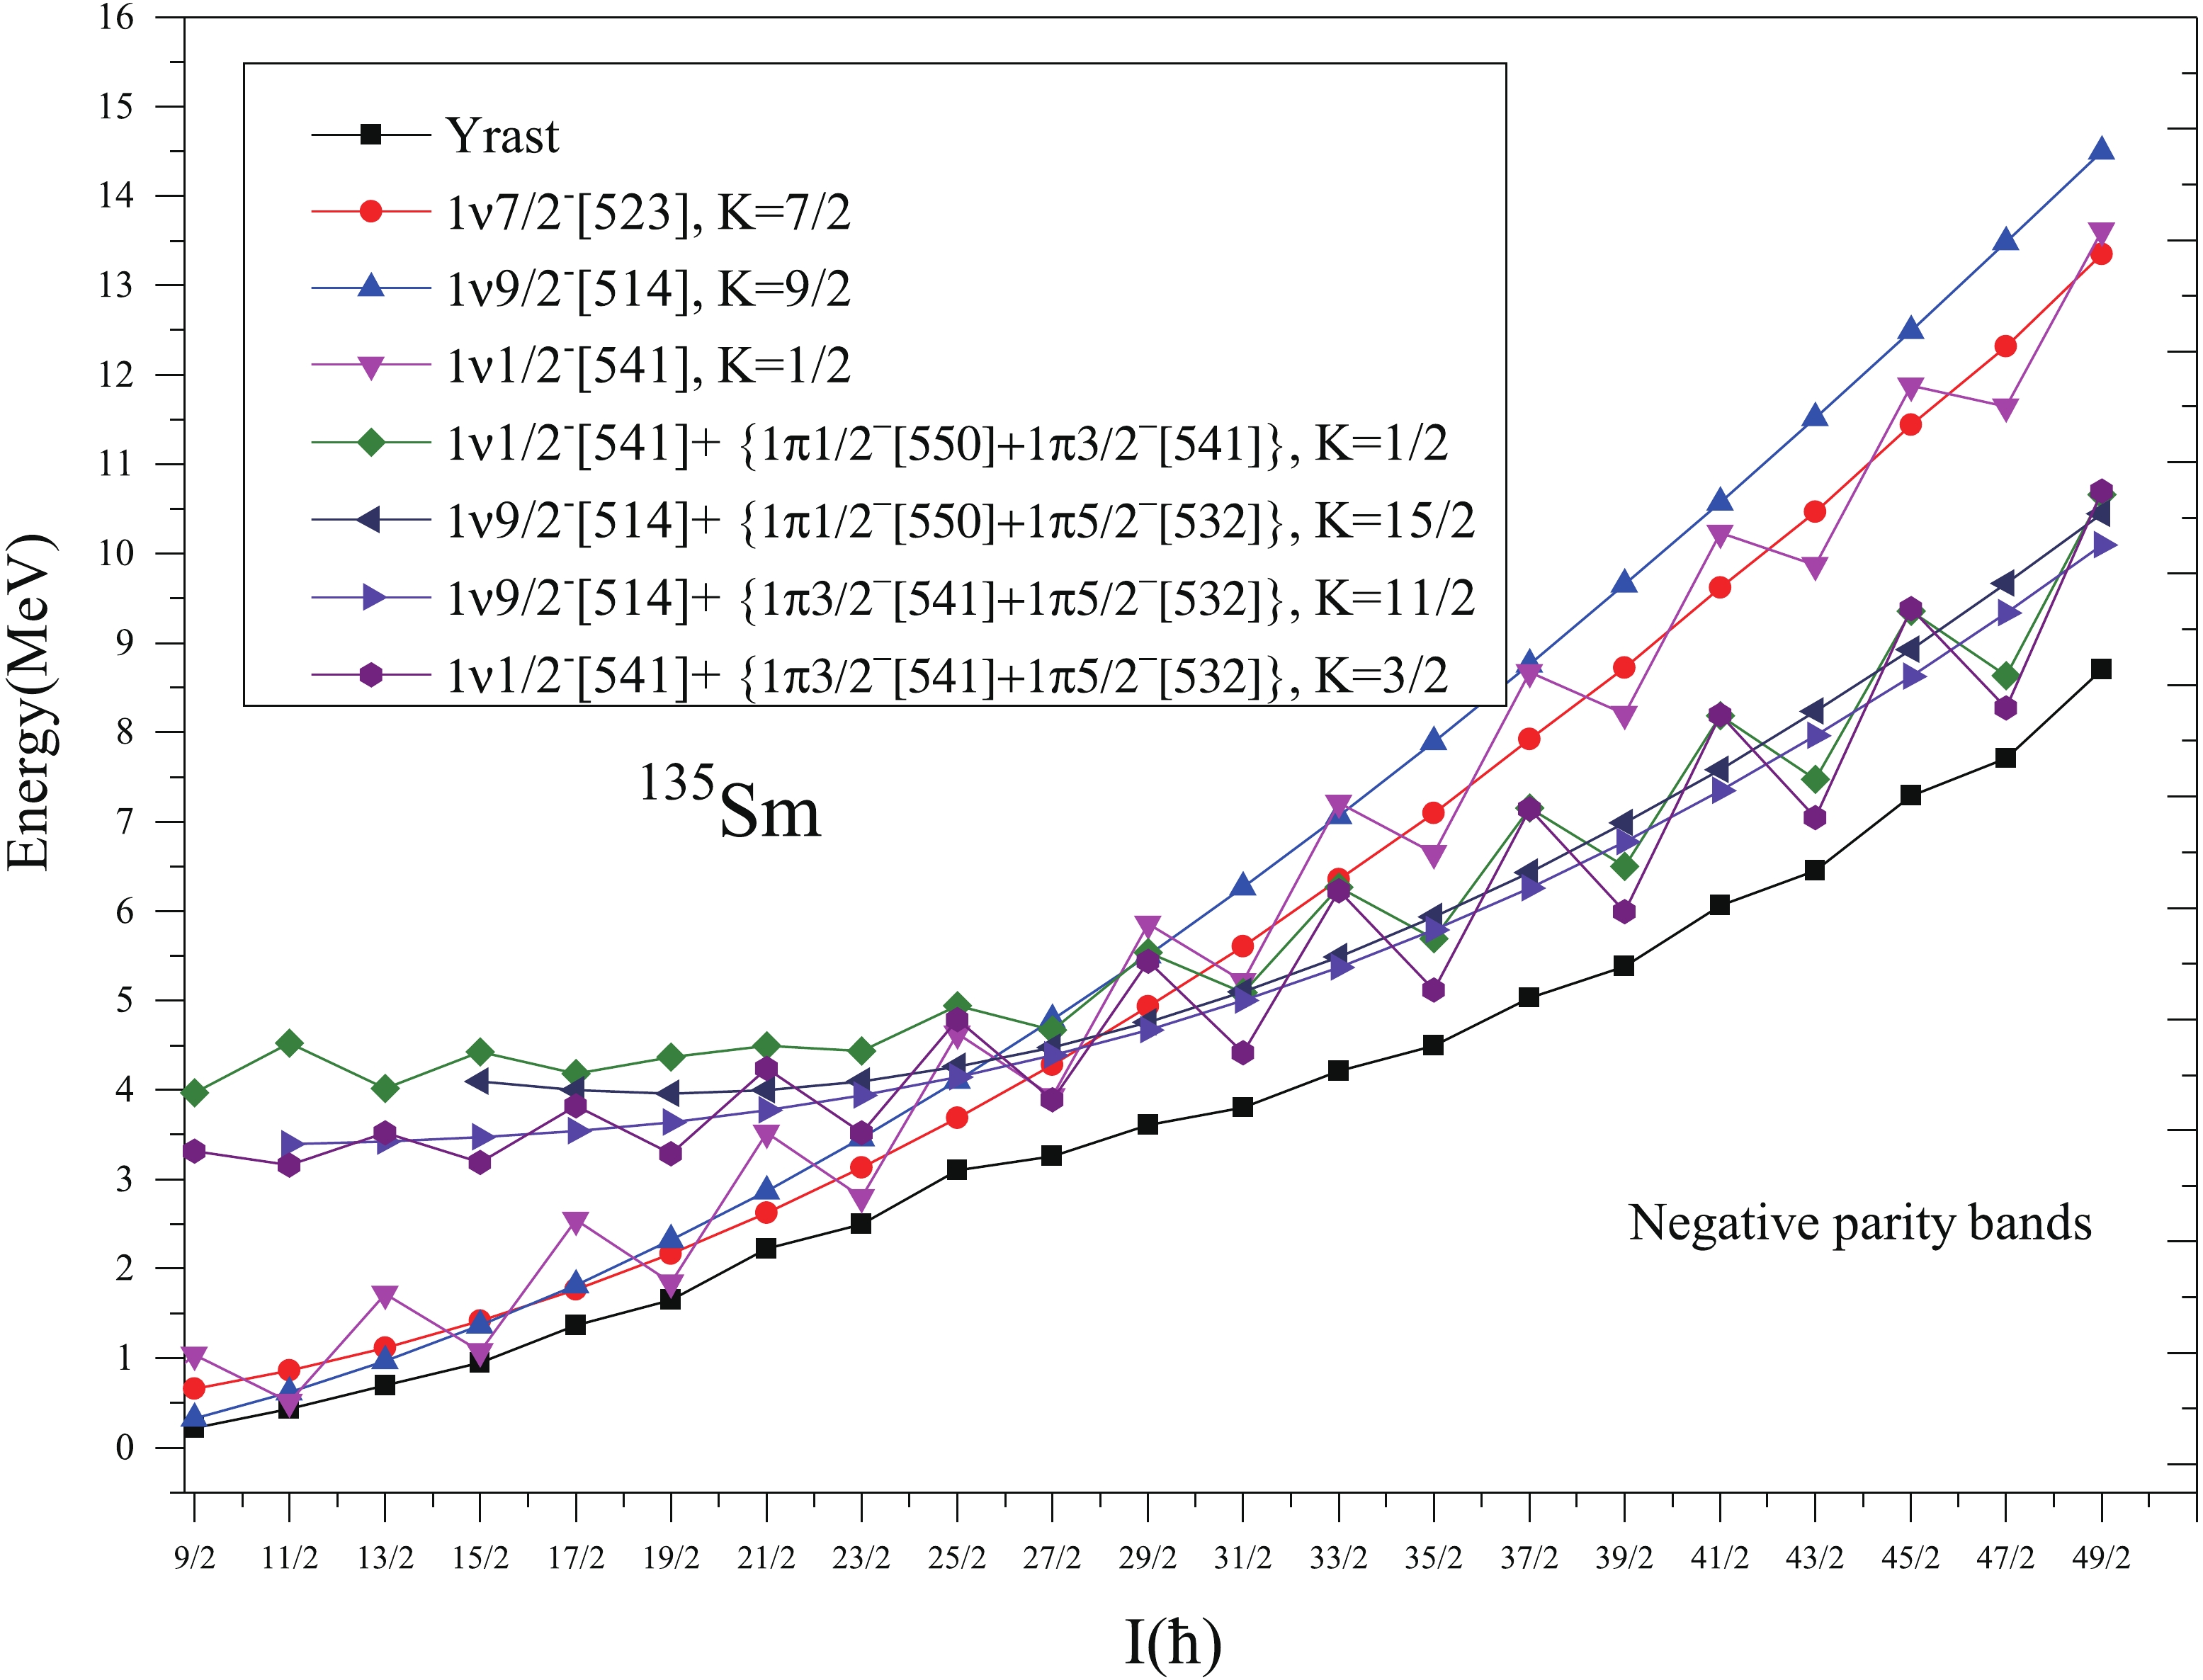 Figure13. (color online) Band diagram for negative parity bands for 135Sm. Only low-lying and significant bands are taken.
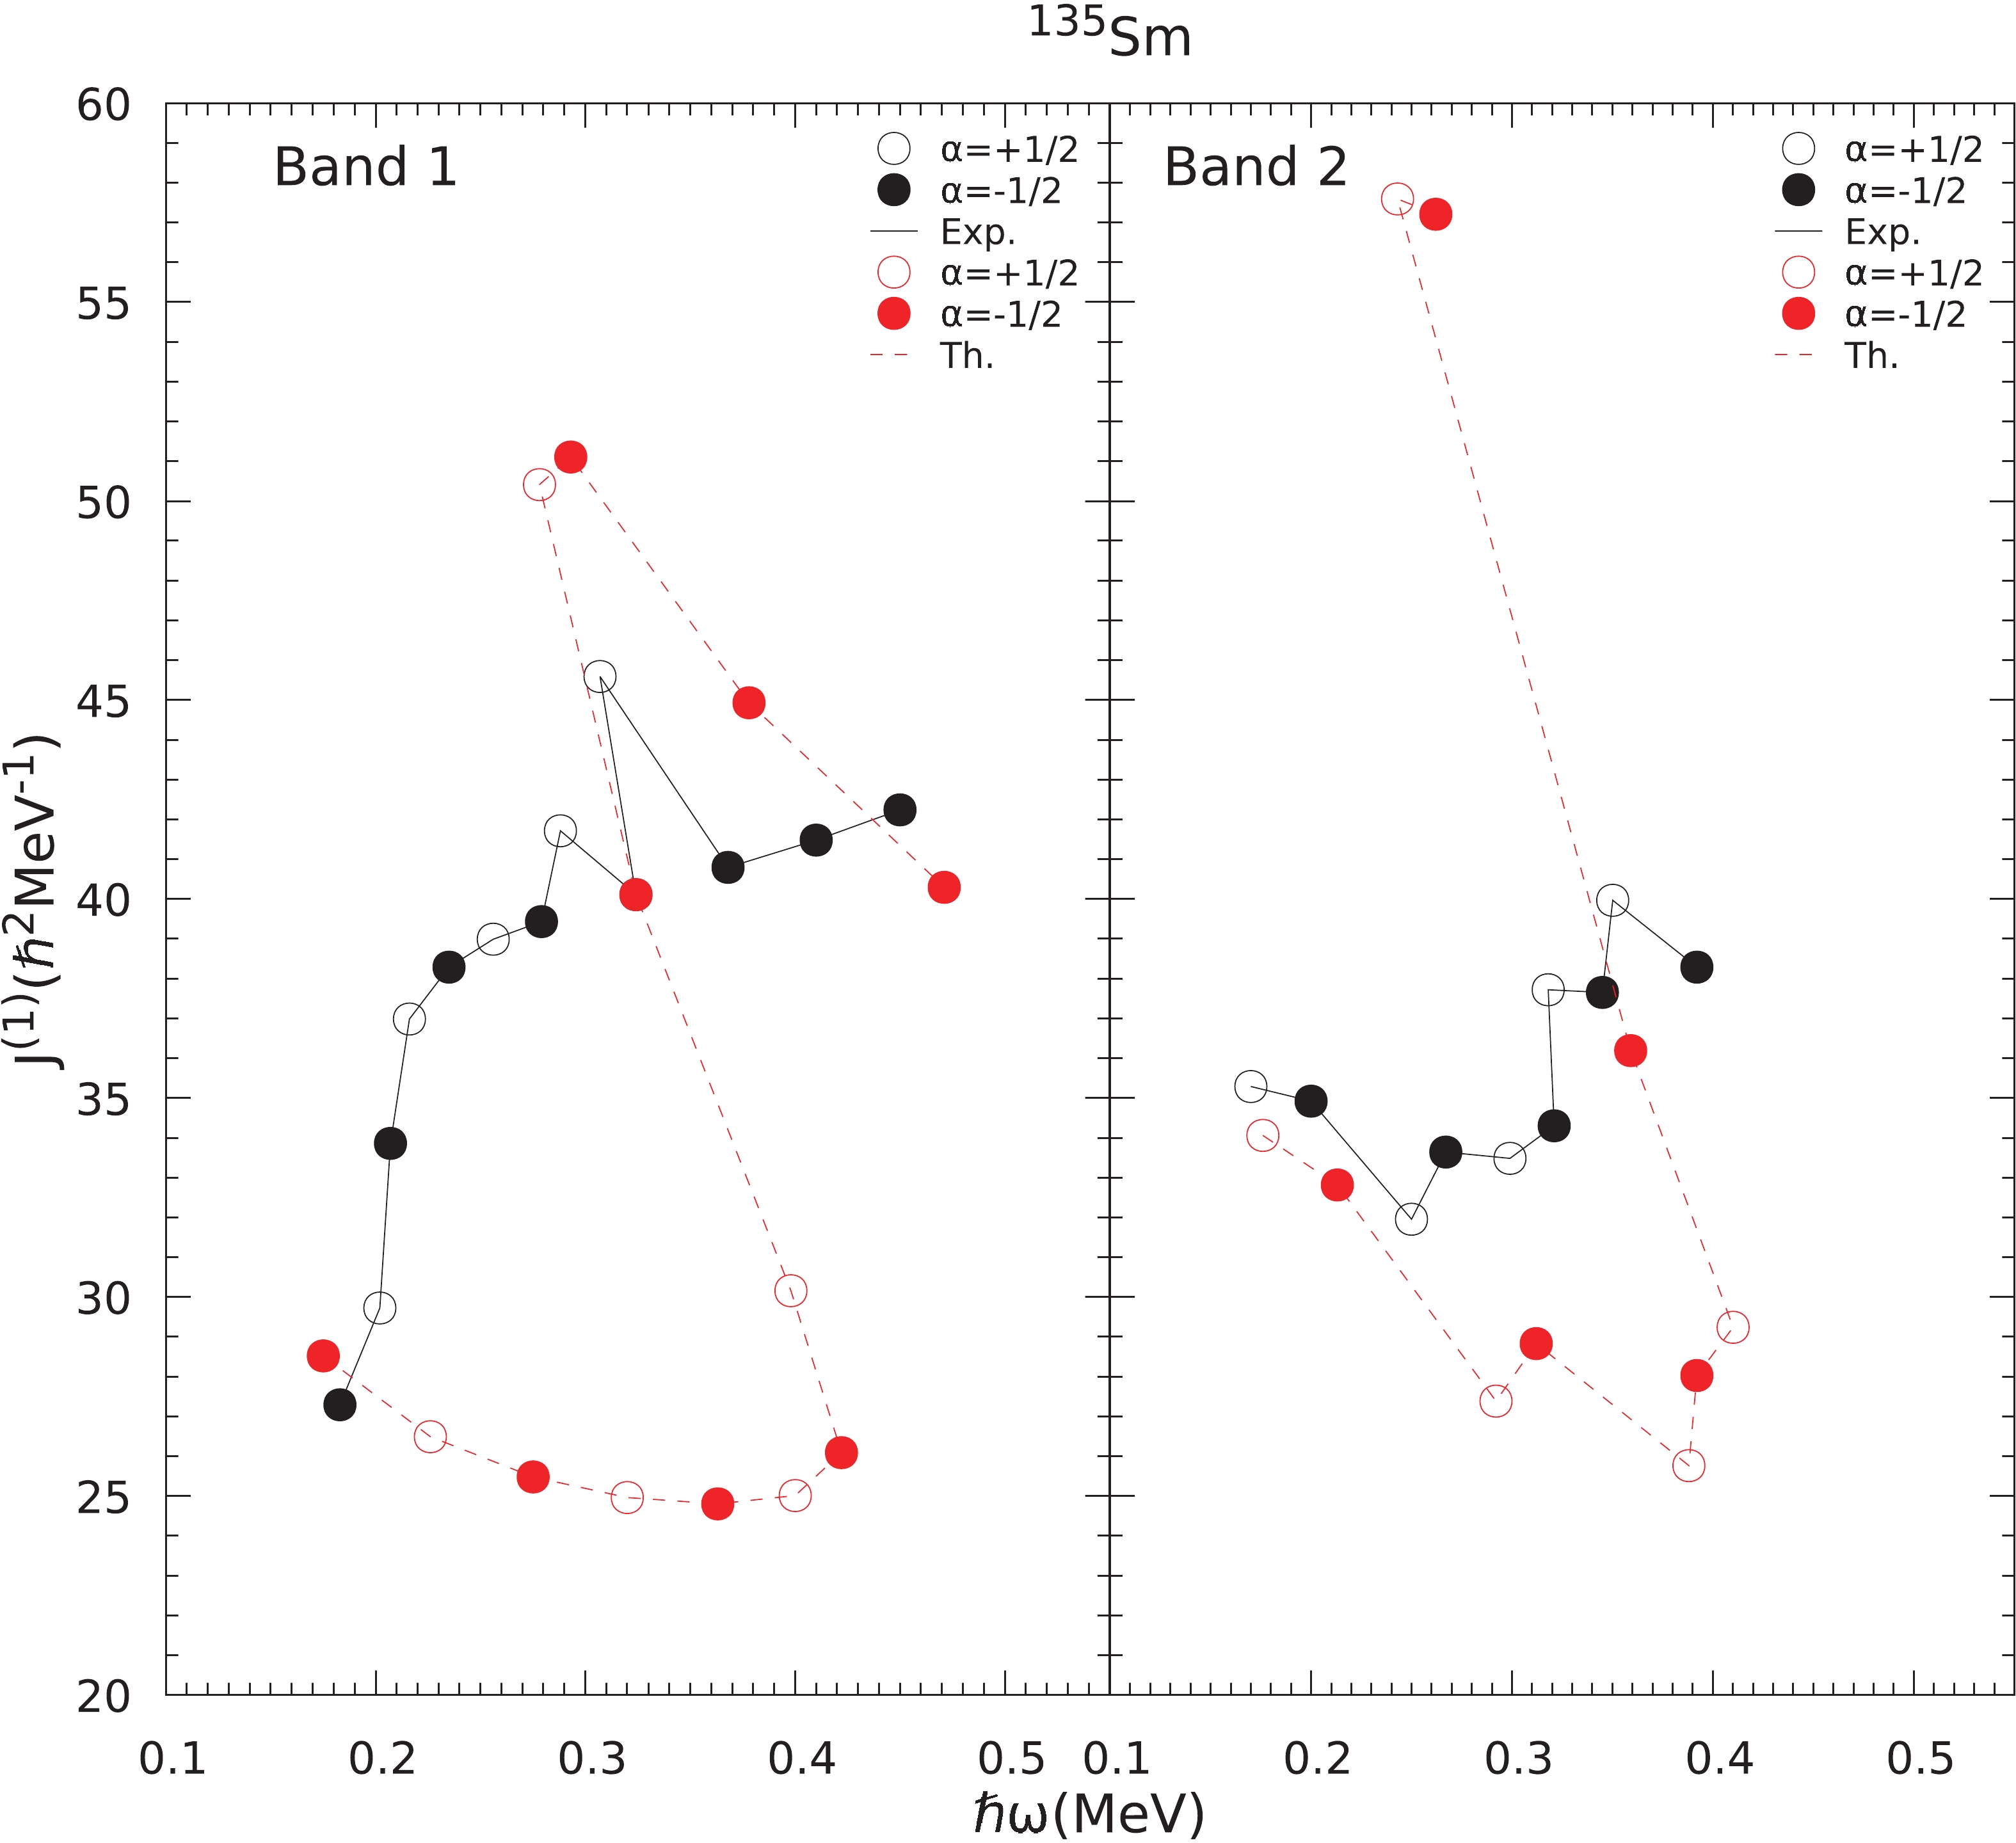 Figure14. (color online) Comparison of calculated and experimental kinetic moment of inertia J(1), for bands 1,2 as a function of rotational frequency (ω) in 135Sm.
3
3.2.3.Kinetic moment of inertia of bands 1 and 2
The comparison of calculated kinetic moment of inertia J(1) versus ω with the experimental ones for yrast bands 1 and 2 of 135Sm, is presented in Fig. 14. The calculated curve for band 1 shows a large increase in J(1) values at spin I=27/2 at rotational frequencyNow, coming to band 2, the comparison of calculated and experimental J(1) versus ω plots, presented in Fig. 14, for band 2, show the staggering pattern clearly. The calculated results reproduce the experimental zigzag pattern, nicely. However, the calculated values of J(1) show a large increase in J(1) at I=25/2 at
2
3.3.137Sm
33.3.1.Discussion on band spectra
In 137Sm, the experimental band spectra and band head energies of yrast negative and positive parity bands are confirmed experimentally [6,7,27]. Calculations are performed for 137Sm with the deformation parameters ε2=0.20 and ε4=0.04 for the yrast negative and positive parity bands 1 and 2, of 137Sm. These values of deformation parameters are the same as predicted for 137Sm by the authors of Refs. [24,25]. Figure 15 shows the calculated energy levels for yrast I=9/2- negative and I=7/2+ positive parity bands together with the experimental data of Ref. [27]. As one can see from the Fig. 15, the calculated experimental data of negative parity band 1 are reproduced very well by the present calculations. The difference between the experimental and calculated values at the highest known spin 43/2? is only 0.044 MeV. Now coming to the discussion on energy level spectra of the positive parity band built on band head spin Iπ =7/2+ and represented by band 2 in the Fig. 15, the energies of the experimental and calculated band head spins are almost same. It means the experimental energy of the band head spin 7/2+ of this positive parity band is exactly reproduced. The difference between experimental and calculated values at the highest known spin 37/2+ of band 2 is 0.429 MeV. Figure15. (color online) Comparison of theoretical (Th.) energy levels with the available experimental (Exp.) data [27] for negative parity band 1 and positive parity band 2 of 137Sm.
3
3.3.2.Discussion on band diagrams
Figure 16 shows relevant 1-qp and 3-qp bands of negative parity along with their configurations for 137Sm. From the figure, it is evident that the dominant structure of yrast band up to the spin 15/2? is K=9/2 state of neutron h11/2 orbital, which is consistent with the band head spin and configuration observed for this band by the authors of Refs. [6,7,27]. At the spin I=17/2?, another 1-qp neutron 2f7/2 band interacts with this 1-qp h11/2 band and energy states of the yrast band from the spin I=19/2? to I=23/2? are predominantly arising from K=1/2 state of 1ν2f7/2 orbital. Around the spin I=25/2?, the 1-qp neutron bands are crossed by two 3-qp bands consisting of single neutron coupled to a pair of protons with configurations 1ν9/2?[514]+{1π1/2?[550]+1π3/2?[541]}, K=11/2 and 1ν9/2?[514]+{1π1/2?[550]+1π5/2?[532]}, K=15/2. This band crossing causes a significant change in the yrast structure of 137Sm and the yrast states of negative parity band above I=23/2 are predicted to arise from the superposition of these two 3-qp bands.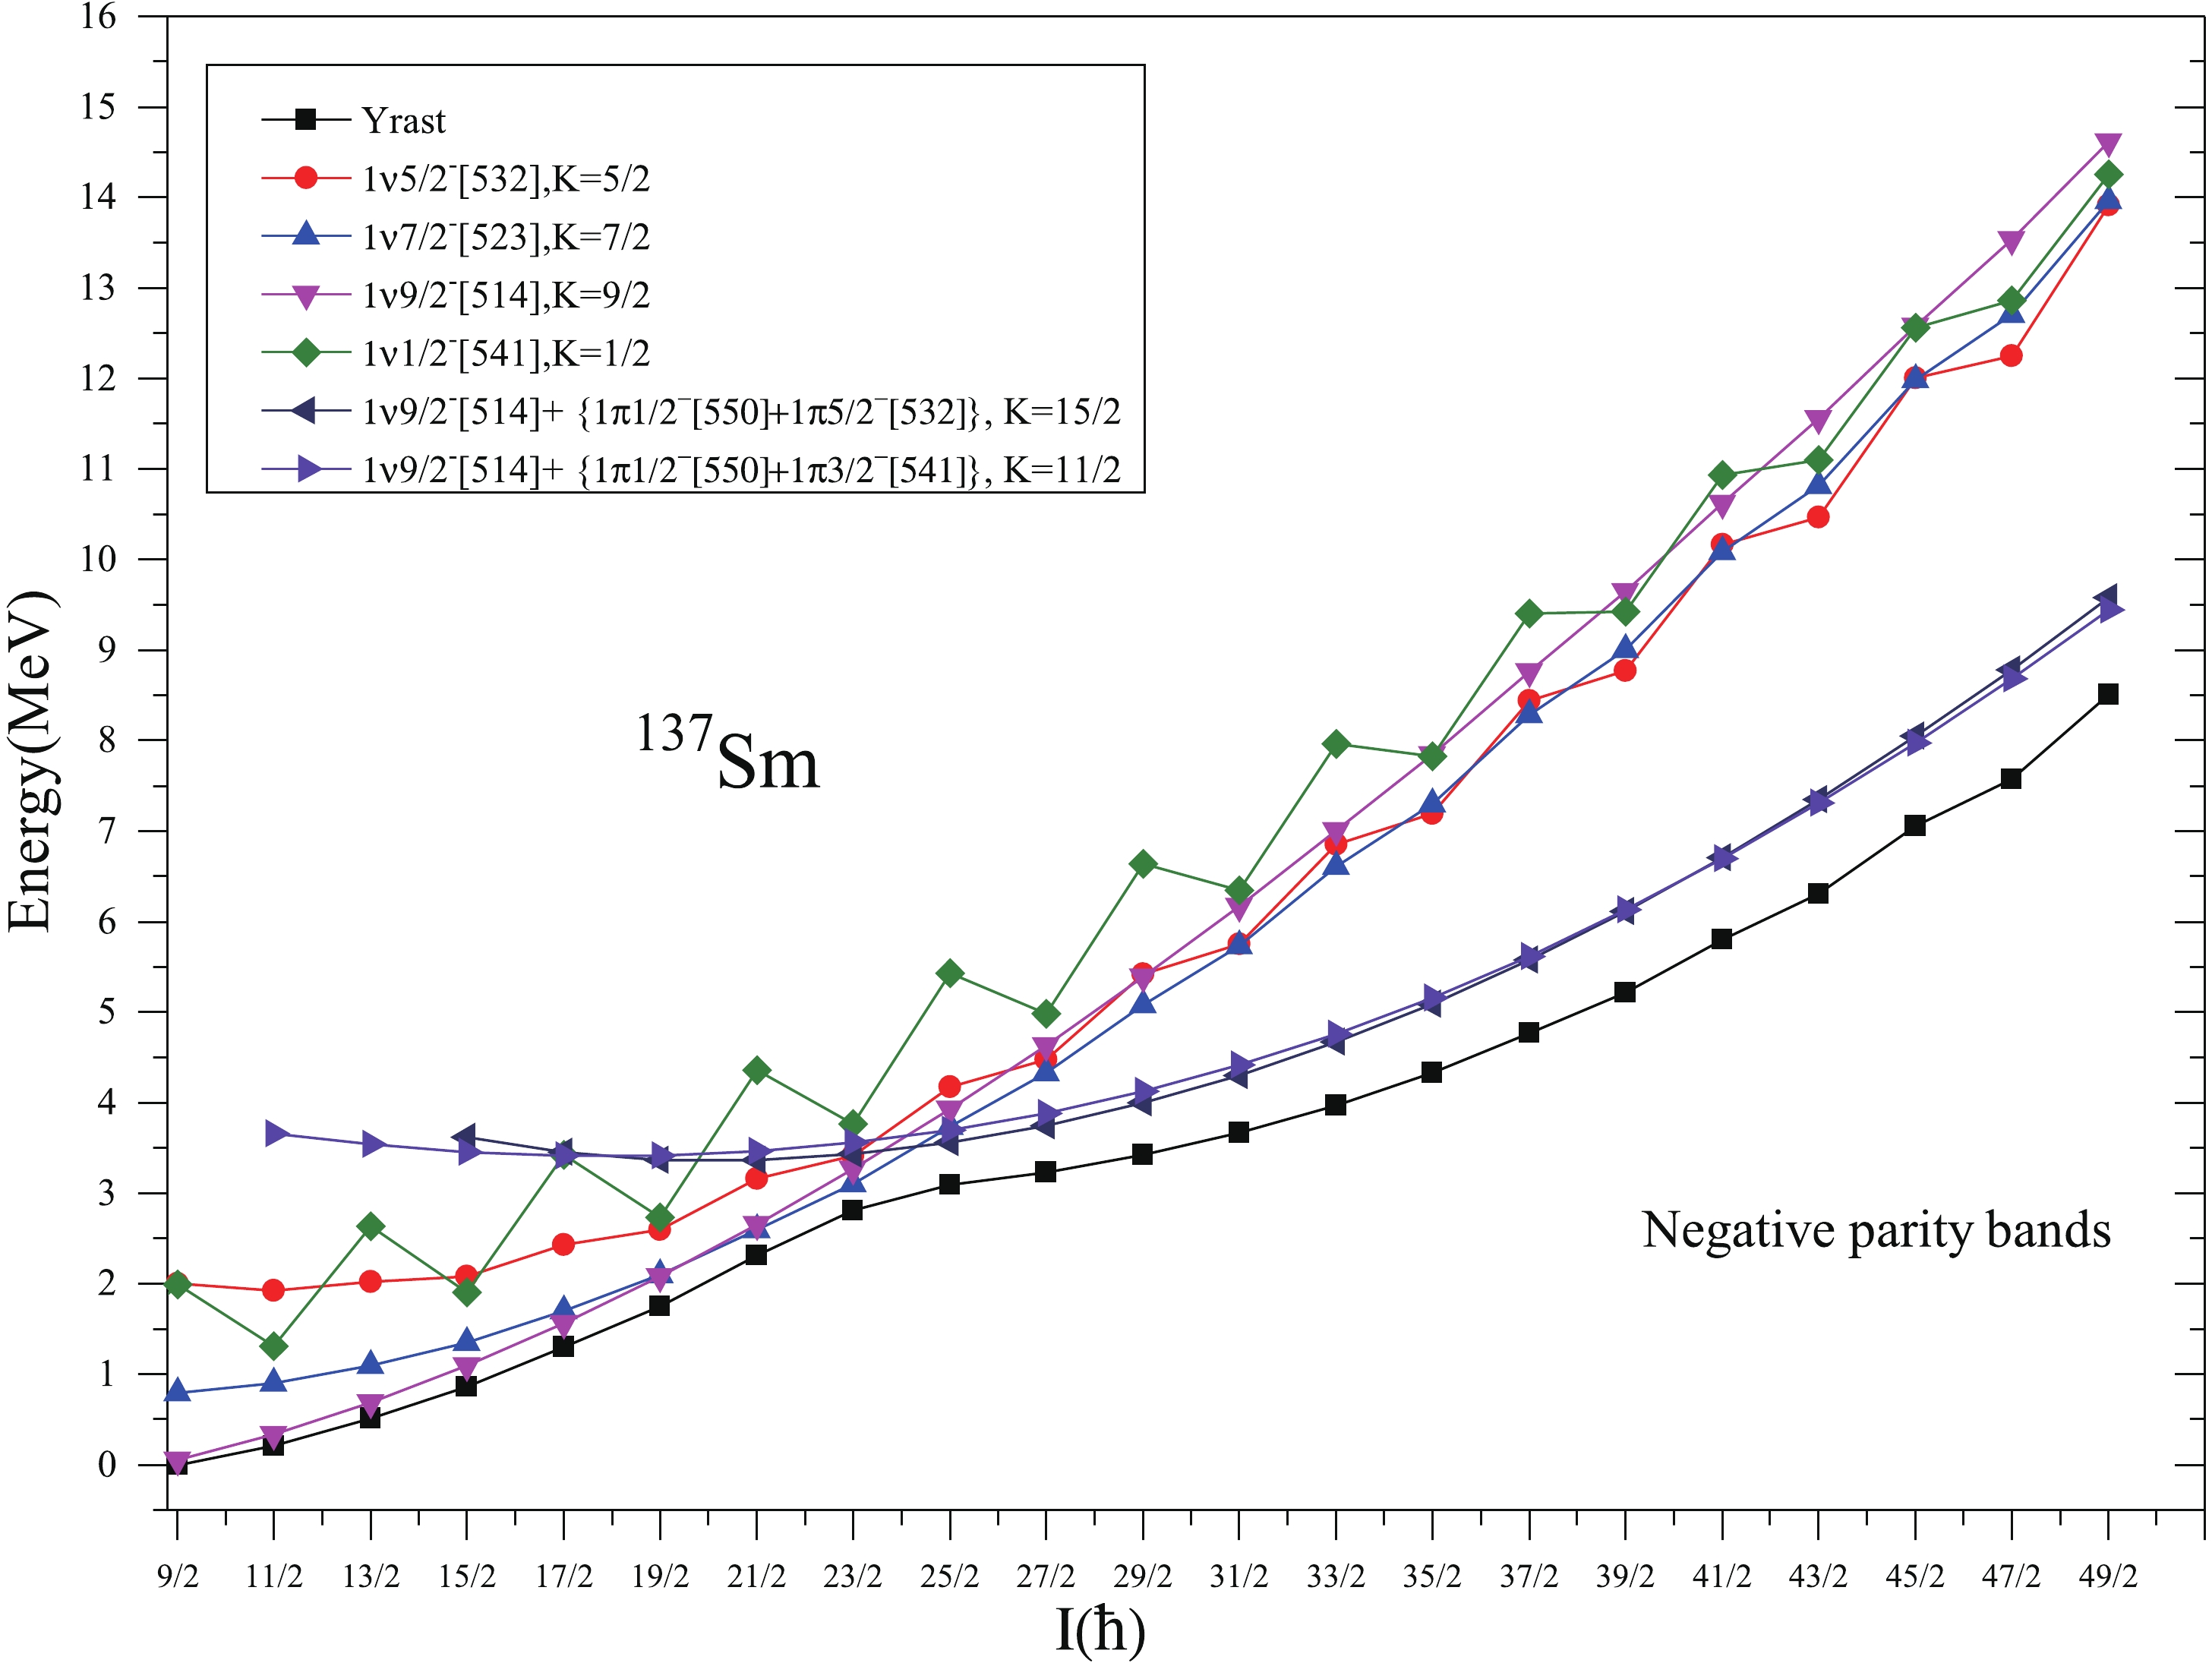 Figure16. (color online) Band diagram for negative parity bands for 137Sm. Only low-lying and significant bands are taken.
Figure 17 represents the band diagram for positive parity bands of 137Sm. From this figure, it can be seen that the 1-qp neutron band from K=7/2 state of neutron orbital g7/2 is lowest in energy from all the other positive parity bands. This lowest energy band of positive parity goes monotonically up to the spin I=21/2+. The authors of Ref. [8] proposed this band to originate from the K=1/2 state of neutron d3/2 orbital. However, reasonably good agreement with the experimental energies for whole of this band support it to arise from the predicted configuration 1ν7/2+[404](1g7/2) for this band. Further, at the spin I=23/2+, band crossing by multiple 3-qp bands causes a significant change in the energy states of the lowest positive parity states. It can be predicted that after the band crossing the lowest positive parity states has a composite structure and are predicted to arise from the superposition of multi 3-qp bands whose configurations are shown in the Fig. 17.
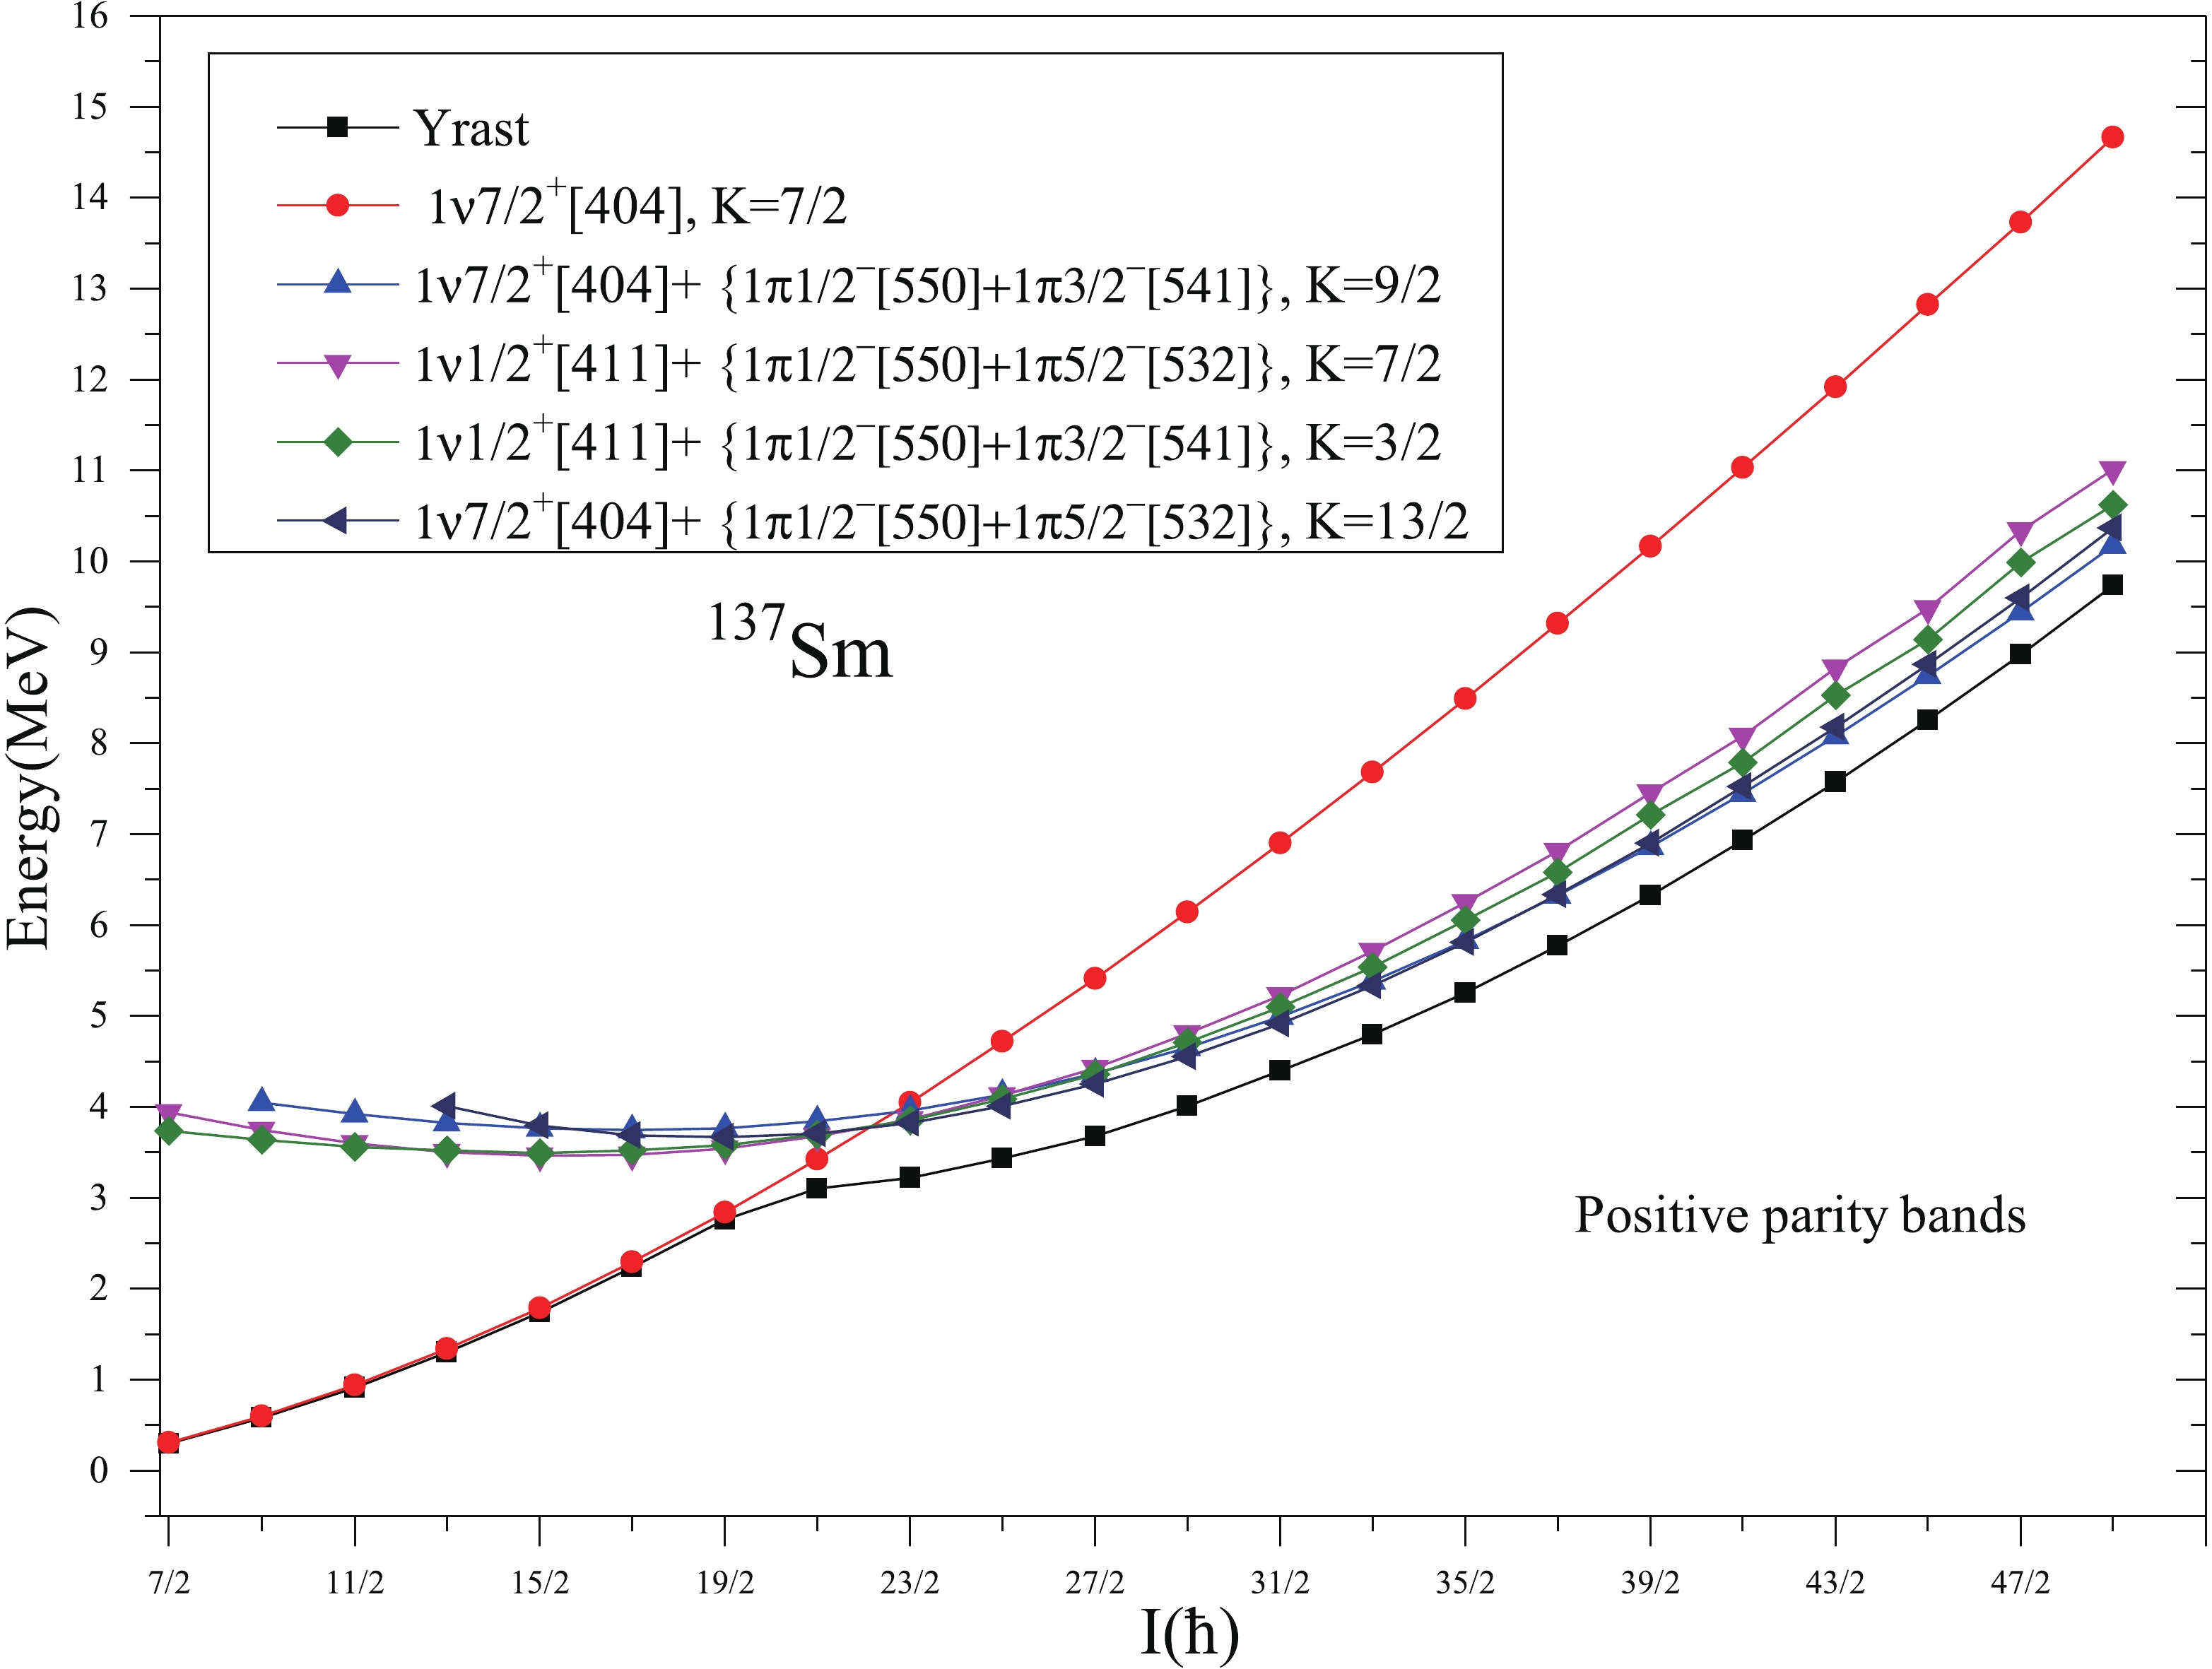 Figure17. (color online) Band diagram for positive parity bands for 137Sm. Only low-lying and significant bands are taken.
3
3.3.3.Discussion on Kinetic moment of Inertia
The experimental and calculated J(1) versus ω plots for 137Sm are displayed in Fig. 18. From this figure, it is observed that for negative parity band 1, both the experimental and calculated results show the phenomenon of backbending at the same spin I=25/2? and at rotational frequencies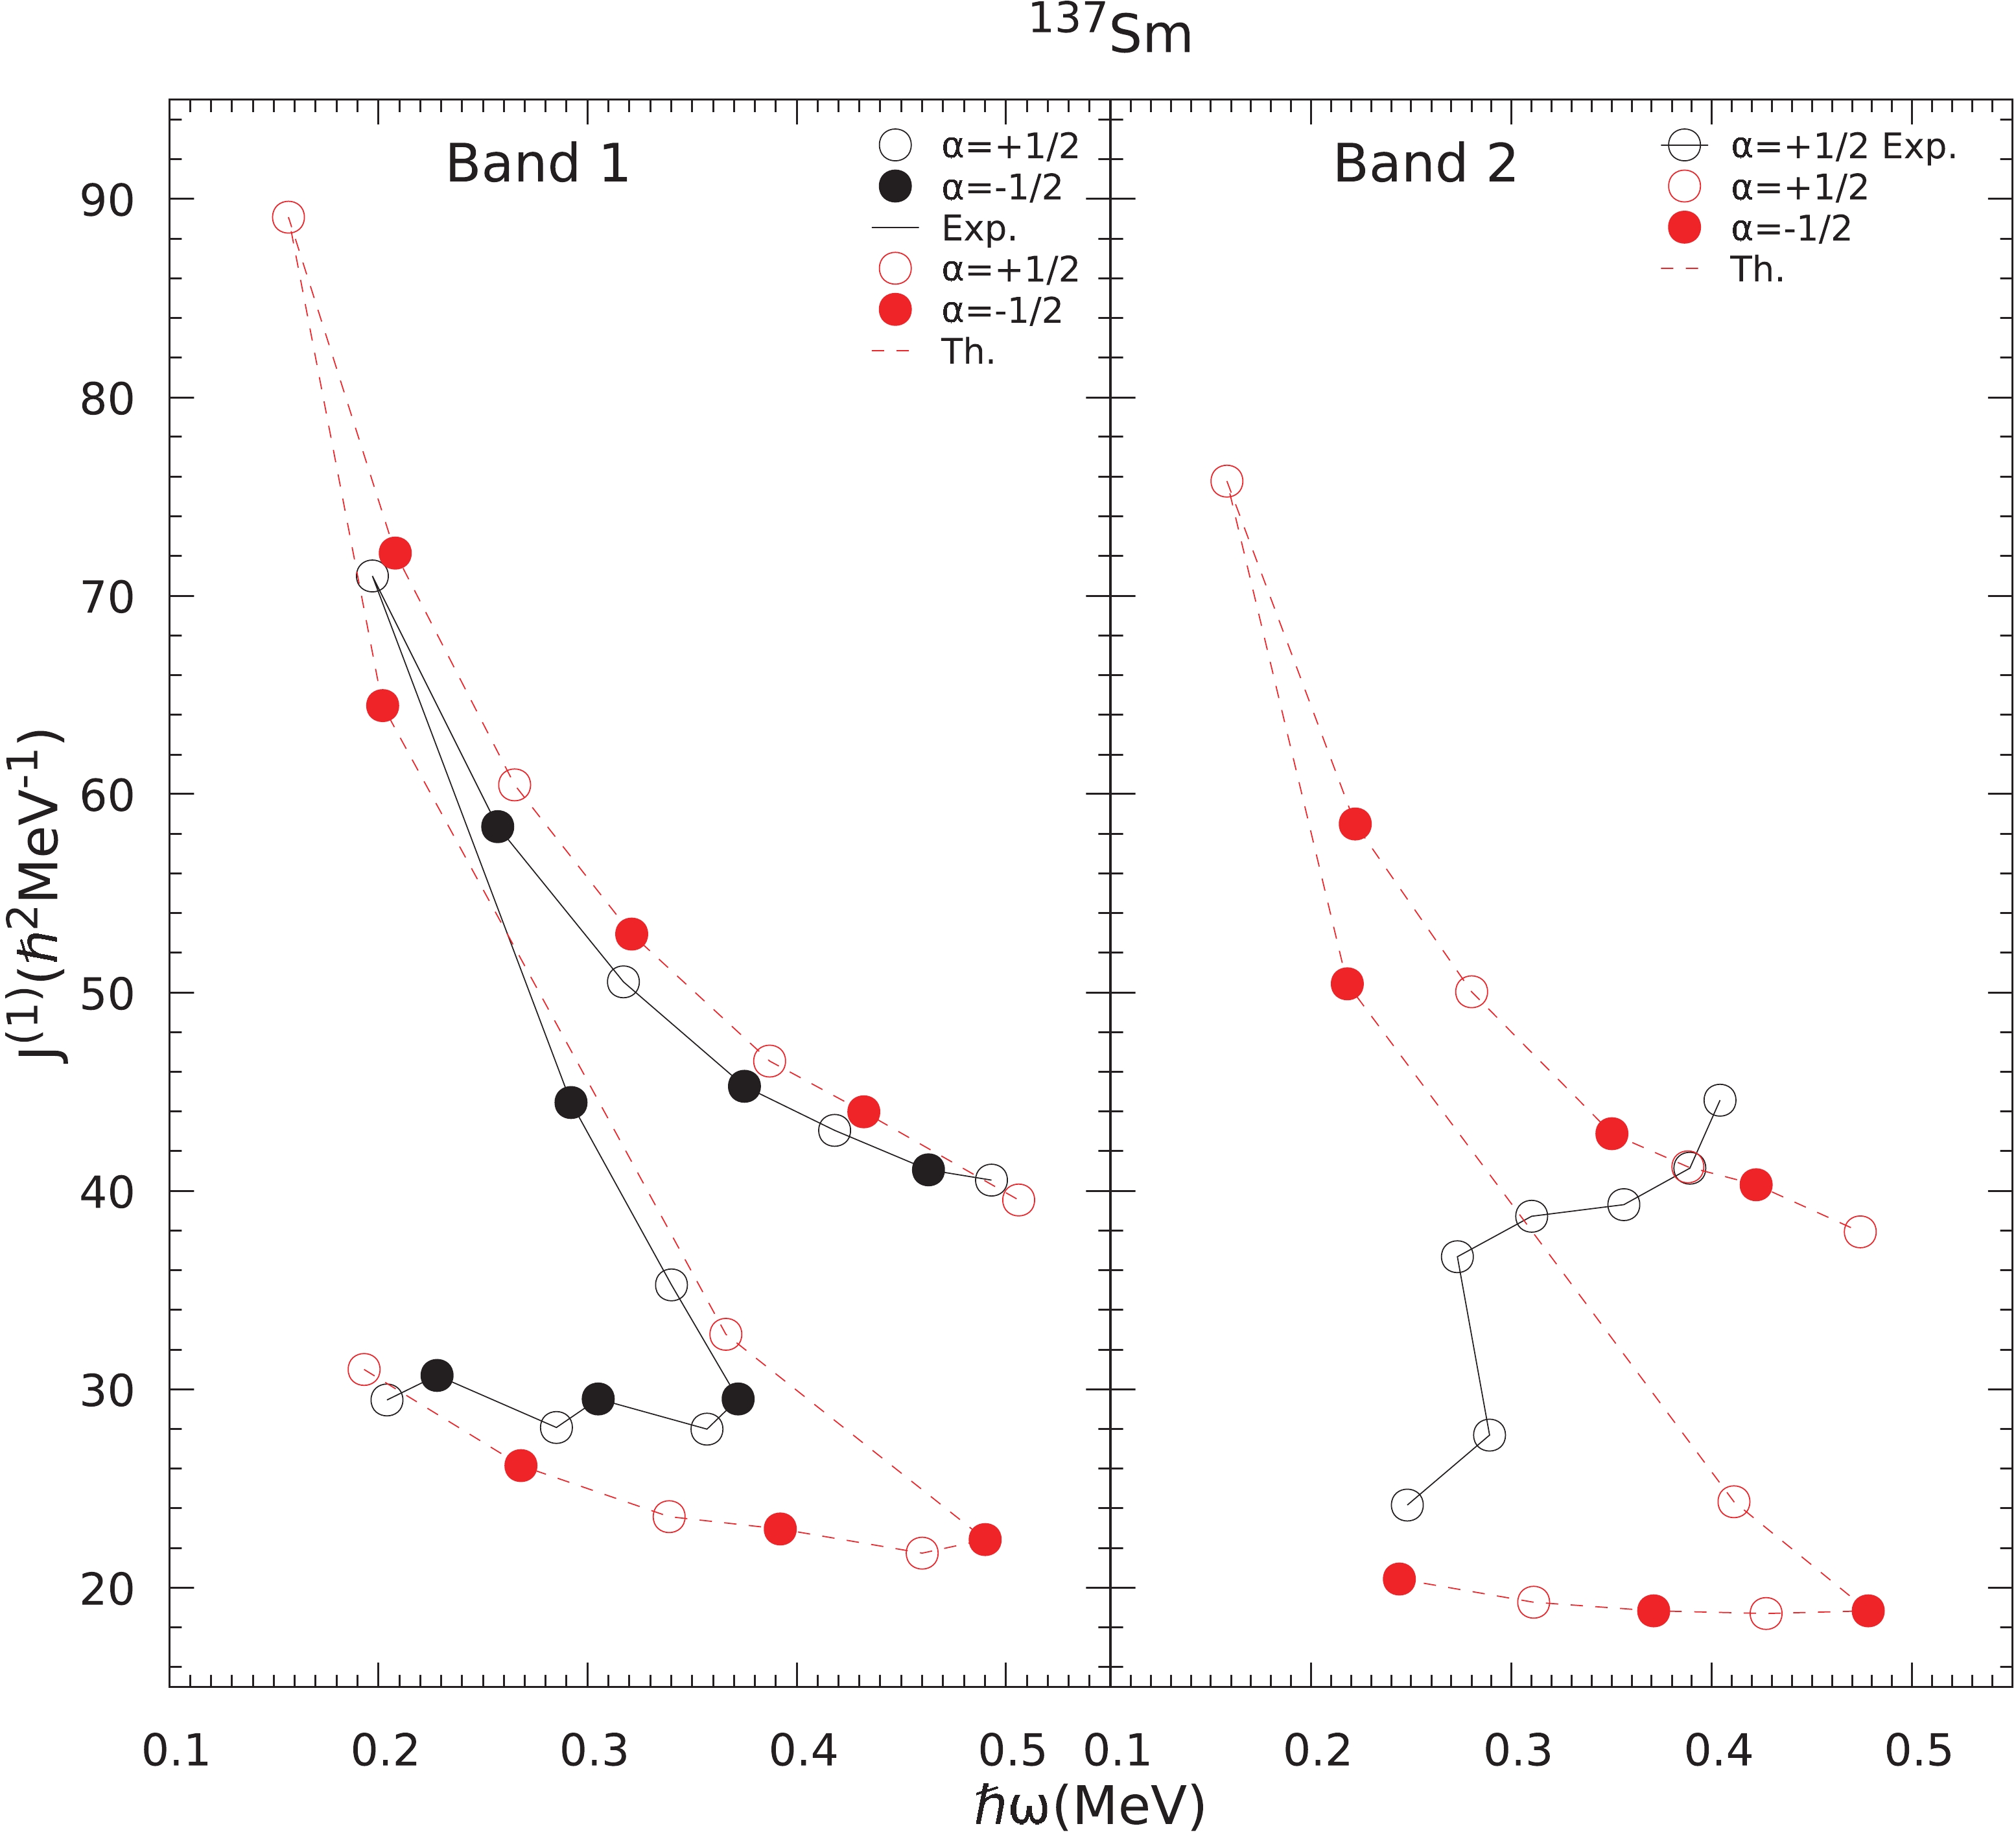 Figure18. (color online) Comparison of calculated and experimental kinetic moment of inertia J(1), for bands 1,2 as a function of rotational frequency (ω) in 137Sm.
Similarly, the J(1) versus ω, plots of positive parity band 2, presented in the same figure, show the phenomenon of backbending in the experimental and calculated results at the same spin I=21/2+ and at rotational frequencies
The calculation of electromagnetic transition probabilities [30] are important for the reliability of the wave functions generated by Eq. (1). The reduced electric quadrupole transition probability B(E2) from an initial state Ii =I to a final state If =I-2 is given by
$B\left( {E2,{I_i} \to {I_f}} \right) = \frac{{{e^2}}}{{\left( {2{I_i} + 1} \right)}}{\left| {\left\langle {{\sigma _f},{I_f}\left\| {{{\hat Q}_2}} \right\|{\sigma _i},{I_i}} \right\rangle } \right|^2},$  |
The B(M1) transition probability from an initial state Ii = I to a final state If = I-1 is calculated by using the relation
$B\left( {M1,{I_i} \to {I_f}} \right) = \frac{{\mu _N^2}}{{2{I_i} + 1}}{\left| {\left\langle {{\sigma _f},{I_f}\left\| {{{\hat M}_1}} \right\|{\sigma _i},{I_i}} \right\rangle } \right|^2}$  |
$g_l^\pi = 1\;\;\;\;g_s^\pi = 5.59\;\times \;0.75\;\;\;\;\;\;g_l^v = 0\;\;\;\;\;g_s^v = - 3.826\;\times \;0.75$  |
2
4.1.Results and discussion on transition strength (B(M1)/B(E2)) ratios of 133Sm
The experimental data on B(E2) and B(M1) transition probabilities is not available for 133-137Sm isotopes, but the experimental data [4,6,8] on B(M1)/B(E2) ratios is available for low spin states of 133,137Sm. Therefore, B(M1)/ B(E2) ratios are presented in Table 2 for comparison with the available experimental data and the results are discussed in the following subsections.| Nucleus | Positive parity yrast bands 1 and 2 | Negative parity yrast bands 5 and 6 | |||
| (a) 33Sm | Spin (I) | B(M1)/B(E2) (μn/eb)2 | B(M1)/B(E2) (μn/eb)2 | ||
| Exp. [4] | Th. | Exp. | Th. | ||
| 9/2 | 0.766±0.251 | 0.936 | ? | ? | |
| 11/2 | 0.782±0.190 | 0.633 | 0.372±0.114 | 0.749 | |
| 13/2 | 0.827±0.159 | 0.530 | 0.300±0.200 | 0.487 | |
| 15/2 | 0.570±0.123 | 0.476 | 0.349±0.143 | 0.402 | |
| 17/2 | 0.452±0.092 | 0.441 | 0.306±0.200 | 0.360 | |
| 19/2 | 0.415 | 0.336 | |||
| 21/2 | 0.394 | 0.319 | |||
| 23/2 | 0.373 | 0.308 | |||
| 25/2 | 0.353 | 0.297 | |||
| 27/2 | 0.325 | 0.292 | |||
| 29/2 | 0.278 | 0.279 | |||
| 31/2 | 0.179 | 0.276 | |||
| 33/2 | 0.098 | 0.255 | |||
Table2.Comparison of calculated B(M1)/B(E2) ratios with the available experimental data [4,6,8] for (a) 133Sm, (b) 135Sm and (c) 137Sm.
3
4.1.1.Positive parity bands 1 and 2
The experimental data on B(M1)/B(E2) ratios is known up to spin I=17/2 only. The comparison of calculated B(M1)/B(E2) ratios with the available experimental data [4] is represented in Table 2. The agreement between calculated transition strengths and available experimental values is good except at the angular momentum state 13/2+. The experimental data, show an increase in B(M1)/B(E2) values as one moves from spin I=9/2 to 13/2, and a decrease from I=13/2 to 17/2. The calculated results predict a decreasing trend with spin up to the band crossing spin I=33/2, thereby, showing a change in the structure of bands 1 and 2 around the band crossing region.3
4.1.2.Negative parity bands 5 and 6
The comparison of calculated and available experimental [4] transition strength ratios B(M1)/B(E2) for negative parity bands is also presented in Table 2(a). From this table, it is observed that the present calculations have nicely reproduced the transition strength ratios for negative parity yrast band for I=13/2 to I=17/2. The calculated B(M1)/B(E2) values show a slow decrease with spin from I=13/2 to I=33/2 thereby, showing no abrupt change in the structure of yrast negative parity bands.2
4.2.Results and discussion on transition strength ratios of 135,137Sm
In case of 135Sm, the experimental data on electromagnetic transition probabilities are not available. The values for B(M1)/B(E2) ratios have been predicted for yrast positive parity band and are presented in Table 2(b). The calculated B(M1)/B(E2) ratios show a decrease in their values from spin I=11/2 to 13/2 and after that these values are nearly constant up to spin I=21/2. At spin I=29/2, these values show an increase due to the change in structure of the yrast positive parity band after the band crossing region.The comparison of calculated and experimental B(M1)/B(E2) ratios for 137Sm is presented in Table 2(c). The negative parity band which is a ground state yrast band, in this nucleus has two sets of experimental data [6,8] on B(M1)/B(E2) ratios up to spin I=21/2. The observed trend of B(M1)/B(E2) ratios of Ref. [8] is reasonably reproduced by the present calculation except at the spin I=19/2? as can be seen in the Table 2(c). The increase in the B(M1)/B(E2) values at the spin I=19/2? is not reproduced by the present calculation. The predicted values of B(M1)/B(E2) show a sharp decrease at spin I=27/2 and then an increase at spin I=29/2, which can be attributed to the alignment of protons in the down slopping K-components of π(h11/2)2 orbitals.
In 133Sm all the seven experimentally known bands have been studied. The PSM calculations successfully give a deeper understanding of the mechanism of the formation of yrast and excited state bands from the single and multi-quasiparticle configurations. The positive parity ground state band based on configuration 1ν5/2+[413] (2d5/2), band spectra (both signature partners – bands 1 and 2) and crossing frequencies for 133Sm are successfully reproduced. The present calculations have found (h11/2)2 proton crossing at frequency (~0.400 MeV) which is an indication of structural change caused by crossing of ground state band by 3-qp bands. Experimentally, it is also observed that there is tentative evidence for the (h11/2)2 proton crossing at a frequency (~0.35 MeV). Also, it has been found that the first excited positive parity band is based on configuration 1ν1/2+[400] (2d3/2), which is very much consistent with the experimental observation. The band head energy and band spectra of excited positive parity bands is not confirmed experimentally. The present calculations predict the band head energy of band 3 as 0.226 MeV with respect to band 1. The transition energies of bands 3 and 4 at lower spins are fairly reproduced by the present calculations.
Further, it has been found that 1-qp neutron band built on K=7/2 and having configuration [523]7/2? (h11/2) is lowest in energy out of all other negative parity bands, which is very much consistent with the experimentally observed band head spin and configuration assigned to this band. The band spectra and band head spin of bands represented by 5 and 6 (signature partners of 1ν1h
For the reliability of wave functions, we have calculated the electromagnetic transition strength ratios for positive and negative parity yrast bands of 133Sm. From the results, it is found that the calculated B(M1)/B(E2) reflect a decrease in their values around the band crossing spin 31/2+ indicating a change in the structure of bands around this spin. Comparison of calculated transition strength ratios B(M1)/B(E2) with the available experimental data is good except at the angular momentum state 13/2+. For negative parity yrast band of 133Sm the calculated B(M1)/B(E2) values do not show any significant change up to band crossing spin 33/2. The present calculations have nicely reproduced the transition ratios B(M1)/B(E2)s for negative parity yrast band except at spin I=11/2 in case of 133Sm isotope.
In case of 135Sm, 1-qp neutron band built on K=7/2 and having configuration 1ν7/2+[404](1g7/2) is lowest in energy out of all other positive parity bands up to the spin I=23/2+ and is consistent with experimentally known band head spin and configuration. The crossing by 3-qp bands at the spin 25/2+ causes a significant change in the yrast structure of 135Sm. This crossing predicts the occurrence of backbending in the calculated results at the band crossing spin I=25/2+, which is also observed experimentally at the same spin and rotational frequency. The B(M1)/B(E2) ratios have been predicted for the positive parity yrast ground state band of 135Sm. The present calculations in 135Sm found the dominant structure of the lowest negative parity band based on K=9/2 state of the neutron 1h11/2 orbital up to the spin 13/2? and is consistent with the experimental band head spin and configuration. The calculated results of ΔI=1 transition energies and moment of inertia, for negative parity band 2 reproduces the observed staggering in this band due to the admixture of 1ν1/2?[541] band with low K=1/2 component in the wavefunction. As the band spectra of 135Sm is tentative and not confirmed experimentally, it is not feasible to make precise comments on the agreement of the calculated results with the available experimental data.
The present calculations for negative parity of 137Sm predicted that the dominant structure of yrast band up to the spin 15/2? is K=9/2 state of neutron h11/2 orbital, which is consistent with the experimental band head spin and configuration. For the positive parity of 137Sm, 1-qp neutron band from K=7/2 state of neutron orbital g7/2 is lowest in energy from all the other positive parity bands. Experimentally, this band is proposed to originate from the K=1/2 state of neutron d3/2 orbital. However, reasonably good agreement with the experimental energies for whole of this band supports the predicted configuration 1ν7/2[404](1g7/2) for this band. The present calculations reproduced the band spectra of both positive and negative parity bands. The observed backbending phenomena have been reproduced nicely at the band crossing spins due to the crossing of 1-qp neutron bands by 3-qp bands. The backbending in moment of inertia is predicted to arise due to the alignment of pair of protons in the down slopping K-components of π(h11/2)2 orbitals. For 137Sm, the observed trends in B(M1)/B(E2) have been reasonably reproduced except at the spin I=19/2?. The calculated results on B(M1)/B(E2) show the sharp increase in their values at spin I=29/2? due to the alignment of a pair of protons in the π(h11/2)2 orbitals.
The present calculations well reproduced the low-spin experimental data on 133-137Sm. However, the precise position of spins and rotational frequencies where quasiparticle alignments take place are very sensitive to several calculation conditions. One of them is to select the best Nilsson-single particle states for neutron-deficient nuclei in the mass region A~130-140. The Nilsson single particle states in the present work are obtained by using the standard Nilsson parameters of Ref. [23] without any adjustment. The agreement with the experimental data may be improved further by directly modifying the Nilsson parameters for the neutron-deficient A~130-140 mass range as discussed in Ref. [31] for proton-rich nuclei in the upper pf shell.
We are thankful to Professor Y. Sun for his collaborations.
