


HTML
--> --> -->In addition, the energy spectra of individual components are very different. For example, the unfolded proton spectrum measured by the KASCADE experiment shows a steepening at 2 PeV or 3PeV, based on QGSJET01 and SIBYLL2.1 models, respectively [5]. However, the hybrid experiment ARGO-YBJ and two prototypes of WFCTA show that the energy spectrum for H&He has a knee-like structure at 700 TeV [6]. The main reasons for this situation are the lack of absolute energy scale and of the way to identify the type of primary particles in cosmic rays. LHAASO [7, 8], located in Daocheng Haizishan, 4410 m a.s.l., Sichuan Province, China, will throw new light on this long-standing issue.
The LHAASO site is at an ideal altitude for knee physics research because the atmospheric depth is close to the maximum of development of the cosmic ray extensive air shower (EAS) [9], so that the fluctuation of EAS and the dependence on the interaction model will be minimum. Similar to the ARGO-YBJ experiment, WCDA can obtain the absolute energy scale using measurement of the Moon shadow [10]. Because the detection threshold of WCDA can be as low as several hundred GeV, it can be directly compared with the measurement results of space experiments to study the error of the energy scale.
Furthermore, LHAASO contains four types of detectors, which can detect electromagnetic particles, muons, Cherenkov and fluorescent photons in EAS. Multi-variable measurements of EAS can effectively distinguish the components of cosmic rays. Thus, the energy spectra of the individual components can be precisely measured by LHAASO using multi-variable analysis (MVA).
LHAASO plans to obtain consecutive measurement of energy spectra in four stages. In the first stage, WCDA delivers the absolute energy scale to WFCTA by hybrid observation of cosmic rays from 10 TeV to 100 TeV. In this energy range, the energy spectra measured by LHAASO overlap with the spectra from space experiments. The second stage is mainly for knee observation of the light nuclei components of cosmic rays with energies from 100 TeV to 10 PeV by hybrid detection with WFCTA, WCDA, and KM2A. In the third stage, the layout of WFCTA will be changed to measure the knee of the heavy nuclei from 10 PeV to 100 PeV [11]. WCDA will not be included in the hybrid detection due to saturation. The last stage is for the second knee study from 100 PeV to 1 EeV, in which WFCTA will be operated in the fluorescence observation mode [12].
In the first three observation stages, the elevation angles of WFCTA are
 Figure1. (color online) The detector layout of the LHAASO experiment.
WCDA [13], located at the center of LHAASO, is a water Cherenkov detector array with a total area of 78000
WFCTA is located 85 meters away from the center of WCDA++. It detects Cherenkov and fluorescence photons in the air shower. The angle of elevation of the telescope's main axis is set to
KM2A contains two sub-arrays: electromagnetic detector array (ED) and muon detector array (MD). ED array [18] covers an area of 1.3 km2 consisting of 5195 plastic scintillator detectors with a spacing of 15 meters. One ED detector has an effective area of 1 m2. As its name says, ED detects the electromagnetic particles in EAS. The MD array is an underground water Cherenkov detector array [19]. There are 1171 muon detectors, covering an area of 1 km2 , with a spacing of 30 meters. The area of one muon detector is 36 m2, and it detects muons in EAS.
The 1/4 LHAASO array includes WCDA++, six Cherenkov telescopes, 1272 EDs and 300 MDs. The layout of the 1/4 array is shown in Fig. 1. It will run for a few years to achieve the goal of measuring energy spectra of the light nuclei components.
Since full-coverage array can provide more accurate geometric information of air showers, the secondary particles are mainly measured by WCDA++ in the second hybrid detection stage. This means that the shower core position at this stage is outside of the ED array. Therefore, ED is not included in our simulations.
3.1.Simulation
The cascade processes of primary cosmic rays in the atmosphere are simulated with the CORSIKA [20] program, version 6990. The EGS4 model is chosen for electromagnetic interactions. The QGSJET02 and GHEISHA models are chosen for the high and low energy hadronic processes, respectively. The information about Cherenkov photons and secondary particles at the level of the observatory are recorded to simulate hybrid observation. Five components, protons, helium, CNO, MgAlSi, and iron are generated with energies from 10 TeV to 10 PeV according to a power law spectrum with an index of ?2.7. The directions of the showers are from Figure2. (color online) Energy distribution of all simulation events after normalization.
In addition, the five components are also normalized according to the H?randel model. The relationship between the original proton spectrum and the two normalized proton spectra is that the number of original proton events, the number of proton events with the exponent ?2.7 and the number of proton events with the exponent from the H?randel model are the same at 100 TeV. The event number in the other energy bins and other components are normalized in proportion. The normalized statistics of each component are equivalent to the observation data for one year with 10% duty cycle according to the H?randel model [21].
The simulation of the response of three LHAASO detector arrays to EAS is performed separately. In the simulation, the actual coordinates of the detector arrays are transferred to the CORSIKA coordinate system. The program of photon ray-tracing is used for WFCTA simulation. The trigger pattern of the telescope is set to 7, namely seven neighboring pixels should be triggered. The fast simulation program [22] is used for the simulation of WCDA++ and MD. Only photoelectrons are sampled according to the energy, direction and particle id of the secondary particles in EAS. The time response is not included. The simulated results of different detectors are then merged before reconstruction.
2
3.2.Event reconstruction
According to the actual data acquisition, as long as the Cherenkov telescope is triggered, the events measured by three detector arrays are reconstructed.First, the shower core position is given by WCDA++ using NKG fitting [23]. Due to the lack of time response information in the WCDA++ fast simulation program, there is no information about the shower fronts. Therefore, the arrival direction of the shower is obtained by Gauss sampling with an angular resolution of
Secondly, the perpendicular distance between the telescope and the shower axis (
After the image cleaning, the Hillas parameters [24], are obtained, as well as the total number of photoelectrons (
$ N_{0}^{pe} = \lg(N^{pe})+a{\times}(R_p/1m)+b{\times}\tan(\alpha) ,$  | (1) |
Finally, the lateral distribution of muons is fitted by an empirical formula Eq. (2) using maximum likelihood fitting [9]. The normalized muon size is given by
$ {\rho}(r, N_{\mu}) = k_G N_{\mu} \left(\frac{r}{r_G}\right)^{-k_1} \left(1+\frac{r}{r_G}\right)^{-k_2} [m^{-2}], $  | (2) |
2
3.3.Event selection
There are three basic principles for event selection: first, the shower core position must fall in WCDA++; second, the Cherenkov image is complete; and third, the muon lateral distribution is well fitted.Specifically, the reconstructed shower core located within
The number of events in each energy bin after selection is shown in Fig. 3 (left). The dotted line represents the number of proton events in the simulation, which is consistent with the black line in Fig. 2. The solid lines represent the number of events after selection, and different colors represent different components. Fig. 3 (left) shows that the hybrid observation becomes nearly fully efficient above 100 TeV for all components.
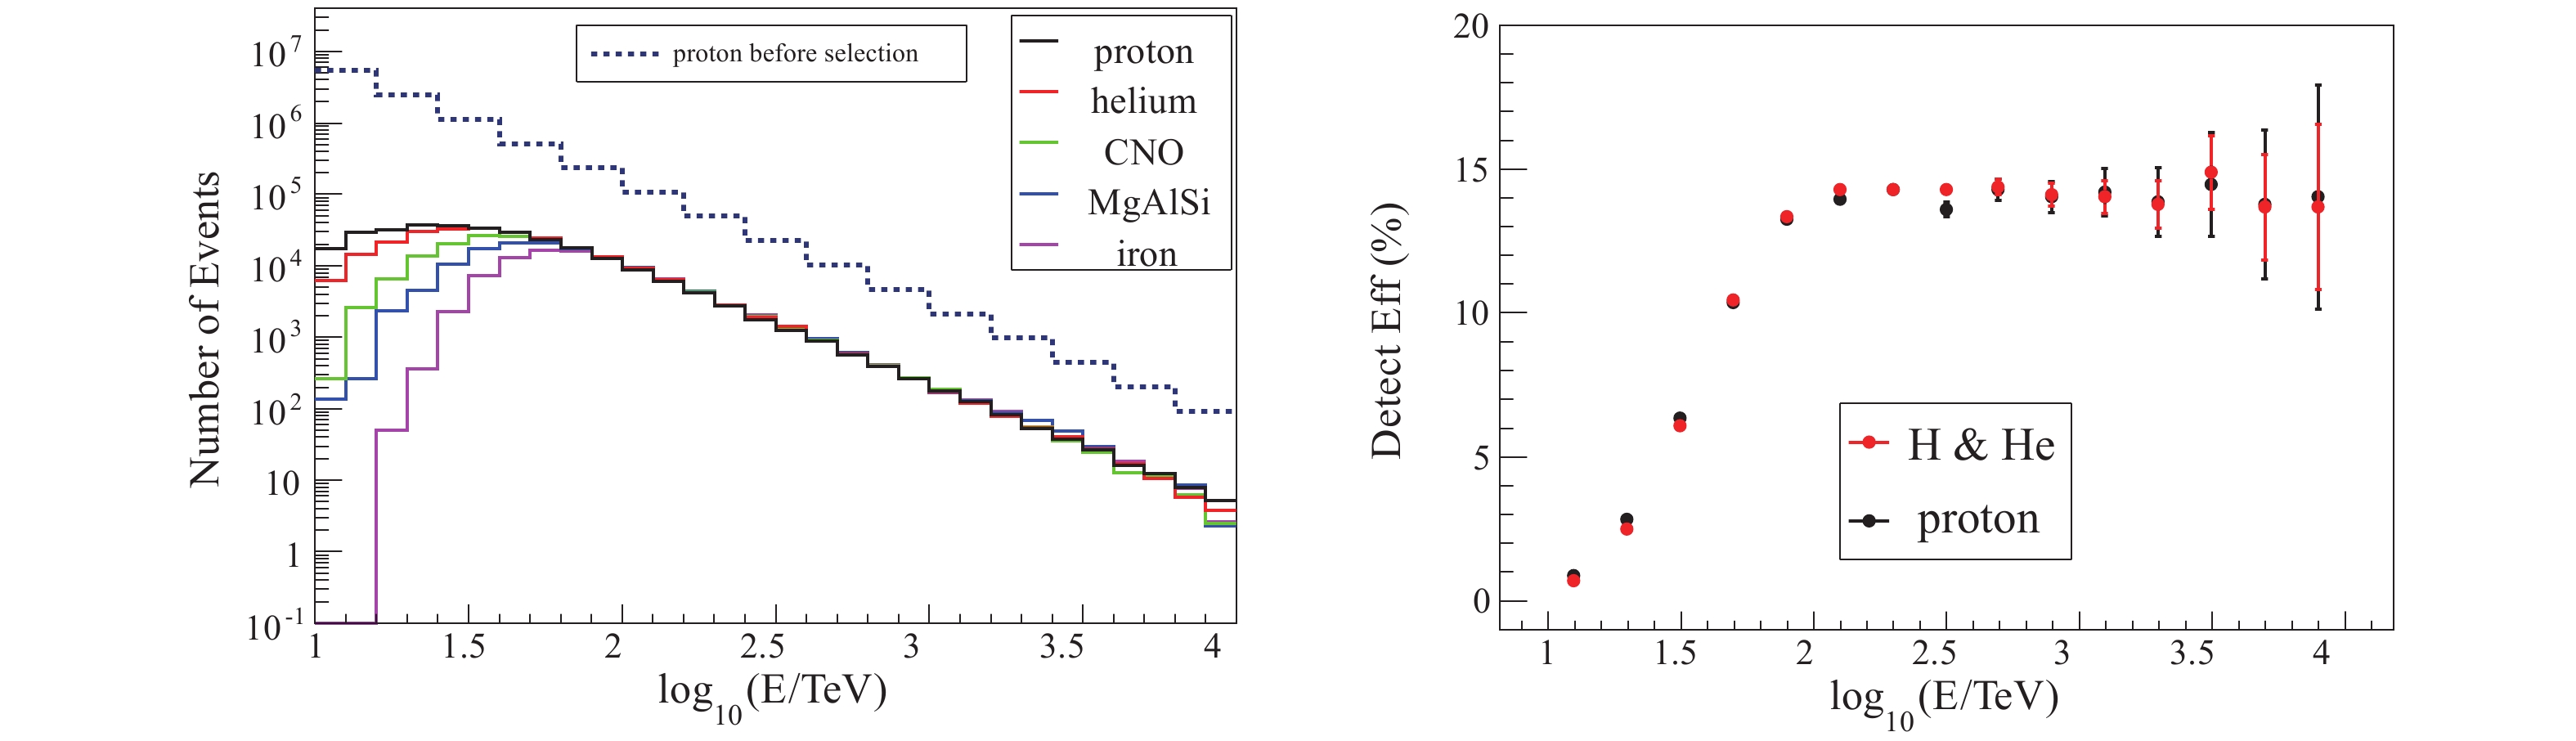 Figure3. (color online) Left: energy distribution after event selection. Right: detection efficiency for protons and H&He.
The detection efficiency is defined as the ratio of the number of selected events to the number of simulation events in each energy bin, i.e. the black solid line divided by the blue dotted line in Fig. 3 (left). In our simulations, the detection efficiency is about 15% above 100 TeV for all components, as shown in Fig. 3 (right). The red dots show the detection efficiency of H&He and the black dots show the the detection efficiency for protons. It is obvious that the error bars of the last two points in Fig. 3 (right) are large due to small statistics. Therefore the results for
2
4.1.Component sensitive parameters
34.1.1.Parameters from WFCTA
It is known that the iron induced air showers are larger, develop faster and have a smaller interaction mean free path than the primary particles, which travel in the atmosphere [9]. Thus, the proton induced shower develops its maximum later than the iron shower. The atmospheric depth of the shower maximum, $ P_{X} = {\Delta}{\theta}-0.0103\times R_p - 0.404\times N_{0}^{pe}. $  | (3) |
$ P_{C} = L/W-0.0137\times R_p+0.239\times N_{0}^{pe}. $  | (4) |
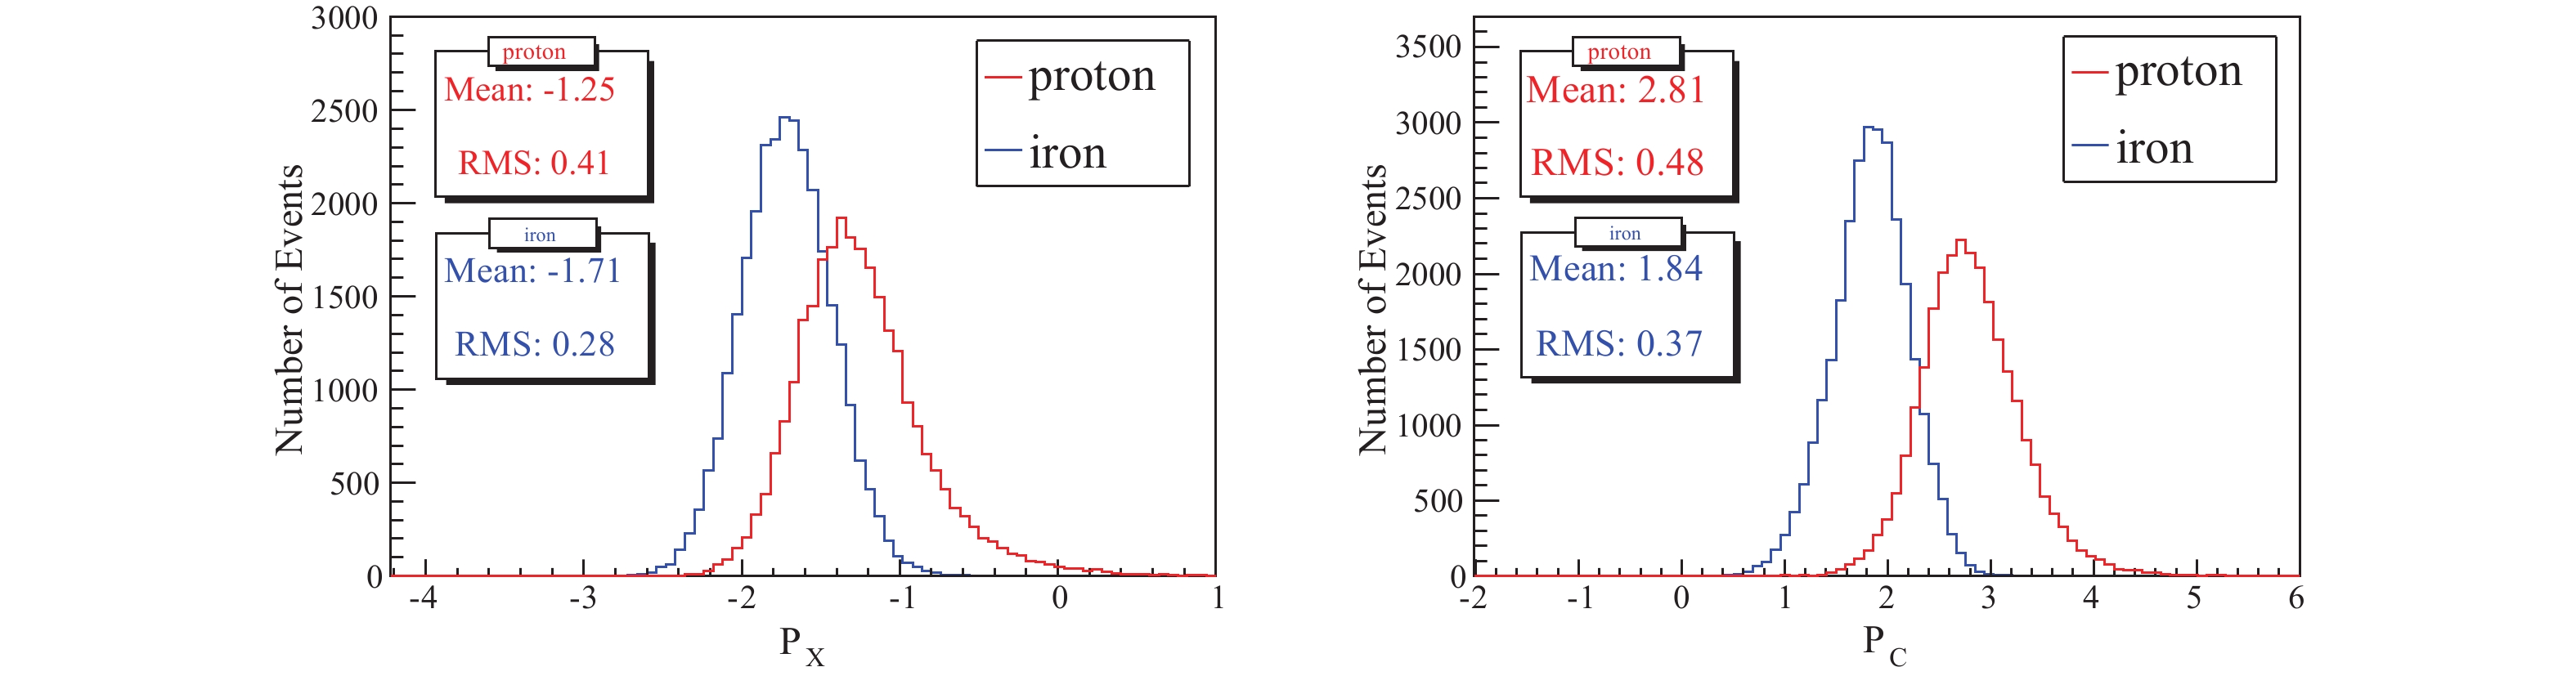 Figure4. (color online) Distributions of mass sensitive parameters
 3
4.1.2.Parameters from MD
The muon sizeTherefore, the fitted muon size (
$ P_{\mu1} = \lg(N_{\mu}^{F})-0.9823 \times N_{0}^{pe}, $  | (5) |
$ P_{\mu2} = \lg(N_{\mu}^{M})+0.00226 \times Rlp-0.873 \times N_{0}^{pe}, $  | (6) |
$ P_{\mu3} = \lg(NMD+0.098\times Rlp)-0.552\times N_{0}^{pe}, $  | (7) |
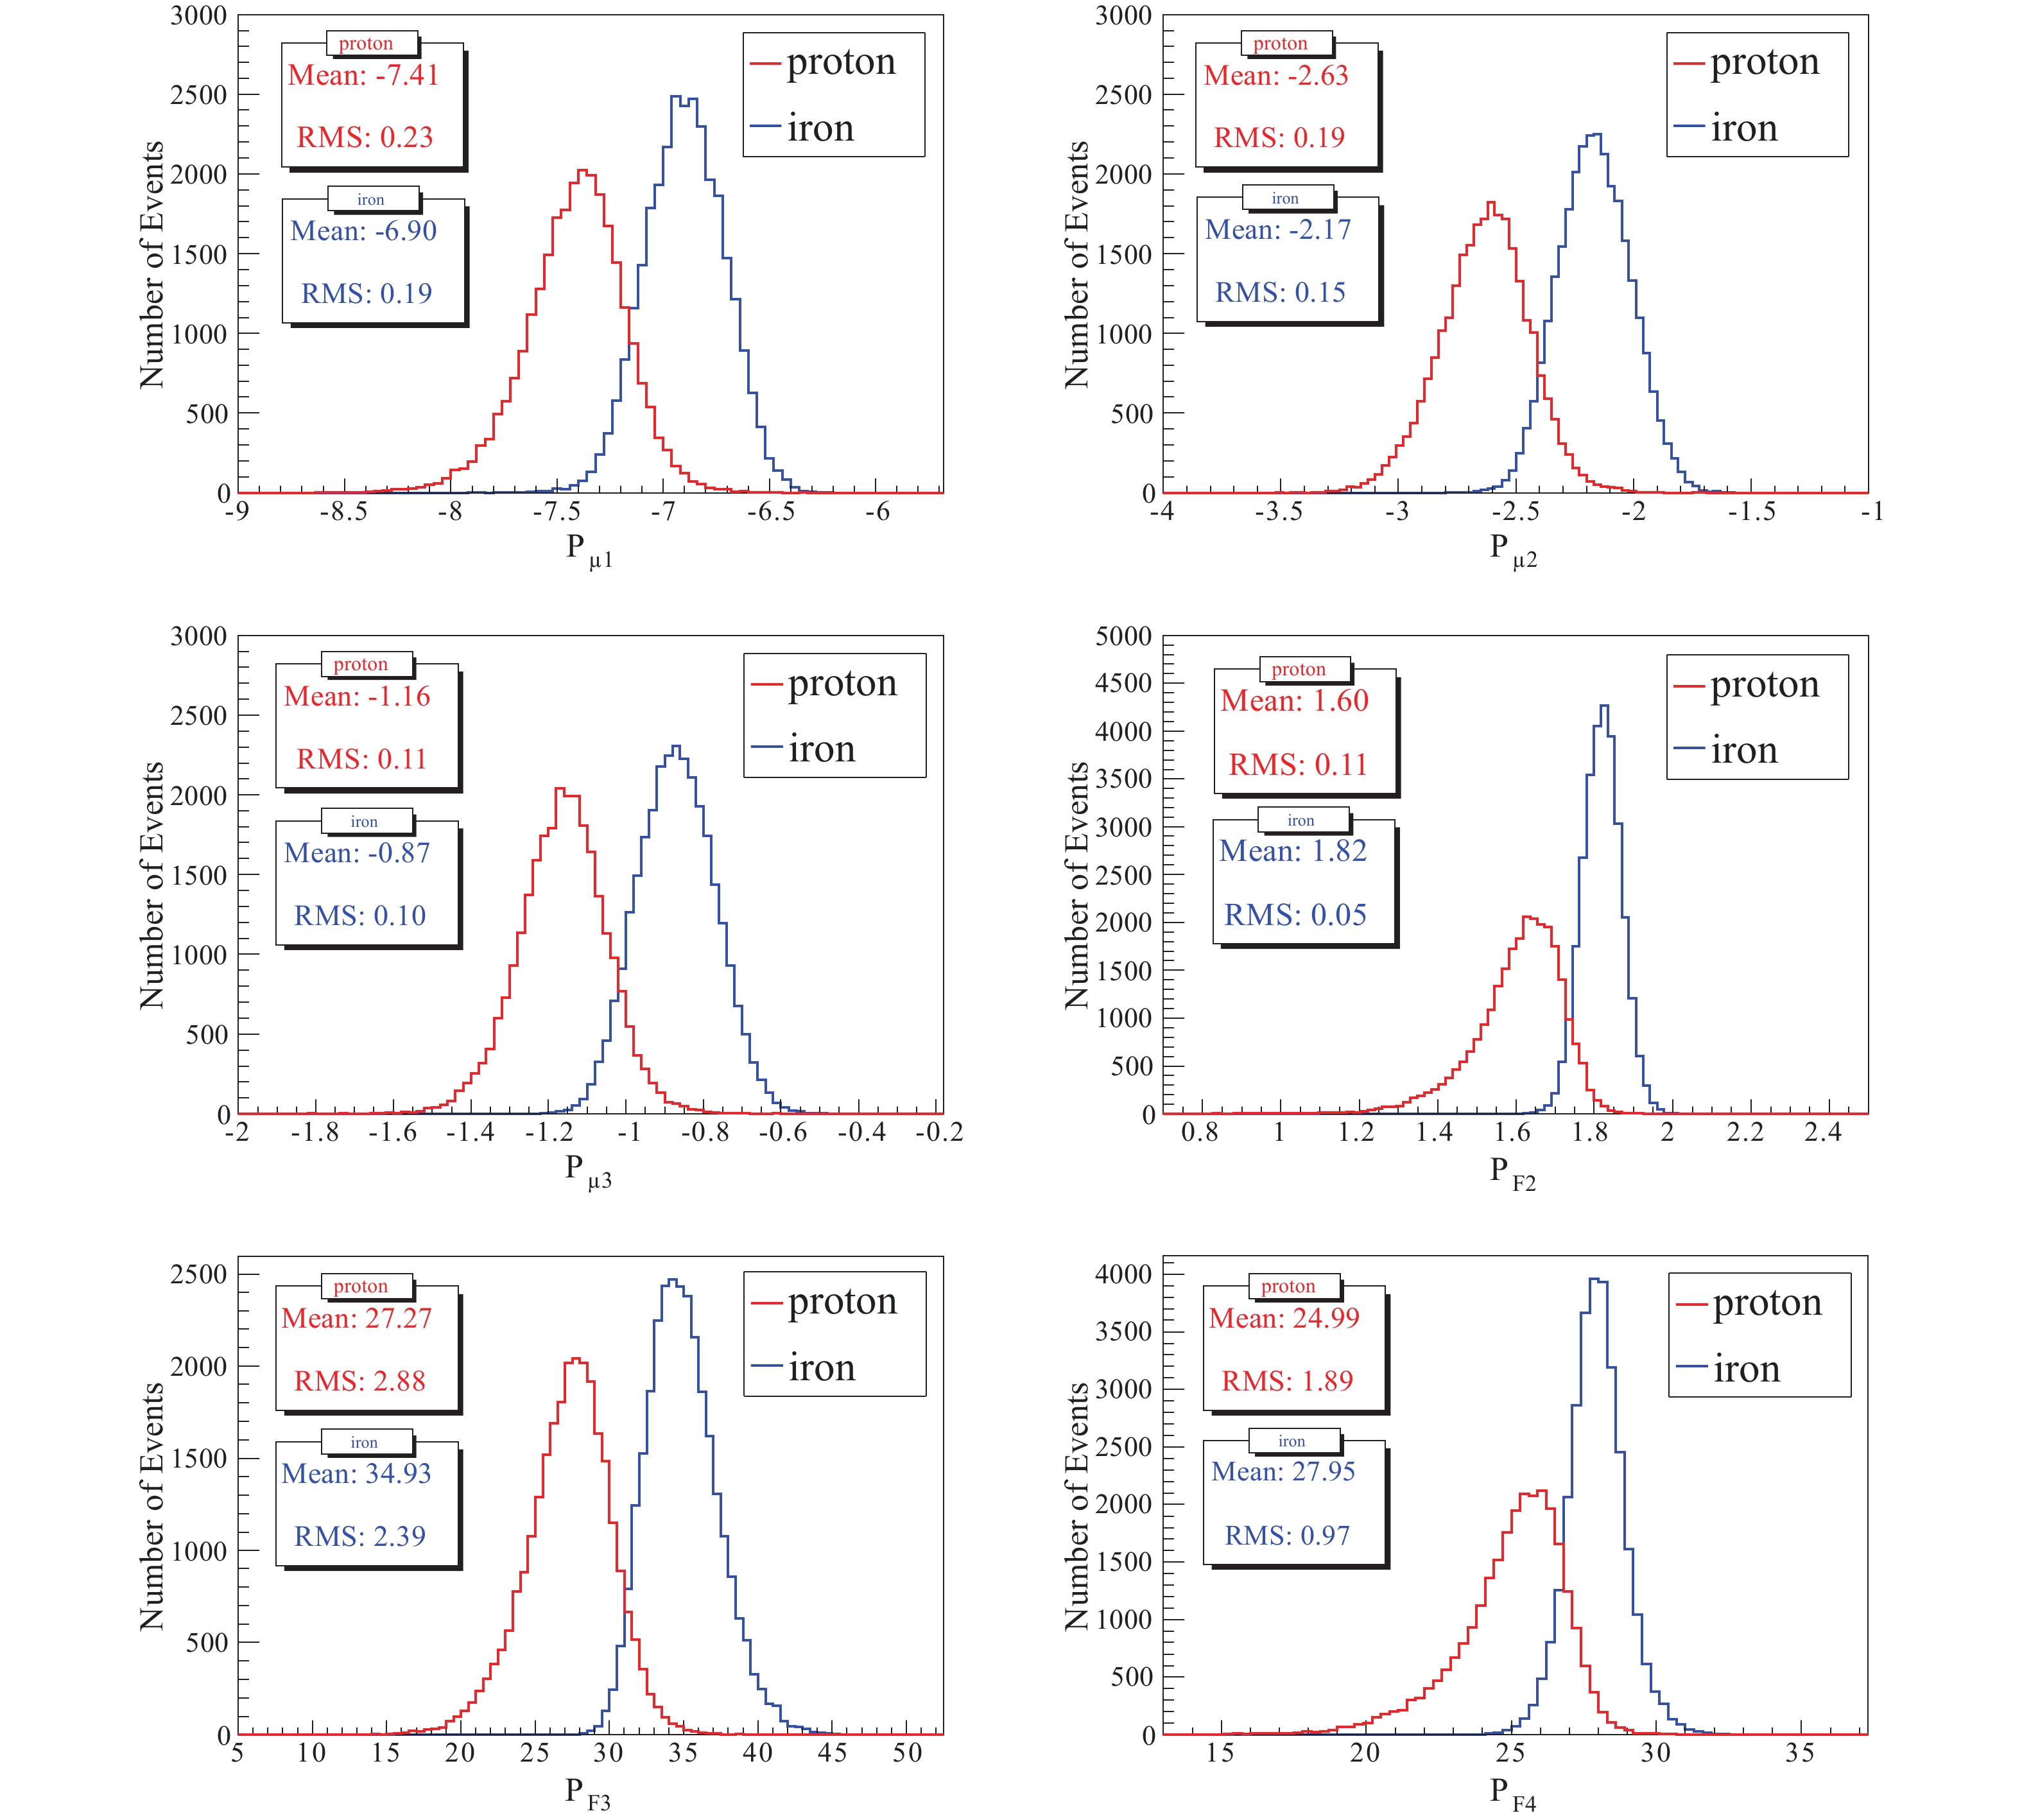 Figure5. (color online) Distributions of mass sensitive parameters
 3
4.1.3.Parameters from WCDA
It is also known that the iron induced shower is more extensive at the same observation level. This means that the lateral extension of secondary particles in iron induced air shower is larger. WCDA++, the fully covered detector array, can detect the lateral distribution of secondary particles well. The formulas for the average lateral distribution $ <ER> = \dfrac{\sum R_{i} \times Pe_{i}}{\sum Pe_{i}}, $  | (8) |
$ \begin{align} {\rm RMS}_{x} = \sqrt{ \dfrac{\sum x_{i}^{2}\times Pe_{i}}{\sum Pe_{i}} - x_{\rm weight}^{2} } \end{align}, $  | (9) |
$ \begin{align} {\rm RMS}_{y} = \sqrt{ \dfrac{\sum y_{i}^{2}\times Pe_{i}}{\sum Pe_{i}} - y_{\rm weight}^{2} } \end{align}, $  | (10) |
$ \begin{align} {\rm RMS} = \sqrt{ \dfrac{\sum R_{i}^{2}\times Pe_{i}}{\sum Pe_{i}} - <ER>^{2} } \end{align}, $  | (11) |
$ \begin{align} x_{\rm weight} = \dfrac{\sum x_{i}\times Pe_{i}}{\sum Pe_{i}} \end{align}, $  | (12) |
$ \begin{align} y_{\rm weight} = \dfrac{\sum y_{i}\times Pe_{i}}{\sum Pe_{i}} \end{align}. $  | (13) |
$ P_{F2} = \lg<ER>-0.343\times \theta_{\rm rec}+0.1159\times N_{0}^{pe}, $  | (14) |
$ P_{F3} = {\rm RMS}_{x}-6.921\times \theta_{\rm rec}+2.82\times N_{0}^{pe}, $  | (15) |
$ P_{F4} = {\rm RMS}-6.084\times \theta_{\rm rec}+1.917\times N_{0}^{pe}. $  | (16) |
In addition, near the shower core axis, the particle density of the iron-shower is lower than that of the proton shower [6]. Hence, the number of photoelectrons in the brightest cell (
$ P_{F} = \lg(N_{\max}) -1.391\times N_{0}^{pe}. $  | (17) |
$ P_{E} = \lg(N_{w}^{pe}) -1.163\times N_{0}^{pe}. $  | (18) |
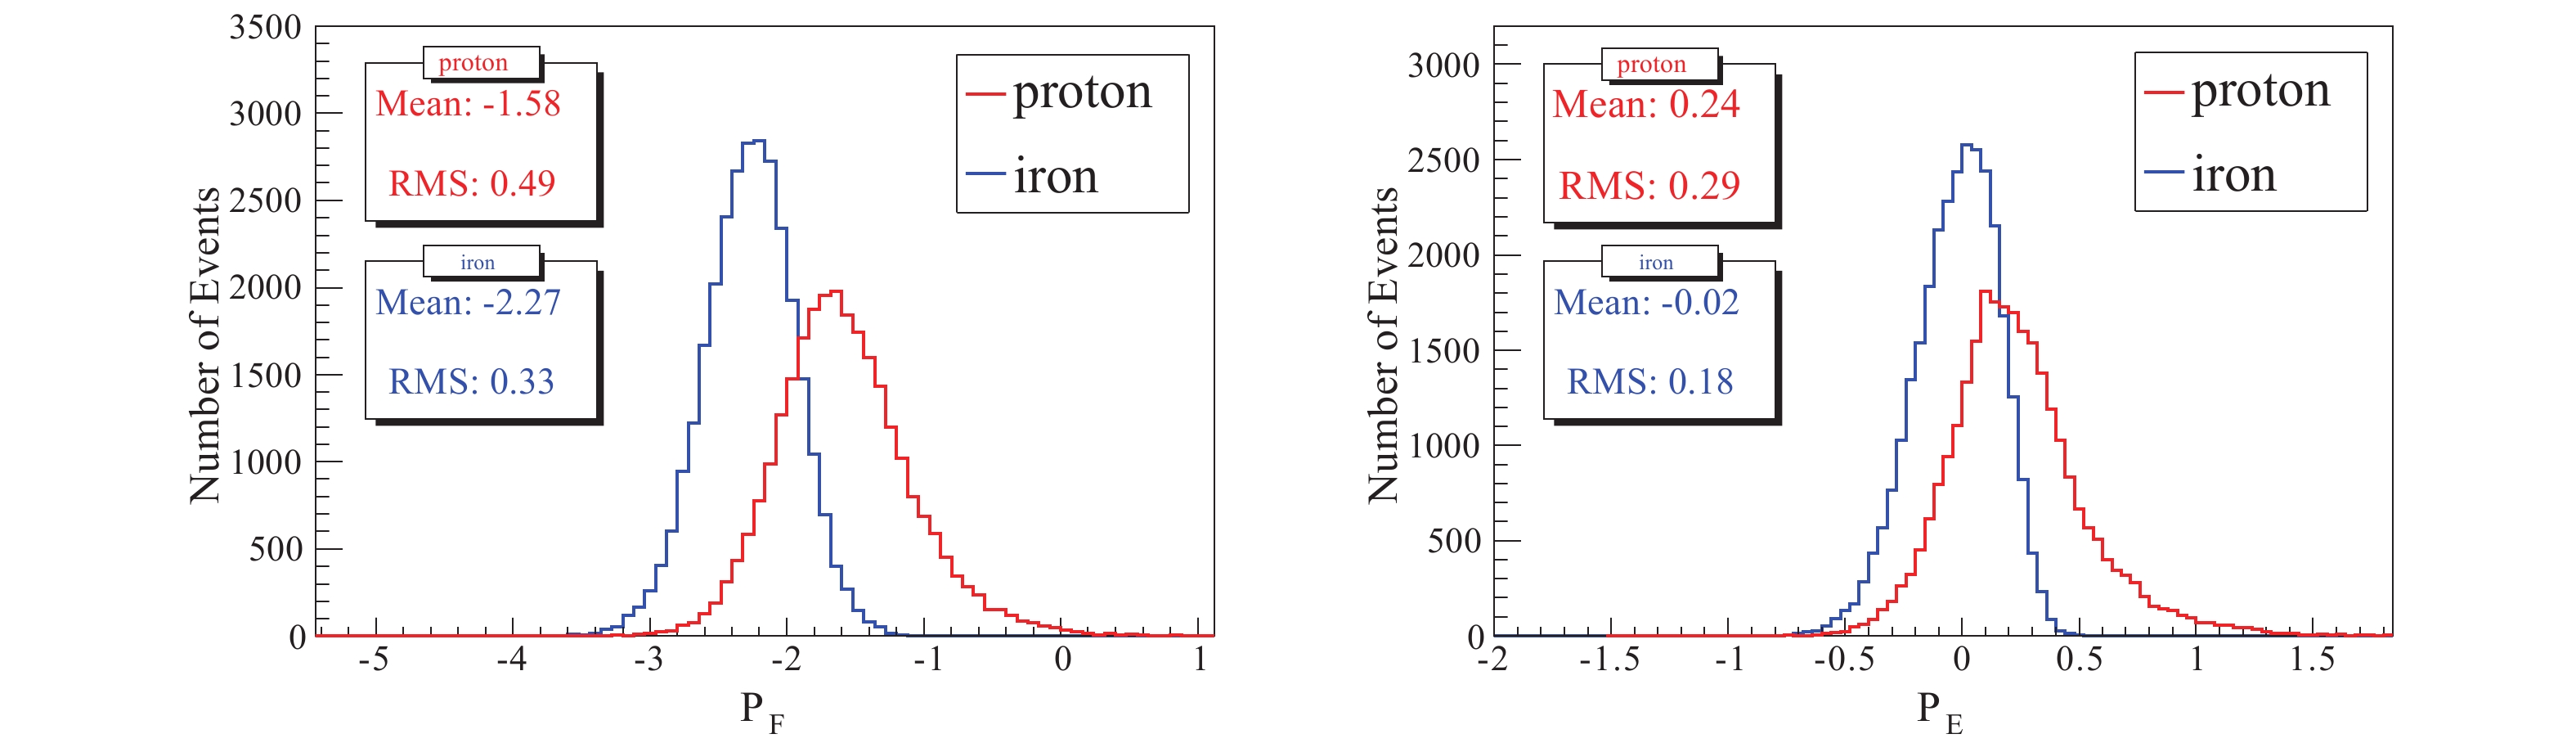 Figure6. (color online) Distributions of mass sensitive parameters
 Other parameters have also been studied, such as the photoelectrons measured by the brightest pixel in air Cherenkov image (
3
4.1.4.Correlation of parameters
The parameters described above are not independent. There is a correlation between some of them. Parameters provided by the same detector array are highly correlated, such as Figure7. (color online) Correlations of mass sensitive parameters from WCDA (left) and MD (right).
The correlation of parameters provided by the different detector arrays is weak, such as
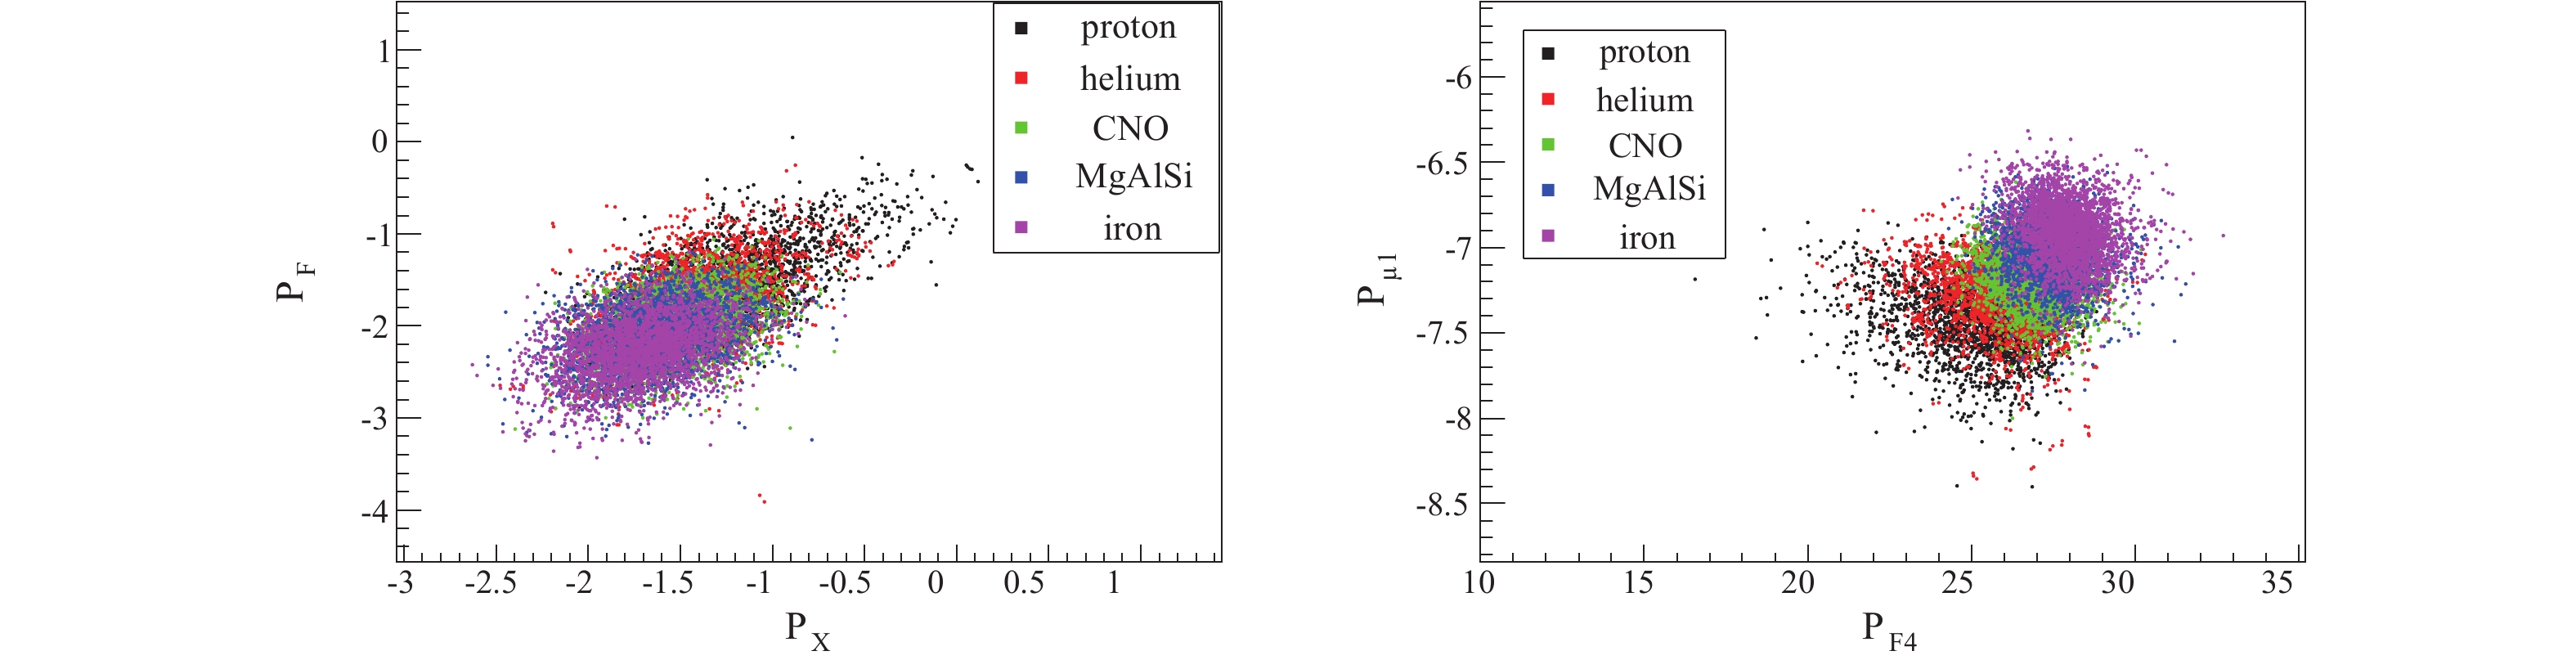 Figure8. (color online) Correlations of mass sensitive parameters from different detector arrays.
The correlation matrix of the ten variables for proton induced showers is shown in Fig. 9. The correlation coefficient of 100% means a linear positive correlation, and ?100% means linear negative correlation. A zero correlation coefficient means no correlation among parameters. It should be noted that the parameter
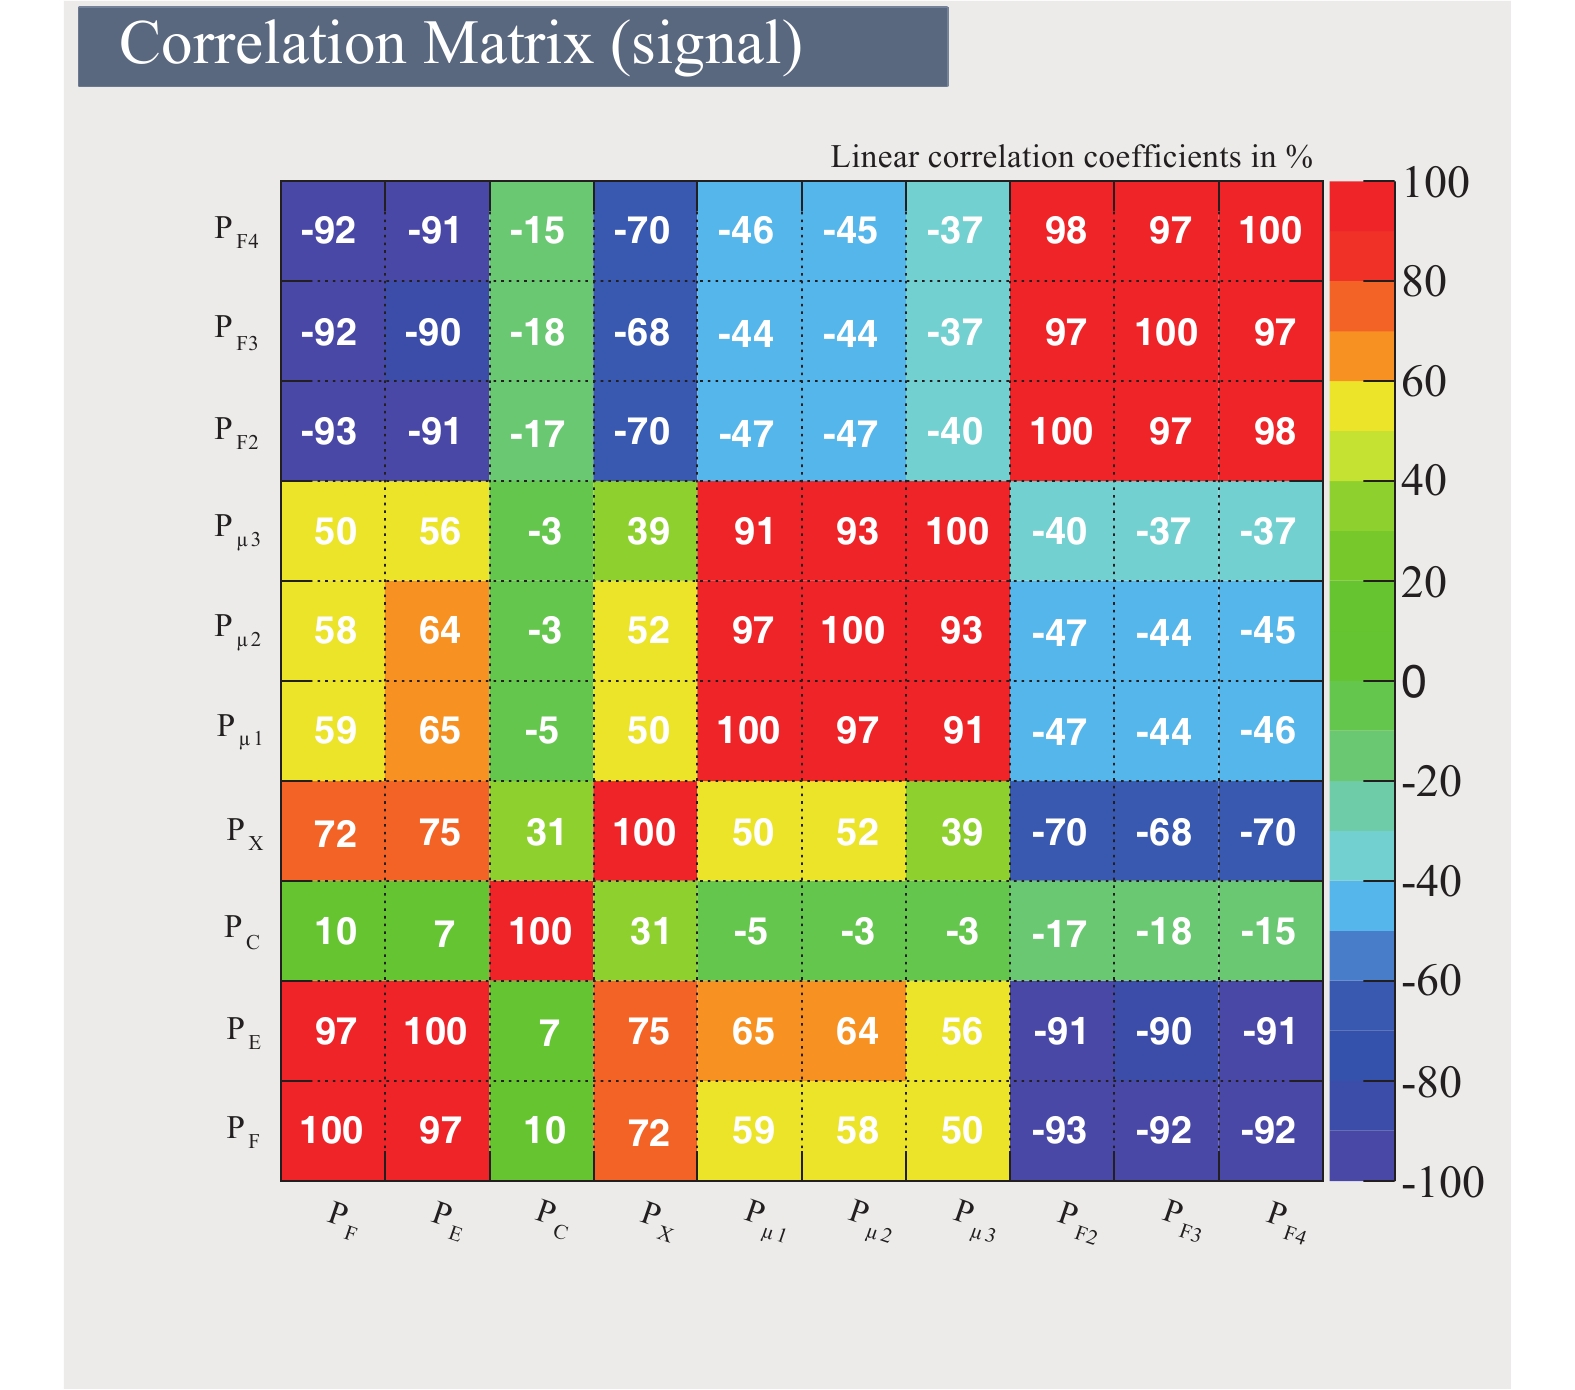 Figure9. (color online) Linear correlation matrix for the input variables of proton events.
After removing the highly correlated parameters (97% or 98% correlation coefficient), six parameters,
2
4.2.TMVA analysis
Drawing on the experience of ARGO-YBJ/WFCT hybrid detection, two parameters are used for particle identification [27] in the event-by-event cut. However, having too many variables is not suitable for particle identification when using event-by-event cuts because it is complicated to get an optimal cut for each parameter. Therefore, MVA is used.As an important branch of statistics, multivariate analysis has been applied in most disciplines. TMVA is specially developed for high energy physics based on the ROOT integrated environment. It is powerful for signal and background classification. In accelerator physics, it can effectively screen out the b-tagging signals from a large number of background particles in a jet [28]. Likewise, it enables to identify the components of cosmic rays [29].
TMVA is based on machine learning. It integrates multiple advanced algorithms, such as Boosted Decision Trees (BDT), Artificial Neural Networks (ANN), Support Vector Machine (SVM), etc. Users need to input variable samples and select the algorithm, and the machine training and testing are then carried out. The result is one variable which is used by the user to select signals.
Here, Boosted Decision Trees with Gradient (BDTG) is chosen, which is the most widely used algorithm. The classification of protons and H&He from other mass components is carried out independently.
The selected hybrid events are divided into two equal parts. One is used for TMVA training and testing and the other is used as data. The statistics of the signal (proton or H&He) and background (others) are shown in Table 1.
| NO. of events | proton | H&He |
| signal | 40215 | 61098 |
| background | 91330 | 70447 |
Table1.The number of events for BDTG classifier training and testing.
To avoid overtraining, several parameters are adjusted to achieve best performance of the classifier. Parameters of BDTG classifiers for the separation of protons from the other nuclei are as follows:
-Number of trees in the forest is 380;
-Minimum training events required in the leaf node are 30;
-Maximum depth of the decision tree is 2.
Parameters of BDTG classifiers for the separation of H&He from the other nuclei are as follow:
-Number of trees in the forest is 300;
-Minimum training events required in the leaf node are 50;
-Maximum depth of the decision tree is 2.
The other parameters are set at their default values.
The training results are shown in Fig. 10.
 Figure10. (color online) Training results of BDTG classifier for protons (left) and H&He (right).
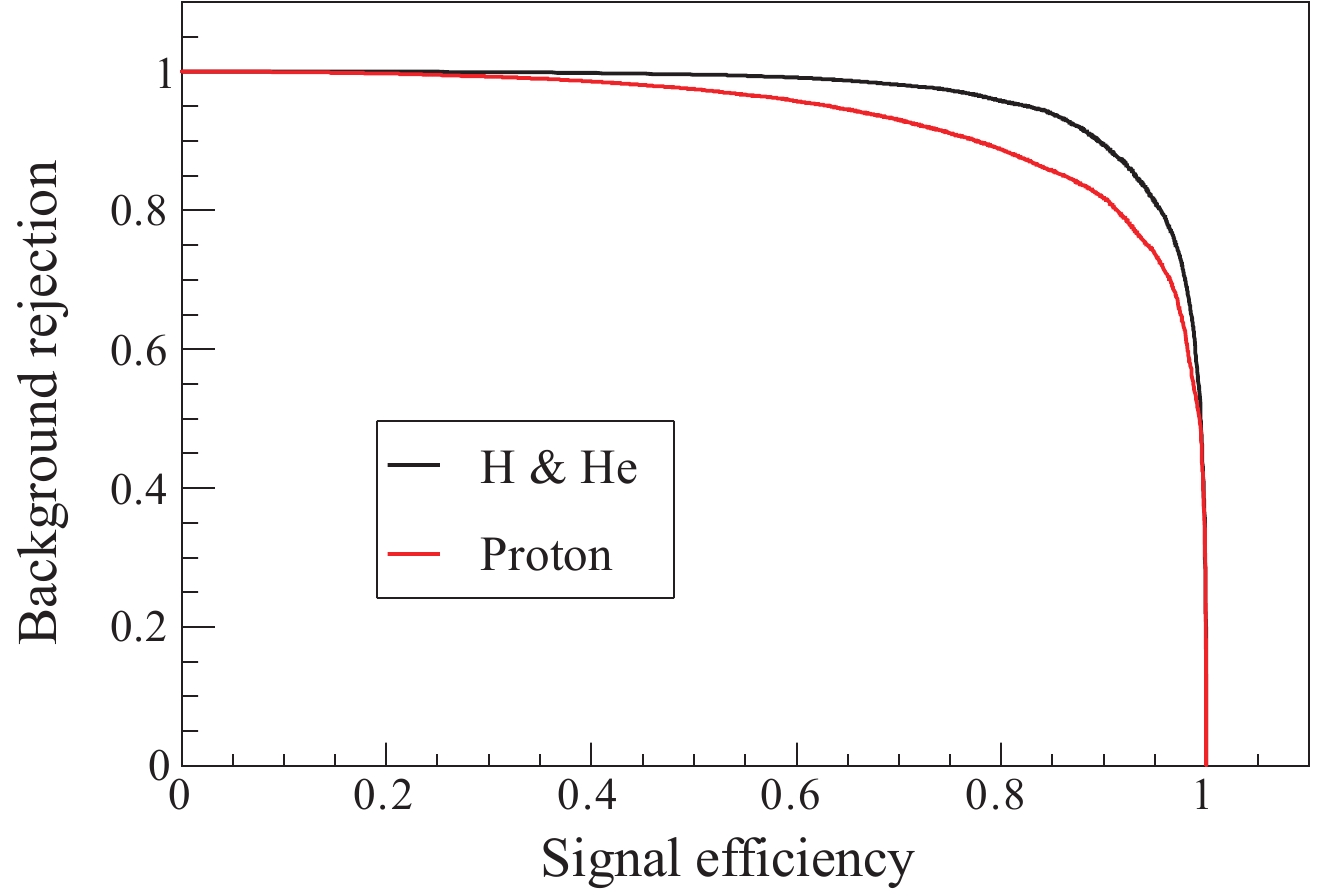 Figure11. (color online) ROC curves for BDTG classifier for protons (red line) and H&He (black line).
2
4.3.Results
The training results are applied to the other half of the data sample. Generally, signal events can be selected according to the best cut points provided by TMVA. However, because our final goal is to obtain selection efficiency with different energy bins, the distribution of the output BDTG classifier versus reconstructed energy is studied first. As shown in Fig. 12, the separation of the output BDTG classifiers between H&He and heavy nuclei becomes larger as the primary energy increases. The mean value of the signal (red dots) in each energy bin is slightly higher than the background (black dots), and the RMS of the signal gradually decreases. The reason for larger separation is that the performance of the input parameters gets better at higher energies.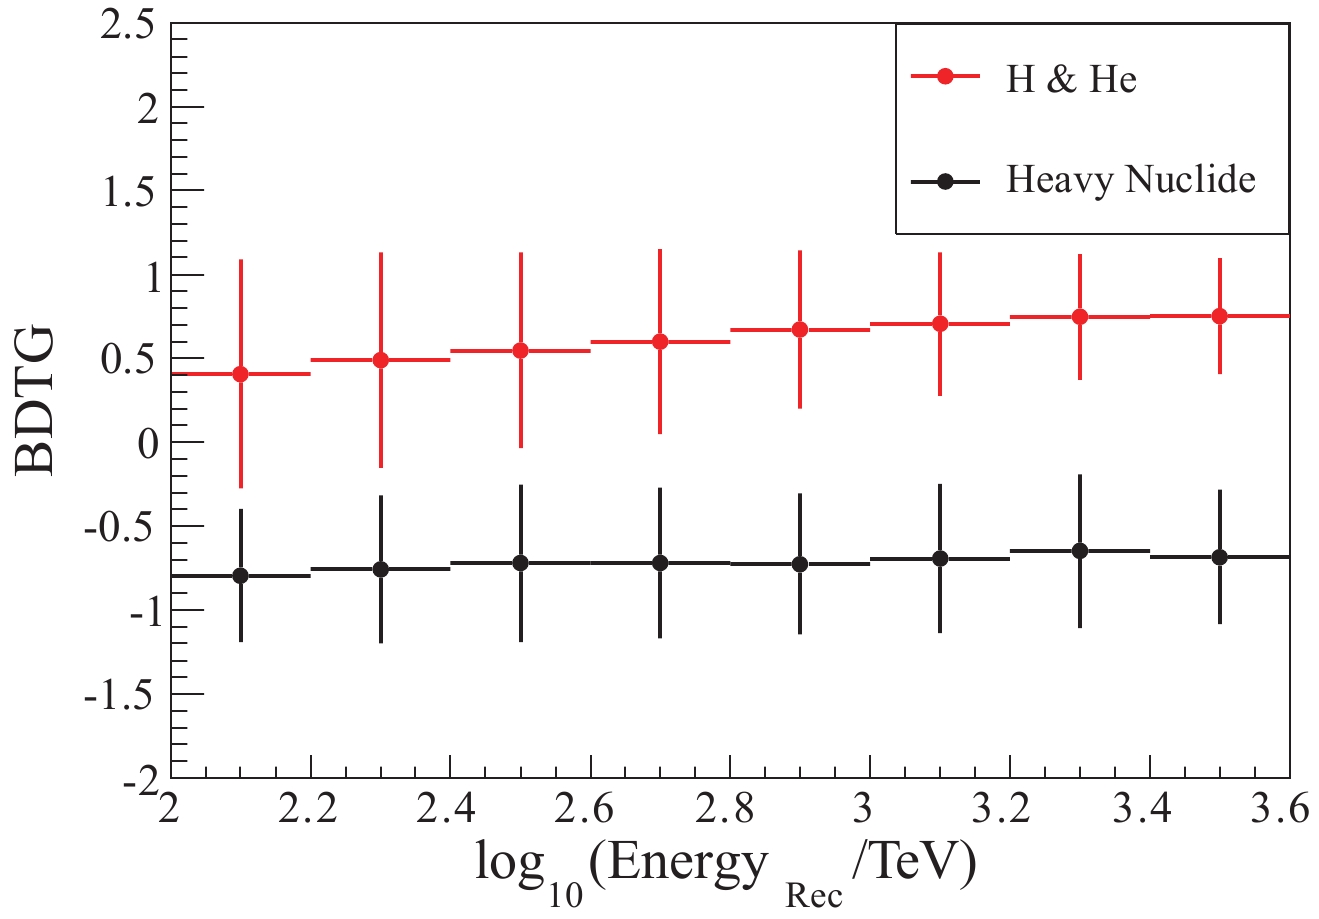 Figure12. (color online) Distribution of the BDTG output parameter as a function of reconstructed energy. The error bars show the RMS in each bin.
To get a coincident selection efficiency, the cut values are scaled following Eq. (19) and Eq. (20):
$\rm Cut~ Value (H) = 0.09\times lg(Energy/TeV)+0.55, $  | (19) |
$\rm Cut~ Value (H\&He) = 0.33\times lg(Energy/TeV)-0.26. $  | (20) |
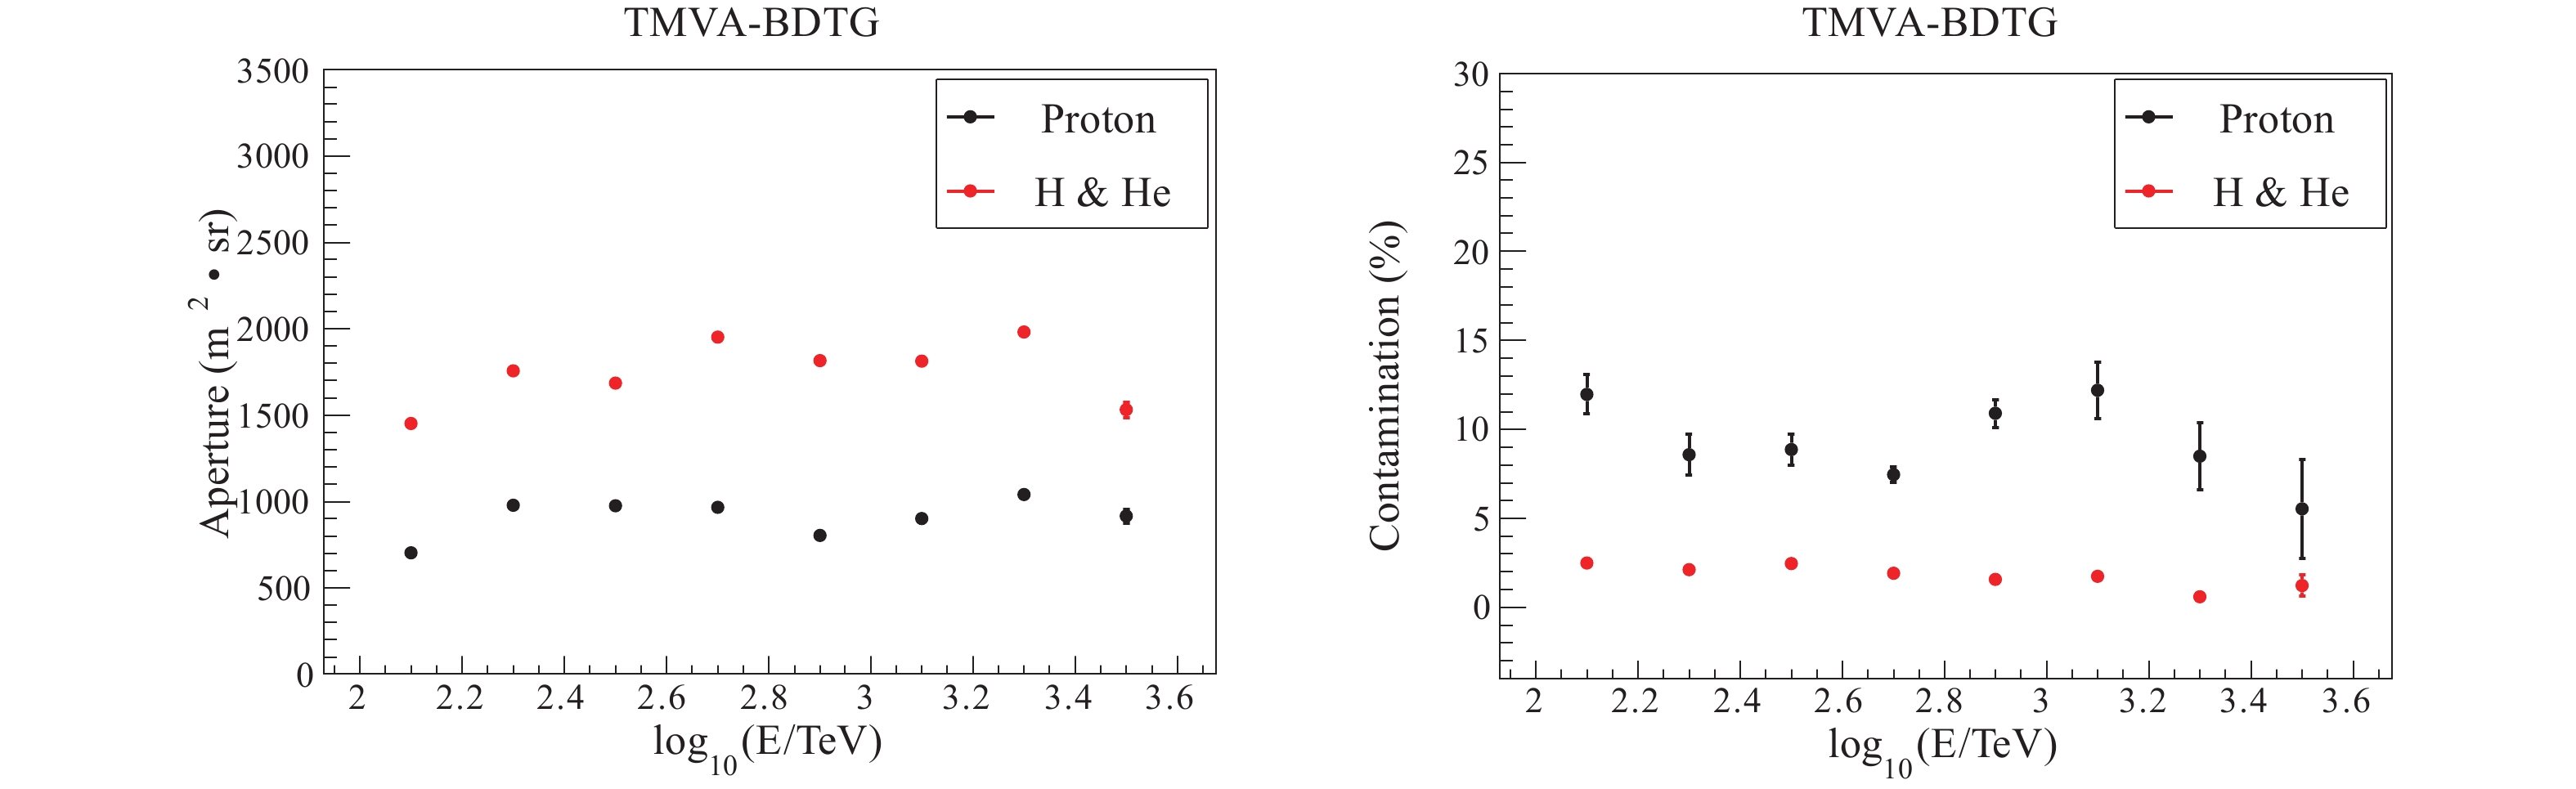 Figure13. (color online) The final selected aperture (left) and contamination (right) for protons and H&He.
Considering the uncertainty due to the hadronic interaction models, two batches of data, QGSJET-FLUKA and EPOS-FLUKA, were used for error analysis. It is found that the aperture for H&He is consistent within
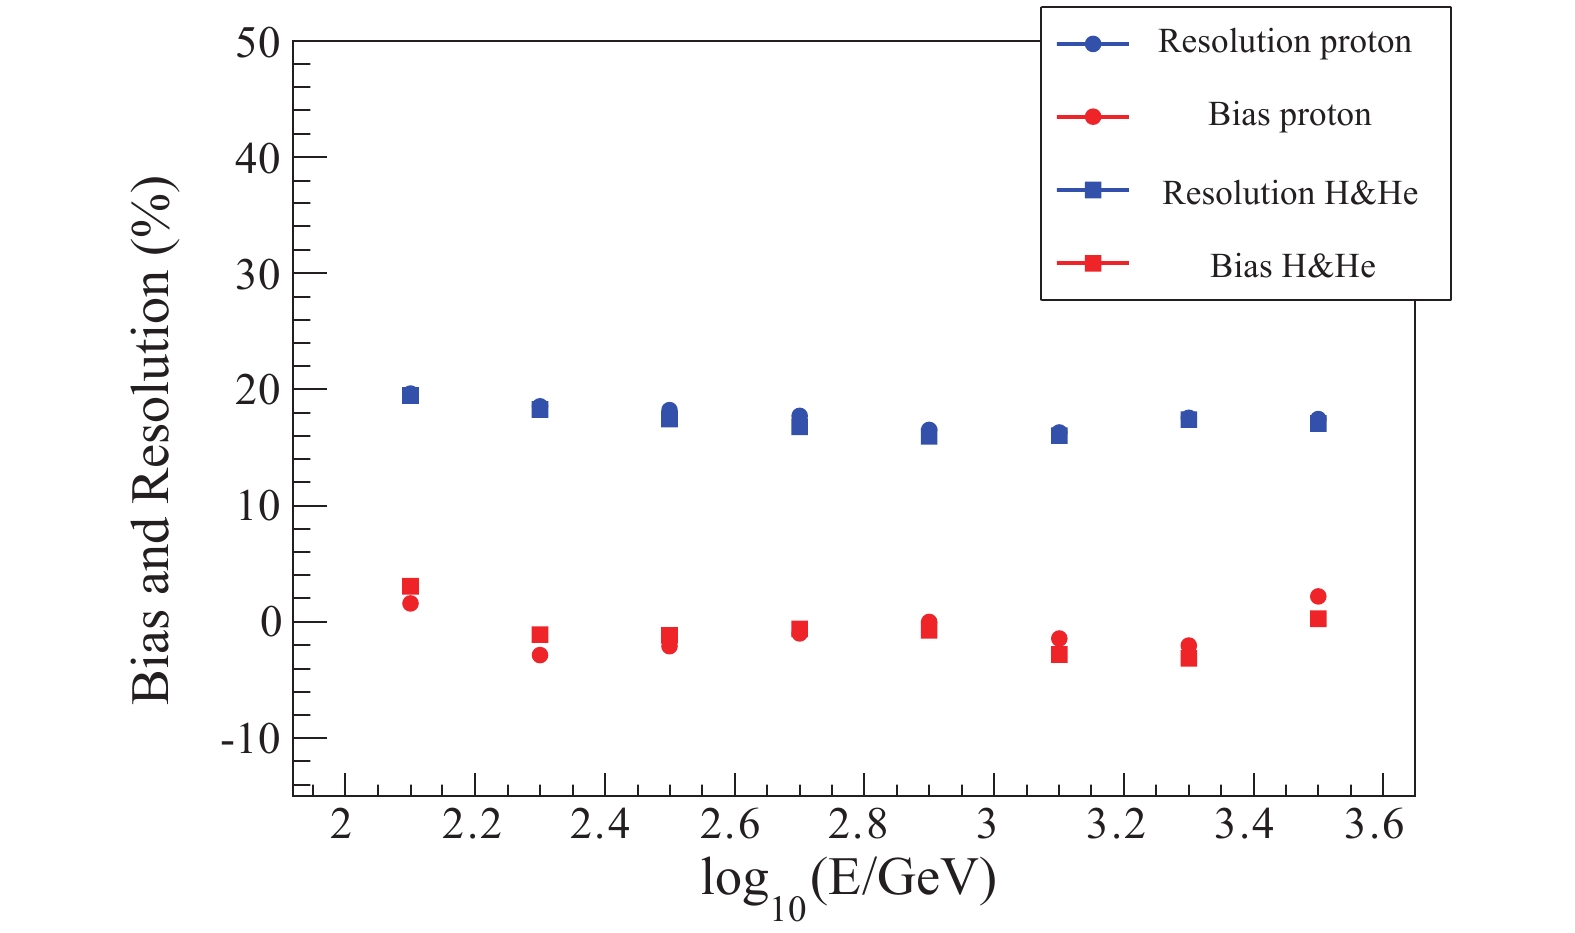 Figure14. (color online) Bias and resolution of reconstructed energy for protons and H&He.
Based on the aperture described above, the cosmic ray spectra of protons and H&He are predicted according to the H?randel model [21], and the ARGO-YBJ/WFCT model [6], which is an experimental model. The exposure time is set to one year with a 10% duty cycle. Since the experimental model ARGO-YBJ/WFCT only gives the energy spectrum of H&He, the spectrum of pure protons is obtained by dividing by 2, that is, the ratio of protons to helium is 1:1. The bending of the knee is unchanged.
In Fig. 15, the left panel shows the spectrum with the H?randel model, and the right panel with the ARGO-YBJ/WFCT model. The black dots are for protons and the red dots for
 Figure15. (color online) Expected spectra with the H?randel model (left) and the ARGO-YBJ/WFCT model (right).
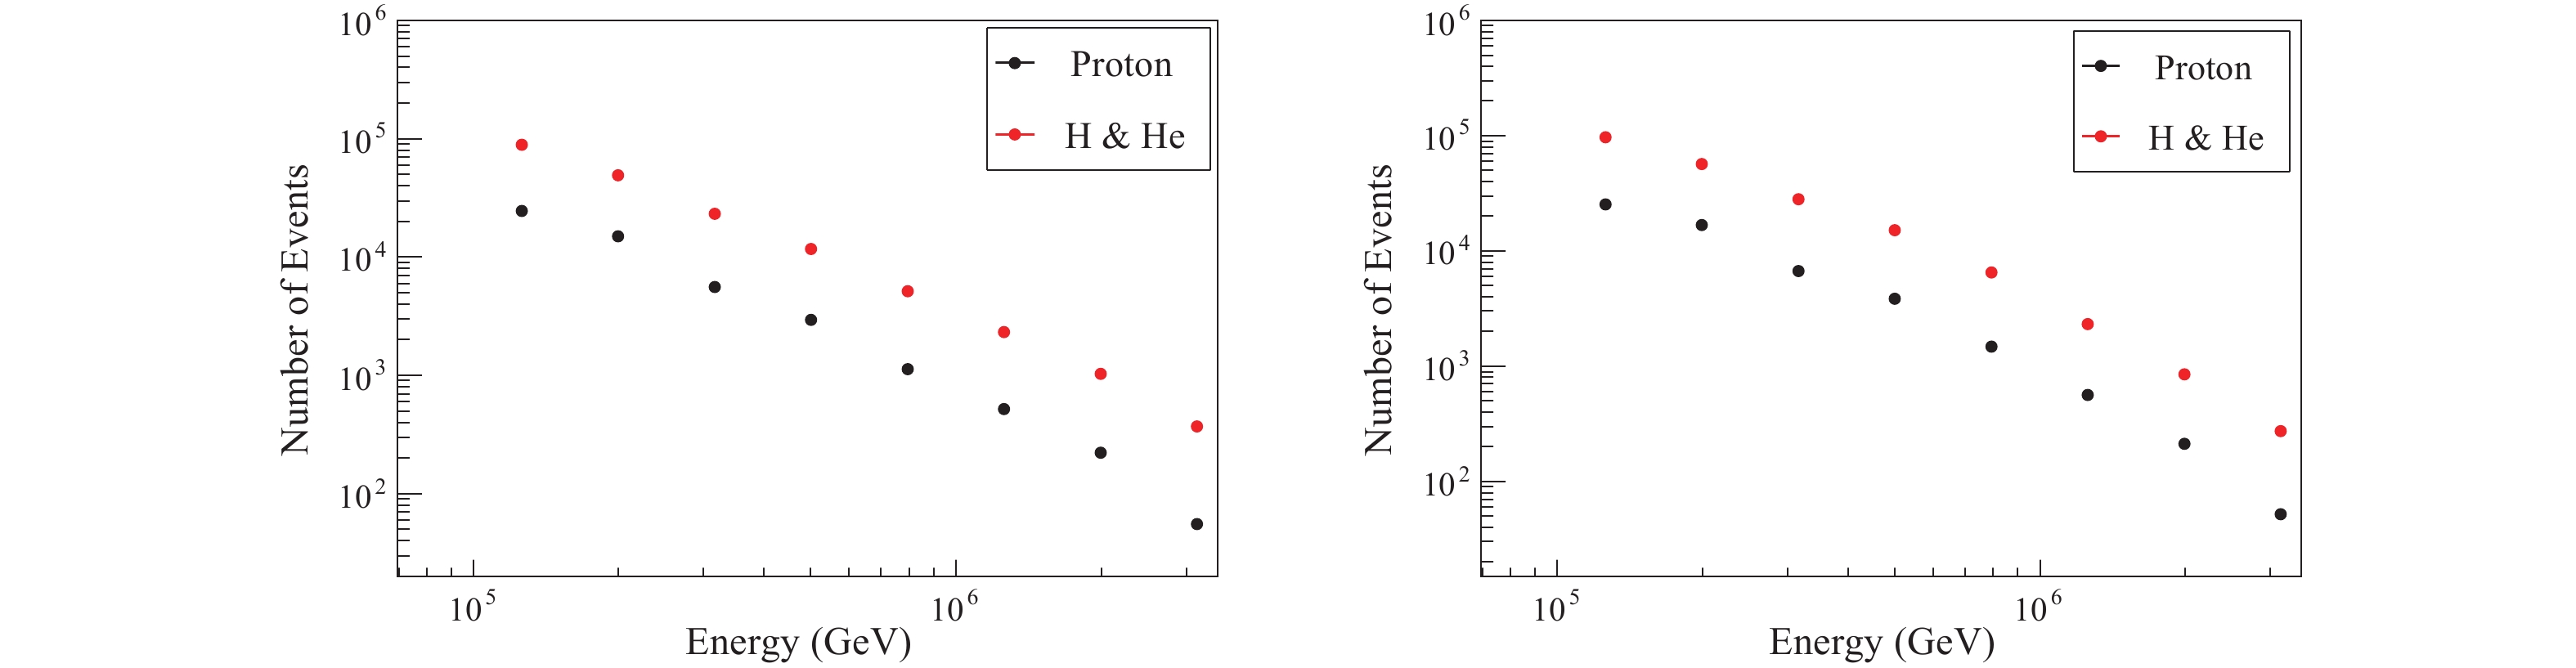 Figure16. (color online) The statistics for one year with a 10% duty cycle for the H?randel model (left) and the ARGO-YBJ/WFCT model (right).
At 800 TeV, 5121/6461 H&He events and 1130/1476 proton events can be selected in one year according to the H?randel model and the ARGO-YBJ/WFCT model, respectively. At 2 PeV, 1023/849 H&He events and 222/210 proton events can be selected in one year according to the H?randel model and the ARGO-YBJ/WFCT model, respectively.
Therefore, if the knee of the cosmic ray light component is below 1 PeV, the 1/4 LHAASO array can give good measurements within one year. If the knee of the light component is higher than 3 PeV, more observation time, or a more effective method, is needed to get sufficient statistics. The use of SiPM allows observations during a Moon night with WFCTA, and the duty cycle of the hybrid observation can be extended. Moreover, additional Cherenkov telescopes installed during the construction of LHAASO can also increase the statistics effectively.
After the cuts, high purity light component samples were selected. The aperture for pure protons is 900 m2 Sr, and the contamination is around 10% according to the H?randel model. The aperture for H&He is 1800 m2 Sr, and the contamination is less than 3%. For the H&He aperture, the uncertainty from the different strong interaction models is about ±5%. Moreover, the bias of energy reconstruction is about ±4% and the resolution is less than 20% for both pure proton and H&He samples.
According to the energy spectrum expected from the ARGO-YBJ/WFCT model, the spectrum of the light component of cosmic rays could be measured accurately in a short time with the 1/4 LHAASO array.
