HTML
--> --> -->Some astrophysicists (e.g., studies depicted Refs. [20–26]) discussed the SES problem in detail. Many works (e.g., Refs. [27–30]) also addressed the the effects of ion and electron screening on thermonuclear reaction rates. However, these studies did not consider the influence of SES on the chemical potential, Q-value, shell and pair effects. The SES strongly influences the beta decay threshold energy and the chemical potential. Thus, it is very important to accurately investigate the beta decay neutrino energy loss in the SES.
Our previous studies [31, 32] demonstrated that the SES affects the beta decay rates and neutrino cooling to a great degree. However, these studies neglected the SES effect on the chemical potential in the beta decay. Toki et al. [33] have calculated
Our studies differ from these works [33, 34] in discussing the SES effects on the beta decay and neutrino cooling. First, these works discussed the weak interaction rates for some
The SES model (I) is mainly focused on the screening electrostatic potential per electron under the Wigner-Seitz approximation and Q-value correction based on the IBSM from Ref. [20]. The SES model (II) is mainly focused on the linear response theory by considering the effect of the SES on the Q-value and Coulomb chemical potential due to the change of Coulomb free energy (see Refs. [36, 37, 39] for a detailed discussion)
We organize this paper as follows. In Section 2, we study the beta decay AELR and the half-lives in the absence of SES. In Section 3, we discuss the screening potential, and the screening corrections to the Q-value and the AELR for the model (I). In Section 4, we discuss the AELR and the screening corrections of the Q-value, the electron chemical potential for the model (II). We analyze the influence of SES on the AELR. Our results and discussions are provided in Section 5. In Section 6, we present our conclusions.
$ \lambda_{\rm{AELR}}^0 = \ln2 \sum\frac{(2J_i+1){\rm e}^{\frac{-E_i}{k_{B}T}}}{G(Z, A, T)} \sum\limits_{f} \frac{\xi(\rho, T, Y_e, Q_{ij})}{ft_{ij}}, $  | (1) |
$ \begin{split} \xi(\rho, T, Y_e, Q_{ij}) =& \frac{c^3}{(m_ec^2)^5}\int_1^{Q_{ij}}{\rm d}\varepsilon_e \varepsilon_e(\varepsilon_e^2-1)^{1/2} \\& \times (Q_{ij}-\varepsilon_e)^3\frac{F(Z+1, \varepsilon_e)}{1+\exp[(U_F-\varepsilon_e)/k_{B}T]}, \end{split} $  | (2) |
In the pre-collapse phase, the electron chemical potential is given by [30]
$ U_F = 1.11(\rho_7Y_e)^{1/3}\left[1+\left(\frac{\pi}{1.11}\right)\frac{(k_BT)^2}{(\rho_7Y_e)^{2/3}}\right]^{-1/3}\; \; \rm{MeV} . $  | (3) |
$ \begin{split} \ln(ft_{ij}) =& a_1+\left(\alpha^2Z^2-5+a_2\frac{N-Z}{A}\right)\ln(Q_{if}-a_3\delta) \\& +(a_4\alpha^2Z^2)+\frac{1}{3}\alpha^2Z^2\ln(A)-\alpha Z\pi+S(N, Z), \end{split} $  | (4) |
$ \begin{split} S(N, Z) =& a_5\exp(-((N-28)^2+(N-20)^2)/12)\\& +a_6\exp(-((N-50)^2+(N-38)^2)/43)\\ &+a_7\exp(-((N-82)^2+(N-50)^2)/13)\\& +a_8\exp(-((N-82)^2+(N-58)^2)/24)\\& +a_9\exp(-((N-110)^2+(N-70)^2)/244), \end{split} $  | (5) |
$ D_1 = 1.784\times10^{-5}\left(\frac{Z^{5/3}}{AY_e^{2/3}}\right)\rho^{1/3}\; \; \; \rm{MeV}. $  | (6) |
$ \Delta Q\approx 2.940\times10^{-5}Z^{2/3}(\rho Y_e)^{1/3}\; \; \; \rm{MeV}. $  | (7) |
We can not neglect the SES influence at high density, as the screening energy is high. The electron energy will change from
$ \begin{split} \xi^s(\rho, T, Y_e, Q_{ij}^s)(\rm{I}) =& \frac{c^3}{(m_ec^2)^5}\int_{1+D_1}^{Q_{ij}^s(\rm{II})+D_1}{\rm d}\varepsilon_e^s \varepsilon_e^s\\ &\times((\varepsilon^s_e)^2-1)^{1/2}(Q^s_{ij}-\varepsilon_e^s)^3\\ &\times \frac{F(Z+1, \varepsilon_e^s)}{1+\exp[(U_F-\varepsilon_e^s)/k_{B}T]}. \end{split} $  | (8) |
$ \lambda_{\rm AELR}^s({\rm I}) = \ln2 \sum\frac{(2J_i+1){\rm e}^{\frac{-E_i}{k_{B}T}}}{G(Z, A, T)} \sum\limits_{{f}} \frac{\xi^s(\rho, T, Y_e, Q^s_{ij})}{ft^s_{ij}}, $  | (9) |
$ \begin{split} \ln(ft^s_{ij})(\rm{I}) =& a_1+\left(\alpha^2Z^2-5+a_2\frac{N-Z}{A}\right)\ln(Q^s_{if}-a_3\delta)\\& +(a_4\alpha^2Z^2)+\frac{1}{3}\alpha^2Z^2\ln(A)-\alpha Z\pi+S(N, Z). \end{split} $  | (10) |
$ T\ll T_F = 5.930\times10^9\left\{\left[1+1.018\left(\frac{Z}{A}\right)^{2/3}(10\rho_7)^{2/3}\right]^{1/2}-1\right\}, $  | (11) |
The static longitudinal dielectric function has been discussed by Jancovici et al. [41] for relativistic degenerate of electron fluid. Because of the SES effect, the electron potential energy is given by
$ V(r) = -\frac{Ze^2(2k_{\rm F})}{2k_{\rm F}r}\frac{2}{\pi}\int_0^\infty \frac{\sin[(2k_{\rm F}r)]q}{q\epsilon(q, 0)}{\rm d}q, $  | (12) |
According to the linear response theory, the screening potential is determined by
$ D_2 = 7.525\times10^{-3}Z\left(\frac{10Z\rho_7}{A}\right)^{\frac{1}{3}}J(r_s, R) ~(\rm{MeV}), $  | (13) |
It is well known that the SES also plays a key role in determining the thermodynamical properties at high density plasma surrounding [42]. When one includes the contribution of the SES, the chemical potential for nuclei is given by
$ U_F^s = U_F^0+U_{iC}, $  | (14) |
Because the stellar core can comprise multi-component plasma, all the thermodynamic quantities are computed as the sum of the individual quantities for each species. If one further assumes that the electron distribution is not affected by the presence of the nuclear charges (uniform background approximation), the correction from Coulomb chemical potential of the nuclei
$ U_{iC} = kTf_C(\Gamma_i), $  | (15) |
According to the discussions for the Coulomb free energy, we will use the expression of (e.g., [36, 37])
$ f_C(\Gamma) = -\Gamma_e\frac{c_{\rm{DH}}\sqrt{\Gamma_e}+ac_{\rm{TF}}\Gamma_e^\nu g_1(r_s)h_1(x)}{1+[b\sqrt{\Gamma_e}+ag_2(r_s)\Gamma_e/r_s]h_2(x)}, $  | (16) |
$ c_{\rm{DH}} = \frac{Z}{\sqrt{3}}[(1+Z)^{3/2}-Z^{3/2}-1], $  | (17) |
$ c_{\rm{TF}} = c_{\infty}Z^{7/3}[1-Z^{-1/3}+0.2Z^{-1/2}], $  | (18) |
$ g_1(r_s) = 1+\frac{0.78}{21+\Gamma_e(Z/r_s)^3}\left(\frac{\Gamma_e}{Z}\right)^{1/2}, $  | (19) |
$ g_2(r_s) = 1+\frac{Z-1}{9}\left(1+\frac{1}{0.001Z^2+2\Gamma_e}\right)\frac{r_s^3}{1+6r_s^2}, $  | (20) |
The Coulomb corrections contribute to changing the threshold energy in beta decay by
$ \Delta Q^s_{if}({\rm II}) = U_{C}(Z+1)-U_C(Z). $  | (21) |
$ Q^s_{if}({\rm II}) = Q^{ss}_{if} = Q_{if}+\Delta Q^s_{if}(\rm{II}). $  | (22) |
$ \begin{split} \xi^{ss}(\rho, T, Y_e, Q_{ij}^{ss})(\rm{II}) =& \frac{c^3}{(m_ec^2)^5}\int_{1+D_2}^{Q_{ij}^{ss}+D_2}{\rm d}\varepsilon_e^{ss} \varepsilon_e^{ss} \\ &\times((\varepsilon^{ss}_e)^2-1)^{1/2}(Q^{ss}_{ij}-\varepsilon_e^{ss})^3\\& \times\frac{F(Z+1, \varepsilon_e^{ss})}{1+\exp[(U^s_F-\varepsilon_e^{ss})/k_{B}T]}.\end{split} $  | (23) |
$ \lambda_{\rm{AELR}}^s({\rm II}) = \ln2 \sum\frac{(2J_i+1){\rm e}^{\frac{-E_i}{k_{B}T}}}{G(Z, A, T)} \sum\limits_{f} \frac{\xi^{ss}(\rho, T, Y_e, Q^{ss}_{ij})}{ft^{ss}_{ij}(\rm{II})}, $  | (24) |
$ \begin{split} \ln(ft^{ss}_{ij}(\rm{II})) =& a_1+\left(\alpha^2Z^2-5+a_2\frac{N-Z}{A}\right)\ln(Q^{ss}_{if}-a_3\delta)\\ &+(a_4\alpha^2Z^2)+\frac{1}{3}\alpha^2Z^2\ln(A)-\alpha Z\pi+S(N, Z). \end{split} $  | (25) |
$ C(i) = \frac{\lambda_{\rm{AELR}}^s(i)}{\lambda_{\rm{AELR}}^0}\; \; (i = 1, 2), $  | (26) |
 Figure1. (color online)
  Figure2. (color online)
 Figures 3 and 4 show the ratios
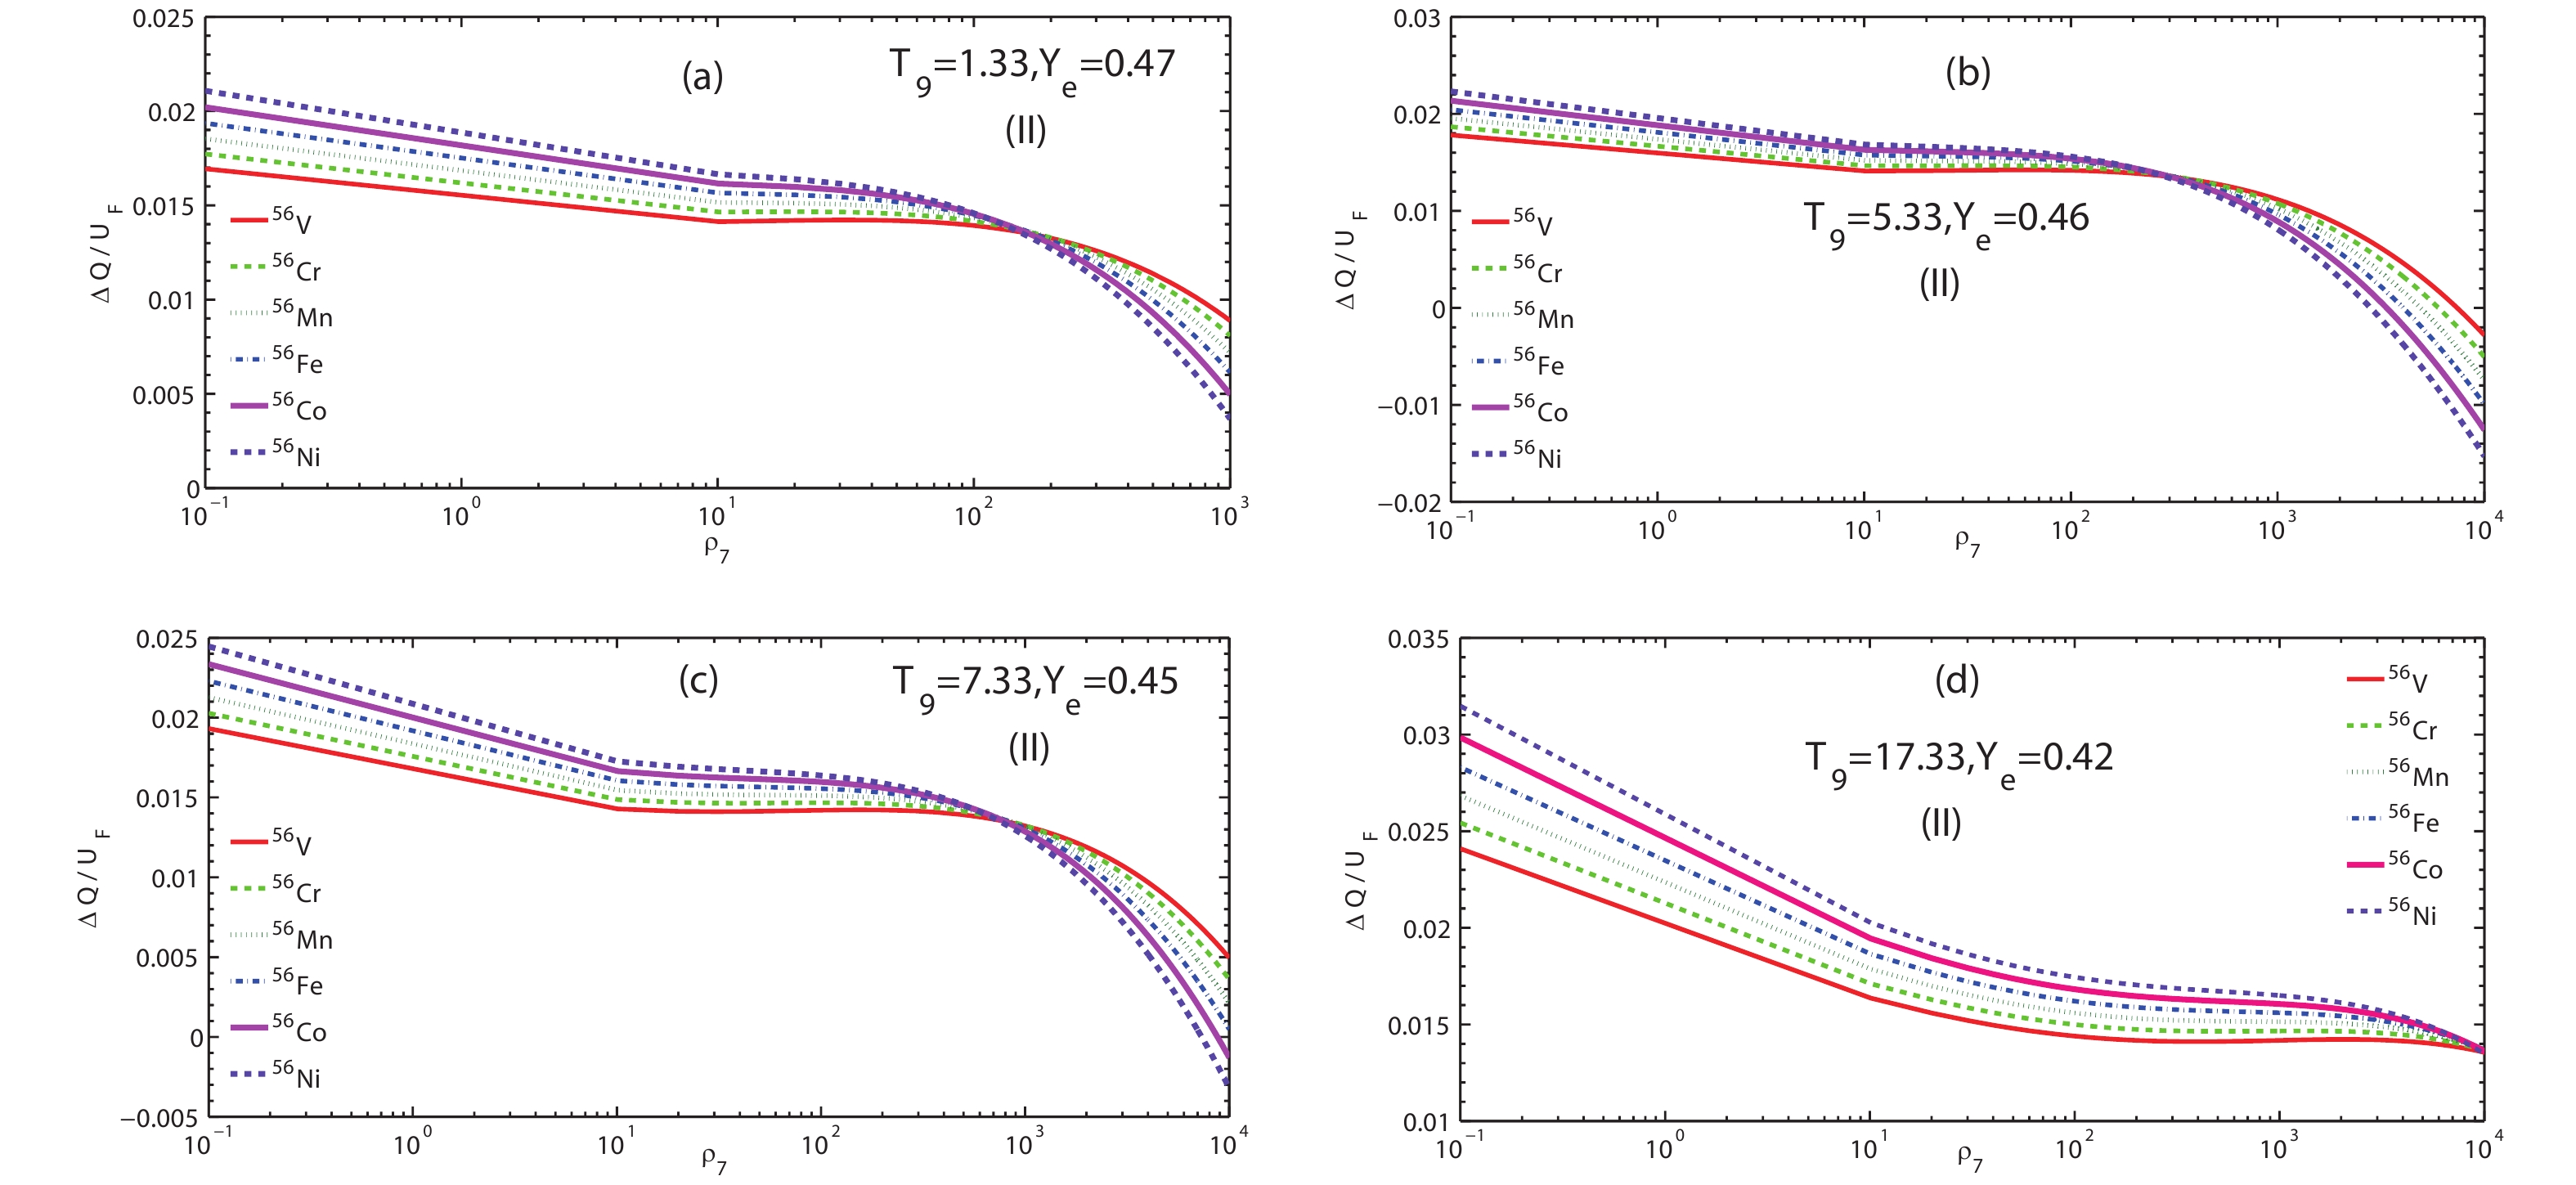 Figure3. (color online)
  Figure4. (color online)
 The screening factors
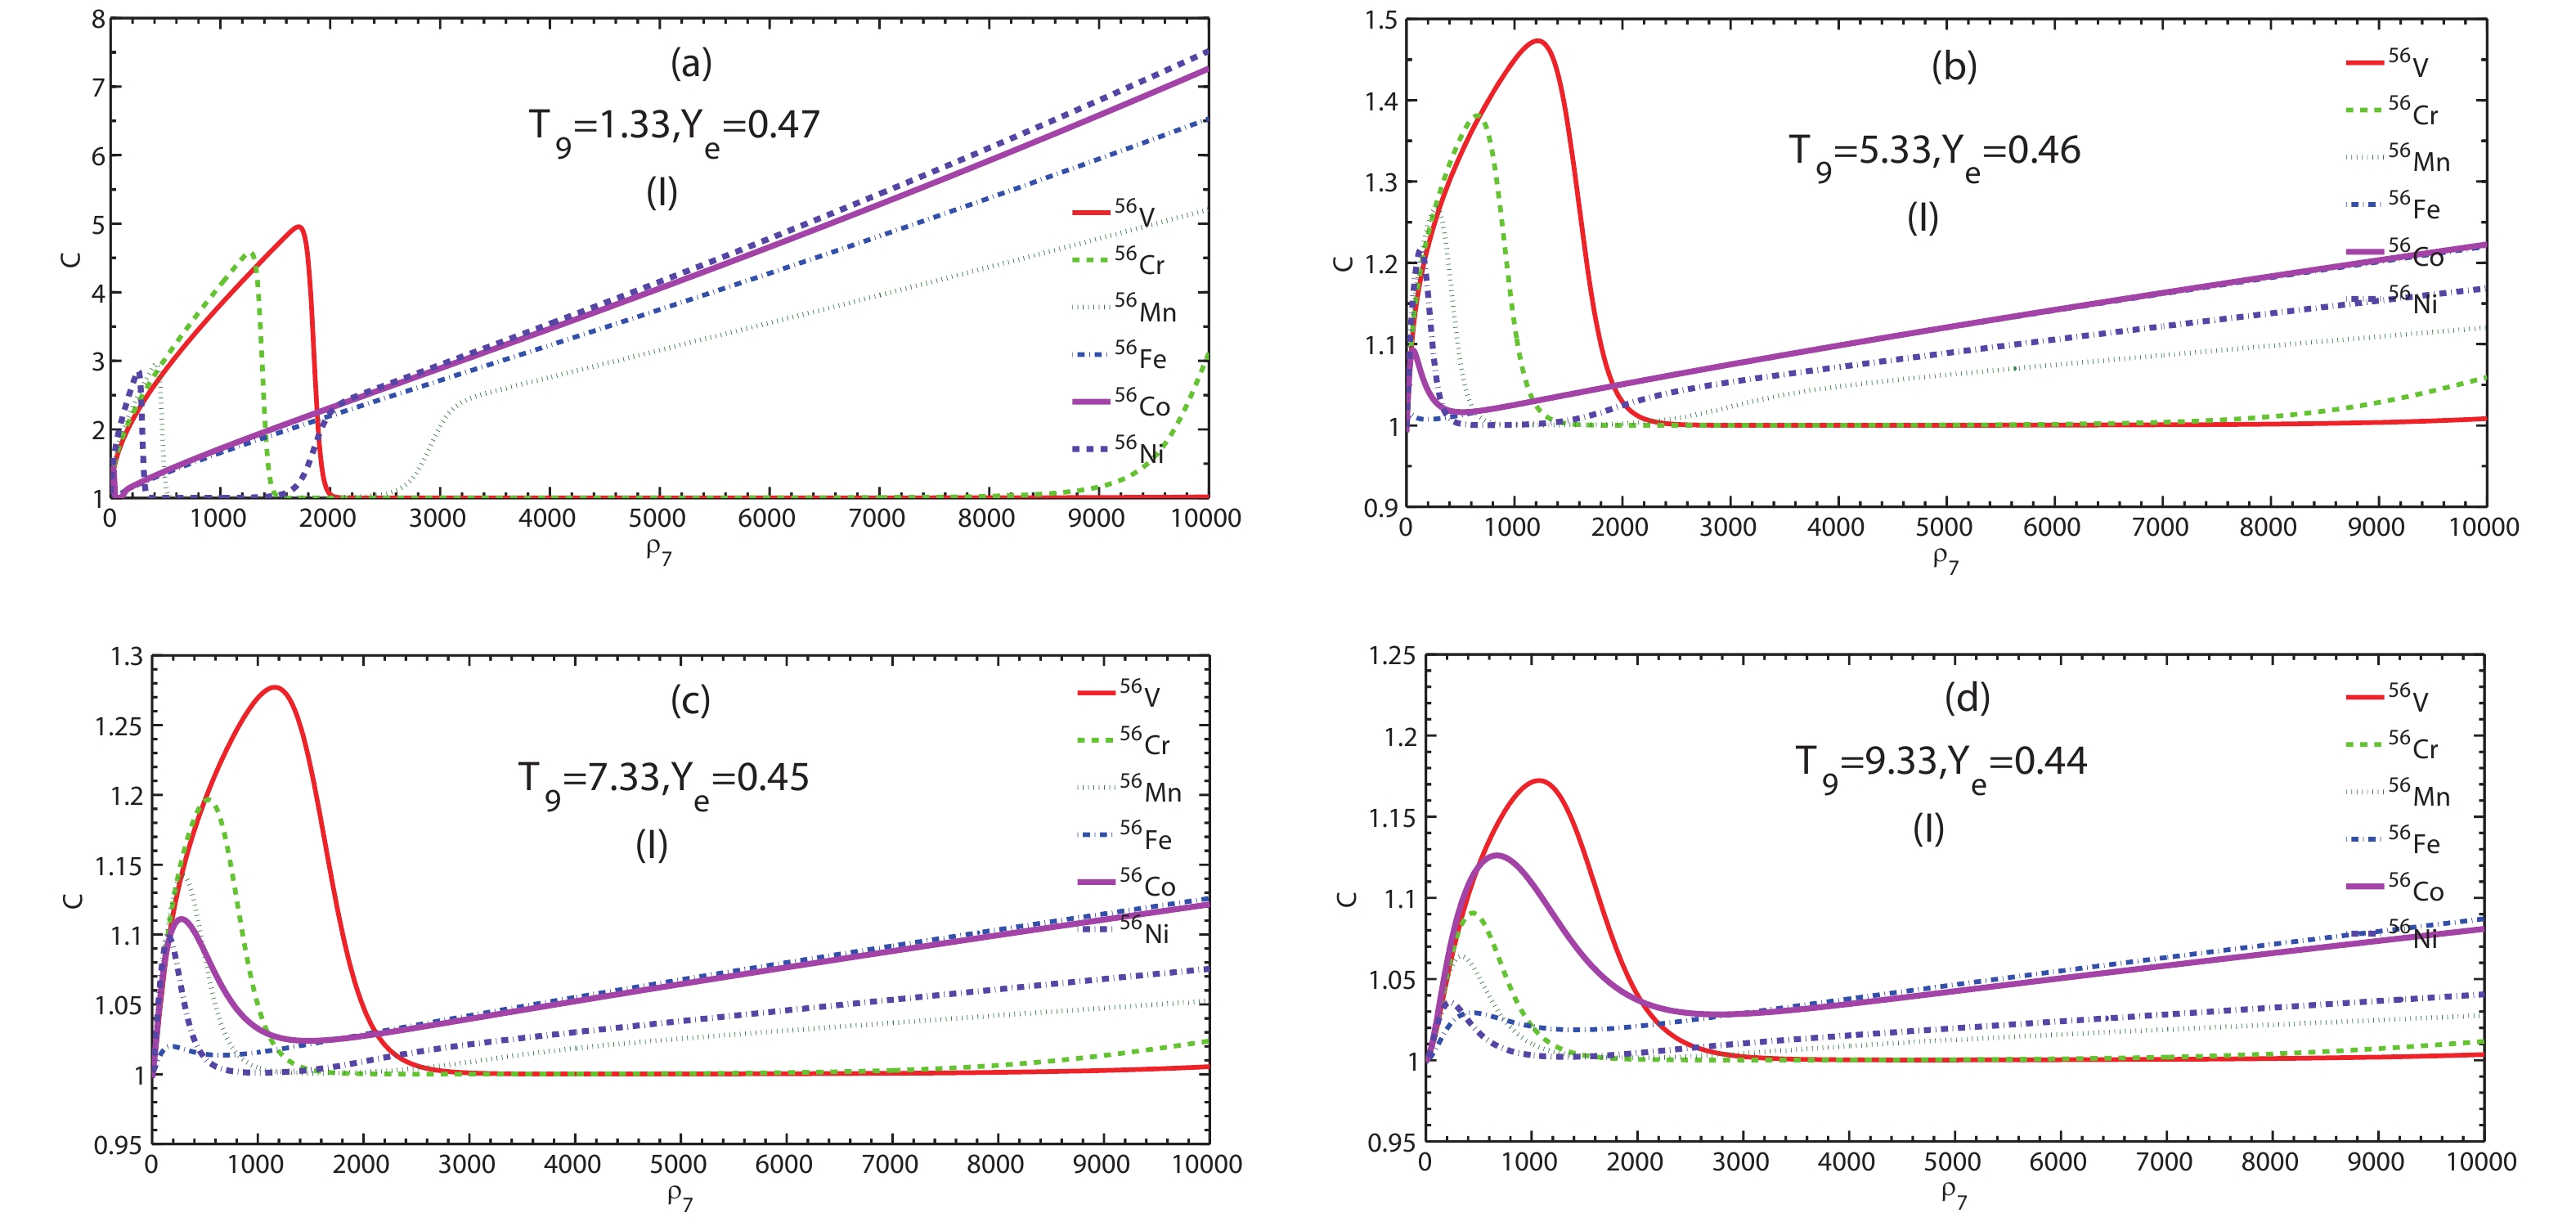 Figure5. (color online) Screening enhancement factor C by beta decay of 56V, 56Cr, 56Mn, 56Fe, 56Co, and 56Ni as a function of electron density
 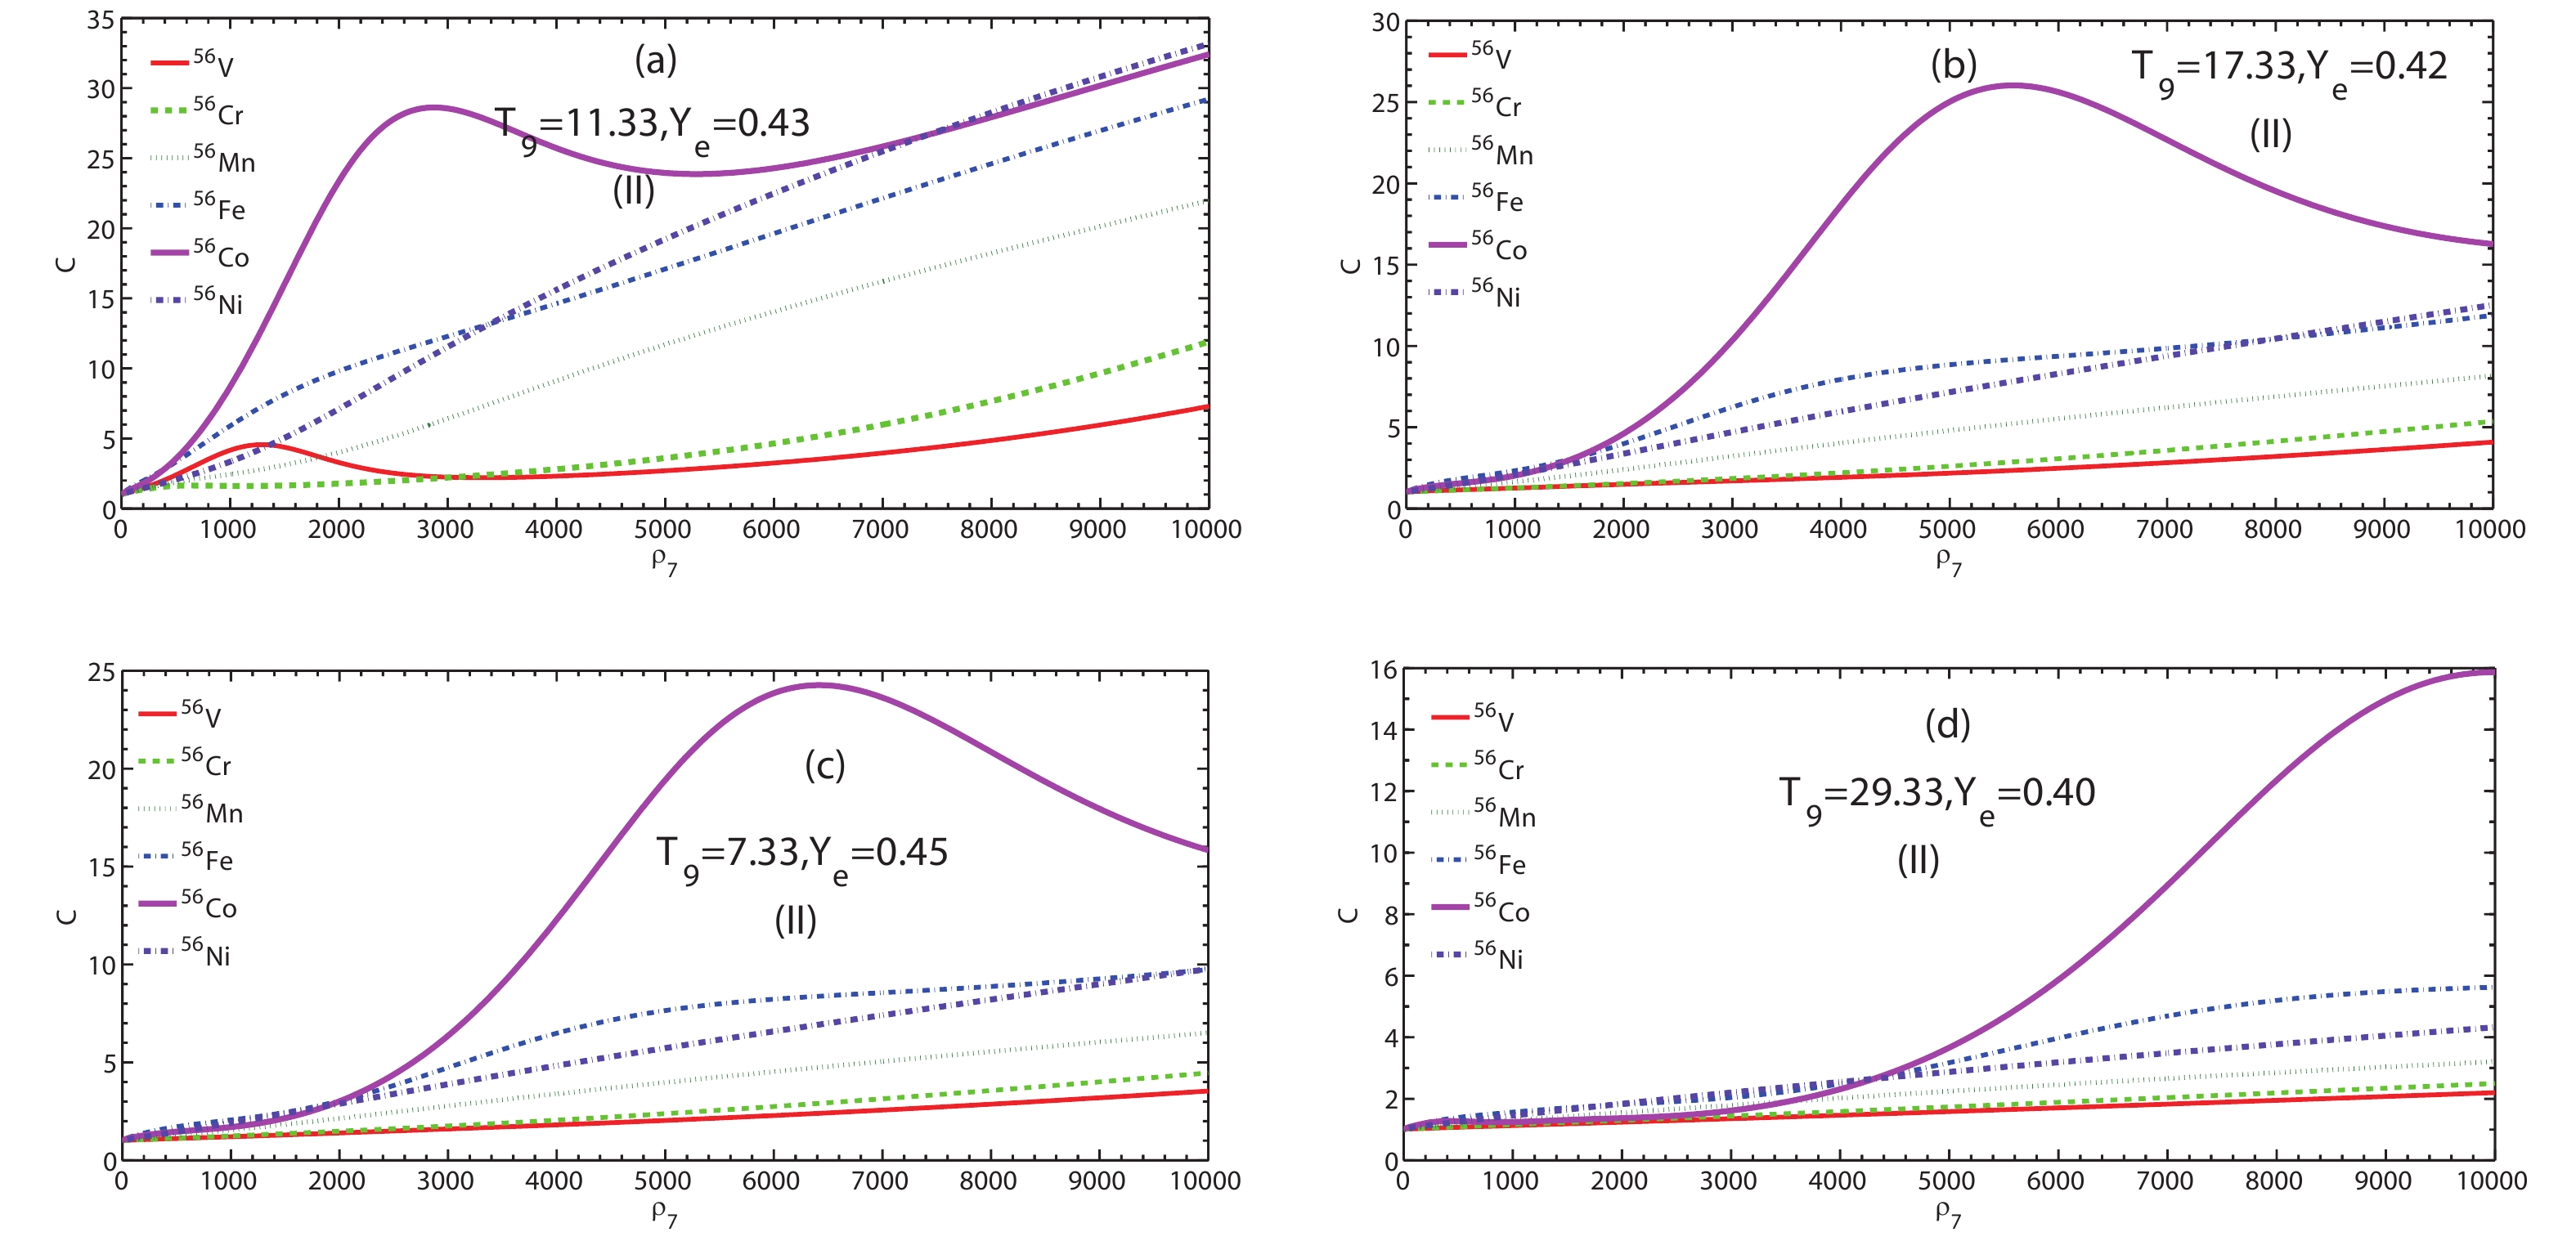 Figure8. (color online) Screening enhancement factor C by beta decay of 56V, 56Cr, 56Mn, 56Fe, 56Co, and 56Ni as a function of electron density
 At relatively low (
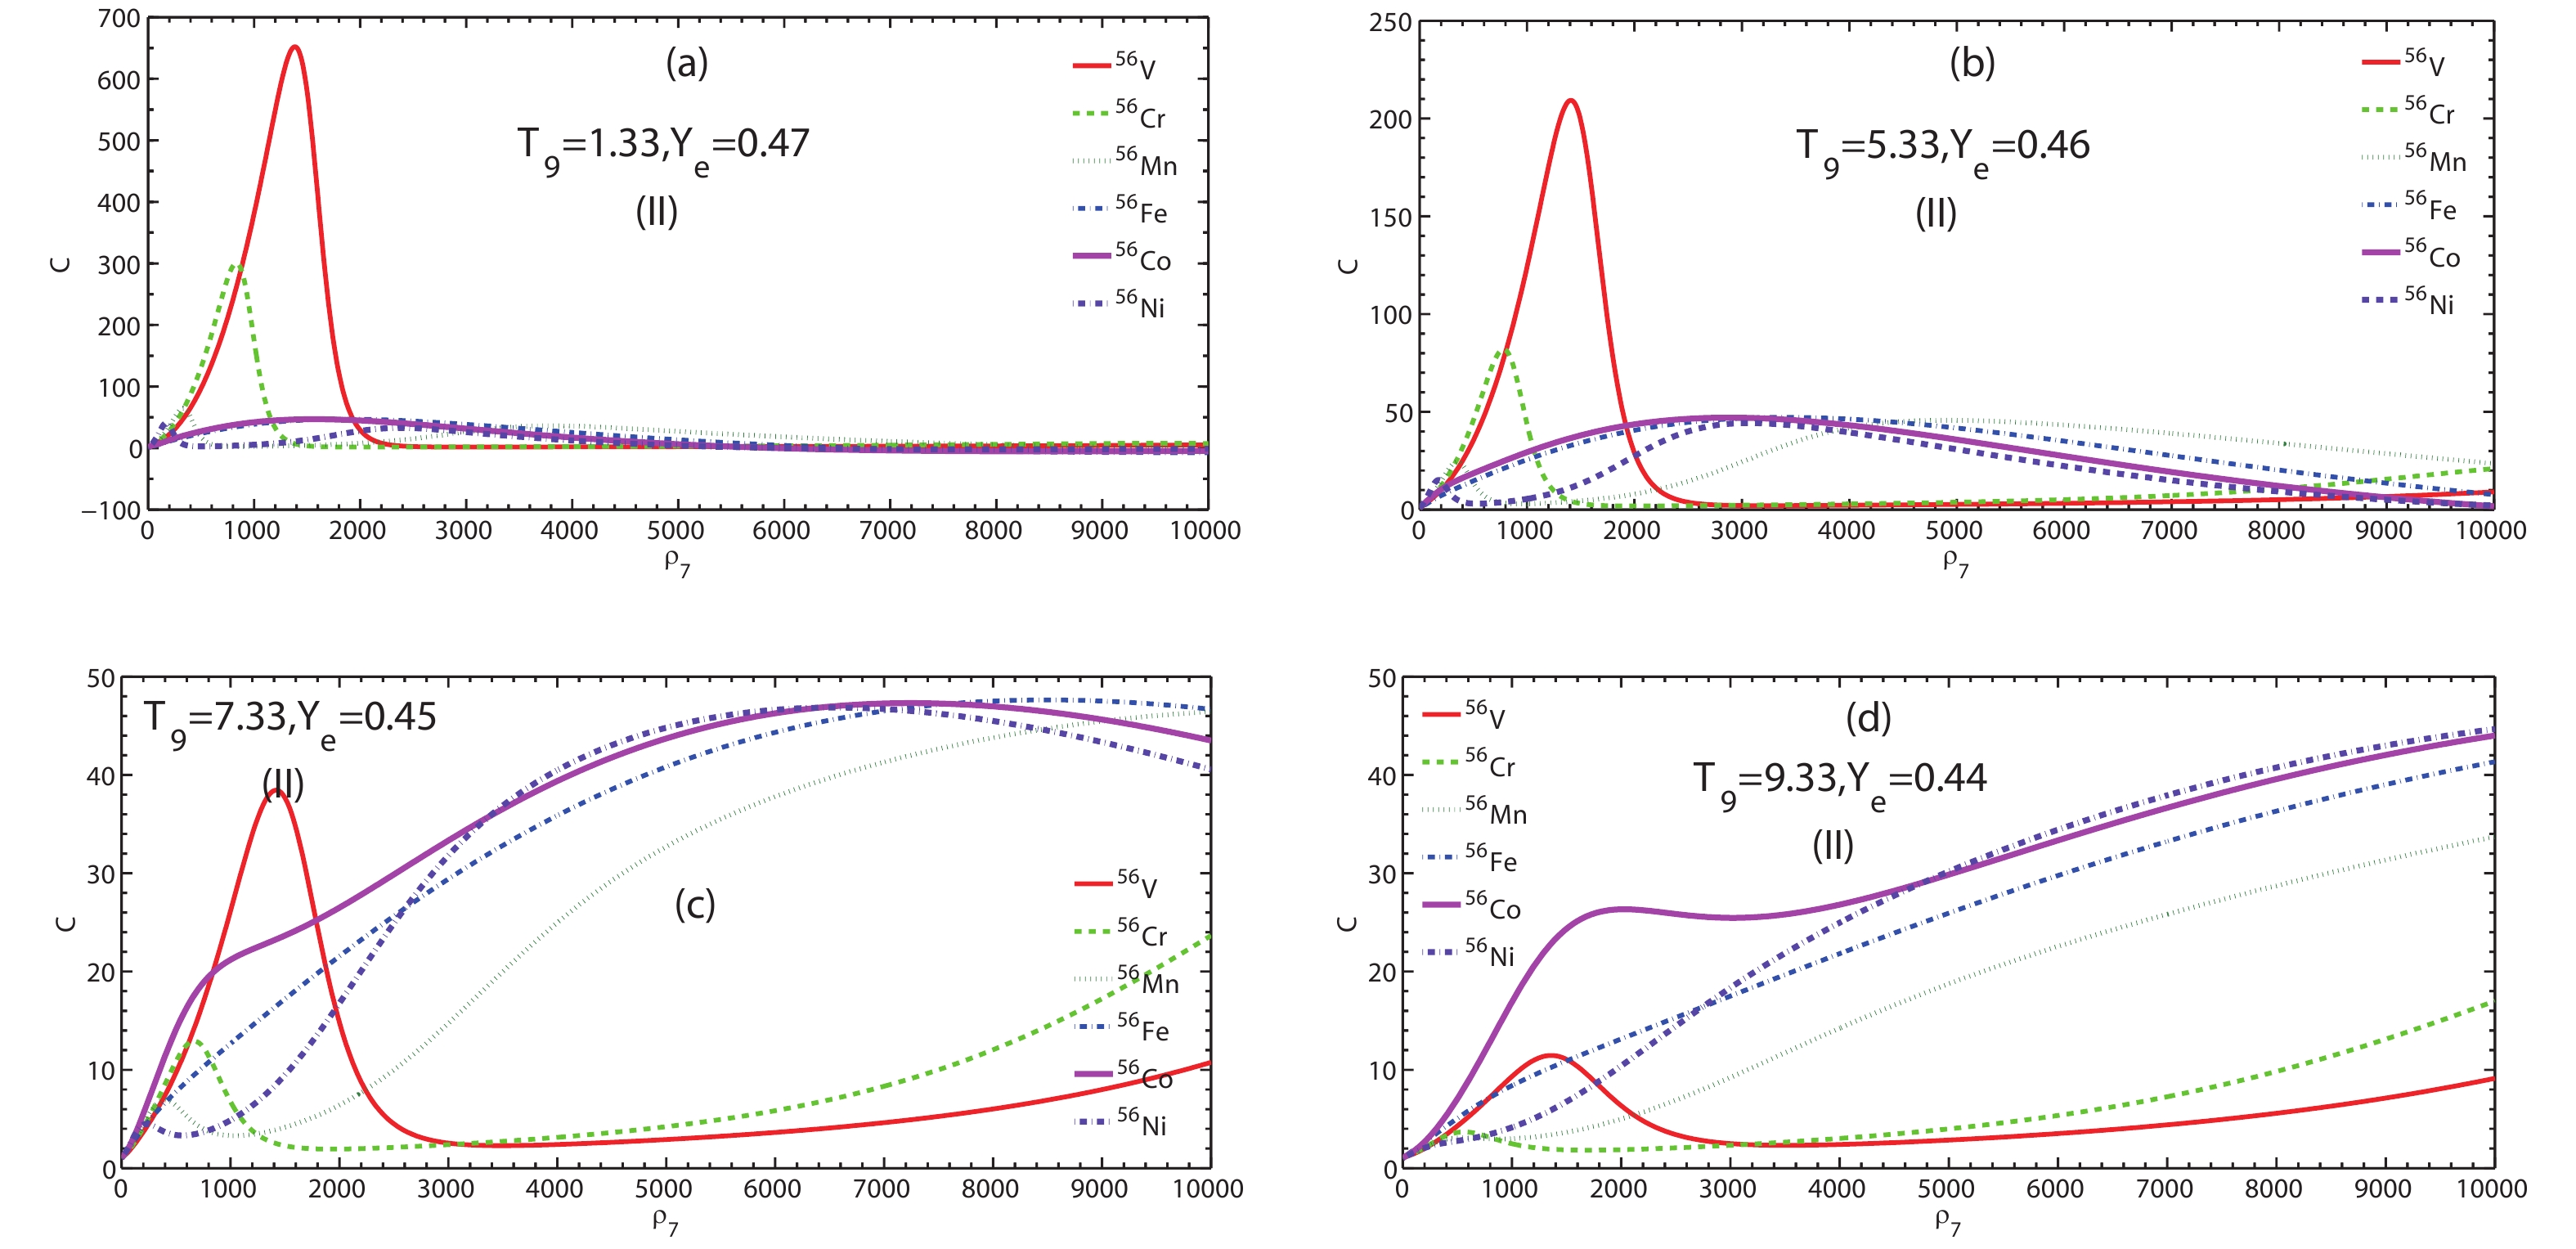 Figure6. (color online) Screening enhancement factor C by beta decay of 56V, 56Cr, 56Mn, 56Fe, 56Co, and 56Ni as a function of electron density
 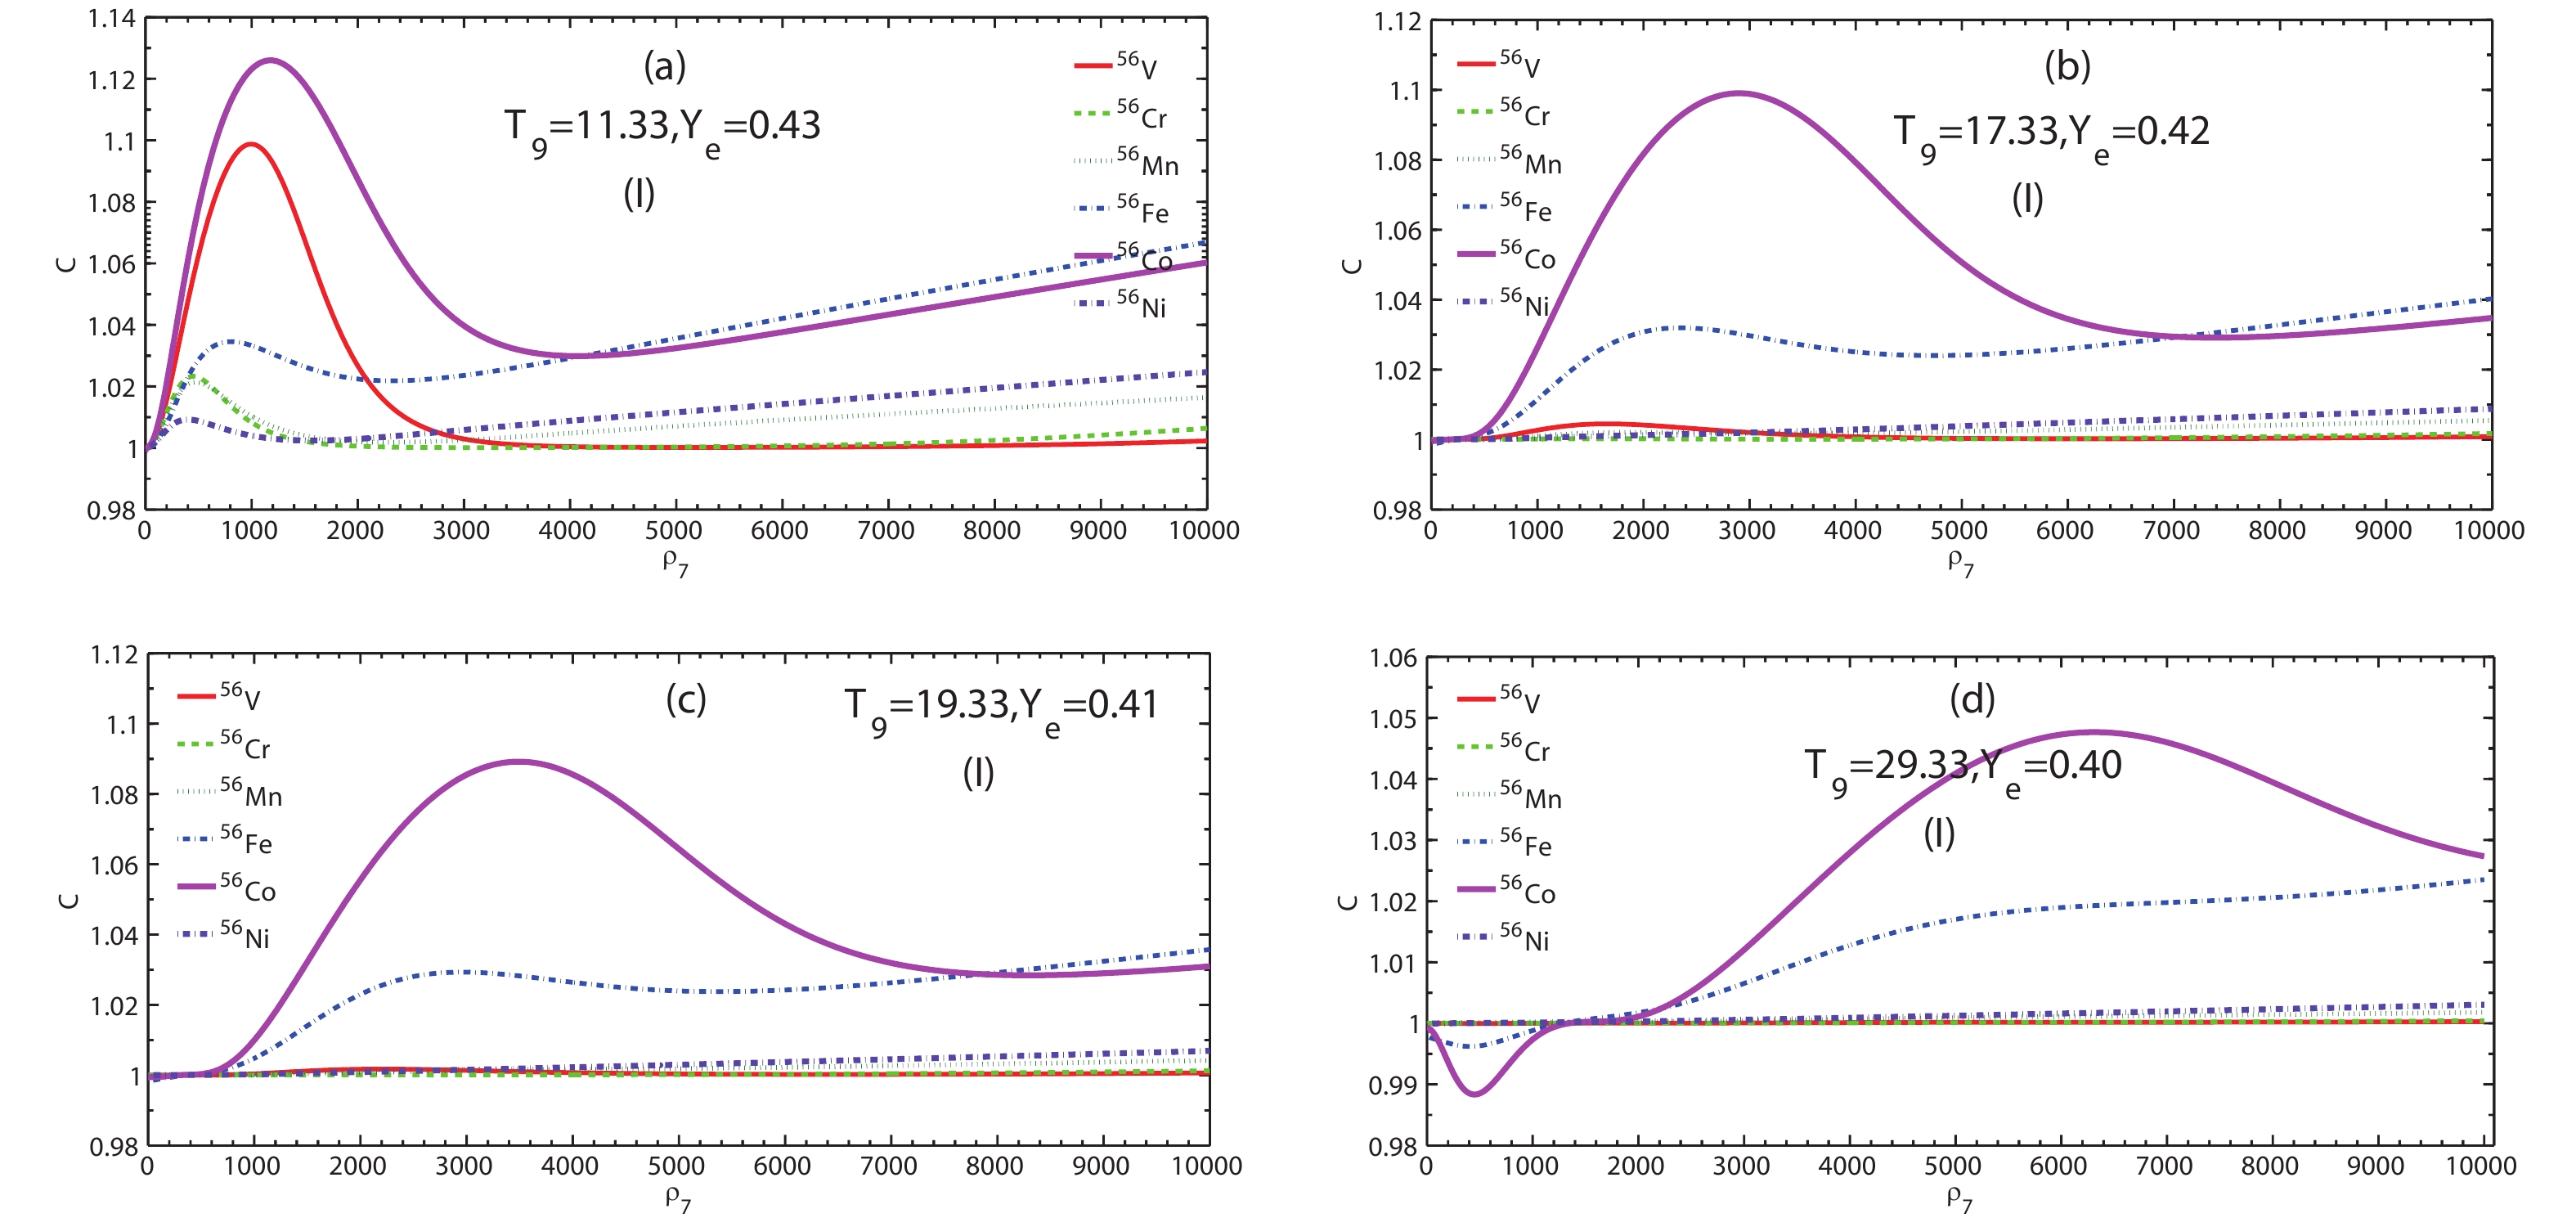 Figure7. (color online) Screening enhancement factor C by beta decay of 56V, 56Cr, 56Mn, 56Fe, 56Co, and 56Ni as a function of electron density
 Judging from the influence of SES on nuclear physics and nuclear structure, the electron screening potential can significantly increase the energy of outgoing electrons during the beta decay process. In addition, the SES can also increase the energy of individual particles, whereas it relatively decreases the threshold needed for beta decay reactions because of the increase in the number of high-energy electrons. Indeed, the SES greatly accelerates the progress of beta decay.
Tables 1–4 show our results in terms of the screening enhancement factor
| nuclei | T9 = 1.33, Ye = 0.47 | T9 = 5.33, Ye = 0.46 | T9 = 7.33, Ye = 0.45 | T9 = 9.33, Ye = 0.44 | |||||||
| ρ7 | C(max) | ρ7 | C(max) | ρ7 | C(max) | ρ7 | C(max) | ||||
| 56V | 1712 | 4.955 | 1221 | 1.473 | 1161 | 1.277 | 1071 | 1.172 | |||
| 56Cr | 1271 | 4.584 | 650.7 | 1.381 | 520.6 | 1.197 | 440.5 | 1.091 | |||
| 56Mn | 10000 | 5.208 | 260.4 | 1.266 | 270.4 | 1.141 | 340.4 | 1.064 | |||
| 56Fe | 10000 | 6.532 | 10000 | 1.222 | 10000 | 1.126 | 10000 | 1.087 | |||
| 56Co | 10000 | 7.257 | 10000 | 1.223 | 10000 | 1.122 | 670.8 | 1.126 | |||
| 56Ni | 10000 | 7.272 | 150.2 | 1.213 | 150.2 | 1.098 | 10000 | 1.041 | |||
Table1.Maxima of strong screening enhancement factor C at several typical temperatures within the medium temperature range for model (I).
| nuclei | T9 = 1.33, Ye = 0.47 | T9 = 5.33, Ye = 0.46 | T9 = 7.33, Ye = 0.45 | T9 = 9.33, Ye = 0.44 | |||||||
| ρ7 | C(max) | ρ7 | C(max) | ρ7 | C(max) | ρ7 | C(max) | ||||
| 56V | 1391 | 651.9 | 1411 | 209.3 | 1422 | 38.45 | 1331 | 11.45 | |||
| 56Cr | 810.9 | 298.2 | 780.9 | 81.98 | 10000 | 23.66 | 10000 | 17.00 | |||
| 56Mn | 330.4 | 64.80 | 4455 | 44.58 | 10000 | 46.70 | 10000 | 33.67 | |||
| 56Fe | 1772 | 46.38 | 3564 | 47.12 | 8509 | 47.63 | 10000 | 41.34 | |||
| 56Co | 1452 | 46.74 | 2883 | 47.02 | 7277 | 47.31 | 10000 | 44.65 | |||
| 56Ni | 1703 | 40.90 | 3093 | 44.26 | 6527 | 46.85 | 10000 | 44.66 | |||
Table2.Maxima of strong screening enhancement factor C at several typical temperatures within the medium temperature range for model (II).
| nuclei | T9 = 11.33, Ye = 0.43 | T9 = 17.33, Ye = 0.42 | T9 = 19.33, Ye = 0.41 | T9 = 29.33, Ye = 0.40 | |||||||
| ρ7 | C(max) | ρ7 | C(max) | ρ7 | C(max) | ρ7 | C(max) | ||||
| 56V | 10000 | 7.286 | 10000 | 4.087 | 10000 | 3.523 | 10000 | 2.196 | |||
| 56Cr | 10000 | 11.86 | 10000 | 5.343 | 10000 | 4.447 | 10000 | 2.492 | |||
| 56Mn | 10000 | 21.91 | 10000 | 8.139 | 10000 | 6.501 | 10000 | 3.205 | |||
| 56Fe | 10000 | 29.16 | 10000 | 11.86 | 10000 | 9.745 | 10000 | 5.622 | |||
| 56Co | 2382 | 32.37 | 5526 | 26.01 | 6326 | 24.24 | 10000 | 15.86 | |||
| 56Ni | 10000 | 33.14 | 10000 | 12.49 | 10000 | 9.746 | 10000 | 4.319 | |||
Table4.Maxima of strong screening enhancement factor C at several typical temperatures in the relatively high temperature range for model (II).
The results of
| nuclei | T9 = 11.33, Ye = 0.43 | T9 = 17.33, Ye = 0.42 | T9 = 19.33, Ye = 0.41 | T9 = 29.33, Ye = 0.40 | |||||||
| ρ7 | C(max) | ρ7 | C(max) | ρ7 | C(max) | ρ7 | C(max) | ||||
| 56V | 991.1 | 1.099 | 1542 | 1.004 | 10000 | 1.001 | 10000 | 1.001 | |||
| 56Cr | 410.5 | 1.024 | 10000 | 1.002 | 10000 | 1.002 | 10000 | 1.002 | |||
| 56Mn | 460.6 | 1.021 | 10000 | 1.005 | 10000 | 1.004 | 10000 | 1.003 | |||
| 56Fe | 10000 | 1.067 | 10000 | 1.040 | 10000 | 1.036 | 10000 | 1.023 | |||
| 56Co | 1171 | 1.126 | 2833 | 1.099 | 3413 | 1.089 | 6486 | 1.047 | |||
| 56Ni | 10000 | 1.025 | 10000 | 1.009 | 10000 | 1.007 | 10000 | 1.003 | |||
Table3.Maxima of strong screening enhancement factor C at several typical temperatures in the relatively high temperature range for model (I).
To summarize the above analysis, the
For model (I), the SES significantly alters the Q-value, the electron energy, and the half-life for the beta decay. According to Eqs. (7) and (10), due to the Q-value correction, the comparative half-life increases with the increase the Q-value. Because of the interactions among the electrons in plasma, the nuclear binding energy decreases. The effective nuclear Q-value (
For model (II), we discuss the influence of the SES on the enhancement factor and AERL by beta decay, by considering the corrections of the Q-value, electron energy, and the half-life, as well as the electron chemical potential. According to Eqs. (13–22, 25), the half-life and electron chemical potential increase due to the the Q-value correction in the SES. The nuclear binding energy also decreases due to interactions with the dense electron gas in the SES. Based on Eqs. (13–24), the beta decay increases greatly due to the SES. Comparison of the results of model (I) with those of model (II), as shown in Figs. 5-8, shows that an improved estimation of the SES for AERL is given in the model (II).
In contrast, the pairing effect and Q-values with the neutron number of the parent nuclei play key roles in the
The shell and pairing effects are very important in the nuclear structure. Some information on the pairing effects on
Because of the quantum effect, the shell effect strongly changes the nuclear structure and influences the
Based on Eqs. (7) and (10) for the model (I) (Eqs. (15–22) and Eq. (25) for the model (II)), the SES influences the Q-value and decay half-lives. From Figs. 1–4, we find that the enhancement factor
The AELR by beta decay plays a key role in stellar cooling evolution. Our results may have important consequences for astrophysical applications, and in particular, for the burst mechanism of supernovae explosion and cooling numerical simulations.

