HTML
--> --> -->To measure the muon lateral distribution, a hybrid experiment is preferred. As an example, a surface detector array may be used to measure the primary energy, angular direction and core position of a shower event, and a muon detector array for the number density of muons at various locations. With such a design, the KASCADE-Grande experiment has measured lateral muon distributions with a muon-to-shower-axis distance from 100 m to 610 m, and reconstructed energy from 1016 – 1017eV [1]. With a smaller scale experiment, this work reports a similar measurement with the lateral distance between 20 – 100 m, which is much closer to the shower core. Besides, the punch-through effect in our analysis is carefully evaluated via simulation.
SA consists of 116 plastic scintillation detectors. As shown in Fig. 1, the circles represent the light guide scintillation detector, where three colors indicate three types of detectors. Scintillation detectors with the same specification but different thickness and surface treatment are used. The red circles in the center of the array indicate 3 cm thick scintillator with polished surface, while blue and pink indicate 2 cm thick scintillator without polish on the surface. Besides, blue detectors are covered with 0.5 cm thick lead plates to convert gamma rays into electron-positron pairs, which increases the sensitivity in detecting the electromagnetic component. Serving as a guarding ring, the open squares along the edges are the prototype electromagnetic detectors of LHAASO-KM2A [2], which are fiber scintillation detectors. SA is divided into two groups. The detectors along the edge of the array are defined as the outer detectors, while the others are defined as the inner detectors. If a detector with the highest number of particles is in the inner group, this shower is labeled as the “in-array” event, otherwise it is the “out-array” event.
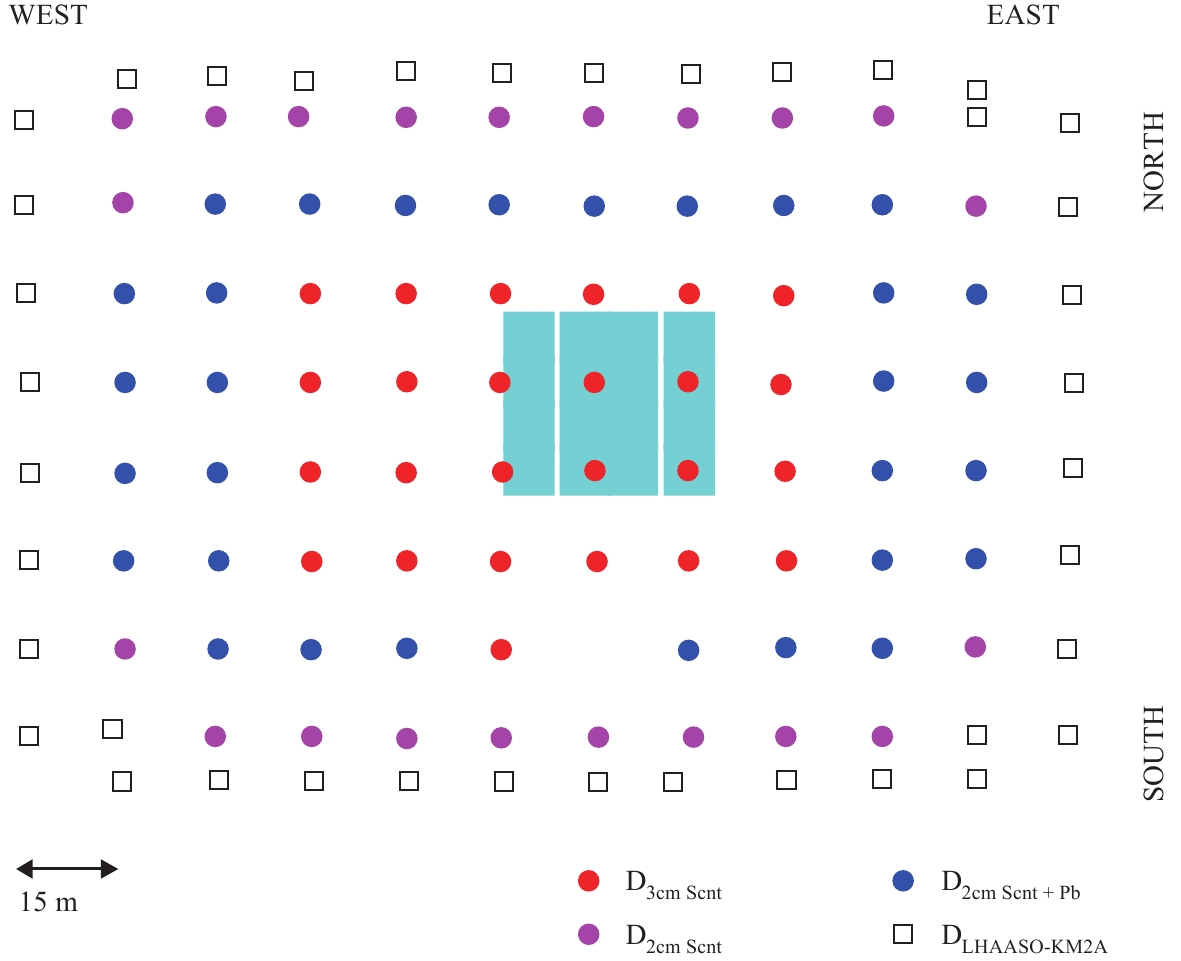 Figure1. (color online) Layout of the YBJ-HA experiment. Circles represent surface scintillation detectors. In particular, red circles are detectors with a 3 cm thick scintillator; pink circles are detectors with a 2 cm thick scintillator; blue circles are detectors with a 2 cm thick scintillator and a lead plate. The squares are the prototype detectors of LHAASO-KM2A. Cyan shaded area is the water Cherenkov muon detector array buried 2.5 m underground.
The detectors are deployed on a grid with 15 m spacing, covering 20000 m2. The detectors at the northern edge of the array are 7.5 meters away from the inner detectors, as is the case at the southern edge. A schematic diagram of the light guide scintillation detector unit is shown in Fig. 2. It is in the shape of an inverted pyramid. At the top, each detector has a plastic scintillator with an area of 0.5 m2. At the bottom of the detector, a photomultiplier tube (PMT) is installed as the photon collector. The whole detector surface is covered with a layer of white plastic film. The performance of the detector has been described in a previous paper [3].
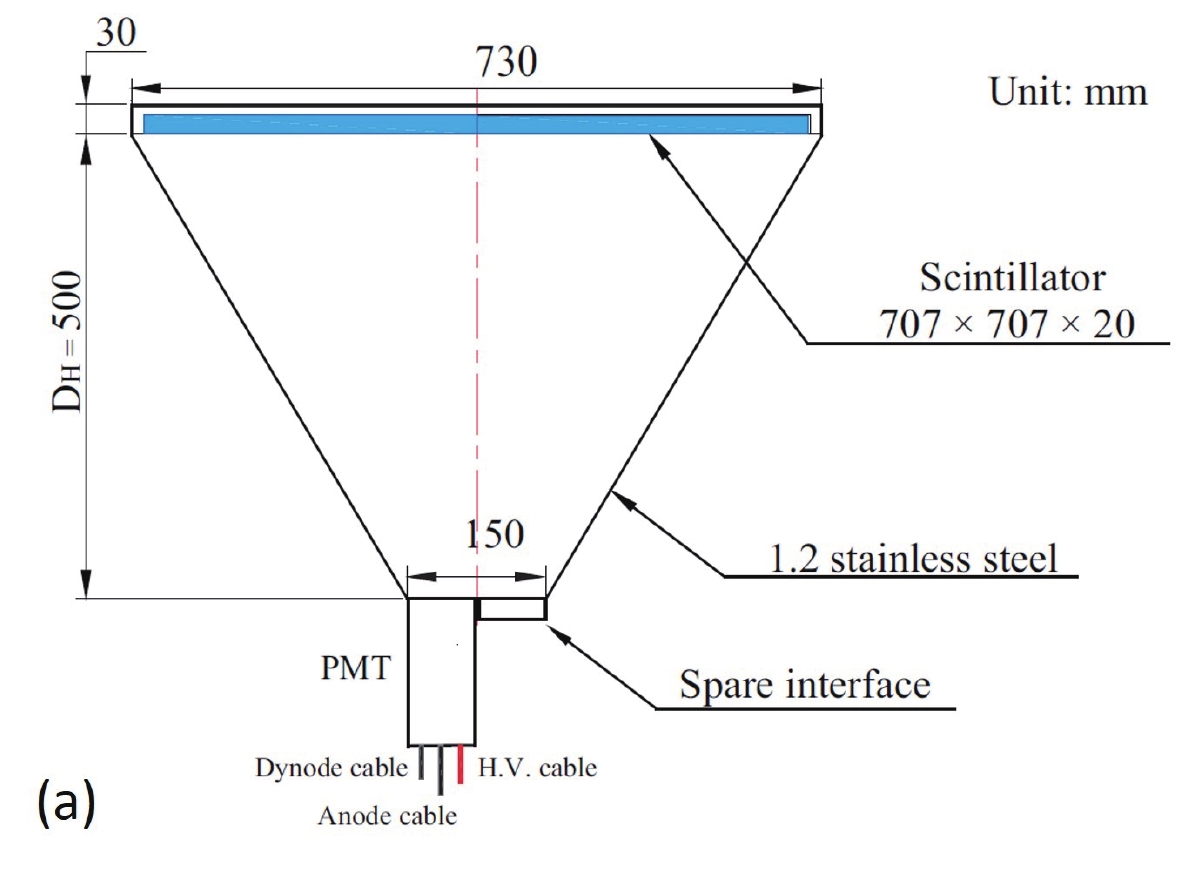 Figure2. (color online) Schematic diagram of the prototype scintillation detector.
MDA, which uses the water Cherenkov technique, started taking data in autumn of 2013. It consists of 16 detection units with 2.5 m of soil shield, covering an area of 800 m2. Cyan shaded square in Fig. 1 indicates the position of the muon detector array with respect to SA. Each unit is a waterproof concrete pool 7.2 m wide × 7.2 m long × 1.9 m deep, equipped with a face-down 20 inch diameter PMT mounted on the ceiling. Fig. 3 shows the schematic view of one pool. These detectors are shielded by overburdened soil to prevent low energy electromagnetic particles from reaching the water, with the threshold energy of 1 GeV for vertical muons. Besides, we used a Tyvek bag to prevent water contamination, and to keep good reflection of Cherenkov photons in each pool [4]. The dynamic range of the unit detector is between 1 and 12.5 minimum ionization particles (MIPs).
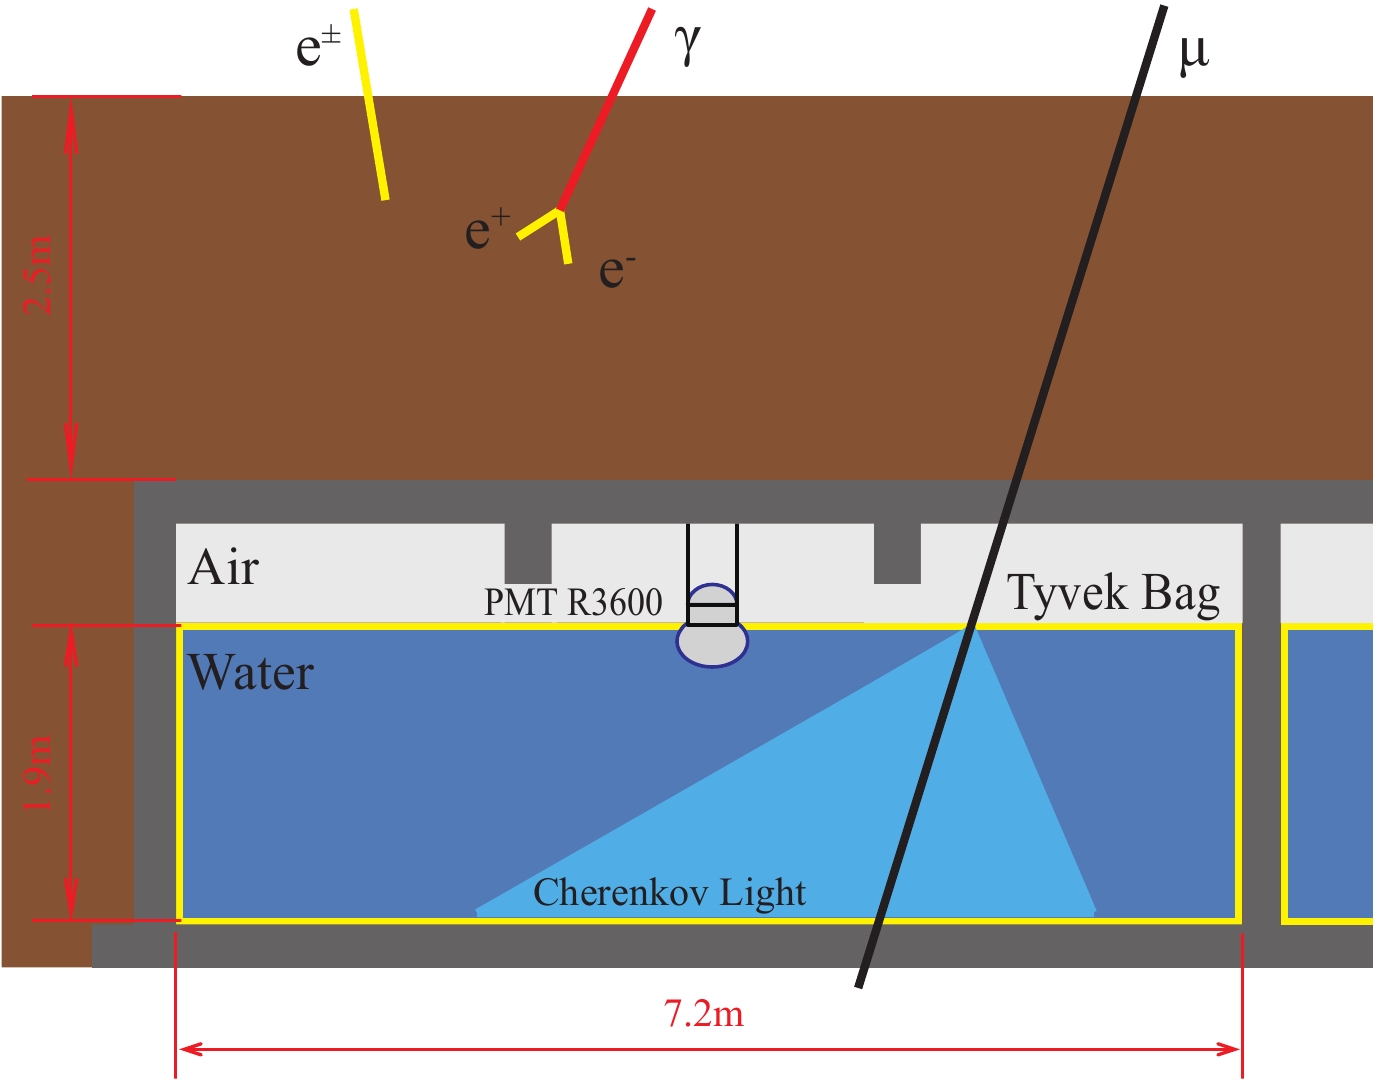 Figure3. (color online) Schematic view of one MDA pool.
1) The shower labeled as the “in-array” event.
2) Each shower event should fire four or more detectors.
3) The average time residual should be smaller than 1 m.
4) The sum of the number of particles from all fired detectors should be larger than 60 MIPs.
5) The reconstructed zenith angle of the shower should be less than 45 degrees.
To obtain high quality data, some essential parameters of the experiment were compared with the MC data. The sum of particle densities in all scintillation detectors (
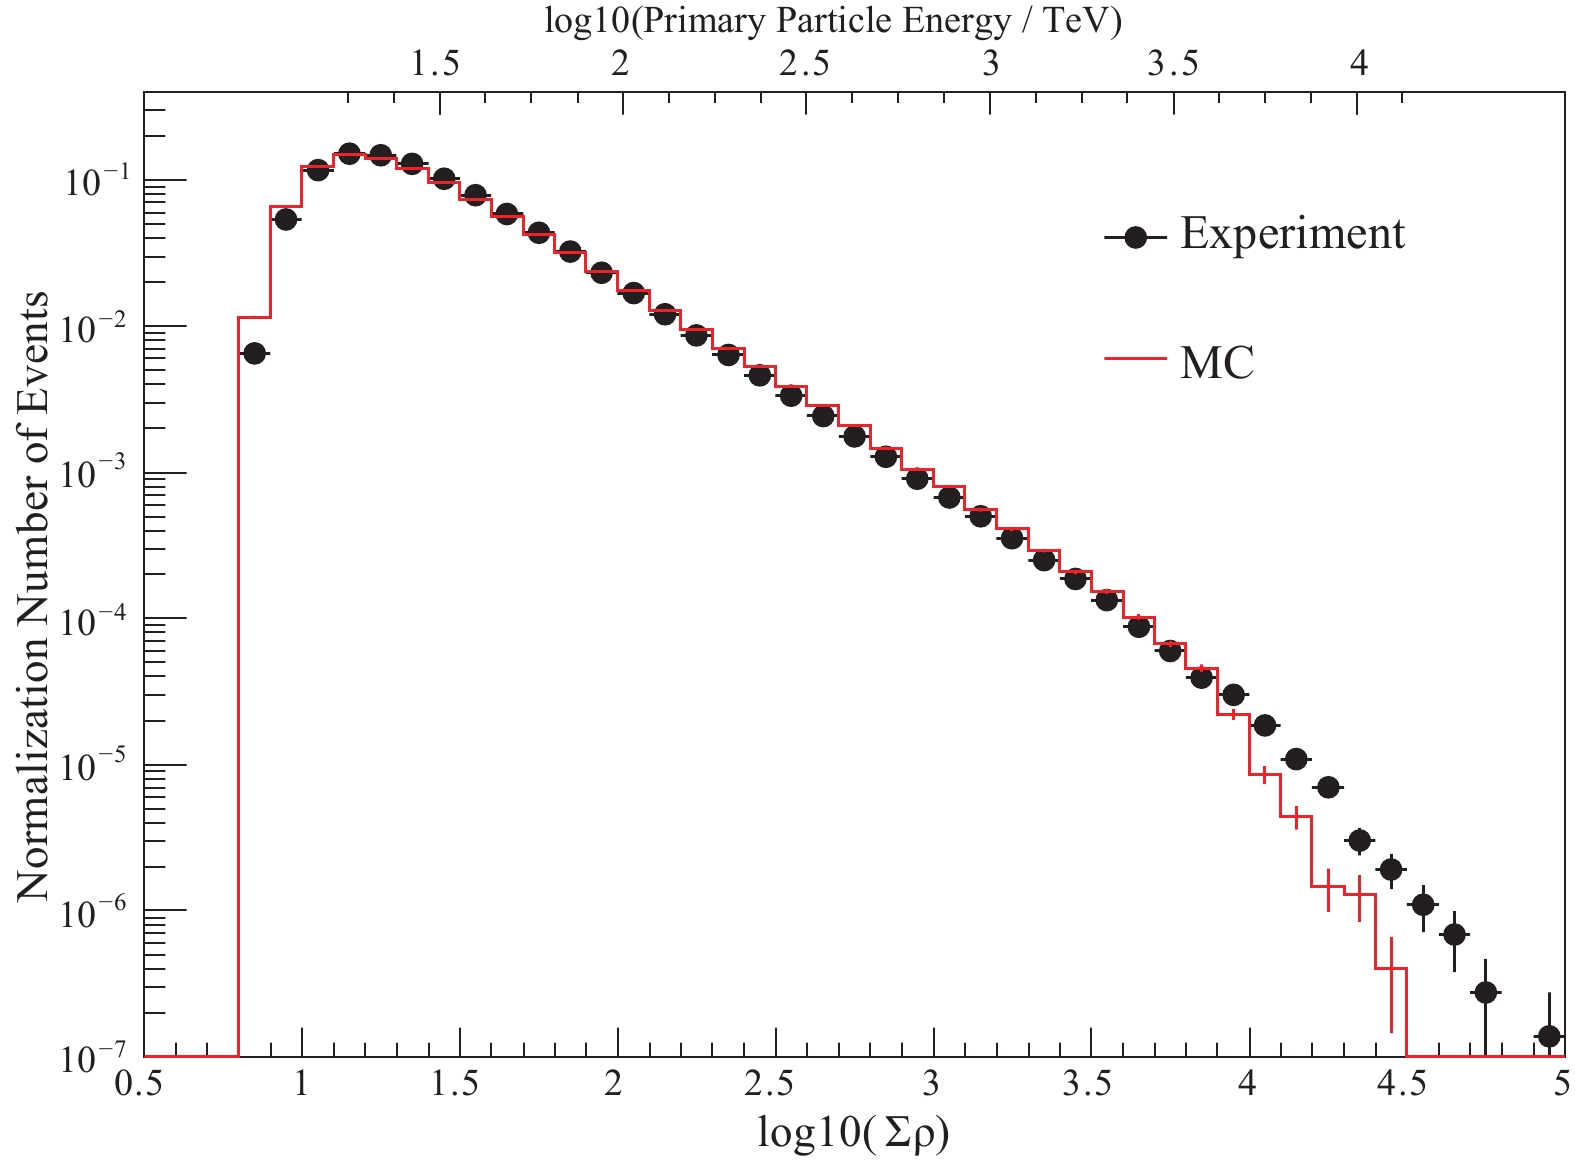 Figure4. (color online) Distribution of the sum of particle densities in all detectors (
The resolution of the shower core position is important for the measurement of the lateral distribution of muons. The commonly used method for core reconstruction is to fit the particle density with the NKG function [11]. The resolution of the core position is evaluated using the even-odd method [3]. Figure 5 shows the distribution of the difference of the core position between the even array and the odd array. The position resolution is defined such that the confidence region contains 50% of the events. With this method, the position resolution in our experiment is 4.8 meters with the reconstructed energy of 100 TeV. Figure 6 shows the resolution of shower core positions for different primary energies.
 Figure5. (color online) Distribution of
 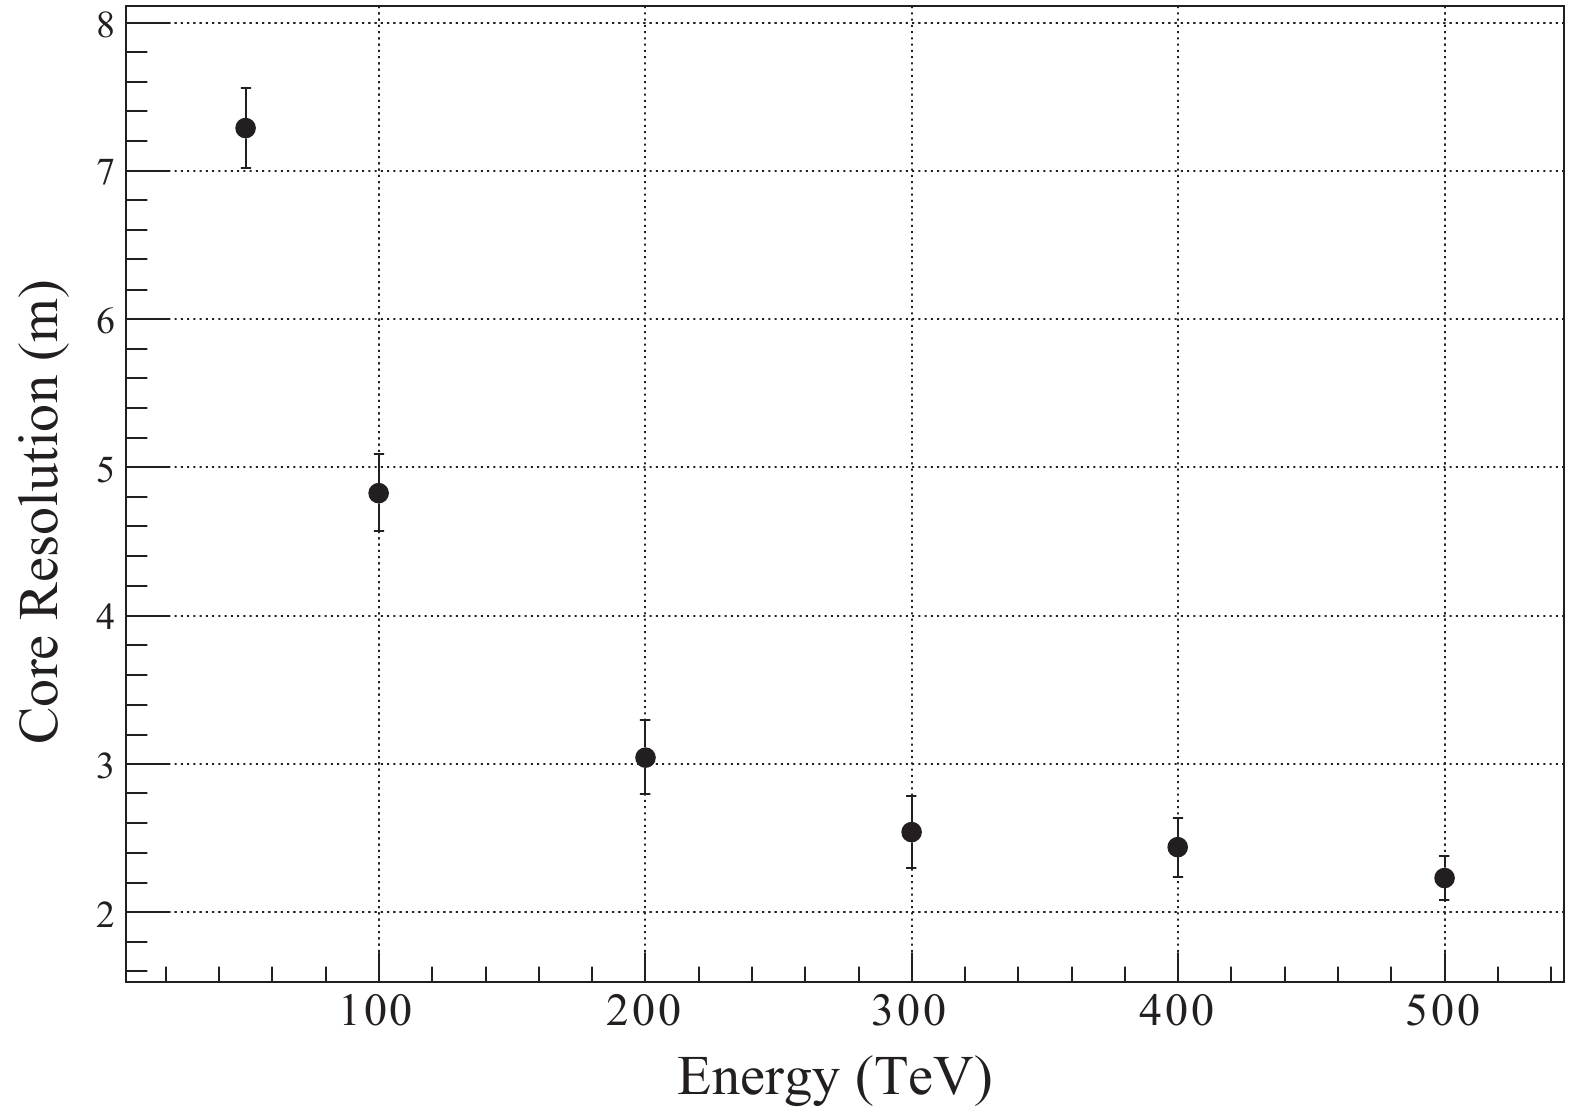 Figure6. Resolution of the shower core position for different primary energies.
After applying the above criteria, a sample of the showers with high quality parameters in energy, core position and direction is selected. In order to rule out the background muons from the other irrelevant showers, a cut on the time residual of muons is applied. Figure 7 shows a comparison of the time residual of muons between the experimental data and MC. The black points are the experimental data and the red line indicates the MC samples. The peak indicates the muon signals from EAS, while the flat sections on both sides of the peak indicate background. Therefore, we can select the events whose time residual is in the range from –90 ns to 210 ns. The very wide time window covers almost all muon signals from the shower, valid for both the experimental data and MC. In this case, the number of survival background events is only 0.002 for each detector. The spectrum of the selected muons is shown in Fig. 8. In this figure, the black points are the experimental data and the red line is MC. Apparently, the good agreement between the experiment and simulation shows that our data is well understood.
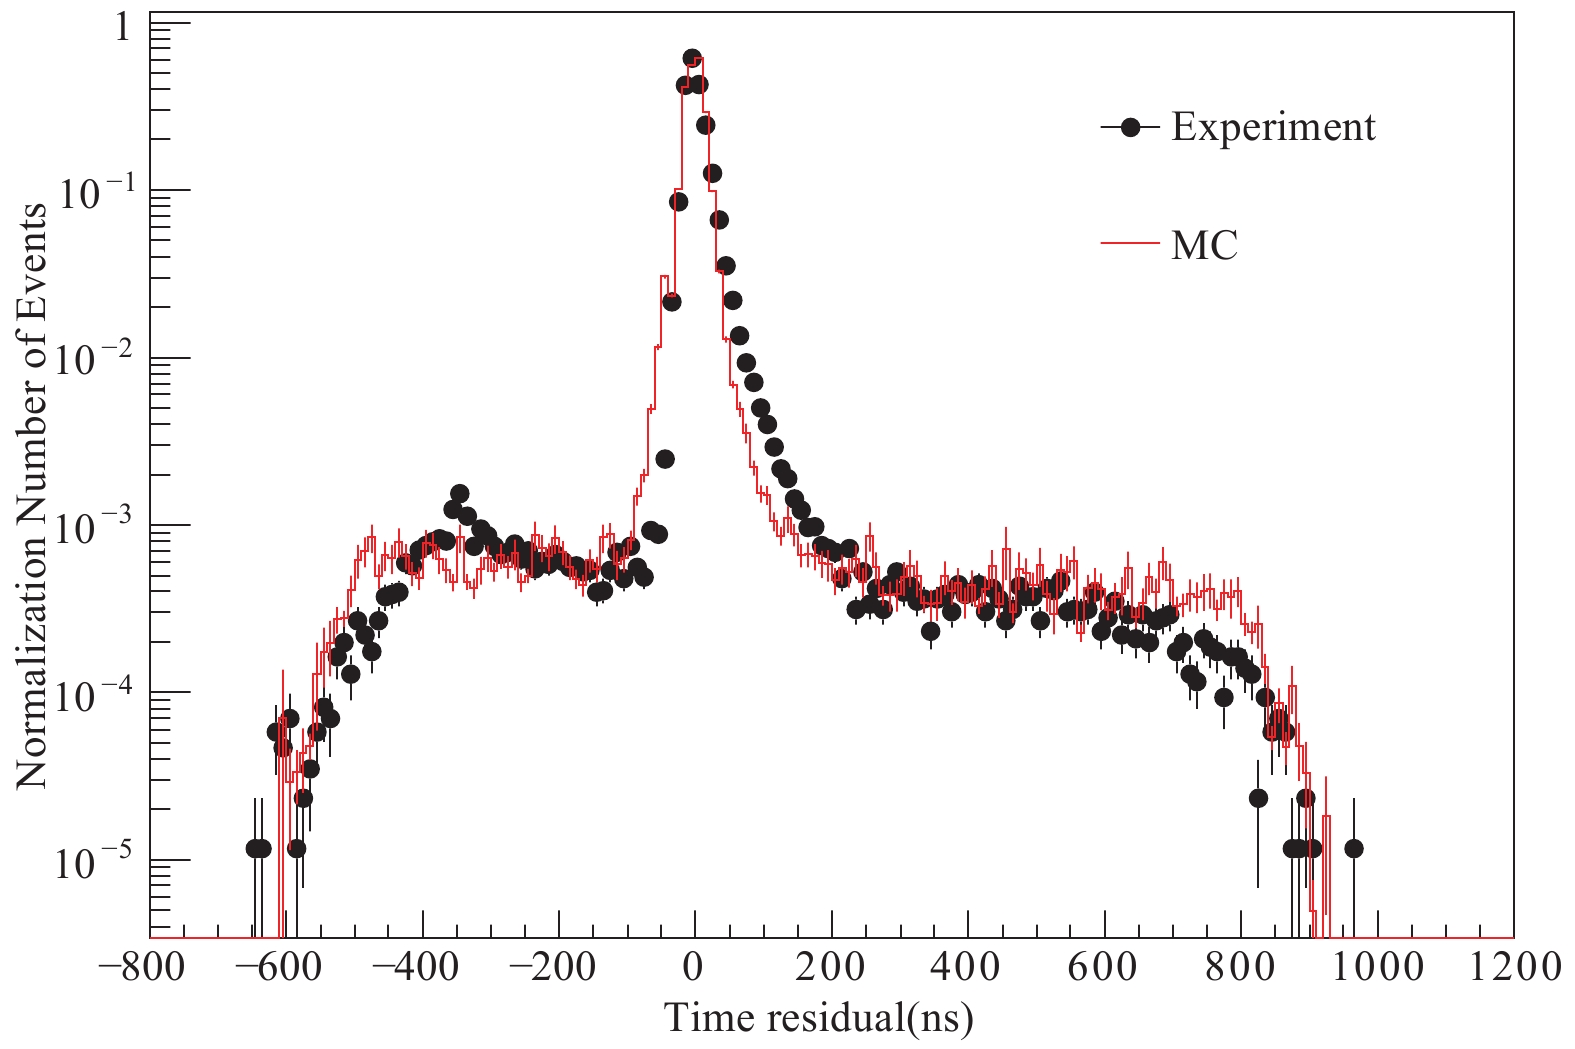 Figure7. (color online) Distribution of the time residual of the muon detector.
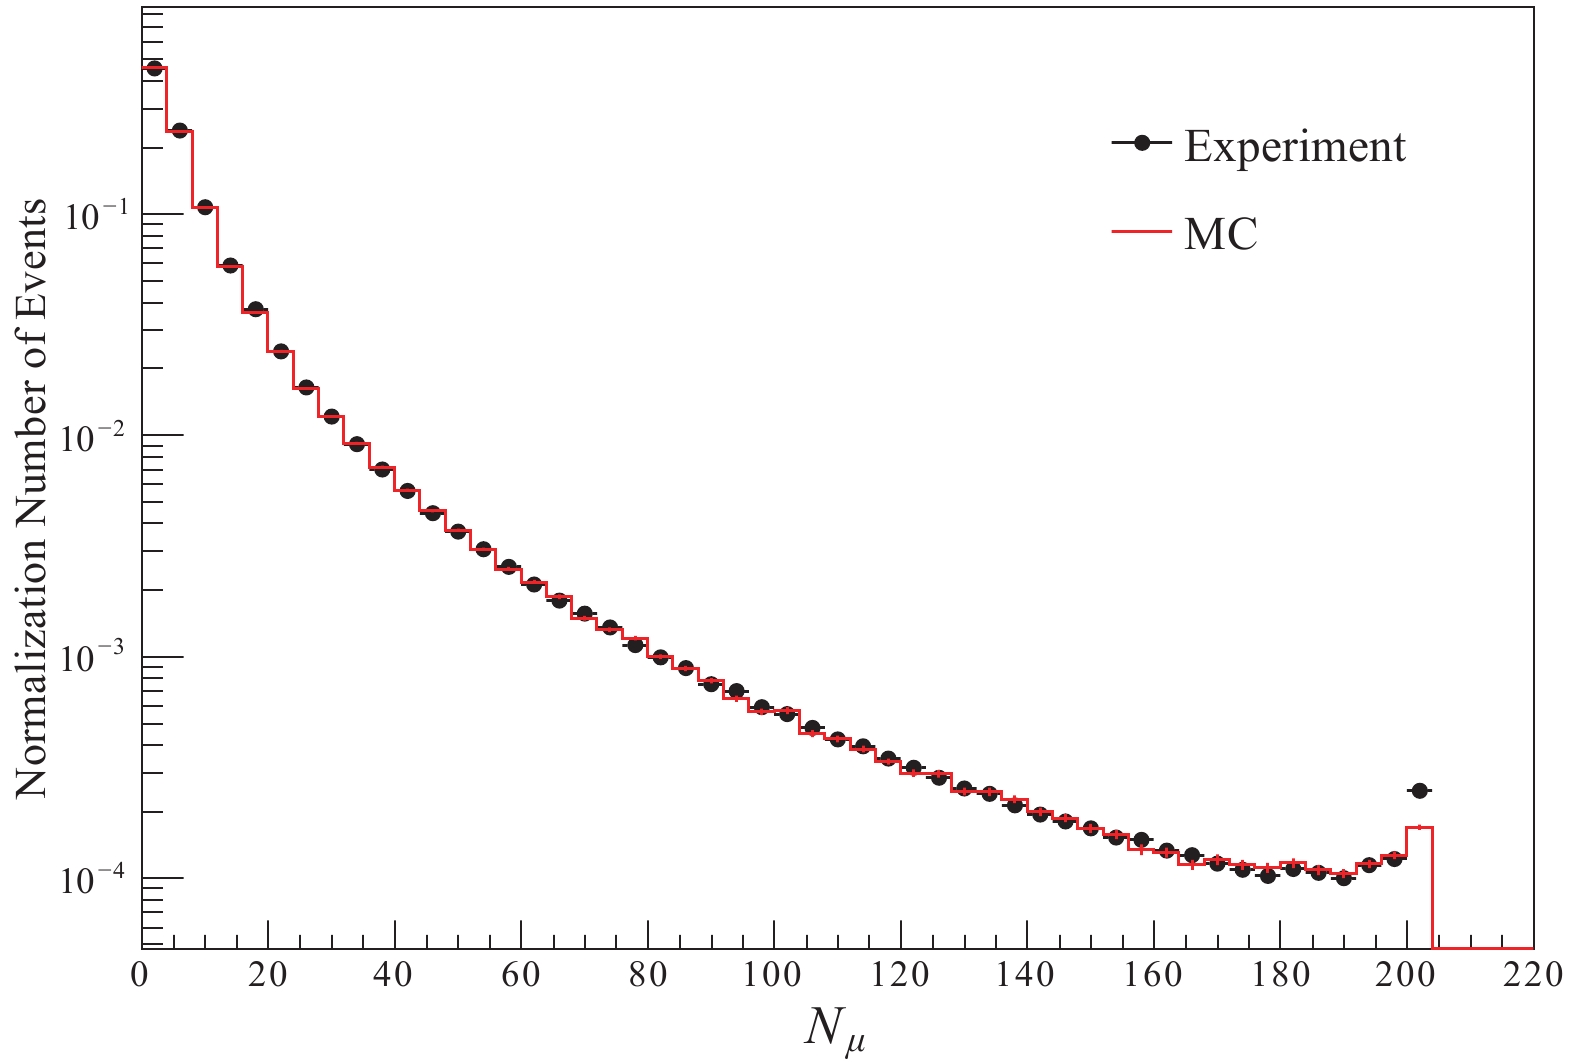 Figure8. (color online) Muon spectrum from MD.
5.1.Method
To measure the muon lateral distribution, the distance between the center of an MD unit and the shower axis is grouped in rings with a 5 m step. For the ring group Ri, the mean number of muons in a shower ρ(Ri) is then calculated as: $\rho ({R_i}) = \frac{{{M_i}}}{{{K_i}}} \times \frac{1}{{S \cdot \cos\theta }},$  | (1) |
Ki is the number of events in the i-th group;
S is the effective area of the MD detection unit, 51.8 m2 in our case;
θ is the zenith angle of the CR event.
The high energy electromagnetic components in a shower core region can also penetrate the soil layer and emit a large amount of Cherenkov light in the pool, which is called the “punch-through” effect. This effect can be eliminated by requesting that the shower core is far away from the muon detector. For this reason, the distance between the core position and the MD center is set to be more than 20 m in this analysis. Similarly, due to the dynamic range of MD, if the shower energy is too high, or if they are too close to the shower core position, the number of muons would exceed an upper limit. This effect is even worse when punch-through appears. Saturation and punch-through effects can be corrected by MC, but the correction would introduce a systematic uncertainty. Therefore, in this work we limit the energy range between 50–300 TeV, and keep the lateral distance in the measurement larger than 20 m.
Figure 9 shows the measured lateral muon distribution around 100 TeV for the zenith angle less than 15 degrees. The blue squares are the experimental data, while the green stars and red triangles are simulations. From the plot, the simulated data are consistent with the experiment, and there is no obvious difference between the two models. The pink circles are signals produced by pure muons in EAS. They are obtained by subtracting the punch-through effect from the red plots. As a matter of fact, the particle type, energy and the number of emitted photons by secondary particles, which pass through the muon detector, are recorded in the simulation. Therefore, the signal produced by pure muons in EAS can be singled out, and the punch-through effect is then the result of other secondary particles.
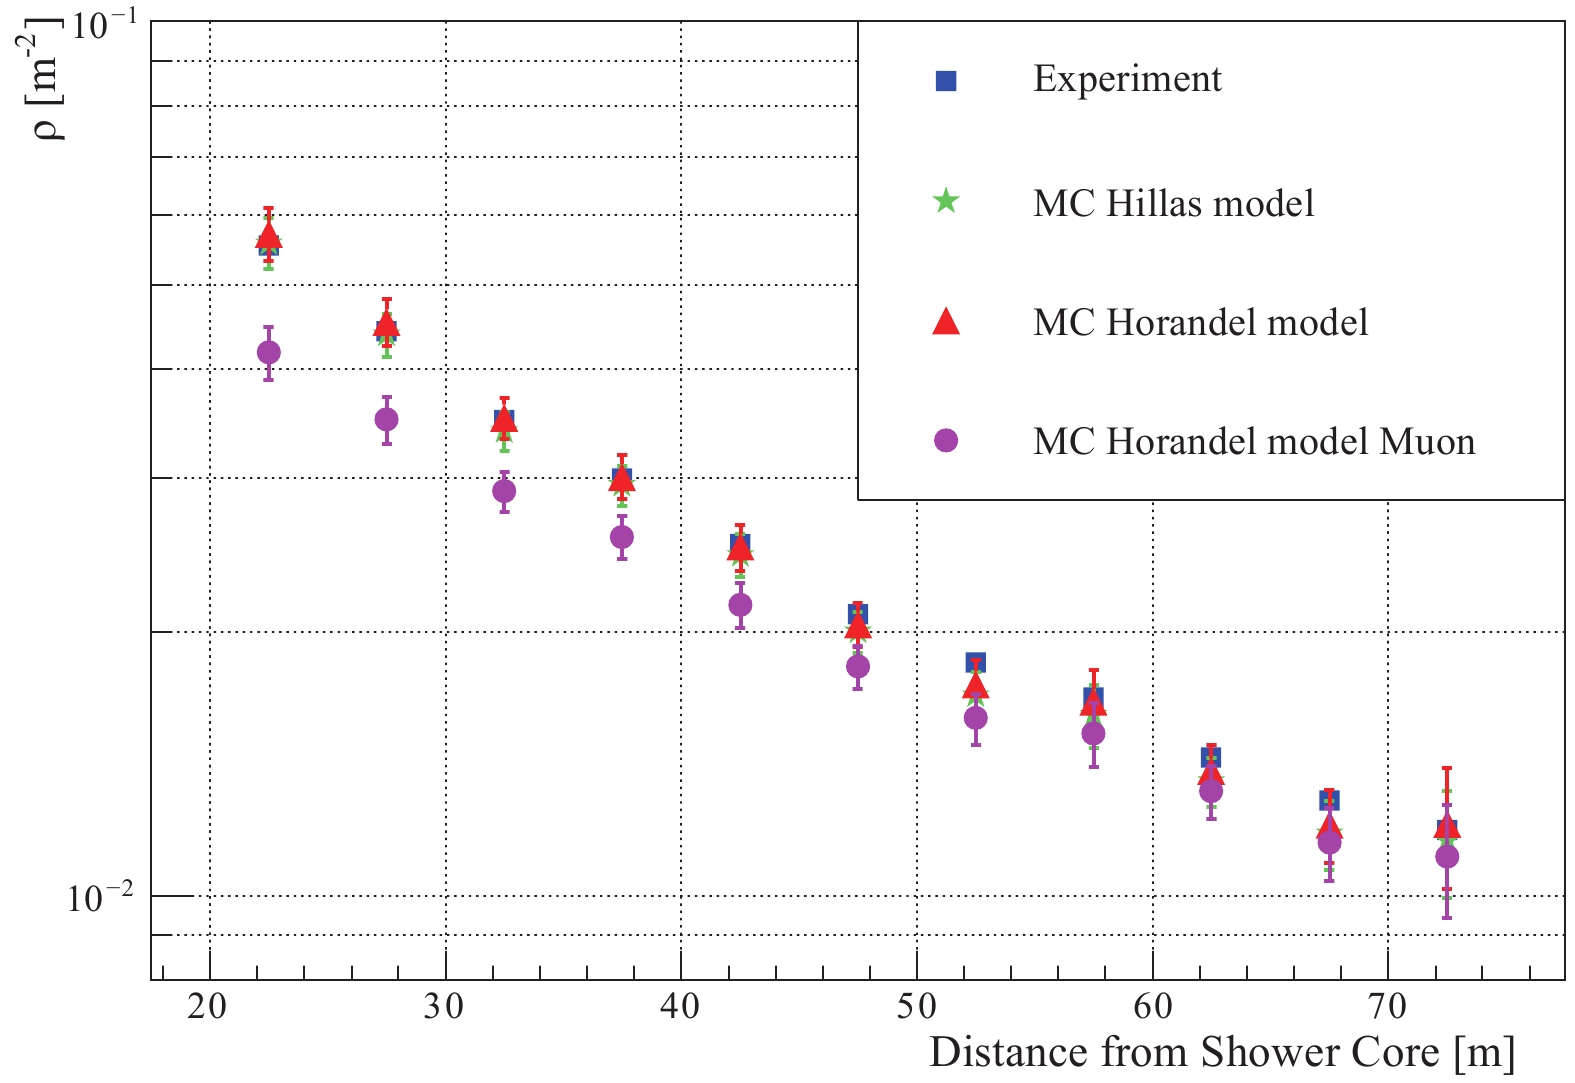 Figure9. (color online) Measured muon density distribution for the zenith angle of the shower
 We define the “punch-through” coefficient of the muon density distribution at distance R as P(R):
$ P(R) = \frac{\rho_{\rm exp}(R)-\rho_{\rm muon}(R)}{\rho_{\rm exp}(R)}\times 100 {\text{%}} . $  | (2) |
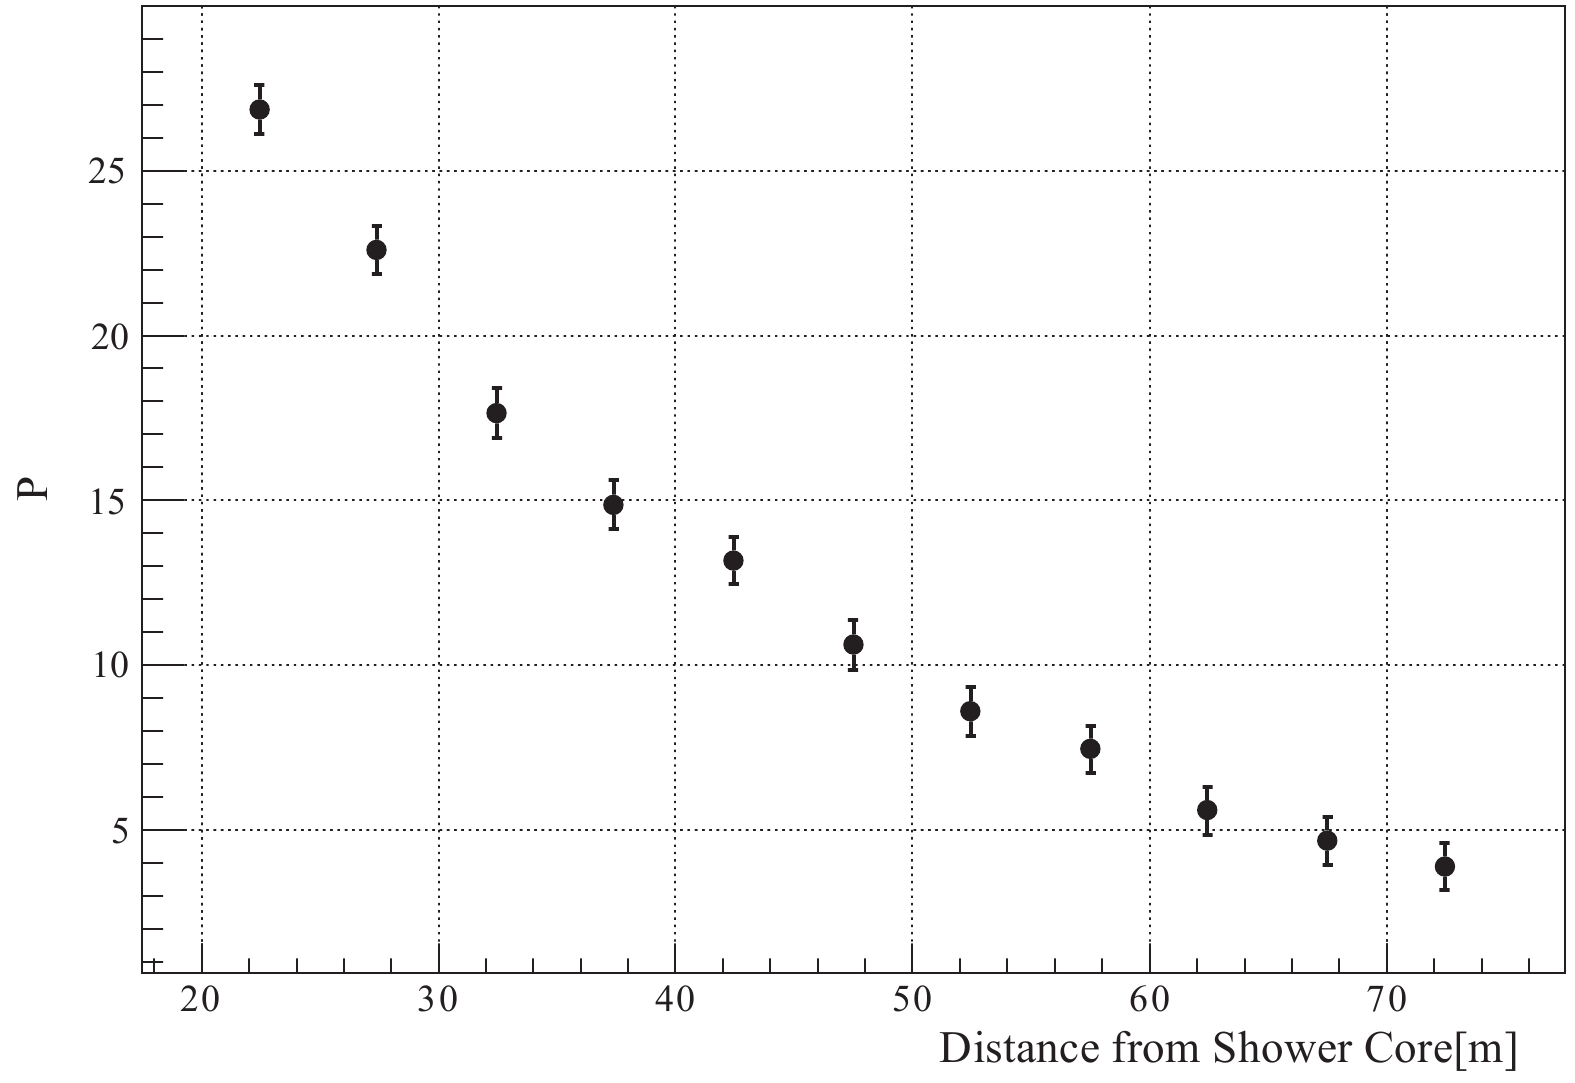 Figure10. The “punch-through” coefficient of the muon density distribution around 100 TeV for the zenith angle of the shower
 2
5.2.Results
In all energy intervals, the lateral distributions obtained with YBJ-HA are fitted with a function proposed by Greisen for the muonic component ( $ \rho(R) = C \left(\frac{R}{r_{\rm G}}\right)^{-0.75}\times\left(1+\frac{R}{r_{\rm G}}\right)^{-2.5}, $  | (3) |
The lateral distributions obtained for different zenith angles are presented in Fig. 11. The lines represent Greisen function fits to the data, and the values of the C and rG fit parameters are presented in Table 1. In these results, the punch-through effect has been properly estimated by MC simulation and removed from the measurements. As expected, the muon density decreases with increasing zenith angle. This is due to the fact that as the zenith angle increases the shower penetrates deeper into the atmosphere.
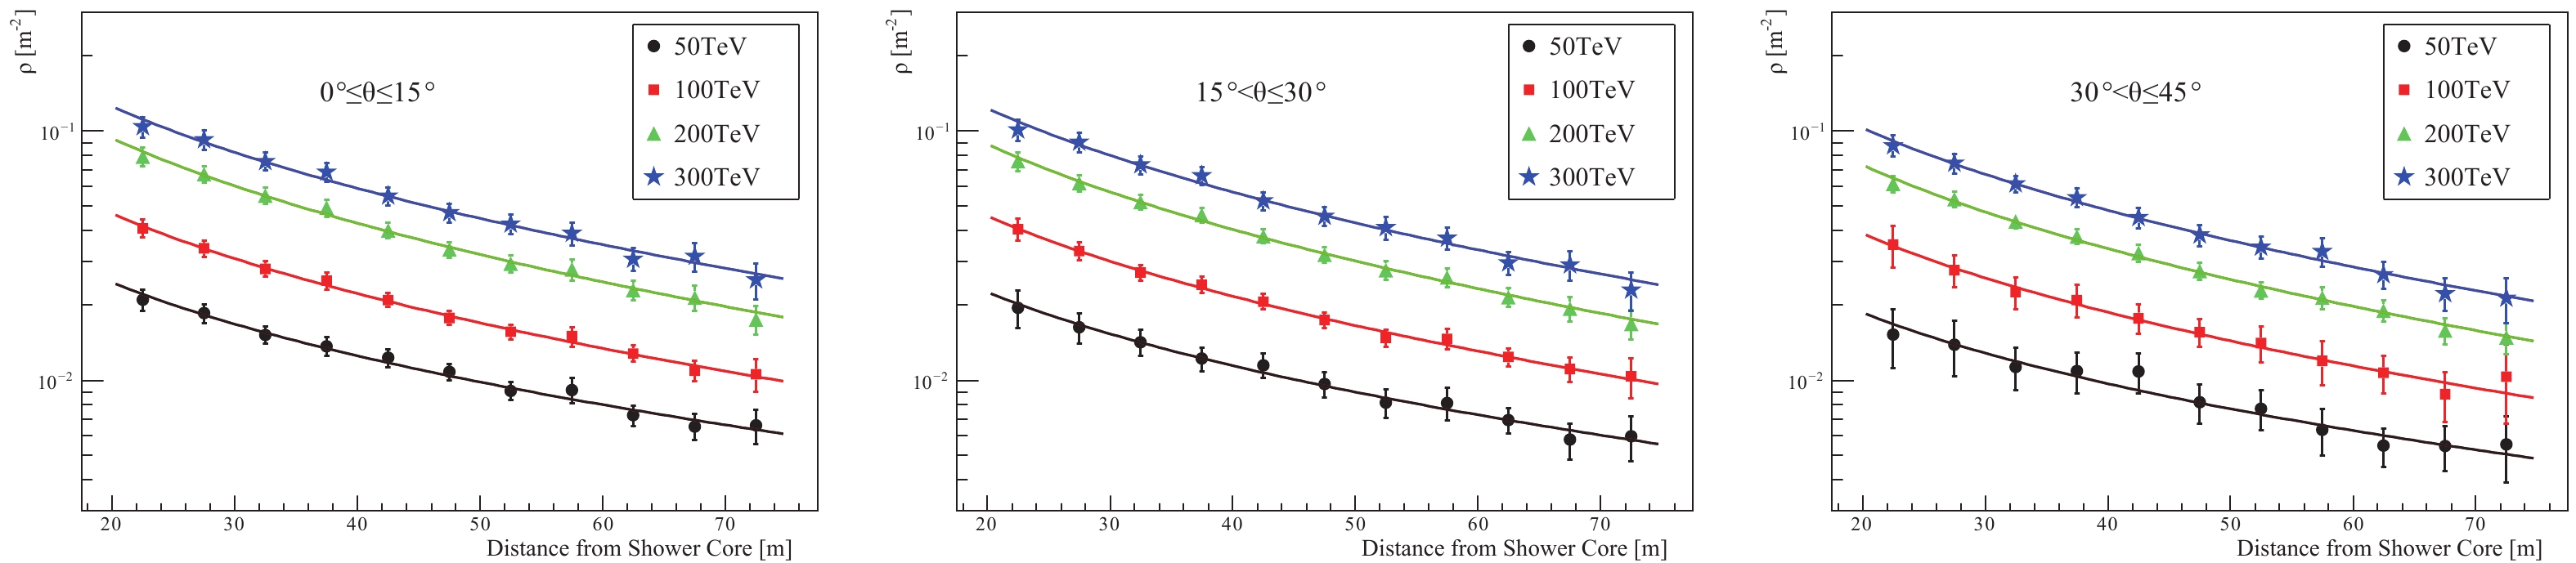 Figure11. (color online) Lateral density distribution of muons in four primary energy ranges. Left, for zenith angle of the shower
 | θ | energy/TeV | C/m?2 | rG/m |
| θ≤15° | 50 |   |   |
| 100 |   |   | |
| 200 |   |   | |
| 300 |   |   | |
| 15°<θ≤30° | 50 |   |   |
| 100 |   |   | |
| 200 |   |   | |
| 300 |   |   | |
| 15°<θ≤30° | 50 |   |   |
| 100 |   |   | |
| 200 |   |   | |
| 300 |   |   | |
Table1.Fit parameters C and
2
