Variation characteristics of actual evapotranspiration and meteorological elements in the Ebinur Lake basinfrom 1960 to 2017
AMANTAI Nigenare,1,2, DING Jianli,1,2, GE Xiangyu1,2, BAO Qingling1,21. College of Resources & Environmental Science, Xinjiang University, Urumqi 830046, China 2. Key Laboratory of Oasis Ecology, Xinjiang University, Urumqi 830046, China
National Natural Science Foundation of China.41771470 National Natural Science Foundation of China.41961059 Xinjiang Uygur Autonomous Region's Special Fund for Water Science and Technology.2020.B-001
作者简介 About authors 尼格娜热·阿曼太(1994-), 女, 新疆乌鲁木齐人, 硕士生, 主要研究方向为生态水文学。E-mail: ngnr113@163.com
摘要 传统估算蒸散发的方法大都基于局地尺度,而在生态水文发生剧烈变化的资料稀缺流域背景下,充分考虑流域下垫面的空间变异性的陆面过程模型为流域长时序、大尺度及连续模拟实际蒸散量提供了新途径。以艾比湖流域为研究区,应用可变下渗能力模型(VIC)模拟1960—2017年艾比湖流域的水文过程,探讨研究区值实际蒸散发量的年、月、日时空变化规律,并运用小波分析方法对5个气象要素及研究区实际蒸散发量的模拟值进行多尺度特征分析,结果表明:① VIC在温泉和博乐的径流纳什效率系数(NSE)分别为0.09和0.23,模拟效果较为满意;VIC实际蒸散量的模拟值与理论计算值,R2达0.80,均方根误差(RMSE)为31.76 mm a-1,NSE为0.32,模拟效果相对较好;② 时间尺度上,艾比湖流域58 a来年际实际蒸散量呈上升趋势,年均实际蒸散量以1.03 mm a-1的速率递增;月值和日值蒸散量均呈单峰趋势;且年代际变化中5—7月的实际蒸散量在20世纪90年代和21世纪呈现下降趋势,20世纪70年呈现上升趋势,而其余月份无明显变化;③ 空间分布上,艾比湖流域内实际蒸散发量总体上呈现高海拔及其附近地区蒸散强烈,从春季到夏季,强蒸散区由西北向东南转移,年实际蒸散量空间分布与春夏季分布一致;④ 艾比湖流域实际蒸散发量与各气象要素在时频域中均存在1~4个显著性周期,且在一定尺度的周期上,平均风速、平均温度以及日照时数超前于实际蒸散量变化,而年降水量和相对湿度滞后于实际蒸散量变化,受降水影响实际蒸散发1965年和2003年发生1 a周期的“强—弱”转换,受相对湿度影响实际蒸散量在1965年和2008年发生2~4.5 a周期的“强—弱”转换。 关键词:实际蒸散量;VIC模型;小波分析;多尺度分析
Abstract Traditional methods for estimating evapotranspiration are mostly based on local scales. For data-scarce basins where ecological hydrology has undergone dramatic changes, a land surface process model that fully considers the spatial variability of the underlying surface of the watershed provides a new method of performing continuous actual evapotranspiration simulations over a long time series and at a large scale. Taking the Ebinur Lake basin as the research area, the variable infiltration capacity (VIC-3L) model was used to simulate the hydrological processes from 1960 to 2017 and explore the spatial and temporal variations in actual evapotranspiration in the study area. Additionally, the wavelet analysis method was used to analyze the multiscale characteristics of the five meteorological elements and the simulated values of actual evapotranspiration in the study area. The following results were obtained: (1) The runoff Nash-Sutcliffe efficiency (NSE) coefficients of the VIC at the Wenquan and Bole stations were 0.09 and 0.23, respectively, and the simulation results were satisfactory. Specifically, the simulated value and theoretical calculated value of the actual evapotranspiration of the VIC had an R2 value of 0.80, an RMSE of 31.76 mm a-1, an NSE of 0.32, and a relatively good simulation effect. (2) Regarding the time scale, the interannual actual evapotranspiration has presented an upward trend over the past 58 years, with the annual average actual evapotranspiration increasing at a rate of 1.03 mm a-1. Furthermore, both monthly and daily evapotranspiration showed a single peak trend. Regarding the interdecadal changes, the actual evapotranspiration from May to July showed a downward trend in the 1990s and in the early 21st century, and an upward trend in the 1970s, while no significant change in tother months. (3) In terms of spatial distribution, the actual evapotranspiration generally showed strong evapotranspiration in high altitude areas and their surroundings. From spring to summer, the area with strong evapotranspiration shifted from the northwest to southeast. The spatial distribution of annual actual evapotranspiration is consistent with that in spring and summer. (4) A wavelet analysis identified 1 to 4 significant periods in the time-frequency domain for the actual evapotranspiration and meteorological elements in the study basin. Over a certain period, the average wind speed, average temperature, and sunshine hours changed ahead of the actual evapotranspiration while the annual precipitation and relative temperature lagged behind the actual evapotranspiration changes. Affected by precipitation, the actual evapotranspiration had a "strong-weak" transition in 1965 and 2003 with a period of 1 a; and affected by relative humidity, the actual evapotranspiration had a "strong-weak" transition in 1965 and 2008 with a period of 2-4.5 a. Keywords:actual evapotranspiration;VIC model;wavelet analysis;multiscale analysis
PDF (5617KB)元数据多维度评价相关文章导出EndNote|Ris|Bibtex收藏本文 本文引用格式 尼格娜热·阿曼太, 丁建丽, 葛翔宇, 包青岭. 1960—2017年艾比湖流域实际蒸散量与气象要素的变化特征. 地理学报[J], 2021, 76(5): 1177-1192 doi:10.11821/dlxb202105010 AMANTAI Nigenare, DING Jianli, GE Xiangyu, BAO Qingling. Variation characteristics of actual evapotranspiration and meteorological elements in the Ebinur Lake basinfrom 1960 to 2017. Acta Geographica Sinice[J], 2021, 76(5): 1177-1192 doi:10.11821/dlxb202105010
然而,获得准确的蒸散量仍然是水文学的主要难题。由于传统方法大多基于气象观测的单点计算,无法准确获取非均匀下垫面的蒸散发特征[4]。Domingo等[5]指出基于实测的气象数据可以通过数学模型模拟蒸散,弥补时空表达的限制[6]。蒸散模型已经经历了从简单到复杂,从经验到机理的发展过程,并在理论、方法和应用方面取得不少进展[7]。其中,遥感技术在不同时空尺度的蒸散估算中发挥着重要作用[8]。区域蒸散发的遥感估算主要分为以下4类[9,10,11]:统计经验法、地表能量平衡模型、全遥感信息模型以及陆面过程模型与数据同化方法。统计经验法包括能量平衡方程简化法[12]、特征空间法[13,14]。统计经验法虽然计算过程简单,但是依赖样本质量且不可迁移。地表能量平衡模型包含单层模型SEBAL(Surface Energy Balance Algorithm for Land)[15]、彭曼模型[16,17]等,然而,表面阻抗的不确定性限制了其在空间尺度的扩展。全遥感信息模型是指通过遥感信息取代环境参量建立的模型[18]。但是由于遥感自身的瞬时性,难以获取持续地表蒸散量。陆面过程模型是用于研究陆—气之间水、物质、能量交换过程的数值模型,可以模拟连续的地表水热过程。陆面过程模型与数据同化方法是指在数值模型运行过程中融合各种观测信息的方法。其中,梁旭等[19]提出的VIC模型(Variable Infiltration Capacity Model)应用了多种数据源,充分考虑了流域的时间、空间变异性,能够比较客观地反映气象、水文、植被、土壤等不同因子对流域蒸散量的贡献,对流域实际蒸散发的计算更具优势性。
研究区日平均实际蒸散量从3月开始呈现逐渐上升趋势,到6月下旬达到最大值;8月开始呈显著下降趋势,总体趋势呈单峰型分布,6月下旬(6月28日)的峰值为1.44 mm d-1,比次日峰值1.19 mm d-1高0.25 mm d-1(图3a)。根据3 准则,即如果一组数据中某个数据的残余误差的绝对值大于3 ,则该值为应剔除的坏值,其中, 为这组数据中的标准差。艾比湖流域逐日平均实际蒸散量的标准差为0.36,且蒸散发必须大于等于0,则数据应大于等于0且小于1.60 mm d-1,本文计算峰值亦在这个范围内。观察每年6月28日的日模拟值可以发现,1966年和1999年的该日实际蒸散值高达6.83 mm d-1和5.00 mm d-1,该日共有13 a的实际蒸散值高于1.44 mm d-1,这是该日日平均实际蒸散量异常高于其他日的直接原因;而造该日强烈蒸散结果的原因有待进一步研究,有可能因前一天的强降雨造成,也有可能是为该日高风速造成。其中,整个研究区的日平均实际蒸散值为0.53 mm d-1,实际蒸散量最大的5—8月的日平均实际蒸散值可达0.88 mm d-1;最小日平均实际蒸散值为0.06 mm d-1,出现在1月下旬。月平均实际蒸散量整体也呈现单峰趋势(图3b),峰值出现在5月,达31.24 mm month-1;4月、6月和7月的月均实际蒸散量差异不大,分别为29.73 mm month-1、29.30 mm month-1和27.76 mm month-1;实际蒸散量从8月开始明显下降;最小月平均实际蒸散量出现在1月,为2.54 mm month-1。通过研究年代际月平均实际蒸散量(图3b),可以发现4—8月的月平均实际蒸散量存在着比较显著的变化,在1990—2009年5—7月的月平均实际蒸散量呈“V”型分布,与之相反,1970—1979年5—7月的月平均实际蒸散量呈倒“V”型分布,而2010—2017年月平均实际蒸散量在4月达到峰值之后,呈稳步下降趋势;其余年代际月平均实际蒸散量在1960—2017年未出现明显变化。刘文军等[42]通过研究艾比湖湖面面积的变化发现,艾比湖地区在3—5月降水量大,7—10月降水量较少,故艾比湖水位3—5月较高,7—10月水位较低。由此可推断艾比湖流域5月是湿季,10月是干季,故艾比湖流域的实际蒸散发量的月变化应与干湿季变化有关。
Fig. 3Simulated daily and monthly average actual evapotranspiration values
图4为1960—2017年的年平均实际蒸散量分布直方图,由图可知,年平均实际蒸散量呈上升趋势,上升速率约为1.03 mm a-1,年平均实际蒸散量为192.60 mm a-1;年平均实际蒸散量在1969年达到低值为121.38 mm a-1;而2017年的平均实际蒸散量较2016年显著增加,达到新高点343.18 mm a-1,约为1969年低谷值的2.8倍。与“蒸发悖论”不同的是,艾比湖流域的实际蒸发量呈增加趋势,陈亚宁等[43]研究发现西北干旱区蒸发水平从显著减少转为显著增加,而风速是引起转变的关键。艾比湖流域作为典型干旱区,实际蒸散应处于增加趋势,与本文研究相符。区域干旱化倾向与逐步增加的蒸散发密切相关,而持续的干旱化威胁着当地的生态环境,制约着当地的经济发展,对当地的生态安全保护起到警示作用。
(1)本文首先利用温泉和博乐2个水文站点的月值径流数据与模型径流模拟值计算纳什效率系数,模拟评估结果分别为0.09和0.23,模拟结果较为满意。其次,利用Budyko流域水分能量耦合平衡方程计算值作为流域蒸散量的实测值与基于VIC模型的计算值作为模拟值进行检验。R2为0.80,RMSE为31.76 mm a-1,NSE为0.32。说明VIC模拟实际蒸散量的精度虽有待进一步提高,但其长时序的实际蒸散量总体变化趋势较为可靠,可为区域尺度研究实际蒸散量的时空规律提供数据支持。
LiHuiwen, WangShijie, BaiXiaoyong, et al. Inversion and spatiotemporal evolution of actual evapotranspiration in southwest China for the past 50 years Acta Ecologica Sinica, 2018,38(24):8835-8848. [本文引用: 1]
RuanHongwei, YuJingjie. Changes in land cover and evapotranspiration in the five Central Asian countries from 1992 to 2015 Acta Geographica Sinica, 2019,74(7):1292-1304. [本文引用: 2]
LiaoQianyu, RenChao, LengPei, et al. Retrieval of all-sky surface evapotranspiration in regional scale: A case study over the Heihe River basin China Agricultural Informatics, 2019,31(1):35-47. [本文引用: 1]
DomingoF, VillagarcaL, BrennerA, et al. Evapotranspiration model for semi-arid shrub-lands tested against data from SE Spain Agricultural and Forest Meteorology, 1999,95(2):67-84. DOI:10.1016/S0168-1923(99)00031-3URL [本文引用: 1]
GaoGuanlong, FengQi, ZhangXiaoyou, et al. Review on modeling evapotranspiration of land surface based on the evapotranspiration models and micro-meteorological data Plateau Meteorology, 2017,36(6):1630-1637. [本文引用: 1]
FengJingze, WangZhongjing. A review on evapotranspiration estimation models using remotely sensed data Journal of Hydraulic Engineering, 2012,43(8):914-925. [本文引用: 1]
GaoYanchun, LongDi. Progress in models for evapotranspiration estimation using remotely sensed data Journal of Remote Sensing, 2008,12(3):515-528. [本文引用: 1]
Ma YF, Liu SM, Song LS, et al. Estimation of daily evapotranspiration and irrigation water efficiency at a landsat-like scale for an arid irrigation area using multi-source remote sensing data Remote Sensing of Environment, 2018,216(10):715-734. DOI:10.1016/j.rse.2018.07.019URL [本文引用: 1]
Xu TR, He XL, Bateni SM. Mapping regional turbulent heat fluxes via variational assimilation of land surface temperature data from polar orbiting satellites Remote Sensing of Environment, 2019,221(2):444-461. DOI:10.1016/j.rse.2018.11.023URL [本文引用: 1]
ZhangYuan, JiaZhenzhen, LiuShaomin, et al. Advances in validation of remotely-sensed land surface evapotranspiration Journal of Remote Sensing, 2020,24(8):975-999. [本文引用: 1]
Jackson RD, Reginato RJ, Idso SB. Wheat canopy temperature: A practical tool for evaluating water requirements Water Resources Research, 1977,13(3):651-656. DOI:10.1029/WR013i003p00651URL [本文引用: 1]
Moran MS, Clarke TR, InoueY, et al. Estimating crop water deficit using the relation between surface-air temperature and spectral vegetation index Remote Sensing of Environment, 1994,49(3):246-263. DOI:10.1016/0034-4257(94)90020-5URL [本文引用: 1]
JiangL, IslamS. A methodology for estimation of surface evapotranspiration over large areas using remote sensing observations Geophysical Research Letters, 1999,26(17):2773-2776. DOI:10.1029/1999GL006049URL [本文引用: 1]
Bastiaanssen W GM, Noordman E JM, PelgrumH, et al. SEBAL model with remotely sensed data to improve water-resources management under actual field conditions Journal of Irrigation and Drainage Engineering, 2005,131(1):85-93. DOI:10.1061/(ASCE)0733-9437(2005)131:1(85)URL [本文引用: 1]
Penman HL. Natural evaporation from open water, hare soil and grass Proceedings of the Royal Society of London, 1948,193(1032):120-145. [本文引用: 3]
Monteith J IL. Evaporation and environment Symposia of the Society for Experimental Biology, 1965,19:205-234. PMID:5321565 [本文引用: 1]
ZhangRenhua, SunXiaomin, ZhuZhilin, et al. A remote sensing information model of surface evaporation based on differential thermal inertia and its verification in Shapotou Region, Gansu Scientia Sinica (Terrae), 2002,32(12):1041-1050. [本文引用: 1]
LiangX, Lettenmaier DP, Wood EF, et al. A simple hydrologically based model of land surface water and energy fluxes for general circulation models Journal of Geophysical Research: Atmospheres, 1994,99(D7):14415-14428. DOI:10.1029/94JD00483URL [本文引用: 1]
YeHong, ZhangTingbin, YiGuihua, et al. Spatio-temporal characteristics of evapotranspiration and its relationship with climate factors in the source region of the Yellow River from 2000 to 2014 Acta Geographica Sinica, 2018,73(11):2117-2134. [本文引用: 1]
LiuRong, WenJun, WangXin. Spatial-temporal variation and abrupt analysis of evapotranspiration over the Yellow River source region Climatic and Environmental Research, 2016(5):503-511. [本文引用: 1]
ZhangJunyong, DingJianli, TanJiao, et al. Analysis on the variation characteristics of potential evapotranspiration and surface moisture in the Ebinur Lake Oasis Wetland from 1960 to 2013 Journal of Glaciology and Geocryology, 2019,41(4):937-944. [本文引用: 1]
WangJie, GongHuili, ChenBeibei, et al. Periodical analysis of land subsidence in Beijing plain based on Morlet wavelet technology Journal of Jilin University (Earth Science Edition), 2018,48(3):836-845. [本文引用: 2]
WangJinjie, DingJianli, ZhangZhe. Temporal-spatial dynamic change characteristics of soil moisture in Ebinur Lake basin from 2008 to 2014 Acta Ecologica Sinica, 2019,39(5):1784-1794. [本文引用: 1]
TanJiao, DingJianli, DongYu, et al. Decadal variation of potential evapotranspiration in Ebinur Lake Oasis of Xinjiang Transactions of the Chinese Society of Agricultural Engineering, 2017,33(5):143-148. [本文引用: 1]
LuLin, LiuChao. China Soil Data Set (v1. 1) based on the World Soil Database (HWSD) National Glacial Frozen Soil Science Data Center, 2019 (http://www.ncdc.ac.cn/. URL [本文引用: 1]
YuanF, Xie ZH, LiuQ, et al. An application of the VIC-3L land surface model and remote sensing data in simulating streamflow for the Hanjiang River basin Canadian Journal of Remote Sensing, 2004,30(5):680-690. DOI:10.5589/m04-032URL [本文引用: 1]
Yang YM, Yang YH, Liu DL, et al. Regional water balance based on remotely sensed evapotranspiration and irrigation: An assessment of the Haihe Plain, China Remote Sensing, 2014,6(3):2514-2533. DOI:10.3390/rs6032514URL [本文引用: 1]
Budyko MI. Climate and Life. New York: Academic Press. 1974: 508. [本文引用: 1]
ZhangL, Dawes WR, Walker GR. Response of mean annual evapotranspiration to vegetation changes at catchment scale Water Resources Research, 2001,37(3):701-708. DOI:10.1029/2000WR900325URL [本文引用: 1]
FuBaopu. On the calculation of the evaporation from land suface Chinese Journal of Atmospheric Sciences, 1981,5(1):23-31. [本文引用: 1]
SunFubao, YangDawen, LiuZhiyu, et al. Study on coupled water-energy balance in Yellow River basin based on Budyko Hypothesis Journal of Hydraulic Engineering, 2007,38(4):409-416. [本文引用: 1]
LiuZhifang, LiuYoucun, HaoYonghong, et al. Multi-time scale cross-wavelet transformation between runoff and climate factors in the upstream of Heihe River Arid Land Geography, 2014,37(6):1137-1146. [本文引用: 1]
Wang ZY, Liu ZG, Deng ZW, et al. Phase extraction of non-stationary interference signal in frequency scanning interferometry using complex shifted Morlet wavelets Optics Communications, 2018,420:26-33. DOI:10.1016/j.optcom.2018.03.032URL [本文引用: 1]
Jarrah AM, KhannaN. Some results on vanishing moments of wavelet packets, convolution and cross-correlation of wavelets Arab Journal of Mathematical Sciences, 2019,25(2):169-179. DOI:10.1016/j.ajmsc.2018.07.001URL [本文引用: 1]
HudginsL, Huang JP. Bivariate wavelet analysis of Asia monsoon and ENSO Advances in Atmospheric Sciences, 1996,13(3):299-312. DOI:10.1007/BF02656848URL [本文引用: 2]
Huang HB, Huang XR, Yang ML, et al. Identification of vehicle interior noise sources based on wavelet transform and partial coherence analysis Mechanical Systems and Signal Processing, 2018,109(9):247-267. DOI:10.1016/j.ymssp.2018.02.045URL [本文引用: 1]
HuSheng, QiuHaijun, SongJinxi, et al. Influencing mechanisms of climate change on runoff process in the north slope of Qinling Mountains: A case of the Bahe River basin Arid Land Geography, 2017,40(5):967-978. [本文引用: 5]
Xie ZH, YuanF, Duan QY, et al. Regional parameter estimation of the VIC land surface model: Methodology and application to river basins in China Journal of Hydrometeorology, 2007,8(3):447-468. DOI:10.1175/JHM568.1URL [本文引用: 1]
ZhangJing, LiuGuoqing, SongXiaoyan, et al. A simulation study of actual evapotranspiration in Songhuajiang river basin based on Budyko Hypothesis Journal of China Hydrology, 2019,39(2):22-27. [本文引用: 1]
LiuWenjun, ZhangPeng, LiLihua, et al. Analysis on the factors affecting the change of the Ebinur lake area Arid Zone Research, 2010,27(1):64-68. DOI:10.3724/SP.J.1148.2010.00064URL [本文引用: 1]
ChenYaning, LiZhi, FanYuting, et al. Research progress on the impact of climate change on water resources in the arid region of Northwest China Acta Geographica Sinica, 2014,69(9):1295-1304. [本文引用: 3]
LiuZhanming, ChenZishen, LuJianfei, et al. Analysis of correlation between the spatio-temporal distribution of precipitation in Beijiang River basin and SST in 3 Journal of Natural Resources, 2013,28(5):786-798. [本文引用: 1]
GrinstedA, Moore JC, JevrejevaS. Application of the cross wavelet transform and wavelet coherence to geophysical time series Nonlinear Processes in Geophysics, 2004,11(5/6):561-566. DOI:10.5194/npg-11-561-2004URL [本文引用: 1]
ChenShaobing, SunXuelan, DongZhao, et al. A study of the effect of Yiluo river on the flow and sediment of the Yellow River China Rural Water and Hydropower, 2017(6):58-64. [本文引用: 1]
MaraunD, KurthsJ. Cross wavelet analysis: Significance testing and pitfalls Nonlinear Processes in Geophysics, 2004,11(4):505-514. DOI:10.5194/npg-11-505-2004URL [本文引用: 1]
WangHuaqi, ZhangMaosheng, DangXueya. Multiscale characteristics and sudden change analysis of precipitation and evaporation series in Yulin area Water Resources and Power, 2010,28(9):1-4, 47. [本文引用: 1]
DongYu, YimitiHaimiti. Spatio-temporal variability and trend of potential evapotranspiration in Xinjiang from 1961 to 2013 Transactions of the Chinese Society of Agricultural Engineering, 2015,31(1):153-161. [本文引用: 1]
JiangYuan'an, LiuJing, ShaoWeiling, et al. Climatic characteristics and historical evolution of precipitation in different time scales in Xinjiang from 1961 to 2013 Journal of Glaciology and Geocryology, 2014,36(6):1363-1375.
ZhangYin, TuerxunbaiGulixian, SuLitan, et al. Spatial and temporal characteristics of climate change at different altitudes in Xinjiang in the past 60 years Arid Land Geography, 2019,42(4):822-829.
YinGang, LiLanhai, MengXianyong, et al. A research of precipitation trend and fluctuation in Xinjiang from 1979 to 2013 Journal of North China University of Water Resources and Electric Power (Natural Science Edition), 2017,38(5):19-27.
XiePei, GuYanling, ZhangYuhu, et al. Precipitation and drought characteristics in Xinjiang during 1961-2015 Arid Land Geography, 2017,40(2):332-339. [本文引用: 1]
ZhangAnhe, DingJianli, ZhangJunyong, et al. The variation characteristics of actual evapotranspiration in the Ebinur Lake Oasis and its relationship with landscape pattern Journal of Glaciology and Geocryology, 2020,42(2):1-9. [本文引用: 1]
MengXianyong, MengBaochen, WangYuejian, et al. Influence of climate change and human activities on water resources in Ebinur Lake in recent 60 years Journal of China Hydrology, 2015,35(2):90-96. [本文引用: 1]
BaiYungang, RuziMusha, LeiXiaoyun, et al. Analysis on characteristic and affecting factor of drought disaster of Xinjiang Yellow River, 2012,34(7):61-63. [本文引用: 1]
 ,1,2, 丁建丽
 新窗口打开|下载原图ZIP|生成PPT
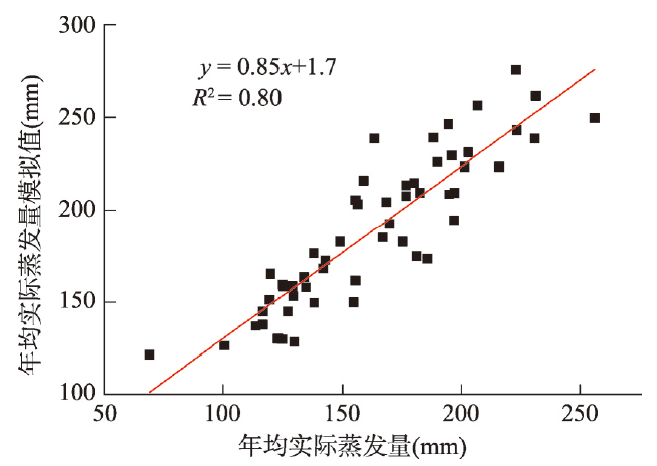 新窗口打开|下载原图ZIP|生成PPT
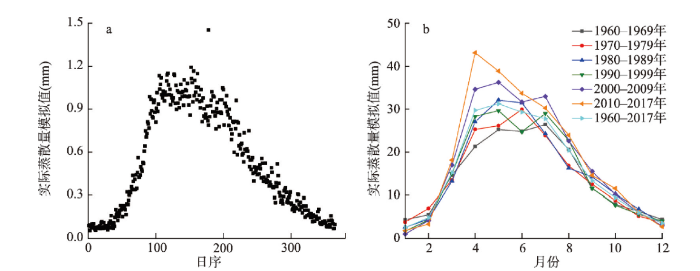 新窗口打开|下载原图ZIP|生成PPT
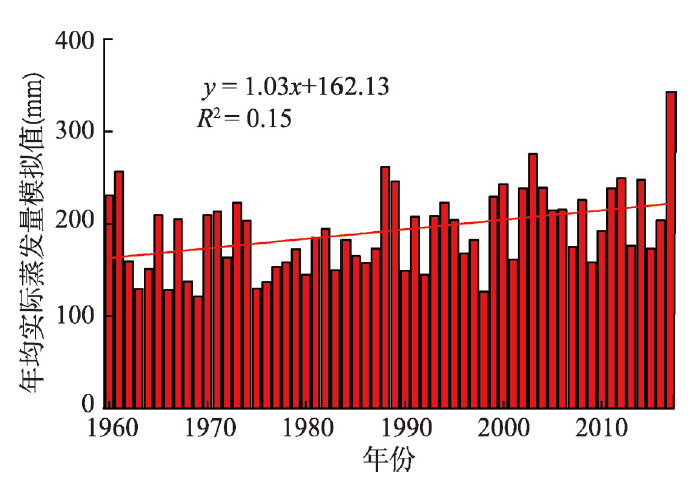 新窗口打开|下载原图ZIP|生成PPT
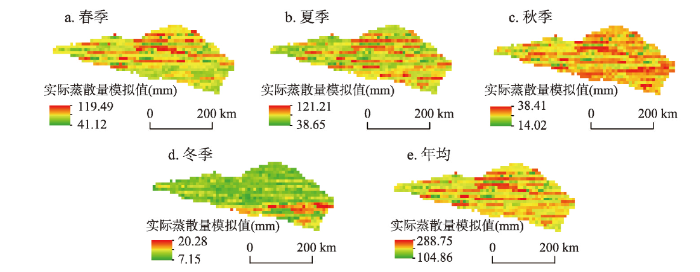 新窗口打开|下载原图ZIP|生成PPT
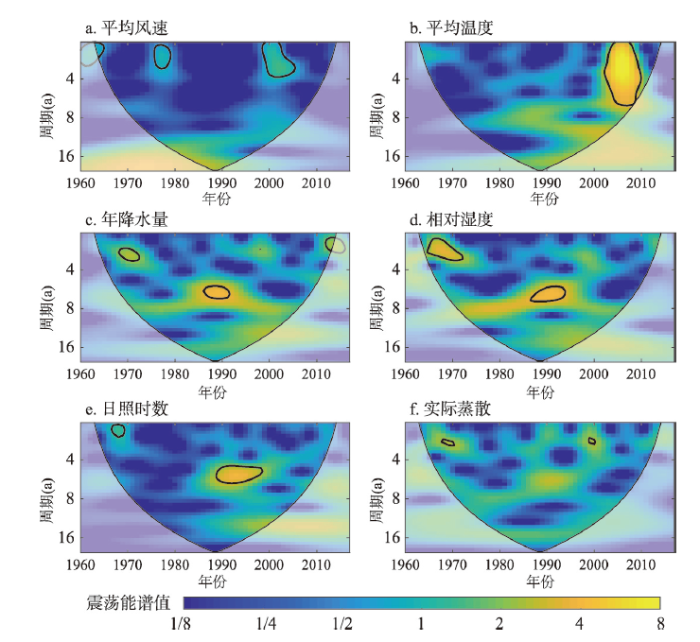 新窗口打开|下载原图ZIP|生成PPT
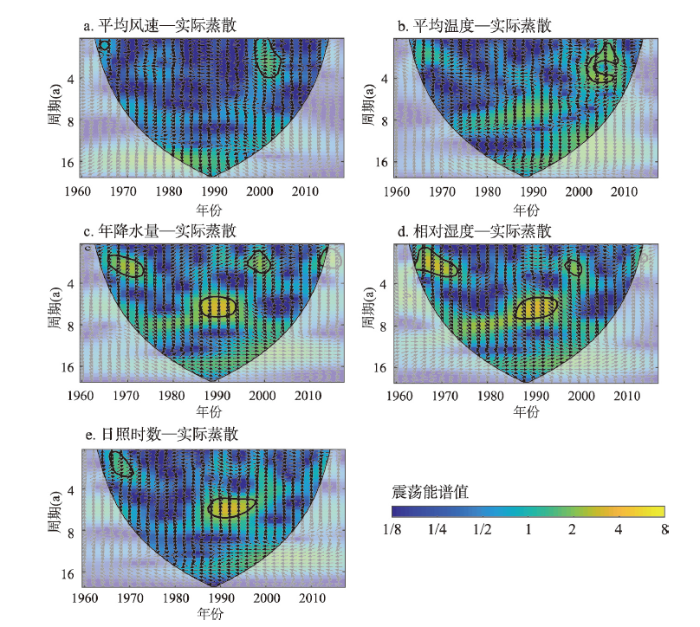 新窗口打开|下载原图ZIP|生成PPT
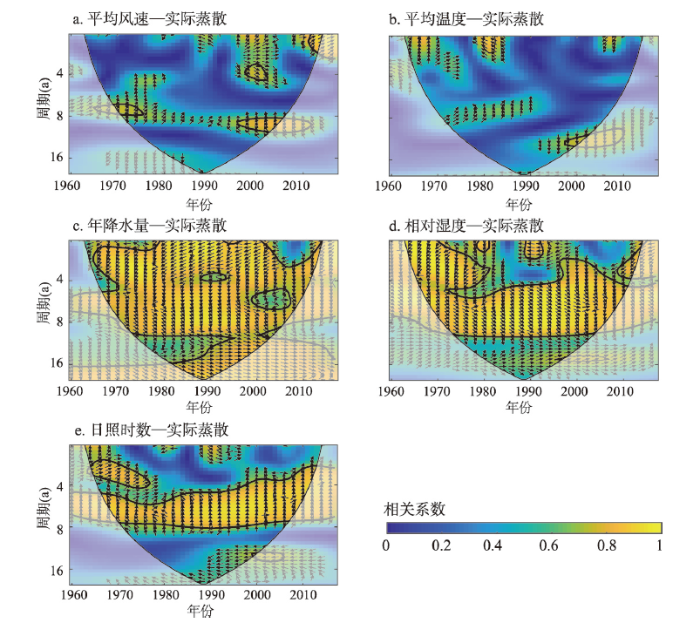 新窗口打开|下载原图ZIP|生成PPT