 ,1, 孔冬冬2, 张选泽1, 田静1, 李聪聪1,3
Impacts of vegetation changes on global evapotranspiration in the period 2003-2017
ZHANG Yongqiang,1, KONG Dongdong2, ZHANG Xuanze1, TIAN Jing1, LI Congcong1,3收稿日期:2020-05-21网络出版日期:2021-03-25
| 基金资助: |
Received:2020-05-21Online:2021-03-25
| Fund supported: |
作者简介 About authors
张永强(1976-), 男, 内蒙古包头人, 研究员, 从事区域和全球水循环、特别是陆面蒸散发机理和过程研究。E-mail:

摘要
关键词:
Abstract
Keywords:
PDF (4581KB)元数据多维度评价相关文章导出EndNote|Ris|Bibtex收藏本文
本文引用格式
张永强, 孔冬冬, 张选泽, 田静, 李聪聪. 2003—2017年植被变化对全球陆面蒸散发的影响. 地理学报[J], 2021, 76(3): 584-594 doi:10.11821/dlxb202103007
ZHANG Yongqiang, KONG Dongdong, ZHANG Xuanze, TIAN Jing, LI Congcong.
1 引言
蒸散发是陆地与大气物质循环和能量循环过程的重要环节,是陆地水循环的关键过程和地表能量平衡的主要分量[1,2]。在气候持续变暖和下垫面剧烈变化情境下,理清蒸散发变化的机理对评估未来全球可利用水资源量[3]和极端气候事件趋势(如洪涝[4]、干旱[4,5]、热浪[6,7]等)具有重要意义。但是人类对蒸散发的认识仍非常有限。1803年Dalton首次提出了蒸发是风速和水汽压的函数,其后100年间有关蒸散发的研究进展缓慢。1948年Penman统一了空气动力学理论和能量平衡理论,提出了经典的Penman公式[8]。1965年Monteith将气孔阻力引入Penman公式[9],把Penman公式从水面蒸发推广到陆地植被,方法至今仍被广泛使用[10,11,12]。水面蒸发的介质均一,研究相对简单。但即便如此,人们仍未能全面认识水面蒸发的过程,关于蒸发皿的“蒸发悖论”依然存在很大争议[13,14,15,16]。相比之下,陆地蒸散发研究更为困难。首先陆表下垫面属性复杂、植被类型多样,而且蒸散发各组分包括土壤蒸发、植被蒸腾和冠层截留蒸发的比例分配关系复杂[11, 17-19];其次是点—面尺度扩展,常规的地表蒸散发观测(如通量站)都是在站点尺度上展开,如何扩展到区域乃至全球尺度一直是蒸散发研究的热点和难点[20]。由于站点观测的局限性,研究区域或全球尺度的蒸散发过程必须借助于模型模拟。迄今为止,全球遥感蒸散发(ET)产品多达十几种。根据其计算方法不同,这些产品可以分为以下几类:① 水热耦合方法,如基于Penman-Monteith方程的PML和MODIS产品[11, 21]、基于Priestley-Taylor公式的GLEAM产品[22];② 统计方法,如基于机器学习方法的MTE产品[23,24];③ 基于陆面水文模型的CLM[25]和GSWP2产品[26,27]等。PML产品是基于水热耦合方法的一种,由Penman-Monteith-Leuning(PML)模型计算而得。PML模型参数化简单,可有效分离土壤蒸发、植被蒸腾和冠层截留蒸发,模拟精度相对较高[10,11,12],在全球ET研究中被广泛使用。该模型在Penman-Monteith公式的基础上,根据叶面积指数将蒸散发划分为植被蒸腾和土壤蒸发,并采用适用性分析模型模拟冠层蒸发截留[11]。第二代PML模型(PML-V2)采用气孔导度耦合植被蒸腾和光合同化速率,显著提高了植被蒸散发和总初级生产力模拟精度[28]。该模型充分利用遥感植被动态(植被叶面积指数作为输入)信息,较好地实现了蒸散发的点—面尺度扩展。PML-V2模型在全球95个通量站上分不同植被类型(共10种植被类型)进行率定,进一步根据MODIS的IGBP全球植被类型产品(MCD12Q1.006)将模型参数由站点尺度扩展到全球逐网格尺度(每个网格独立计算),进而实现了全球蒸散发和总初级生产力的模拟。本文即是利用PML-V2模型估算2003—2017年全球陆面蒸散发,在此基础上进行下垫面变化对陆表三层蒸散发的影响分析。
1982—2016年全球范围内地表下垫面发生了显著的变化[29,30],主要表现为城市区域的扩大和生态工程实施带来的植被变绿。这些下垫面变化对陆表蒸散发过程产生了显著的影响。已有的研究主要局限于区域或流域尺度[31,32],但在全球尺度上,下垫面变化如何改变陆面的蒸散发过程仍没有得到充分的揭示。本文借助PML-V2模型,在全球尺度上评估了下垫面变化对蒸散发的影响,并探讨了下垫面变化影响在空间上分布差异的原因。
2 数据来源
2.1 模型驱动数据
本文采用的气象驱动数据是结合卫星和地面观测数据提供多类型的数据集——全球陆面数据同化系统(Global Land Data Assimilation System, GLDAS)。GLDAS-2.1修正了短波下行辐射通量和降水在北半球的异常问题并得到广泛应用,时间和空间分辨率分别达0.25°和3 h。GLDAS-2.1数据集中的向下短波辐射、向下长波辐射、风速、气温、相对湿度、水汽压和降水等作为PML-V2模型的气象驱动。CO2浓度数据集使用美国国家海洋与大气管理局(National Oceanic and Atmospheric Administration, NOAA)发布的数据(ftp: //aftp.cmdl.noaa.gov.products/trends/co2/co2_mm_gl.txt)。模型计算使用的其他驱动数据还包括Moderate-resolution Imaging Spectroradiometer数据产品中发射率(Emissivity)、地表反照率(Albedo)和叶面积指数(Leaf Area Index, LAI)等数据。其中LAI的分辨率为500 m和4 d(MCD15A3H.006),Emissivity分辨率为500 m和8 d(MOD11A2.006),Albedo分辨率为500 m和1 d(MCD43A3.006)。
本文所用土地利用/覆盖数据集来自于美国国家航空航天局处理后的分辨率为500 m和1 a的数据产品(MCD2Q1.006)。本文选取全球植被分类方案(International Geosphere-Biosphere Program, IGBP),将土地利用数据重分类成森林、草原、灌丛、农田、城市、水体和裸土等7种类型以便统计。
2.2 数据预处理
本文采用双线性插值(Bilinear Interpolation)方法将0.25°气象数据插值成500 m。为减少不利天气因素(云,阴影等)的影响,采用加权Whittaker滤波对LAI进行平滑处理[36,37]。Albedo和Emissivity的缺失值的填充采用对相邻日期线性插值而来。2.3 生成数据
本文采用谷歌数据引擎(Google Earth Engine, GEE)来运行水碳耦合模型PML-V2,生成2003—2017年的全球陆地实际蒸散发和总初级生产力耦合数据集,时间和空间分辨率分别为500 m和8 d。该数据在全球尺度具有良好的表现[10]:95个全球通量站ET交叉验证的根均方差为0.73 mm/d,偏差为-3%。3 模型和模拟试验
3.1 PML-V2模型
PML-V2模型是在PML的基础上发展起来的,与PML的主要区别是发展了计算冠层导度Gc的新方法,根据气孔导度理论耦合了总初级生产力,利用总初级生产力和大气CO2浓度估算冠层导度,从而实现了陆地蒸散发与总初级生产力的联合估算。PML-V2估算冠层导度的出发点是Ball-Berry-Leuning气孔导度模型[38]。PML-V2中使用Yu等[39]对其简化后的方法:
式中:gs为气孔导度(m s-1);
式中:β为初始量子效率(μmol CO2 (μmol光量子)-1);
式中:Vm, 25为T = 25 ?C时Vm的值;T为空气气温(?C);a和b分别为与温度相关的系数,可分别取0.031和0.115。
在冠层尺度,光合速率(Ac,g)为叶片尺度Ag对叶面积指数的积分值(μmol m-2 s-1)。通过Beer定律:
式中:I0为冠层上方光合有效辐射(μmol m-2 s-1);LAI为冠层的整体叶面积指数(m2 m-2);k为消光系数。为表示方便,合并变量如下:
对gs进行积分,得出Gc的计算公式:
同时,为保证植被总初级生产力(GPP)和Et的计算精度,采用空气饱水汽压差限制
式中:Ac, g是在没有饱水汽压差D约束下的光合速率(kPa);f是在饱水汽压差D约束函数(D);
在全球95个涡度相关通量站上,PML-V2根据不同的植被类型分别率定参数,得到不同植被类型参数查询表。根据MODIS MCD12Q2.006 IGBP土地利用数据,将参数值移植至全球。PML-V2在全球通量站进行了充分的交叉验证,其模拟精度明显优于其他代表性的全球高精度蒸散发产品,如MODIS蒸发产品MOD16[10]。
3.2 PML-V2模拟试验
本文利用PML-V2模型,设计如下情景以分离植被变化对蒸散发在2003—2017年间的影响。试验组采用静态的2003年植被类型数据(包括植被类型、叶面积指数、反照率和发射率)和动态气象驱动数据。对照组采用动态的植被类型数据(包含了土地利用变化和叶面积指数变化信息)和动态的气象驱动数据。因此,植被变化对蒸散发的影响可以用以下公式分离:式中:x为蒸散发、植被蒸腾、土壤蒸发或冠层截留蒸发;
4 研究结果
4.1 土地利用变化
相对于2003—2007年,2008—2017年间,在全球尺度上自然植被(如森林、灌木、草地)覆盖度明显增加,裸土面积减少,耕地增加,城市化进程加剧(图1)。对于森林、灌木和草地,分别有54.8%、53.3%和56.2%的区域呈现增加趋势。与之前研究发现类似[29],近赤道20°S~20°N地区森林覆盖下降较为显著,在2008—2017年间下降幅度为0.5%。对于裸土,其覆盖度明显减少,减少的比例占60.4%,尤其是在中国的西部、澳洲中部、北美高纬度地区、以及南美西部。对于耕地,其变化规律呈现明显的区域差异,比如在中国华北平原和四川盆地等地区,耕地覆盖度微弱减少(图1a)。这可能是退耕还林等生态工程影响导致的,在这些地区可以看到森林的覆盖度明显增加(图1a)。与此相反的是南美洲南部地区,耕地覆盖度增加的同时,森林和草地覆盖度却明显减少。对于城市,几乎所有的城市在过去十几年间都发生了扩张,尤其是中国胡焕庸线以东地区、印度大部分地区、欧洲西部、以及北美东南部地区。对于水体,除北半球高纬度地区以外,其他地区水体比例呈现一致增加趋势。图1
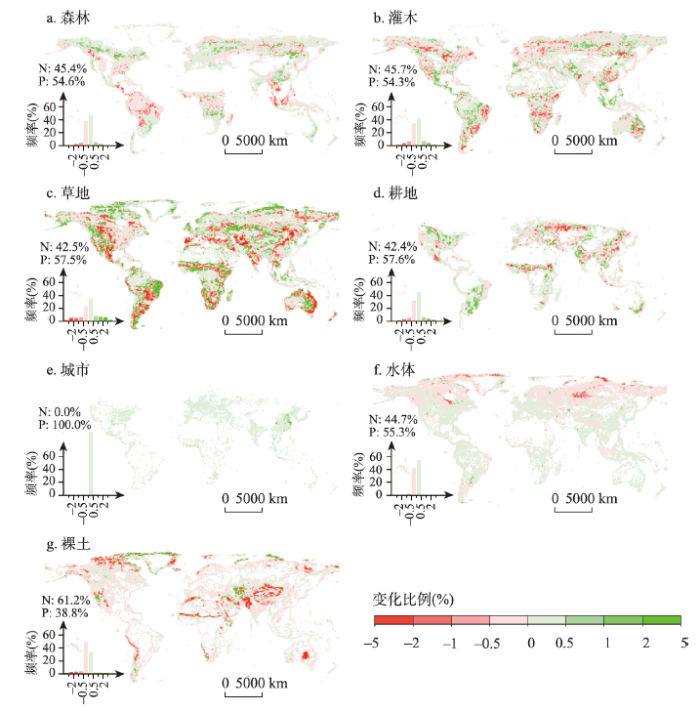 新窗口打开|下载原图ZIP|生成PPT
图12008—2017年相对于2003—2007年每种植被类型在0.1°格点中的比例变化
注:N代表减少的比例、P代表增加的比例;左下角是全球数据的频率分布直方图。
Fig. 1Area change in each vegetation type between 2008-2017 and 2003-2007 at each 0.1°× 0.1°grid cell across the globe
4.2 蒸散发各分量的空间分异特征及其对植被变化的响应
如图2所示,全球平均年蒸散发为(476.7±378.2) mm(全球所有格点的均值±标准差),其中植被蒸腾、土壤蒸发和冠层截留蒸发分别为(268.6±303.2) mm、(161.4±103.4) mm和(46.6±77.2) mm,分别占年蒸散发总量的40.9%±24.9%、52.5%±30.2%和6.6%±7.2%(图2)。图2
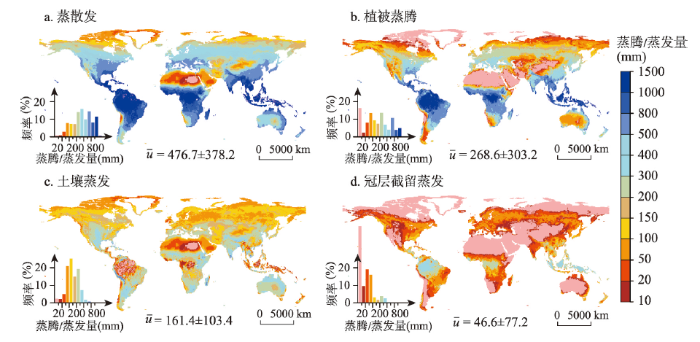 新窗口打开|下载原图ZIP|生成PPT
图22003—2017年平均蒸散发、植被蒸腾、土壤蒸发和冠层截留蒸发空间分布
注:
Fig. 2Spatial pattern of mean annual evapotranspiration, transpiration, soil evaporation and evaporation from canopy in 2003-2017
如图3所示,在2004—2017年间(动态模拟—静态模拟),植被变化导致全球年蒸散发平均增加2.3±12.5 mm,其中植被蒸腾和冠层截留蒸发分别增加5.3±19.4 mm和0.8±3.9 mm,而植被变化对土壤蒸发的影响与其对植被蒸腾和冠层截留蒸发的影响完全相反,植被变化促使土壤蒸发平均下降3.8±12.8 mm。植被变化诱导的蒸散发变化与其对植被蒸腾的影响在空间上具有较好的一致性。在中国东部、印度大部分地区、欧洲西部、非洲南部和北美洲中部,植被蒸腾和蒸散发均显著增加(图3a~3b),与此同时这些地区的土壤蒸发下降明显(图3c)。在亚马逊森林、非洲北部、欧洲中部部分地区,植被蒸腾和蒸散发均显著减少趋势,土壤蒸发变化趋势则相反。而植被变化引起的冠层截留蒸发变化幅度较小,大部分地区小于3 mm(图3d)。
图3
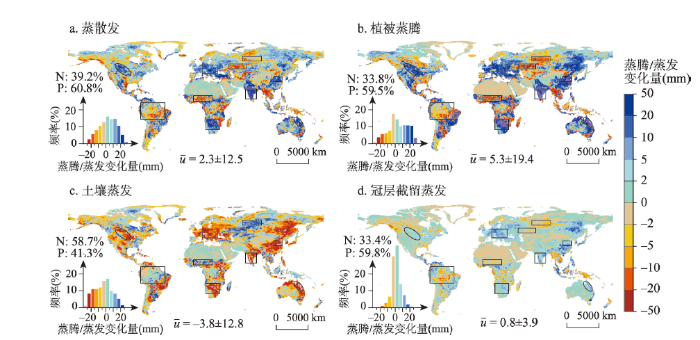 新窗口打开|下载原图ZIP|生成PPT
图32004—2017年植被变化引起的年蒸散发、植被蒸腾、土壤蒸发和年冠层截留蒸发变化空间分布
注:
Fig. 3Vegetation change induced annual changes in evapotranspiration, transpiration, soil evaporation and evaporation from canopy in 2004-2017
由于不同区域蒸散发量级不同,为方便对比植被变化对蒸散发的影响在空间上的差异,图4进一步展示了植被变化引起的蒸散发相对变化百分比。在80°N以北地区,植被变化引起的蒸散发各分量一致下降,植被蒸腾、土壤蒸发和冠层截留蒸发的下降比例分别为20%、5%和30%;如图1f,陆地表面水体面积(主要是冰雪覆盖的面积)在北半球高纬度地区呈现下降趋势,水体面积减少导致地表前期土壤含水量下降,最终使土壤蒸发下降。此外,灌木退化和冰面消融导致的高纬度地区裸土面积增加(图1b和1g),可能是植被蒸腾和冠层截留蒸发明显下降的主要原因。在70°N~80°N和20°S~30°S纬度带上,植被变化引起的蒸散发分量变化最显著,植被蒸腾和冠层截留蒸发分别增加约10%~15%,而土壤蒸发下降约0~5%;在北半球中纬度地区,如欧洲西部和中国东部,植被变化对土壤蒸发的影响最为强烈,植被变化促使土壤蒸发在这些地区下降约5%。
图4
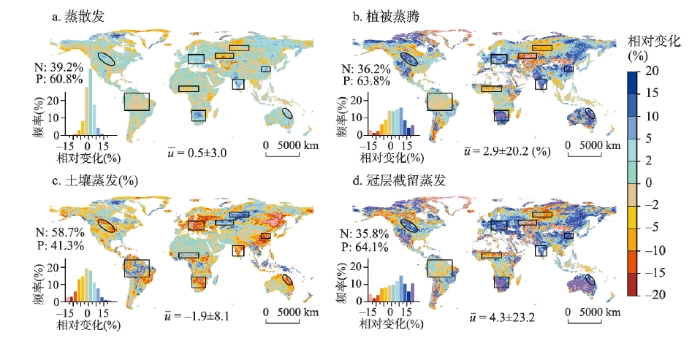 新窗口打开|下载原图ZIP|生成PPT
图42004—2017年植被变化引起的年蒸散发、植被蒸腾、土壤蒸发和冠层截留蒸发相对变化空间分布
注:
Fig. 4Vegetation change induced relative percentage changes in evapotranspiration, transpiration, soil evaporation and evaporation from canopy in 2004-2017
图5进一步展示了植被变化对蒸散发的影响在时间上的差异。在2004—2012年间,尽管蒸散发已显著增加,但植被变化对森林、草地、城市和水体的影响接近于0;此外,植被变化使全球陆地表面的灌木和草地蒸散发各增加58 km3(相对变化为0.24%和0.69%)。自2012年以后,除裸土外,植被变化对蒸散发的影响显著加强。植被变化使全球陆表的森林、草地、城市和水体的年蒸散发分别增加110 km3、90 km3、7 km3和16 km3(相对变化为0.53%、0.60%、0.63%和0.67%);对于灌木和耕地,其对应的全球陆表的年蒸散发量分别增加200 km3和210 km3(占0.85%和2.45%),该量级约为黄河流域年平均天然径流量的4倍(按照500亿m3来估算[40])。
图5
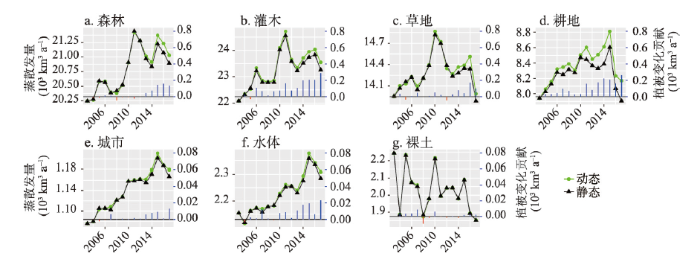 新窗口打开|下载原图ZIP|生成PPT
图52003—2017年间植被变化对全球陆地表面年蒸散发量的影响
注:植被变化贡献=年动态模拟值-年静态模拟值。
Fig. 5Vegetation change induced changes in different land cover types across the globe in 2003-2017
4.3 不同因素对植被诱导的蒸散发变化量的影响
由图6可以看出,① 干旱区和湿润区,蒸散发各分量对叶面积指数(LAI)的敏感性存在显著的差异;植被蒸腾对LAI的敏感性,在干旱区明显强于湿润区。在湿润区(干燥度指数< 2.5或水平衡> 0)植被蒸腾对LAI的敏感性差异较小。在干旱区(干燥度指数> 2.5或水平衡< -500 mm),植被蒸腾对LAI的敏感性随干燥度增加(或水平衡下降)而增加,而土壤蒸发和冠层截留蒸发则随之增加而下降。② 年降水对各蒸散发各分量的影响弱于干燥度指数和水平衡的影响;当年降水> 400 m时,降水对各分量对LAI的敏感性的影响较弱。③ 在年均温为25 ℃左右时,植被蒸腾对LAI的敏感性最低。与此同时,土壤蒸发和冠层截留蒸发对LAI的敏感性达到最高。图6
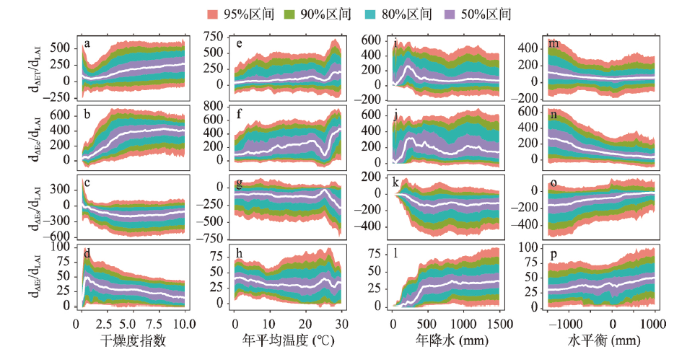 新窗口打开|下载原图ZIP|生成PPT
图6不同因素对蒸散发对叶面积指数敏感性的影响。
注:干燥度指数=年潜在蒸散发/年降水量;水平衡=年降水量-年潜在蒸散发;?=动态模拟值-静态模拟值;dx/dLAI表示变量x对LAI的敏感性;图中白色折线为dx/dLAI的中位数。
Fig. 6Sensitivity of leaf area index to different drivers
5 讨论与结论
2003—2017年全球陆地下垫面条件发生了显著的变化。裸土面积减少、自然植被覆盖度增加、森林面积下降、耕地增加和城市化进程加剧。本文采用PML-V2全球陆面蒸散发模型,系统研究了下垫面变化对蒸散发及其主要分量的影响。结果显示,2003—2017年下垫面变化导致全球年蒸散发增加(2.3±12.5) mm,其中植被蒸腾和冠层截留蒸发分别增加(5.3±19.4) mm和(0.8±3.9) mm,而植被变化对土壤蒸发的影响与其对植被蒸腾和冠层截留蒸发的影响完全相反,土壤蒸发平均下降(3.8±12.8) mm。下垫面变化对蒸散发的影响,在不同土地利用上存在明显的差异,其对蒸散发的影响在灌木和耕地最为显著。下垫面变化在蒸散发的影响,在年际间也存在明显的变化,2004—2012年下垫面变化对森林、草地、城市和水体的影响接近于0;但2012年以后,下垫面变化对蒸散发的影响陡增。
下垫面变化主要通过影响植被蒸腾和土壤蒸发,最终影响蒸散发总量。其中,下垫面变化对植被蒸腾的影响最为显著,因此下垫面变化对蒸散发总量的影响与其对植被蒸腾影响在空间上具有较好的一致性。而在下垫面的众多因素中,LAI是影响植被蒸腾变化的主控因子。在LAI增加的区域,如北美洲中北部、欧洲、中国东部、非洲南部和澳大利亚东北部,植被变绿促使植被蒸腾和冠层截留蒸发显著增加。虽然植被变绿导致被土壤吸收的太阳辐射减少、土壤蒸发减小,但是土壤蒸发减小的量级远小于植被蒸腾和冠层截留蒸发的增量,最终导致LAI增加导致陆面蒸散发增加;与此相反,在LAI增加的区域,如南美亚马逊雨林、俄罗斯中部温带森林、以及非洲中部热带雨林等区域,LAI降低导致植被蒸腾和冠层截留蒸发显著下降,最终使这些区域的陆面蒸散发降低。
陆面蒸散发对LAI变化的敏感性,在不同区域存在明显差异。在干旱区和湿润区,蒸散发各分量对LAI的敏感性存在显著的差异;植被蒸腾对LAI的敏感性,在干旱区明显强于湿润区。此外,年降水对各蒸散发各分量的影响弱于干燥度指数和水平衡的影响。
本文的研究结果为量化下垫面变化对蒸散发的影响提供了方法,其有助于增进陆地水循环变化机理的认识、揭示未来气候变化情景下的水文循环规律。
参考文献 原文顺序
文献年度倒序
文中引用次数倒序
被引期刊影响因子
[本文引用: 1]
URL [本文引用: 1]
[本文引用: 1]
[本文引用: 2]
[本文引用: 1]
[本文引用: 1]
[本文引用: 1]
[本文引用: 1]
URLPMID:5321565 [本文引用: 1]
[本文引用: 4]
DOI:10.1038/s41598-016-0002-7URLPMID:28442706 [本文引用: 5]

Myopia is the most common childhood refractive disorder. Atropine inhibits myopia progression, but its mechanism is unknown. Here, we show that myopia-prevention by atropine requires production of nitric oxide (NO). Form-deprivation myopia (FDM) was induced in week-old chicks by diffusers over the right eye (OD); the left eye (OS) remained ungoggled. On post-goggling days 1, 3, and 5, OD received intravitreally 20 microL of phosphate-buffered saline (vehicle), or vehicle plus: NO source: L-arginine (L-Arg, 60-6,000 nmol) or sodium nitroprusside (SNP, 10-1,000 nmol); atropine (240 nmol); NO inhibitors: L-NIO or L-NMMA (6 nmol); negative controls: D-Arg (10 micromol) or D-NMMA (6 nmol); or atropine plus L-NIO, L-NMMA, or D-NMMA; OS received vehicle. On day 6 post-goggling, refractive error, axial length, equatorial diameter, and wet weight were measured. Vehicle-injected goggled eyes developed significant FDM. This was inhibited by L-Arg (ED50 = 400 nmol) or SNP (ED50 = 20 nmol), but not D-Arg. Higher-dose SNP, but not L-Arg, was toxic to retina/RPE. Atropine inhibited FDM as expected; adding NOS-inhibitors (L-NIO, L-NMMA) to atropine inhibited this effect dose-dependently, but adding D-NMMA did not. Equatorial diameter, wet weight, and metrics of control eyes were not affected by any treatment. In summary, intraocular NO inhibits myopia dose-dependently and is obligatory for inhibition of myopia by atropine.
[本文引用: 2]
[本文引用: 1]
[本文引用: 1]
[本文引用: 1]
[本文引用: 1]
[本文引用: 1]
[本文引用: 1]
[本文引用: 1]
[本文引用: 1]
[本文引用: 1]
DOI:10.5194/hess-16-2605-2012URL
[本文引用: 1]
[本文引用: 1]
[本文引用: 1]
[本文引用: 1]
[本文引用: 1]
DOI:10.1038/nature09396URLPMID:20935626 [本文引用: 1]
More than half of the solar energy absorbed by land surfaces is currently used to evaporate water. Climate change is expected to intensify the hydrological cycle and to alter evapotranspiration, with implications for ecosystem services and feedback to regional and global climate. Evapotranspiration changes may already be under way, but direct observational constraints are lacking at the global scale. Until such evidence is available, changes in the water cycle on land-a key diagnostic criterion of the effects of climate change and variability-remain uncertain. Here we provide a data-driven estimate of global land evapotranspiration from 1982 to 2008, compiled using a global monitoring network, meteorological and remote-sensing observations, and a machine-learning algorithm. In addition, we have assessed evapotranspiration variations over the same time period using an ensemble of process-based land-surface models. Our results suggest that global annual evapotranspiration increased on average by 7.1 +/- 1.0 millimetres per year per decade from 1982 to 1997. After that, coincident with the last major El Nino event in 1998, the global evapotranspiration increase seems to have ceased until 2008. This change was driven primarily by moisture limitation in the Southern Hemisphere, particularly Africa and Australia. In these regions, microwave satellite observations indicate that soil moisture decreased from 1998 to 2008. Hence, increasing soil-moisture limitations on evapotranspiration largely explain the recent decline of the global land-evapotranspiration trend. Whether the changing behaviour of evapotranspiration is representative of natural climate variability or reflects a more permanent reorganization of the land water cycle is a key question for earth system science.
[本文引用: 1]
[本文引用: 1]
[本文引用: 1]
[本文引用: 1]
DOI:10.1038/s41586-018-0411-9URLPMID:30089903 [本文引用: 2]
Land change is a cause and consequence of global environmental change(1,2). Changes in land use and land cover considerably alter the Earth's energy balance and biogeochemical cycles, which contributes to climate change and-in turn-affects land surface properties and the provision of ecosystem services(1-4). However, quantification of global land change is lacking. Here we analyse 35 years' worth of satellite data and provide a comprehensive record of global land-change dynamics during the period 1982-2016. We show that-contrary to the prevailing view that forest area has declined globally(5)-tree cover has increased by 2.24 million km(2) (+7.1% relative to the 1982 level). This overall net gain is the result of a net loss in the tropics being outweighed by a net gain in the extratropics. Global bare ground cover has decreased by 1.16 million km(2) (-3.1%), most notably in agricultural regions in Asia. Of all land changes, 60% are associated with direct human activities and 40% with indirect drivers such as climate change. Land-use change exhibits regional dominance, including tropical deforestation and agricultural expansion, temperate reforestation or afforestation, cropland intensification and urbanization. Consistently across all climate domains, montane systems have gained tree cover and many arid and semi-arid ecosystems have lost vegetation cover. The mapped land changes and the driver attributions reflect a human-dominated Earth system. The dataset we developed may be used to improve the modelling of land-use changes, biogeochemical cycles and vegetation-climate interactions to advance our understanding of global environmental change(1-4,6).
[本文引用: 1]
[本文引用: 1]
[本文引用: 1]
[本文引用: 1]
[本文引用: 1]
[本文引用: 1]
URLPMID:14980969 [本文引用: 1]
[本文引用: 1]
[本文引用: 1]
