 ,1, 许刚,1, 焦利民2, 秦昆1
Urban scaling law and its application
GONG Jianya,1, XU Gang,1, JIAO Limin2, QIN Kun1通讯作者:
收稿日期:2019-07-30修回日期:2020-12-26网络出版日期:2021-02-25
| 基金资助: |
Received:2019-07-30Revised:2020-12-26Online:2021-02-25
| Fund supported: |
作者简介 About authors
龚健雅(1957-), 男, 博士, 教授, 中国科学院院士, 长期从事地理信息理论和摄影测量与遥感基础研究。E-mail:

摘要
关键词:
Abstract
Keywords:
PDF (2438KB)元数据多维度评价相关文章导出EndNote|Ris|Bibtex收藏本文
本文引用格式
龚健雅, 许刚, 焦利民, 秦昆. 城市标度律及应用. 地理学报[J], 2021, 76(2): 251-260 doi:10.11821/dlxb202102001
GONG Jianya, XU Gang, JIAO Limin, QIN Kun.
1 引言
城市是一个典型复杂系统,具有两层意义:一是城市本身是一个复杂系统,二是多个城市构成的城市体系也是一个复杂系统[1]。传统的线性科学不能很好地认识、理解城市,我们迫切需要新的城市科学[2,3]。一个新的研究范式是关注不同历史、不同地理、不同文化、不同体制下城市所表现出的共同性质[4]。标度律(Scaling Law)便是复杂城市系统背后的简单规律和机制之一[5,6,7]。标度律是生物学、物理学、网络科学等复杂系统中普遍存在的规律[8],例如生物学中克莱伯定律(Kleiber's Law)指出成年哺乳动物的新陈代谢率和体重呈3/4次幂函数关系[9]。城市标度律(Urban Scaling Law)是指城市体系内城市指标与人口规模的缩放关系,反映的是城市体系的状态和特征,而不是单个城市的性质。城市标度律通常为幂函数形式Y=Y0 Nβ,其中Y为城市指标,N为人口规模,β被称为标度因子(Scaling Exponent)。根据标度因子β与1的关系可将城市指标分为3类[6]:① 超线性指标(β > 1):与社会交互相关的城市指标(如GDP、知识产出、严重暴力犯罪等)的标度因子大于1(一般在1.15左右),该类城市指标随城市人口规模呈超线性增长,这是因为社会交互随人口增加呈超线性增长,体现了规模报酬递增效应;② 次线性指标(β < 1):与城市基础设施相关的城市指标(如道路长度、加油站数量等)的标度因子小于1(一般在0.85左右),该类城市指标随人口规模呈次线性增长,这是因为大城市有更多居民共享城市基础设施,反映了规模经济效应;③ 线性指标(β = 1):与城市居民个人需求相关的城市指标(如工作岗位数量、家庭用水等)的标度因子等于1,该类城市指标随城市人口规模呈线性变化[6]。
城市标度律研究很大程度上受到生命系统标度律研究的启发[8],Bettencourt等引领了城市标度律这一新的研究领域[5,6,7]。近年来国内外****在城市标度律领域取得了丰富的研究成果。本文研究目标包括3个方面:① 总结城市标度律的研究内容和进展;② 澄清城市标度律和异速增长律的区别;③ 展示城市标度律的应用。本文从城市标度律的验证、解释、应用和质疑4个方面总结了城市标度律的研究进展,重点分析了反映城市系统特征的城市标度律和刻画单个城市时序发展的异速增长律的本质差异;同时介绍了基于城市标度律的规模修正指标,并以中国地级市GDP和建成区面积为例展示了规模修正指标在城市排序和评价中的应用。
2 城市标度律研究进展
2.1 城市标度律的验证
虽然Bettencourt等总结了城市标度律,但也仅使用了有限的城市数据[6]。此后研究者选取全球不同地区的城市进行了城市标度律的验证,包括欧洲[10,11]、巴西[4]、印度[12]、中国[13]等,结果均发现了稳健的城市标度律。除了不同区域的验证,还有历史时期的验证。Cesaretti等发现1280—1320年间欧洲城市的土地面积与人口规模存在次线性标度关系[14];甚至在古代社会,居住面积和人口规模也存在次线性标度关系[15,16]。这充分说明了城市标度律是不受历史、地理、文化限制的城市系统普遍存在的规律。国内城市标度律的研究集中在城市土地面积与人口规模的标度关系[17,18],而关于其他城市指标的研究较少[19,20,21]。2.2 城市标度律的解释
城市标度律是不同历史、不同地理、不同文化下城市系统的共同性质,那么决定城市标度律形成的原因和机制是什么?一个可能寻找到答案的方向是网络科学。生命科学领域标度律研究的重要****Geoffrey West指出网络是所有复杂系统背后的支撑,如生命系统的血管网络,城市的基础设施网络和社交网络等[8]。Geoffrey West和合作者从网络科学视角提出了生命系统标度律的解释,包括3个假设:① 空间填充,即网络的触角需要到达所服务系统的各个角落;② 终端单元的恒定性,例如所有哺乳动物的毛细血管都是相同的,细胞大小也是相近的;③ 网络的优化,例如哺乳动物通过进化使得通过心脏为全身输送血液的平均能量消耗最小化[8]。这对于理解和解释城市标度律具有重要借鉴意义。研究者从不同角度抽象城市实体网络和虚拟网络,尝试解释城市标度律产生的原因和机制[5, 22-24]。但这些模型仍然只是城市标度律形成机制的可能解释之一,尚没有定论。2.3 城市标度律的应用
城市标度律的核心观点是城市指标与人口规模呈非线性缩放关系,这挑战了传统采用人均指标(如人均GDP)评价城市的做法,因为人均指标的隐含假设是城市指标随城市规模呈线性关系[25]。以GDP为例,即使在技术水平、产业政策等其他条件都相同的情况下,由于规模报酬递增效应的存在,大城市相对于中小城市仍然在人均水平上具有更多经济产出[25]。对于大城市来说,其人均GDP超过中小城市并不一定说明该大城市的经济表现更好;只有跟同等规模的大城市相比,其人均GDP仍然较高,才说明其经济产出效率高。这说明人均GDP更适合在同等规模城市之间比较,要比较不同规模城市的经济产出效率,则应该消除城市规模的影响。Bettencourt等基于城市标度律理论提出了规模修正指标(Scale-Adjusted Metropolitan Indicator, SAMI)[25],并已被成功应用到经济产出、知识创新等领域的城市评价中[26,27,28,29,30]。2.4 城市标度律的质疑
研究发现复杂城市系统背后体现出一致性规律的同时,也有研究对城市标度律提出质疑[4],主要包括3点:① 不同城市范围下城市指标与人口规模间的标度因子与1的关系不稳定[19, 31-32]。城市范围是一个复杂的、模糊的边界,加上城市人口的流动性,因此很难像测定生物体重一样准确测度城市的规模。② 双对数下线性回归模型的适用性存疑[33,34,35]。标度律本身是幂函数,大多数研究都将城市指标和人口规模取对数后采用线性函数拟合,线性拟合得到的标度因子和非线性拟合得到的幂函数指数存在差异。③ 城市指标与人口规模间的标度因子受宏观经济结构、公共政策等其他外部条件影响[36,37]。值得强调的是,虽然城市标度律在某个具体方面存在质疑,但其已经成为新城市科学的重要定量规律之一。3 城市标度律与异速增长律
3.1 城市标度律
前已述及,城市标度律反映的是同一时点城市系统内城市指标与人口规模的定量缩放关系,其函数形式是幂函数[6, 25]:式中:Y为城市指标(如建成区面积、GDP等);N为城市人口规模;Y0和β为参数,其中β为标度因子。对(1)式两边同时取对数,可以得到[6, 25]:
式(2)为线性函数。因此可以对城市指标和人口规模取对数后采用线性函数拟合,拟合直线的斜率为标度因子β。双对数坐标下的线性拟合方法简单易操作,因而是城市标度律研究最常用的拟合方法[6, 25]。
本文以中国城市为例,收集整理了291个地级市2017年城区常住人口、市辖区GDP和建成区面积数据,其中常住人口为城区的户籍人口和暂住人口之和[38]。人口和土地数据来源于《中国城市建设统计年鉴》,GDP数据来源于《中国城市统计年鉴》。由于数据缺失,样本城市不包括重庆、东莞、儋州、中山、三沙、那曲6个地级市。本文实证研究不包括港澳台城市。
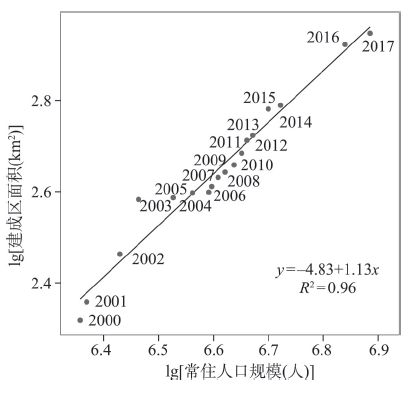
2017年中国291个地级市GDP和建成区面积与常住人口规模的标度关系如图1所示。尽管各城市的地理文化、历史沿革、人口规模具有明显差异,但各城市GDP和建成区面积与城市人口规模在双对数坐标下高度线性相关(R2 > 0.84),具有显著的标度关系,体现了复杂城市系统背后的简单规律。城市标度律的标度因子区分了不同城市指标与人口规模的标度范式(Scaling Regime)。GDP关于常住人口的标度因子为1.17,说明从小城市到大城市,GDP增加速度快于人口增加速度,体现了规模报酬递增的效应;而建成区面积关于常住人口的标度因子为0.87,说明在城市系统中,从小城市到大城市,城市土地增加慢于人口增加,体现了规模经济效应(图1)。
图1
 新窗口打开|下载原图ZIP|生成PPT
图12017年中国291个地级市GDP和建成区面积与常住人口的标度关系
Fig. 1Scaling laws between GDP (built-up area) and urban population of 291 Chinese prefecture-level cities in 2017
3.2 异速增长律
在城市研究领域,与城市标度律非常相近的另一个规律是异速增长律(Allometric Growth),函数形式也为幂函数[39]。异速增长最初是生物学领域指生物器官和个体随时间的不同步增长,例如在螃蟹的成长过程中,螯(钳子)的长度与其甲壳的长度呈幂函数关系[40];人类大脑相对于躯干的发育速度也是非线性关系[39]。城市地理学家在20世纪70年代或更早引入异速增长律研究了城市系统内建设用地面积和人口的相对增长关系[41]。虽然研究的是城市系统的标度律,但由于早期城市标度律的概念还未普及,研究者采用了异速增长的概念[41,42]。国内研究在探索城市系统标度律时也多采用了异速增长的概念[17-18, 39]。如果都是研究城市系统表现出的规律,采用城市标度律还是异速增长律的概念没有实质差异[43]。但考虑到生物学中异速增长律反映的是个体局部和整体随时间的相对演化关系,这非常容易让人们将反映城市系统规律的城市标度律引申到单个城市的发展预测中。例如,城市标度律指出与城市基础设施相关的城市指标与人口规模的标度因子为0.85左右,人们在解读0.85的含义时,很容易给出这样的推断:当一个城市人口规模增加1倍时,只需要增加85%的基础设施[7]。然而事实并非如此[44,45,46,47]。
以成都市为例,2000—2017年该市建成区面积关于常住人口规模的拟合结果如图2所示。结果显示成都市建成区面积关于人口规模的异速增长指数为1.13,大于1,说明当城市人口增加一倍时,建成区面积需要超过一倍的增量,而不是只需要增加85%。这与城市标度律的理论预期相悖,按照城市标度律的理论,建成区面积作为与基础设施相关的城市指标具有规模经济效应,其关于人口规模的标度因子应该小于1(图1b)。建成区面积关于人口规模的次线性标度关系是已有研究广泛证实的规律[5, 19, 42]。另一方面,在单个城市的时序发展中,已有研究普遍观察到土地扩张快于人口增长,也即土地城镇化快于人口城镇化[48,49,50]。因此,时序上多数城市的建成区面积与城市人口呈现超线性标度关系(标度因子大于1)[51,52]。建成区面积和城市人口在截面上和时序上相对增长关系的差异有力地说明了城市标度律和异速增长律的差异[44-45, 53-54],不能套用反映城市系统的城市标度律预测单个城市的未来发展[46]。
图2
 新窗口打开|下载原图ZIP|生成PPT
图22000—2017年成都建成区面积和常住人口的异速增长律
Fig. 2Allometric growth of built-up area and population in Chengdu from 2000 to 2017
4 规模修正指标及应用
4.1 规模修正指标
城市标度律是城市系统表现出的规律,在城市研究中有何具体应用是研究者关心的问题。传统做法上多采用人均指标衡量城市表现,例如人均GDP、人均专利数等,但这忽略了城市指标与人口规模的非线性标度关系。为消除城市人口规模的影响,Bettencourt等提出了规模修正指标(SAMI),其定义式如下[25]:式中:SAMIi为消除规模影响的城市i的某个指标(如GDP),其本质是城市指标关于人口规模拟合方程的残差,表示偏离其预期值的程度;Yi为城市i的某个指标的真实值;Y0Niβ为城市i的某个指标的估计值;Ni为城市i的常住人口规模;Y0和β为式(2)的拟合参数。
4.2 基于规模修正指标的中国城市排名
根据式(3)可以计算图1中各城市GDP和建成区面积的SAMI值。中国291个地级市2017年人均GDP和GDP规模修正指标的排序如图3a和图3b所示。人均GDP及其规模修正指标(SAMI)的排序均为降序排列,即排名越靠前,说明人均GDP越高,SAMI值越高,经济表现越好。2017年人均GDP排名前3的城市分别是广东佛山、江苏常州、山东东营,人均GDP最靠后的3个城市是吉林四平、黑龙江黑河、黑龙江伊春(图3a)。如果仅看两种排名的头部和尾部城市,排序的彼此差异并没有体现。图3a和图3b中还标记了4个一线城市的两种排名情况:在人均GDP的排序中,广州、深圳、北京、上海分别位列第24、第26、第53、第80位(图3a);而在考虑城市人口规模后,上述4个城市的排位均被拉低,分别位列第91、第95、第163、第219位(图3b)。图3c和图3d展示了人均建成区面积和建成区面积规模修正指标的排序。与人均建成区面积的排序相比,4个一线城市建成区面积规模修正指标的排序均有前移。图3
 新窗口打开|下载原图ZIP|生成PPT
图32017年中国291个地级市GDP和建成区面积的人均指标及其规模修正指标排序
Fig. 3Ranks of per capita indicators and scale-adjusted metropolitan indicators (SAMI) of GDP and built-up area of 291 Chinese prefecture-level cities in 2017
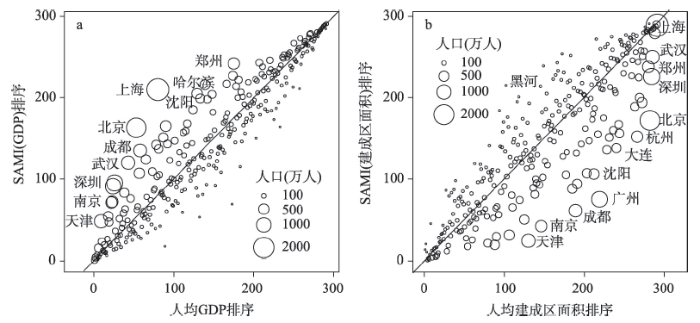
图4展示了人均指标和其规模修正指标(SAMI)排序的对比。图4中直线为1:1指示线,位于该线右下侧的城市,其SAMI值排序比人均指标排序靠前;而位于1:1指示线左上侧的城市,其SAMI值排序比人均指标排序靠后。图4a显示中国较大规模的城市基本都位于1:1指示线左上方,说明大城市的人均GDP排名靠前得益于它们自身的规模优势。这启示我们直接比较人均GDP,对中小城市是不公平的,应该控制城市人口规模后比较不同城市的经济表现。图4b显示较大规模城市基本都位于1:1指示线右下方,说明大城市关于建成区面积的规模经济效应不够理想。
图4
 新窗口打开|下载原图ZIP|生成PPT
图42017年中国291个地级市GDP和建成区面积的人均指标排序和其规模修正指标排序散点图
Fig. 4Scatter plots of ranks of per capita indicators and scale-adjusted metropolitan indicators (SAMI) of GDP and built-up area of 291 Chinese prefecture-level cities in 2017
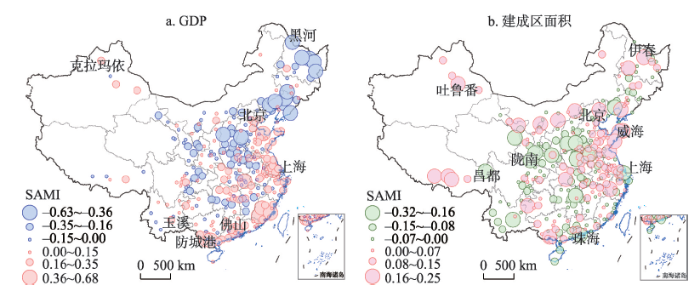
图5展示了中国291个地级市2017年GDP和建成区面积规模修正指标(SAMI)的空间分布,二者均具有明显的空间分异规律。GDP规模修正指标为正值的城市主要位于中国东部和南部沿海地区、长江中游和新疆(图5a),这些城市位于图1a中回归直线的上方,说明在同等规模城市中,这些城市的经济产出更多,经济运行更有效率。GDP规模修正指标为负值的城市主要位于东北、中原和西北等内陆地区(图5a),这些城市与同等规模城市相比,经济运行效率相对较低。建成区面积规模修正指标为正值的城市主要位于华东经济发达地区或内蒙古、新疆、西藏等地广人稀地区(图5b),这些城市在同等规模城市中占用了更多的建设用地。建成区面积规模修正指标为负值的城市主要位于华北平原等人口稠密或云贵高原等土地资源有限的地区(图5b),这些城市土地资源紧张,比同等规模城市占用了更少的建设用地。规模修正指标为城市评价研究提供了新视野和新思路。
图5
 新窗口打开|下载原图ZIP|生成PPT
图52017年中国291个地级市GDP和建成区面积规模修正指标空间分布
Fig. 5Spatial distributions of scale-adjusted metropolitan indicators (SAMI) of GDP and built-up area of 291 Chinese prefecture-level cities in 2017
5 结论与讨论
城市标度律是新城市科学的重要内容之一,其反映了城市系统中城市指标与人口规模的缩放关系,包括超线性、次线性和线性3种标度律范式。本文首先总结了城市标度律的研究进展,包括城市标度律的验证、解释、应用和质疑4个方面,在此基础上重点论述了城市标度律和异速增长律的本质差异,介绍并展示了基于城市标度律理论的规模修正指标在城市排序及评价中的应用。主要结论和观点如下:(1)城市标度律和异速增长律明显不同。城市标度律是同一时间城市系统表现出来的规律,反映了城市系统在相互作用下协同演化的系统特性。异速增长律是指系统局部和整体(局部)随时间的演化关系,强调城市个体的时序发展规律。城市个体的时序发展是自然地理、社会经济要素和城市系统内相互联系共同作用的结果。虽然城市标度律和异速增长律均为幂函数关系,但二者分别刻画了同一时点城市体系和单个城市时序发展的不同规律。单个城市的时序发展不遵循城市系统表现出的标度律。本文呼吁未来研究中需要区分城市系统标度律和单个城市时序发展的异速增长律。
(2)规模修正指标在城市排序和评价中具有重要应用。传统基于人均指标的城市排序和评价忽略了城市指标与人口规模的非线性标度关系,例如大城市的人均GDP排名靠前得益于它们自身的规模优势。基于城市标度律理论的规模修正指标(SAMI)消除了城市规模的影响,可以更客观地比较城市表现。实例分析显示中国经济产出效率较高的城市主要位于东南沿海、长江中游和新疆,而东北和中原地区城市的经济产出效率较低。
城市标度律是一个新兴的研究领域,随着复杂性科学、网络科学等交叉学科的发展以及城市大数据的不断涌现,以下研究方向未来值得关注:① 城市标度律的机制解释。城市标度律形成机制是本领域的关键科学问题,目前尚没有形成像生命系统标度律一样的完美解释,这或许正是城市研究者的机会。② 城市系统动态演化模型。城市标度律和异速增长律有着明显区别,但也存在联系[44,45,46]。需要发展城市系统动态演化模型,研究城市标度律和单个城市时序发展的内在联系。③ 城市内部标度律。城市本身也是一个复杂系统,城市内部可划分为多个单元,未来可以探索城市内部单元之间是否也存在标度律[47, 55]。近年来涌现的多源时空大数据为城市内部标度律研究提供了可能[56]。
参考文献 原文顺序
文献年度倒序
文中引用次数倒序
被引期刊影响因子
[本文引用: 1]
[本文引用: 1]
[本文引用: 1]
URLPMID:30286102 [本文引用: 3]

During the last years, the new science of cities has been established as a fertile quantitative approach to systematically understand the urban phenomena. One of its main pillars is the proposition that urban systems display universal scaling behavior regarding socioeconomic, infrastructural and individual basic services variables. This paper discusses the extension of the universality proposition by testing it against a broad range of urban metrics in a developing country urban system. We present an exploration of the scaling exponents for over 60 variables for the Brazilian urban system. Estimating those exponents is challenging from the technical point of view because the Brazilian municipalities' definition follows local political criteria and does not regard characteristics of the landscape, density, and basic utilities. As Brazilian municipalities can deviate significantly from urban settlements, urban-like municipalities were selected based on a systematic density cut-off procedure and the scaling exponents were estimated for this new subset of municipalities. To validate our findings we compared the results for overlaying variables with other studies based on alternative methods. It was found that the analyzed socioeconomic variables follow a superlinear scaling relationship with the population size, and most of the infrastructure and individual basic services variables follow expected sublinear and linear scaling, respectively. However, some infrastructural and individual basic services variables deviated from their expected regimes, challenging the universality hypothesis of urban scaling. We propose that these deviations are a product of top-down decisions/policies. Our analysis spreads over a time-range of 10 years, what is not enough to draw conclusive observations, nevertheless we found hints that the scaling exponent of these variables are evolving towards the expected scaling regime, indicating that the deviations might be temporally constrained and that the urban systems might eventually reach the expected scaling regime.
[本文引用: 4]
URLPMID:17438298 [本文引用: 8]
URLPMID:20962823 [本文引用: 3]
[本文引用: 4]
[本文引用: 1]
[本文引用: 1]
[本文引用: 1]
[本文引用: 1]
[本文引用: 1]
[本文引用: 1]
URLPMID:26601129 [本文引用: 1]
[本文引用: 1]
[本文引用: 2]
[本文引用: 2]
[本文引用: 2]
[本文引用: 2]
[本文引用: 3]
[本文引用: 3]
[本文引用: 1]
[本文引用: 1]
[本文引用: 1]
URLPMID:25924057
[本文引用: 1]
URLPMID:21085659 [本文引用: 7]
[本文引用: 1]
[本文引用: 1]
URLPMID:23940525 [本文引用: 1]
URLPMID:23544042 [本文引用: 1]
[本文引用: 1]
[本文引用: 1]
[本文引用: 1]
[本文引用: 1]
URLPMID:27493764 [本文引用: 1]
[本文引用: 1]
[本文引用: 1]
[本文引用: 1]
[本文引用: 1]
[本文引用: 3]
[本文引用: 3]
URL [本文引用: 1]
[本文引用: 2]
URLPMID:12315637 [本文引用: 2]
[本文引用: 1]
[本文引用: 3]
[本文引用: 3]
[本文引用: 3]
[本文引用: 2]
[本文引用: 1]
[本文引用: 1]
[本文引用: 1]
[本文引用: 1]
[本文引用: 1]
[本文引用: 1]
[本文引用: 1]
[本文引用: 1]
[本文引用: 1]
DOI:10.1073/pnas.1906258116URLPMID:31235579 [本文引用: 1]
Urban scaling research finds that agglomeration effects-the higher-than-expected outputs of larger cities-follow robust
DOI:10.1073/pnas.1718690115URLPMID:29463762 [本文引用: 1]
Scaling has been proposed as a powerful tool to analyze the properties of complex systems and in particular for cities where it describes how various properties change with population. The empirical study of scaling on a wide range of urban datasets displays apparent nonlinear behaviors whose statistical validity and meaning were recently the focus of many debates. We discuss here another aspect, which is the implication of such scaling forms on individual cities and how they can be used for predicting the behavior of a city when its population changes. We illustrate this discussion in the case of delay due to traffic congestion with a dataset of 101 US cities in the years 1982-2014. We show that the scaling form obtained by agglomerating all of the available data for different cities and for different years does display a nonlinear behavior, but which appears to be unrelated to the dynamics of individual cities when their population grows. In other words, the congestion-induced delay in a given city does not depend on its population only, but also on its previous history. This strong path dependency prohibits the existence of a simple scaling form valid for all cities and shows that we cannot always agglomerate the data for many different systems. More generally, these results also challenge the use of transversal data for understanding longitudinal series for cities.
DOI:10.1038/s41598-020-78135-2URLPMID:33273607 [本文引用: 1]
Understanding quantitative relationships between urban elements is crucial for a wide range of applications. The observation at the macroscopic level demonstrates that the aggregated urban quantities (e.g., gross domestic product) scale systematically with population sizes across cities, also known as urban scaling laws. However, at the mesoscopic level, we lack an understanding of whether the simple scaling relationship holds within cities, which is a fundamental question regarding the spatial origin of scaling in urban systems. Here, by analyzing four extensive datasets covering millions of mobile phone users and urban facilities, we investigate the scaling phenomena within cities. We find that the mesoscopic infrastructure volume and socioeconomic activity scale sub- and super-linearly with the active population, respectively. For a same scaling phenomenon, however, the exponents vary in cities of similar population sizes. To explain these empirical observations, we propose a conceptual framework by considering the heterogeneous distributions of population and facilities, and the spatial interactions between them. Analytical and numerical results suggest that, despite the large number of complexities that influence urban activities, the simple interaction rules can effectively explain the observed regularity and heterogeneity in scaling behaviors within cities.
[本文引用: 1]
[本文引用: 1]
