2.
Theoretical analysis of urbanization and eco-environment coupling coil and coupler control
FANG Chuanglin1,2, CUI Xuegang1,2, LIANG Longwu1,21. 2.
收稿日期:2019-01-5修回日期:2019-11-28网络出版日期:2019-12-25
| 基金资助: |
Received:2019-01-5Revised:2019-11-28Online:2019-12-25
| Fund supported: |
作者简介 About authors
方创琳(1966-),男,甘肃庆阳人,研究员,中国地理学会会员(S110001715M),研究方向为城市地理、城市群发展与城镇化的资源环境效应等E-mail:fangcl@igsnrr.ac.cn。

摘要
关键词:
Abstract
Keywords:
PDF (8811KB)元数据多维度评价相关文章导出EndNote|Ris|Bibtex收藏本文
本文引用格式
方创琳, 崔学刚, 梁龙武. 城镇化与生态环境耦合圈理论及耦合器调控. 地理学报[J], 2019, 74(12): 2529-2546 doi:10.11821/dlxb201912008
FANG Chuanglin.
城镇化与生态环境之间客观上存在着十分复杂的胁迫关系,如何协调二者的关系问题一致是世界性的战略问题和世界性难题。为了解决这一科学难题,从2005年起,一系列国际科学组织和科学研究计划开展了卓有成效的研究。2005年“国际全球变化人文因素影响计划”(IHDP)制定了“城市化与全球环境变化”科学研究计划,并将其作为全球变化研究核心项目,提出通过时空尺度交叉、时空尺度比较以及公众与政策制定者之间的交流等方式加强城市化与全球环境变化之间耦合关系的研究[1]。2005年联合国出版的千年生态系统评估(MA)报告《生态系统与人类福祉:当前与未来趋势》认为城市人口与经济的发展将对全球范围内的生态系统产生更大压力[2]。2012年发布的未来地球计划(FE)主题集中在认识全球环境变化与人类福祉和发展之间的联系,其中城镇化作为地球表层最剧烈的人类活动过程的阈值、风险、临界点是研究的前沿领域[3]。2014年11月国际科学联盟发布了“未来地球2025愿景(Future Earth 2025 Vision)”,提出在“未来地球”研究计划中须重点加强8个领域的相关研究,其中将“城市化建设”列为重要研究领域[4,5]。2017年10月26日,两个世界领先的国际科学组织——国际科学理事会(ICSU)与国际社会科学理事会(ISSC)在中国台北召开大会,超过90%的参会会员投票同意两个科学组织合并成立新的国际科学理事会(ISC),新组织将促进科学跨学科、跨地域发展①(① 国际科学理事会(ICSU)与国际社会科学理事会(ISSC)会员投票赞成双方合并,www.wcsl.org.cn/ind...-018-7-28.)。所有这些国际重大科学研究计划的设立和实施意味着把自然科学和社会科学的耦合推向新的发展阶段。可见,开展城镇化与生态环境耦合理论与方法的研究,是未来10年地球系统科学研究的前沿领域。然而,学术界目前研究的重点主要侧重于城市发展的应用研究和城市内部生态环境及城市生态系统稳定性的评价,很少从耦合角度,将城镇化过程和与生态环境响应过程有机耦合起来进行规律性的基础研究。本文将从城镇化和与生态环境交互作用的耦合性出发,重点揭示二者交互耦合关系与交互耦合方式,创建城镇化和与生态环境耦合圈理论,构建交互耦合塔和耦合图谱,研制耦合器调控方法。
1 耦合性、耦合度及耦合塔
城镇化和生态环境交互耦合过程是一个涉及社会、经济、自然的复杂巨系统,针对这一巨系统,不同学科背景的****提出了许多耦合分析框架[6],主要包括人类与自然耦合系统[7]、远程耦合(Telecoupling)[8]、可持续生计框架[9]、人口发展环境研究框架等[10,11]、社会—生态系统[12]、地球边界 [13]、DPSIR框架[14]、STIRPAT框架、能值分析框架等。21世纪以来,Gunderson提出了著名的跨尺度系统自适应嵌套模型[15],Thomas阐述了人与自然跨边界耦合特征[16];Carl论述了研究社会生态系统的弹性方法[17];Liu在远程耦合基础上进一步提出元耦合框架(Metacoupling)[18]。这些耦合分析框架给我们以启示,城镇化与生态环境之间的关系实质上也表现为人与自然之间的关系,也存在着耦合性,这种耦合性可用耦合度、耦合常数和耦合剂等体现;耦合性有强弱之分,按照强弱可将耦合性分为低度耦合、较低耦合、中度耦合、较高耦合、高度耦合和完全耦合6种类型,分别对应随性耦合、间接耦合、松散耦合、协同耦合、紧密耦合和控制耦合,进而形成城镇化与生态环境耦合塔。1.1 耦合性
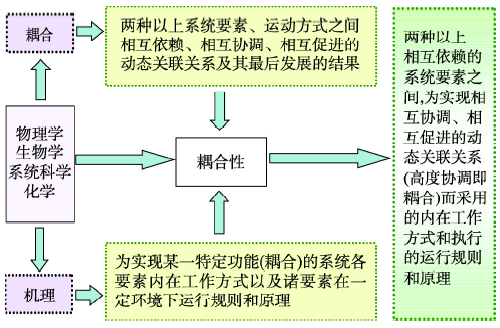
耦合本是物理学、生物学、系统科学和化学中常用的一个概念,是指两种以上系统、运动方式之间相互依赖、相互协调、相互促进的动态关联关系及其最后发展的结果。两种以上相互依赖的系统之间,为实现相互协调、相互促进的动态关联关系(高度协调即耦合)而采用的内在工作方式和执行的运行规则和原理(技术路径),即耦合性(图1)。人类与环境之间的能量传递、物质交换,是以地球表层为依托、以大气圈、水圈、岩石圈、生物圈和智能圈为载体相互耦合的过程。耦合性可用耦合常数、耦合剂和耦合度等体现。其中,耦合常数是两个系统之间经常性处于高度协同状态所遵循的临界参数,高于或低于这一参数两个系统之间将打破耦合态,进入不协同的非耦合状态。在一定的时间和空间尺度内,耦合常数是一个恒定的量,但耦合常数是会随着时间和空间的变化而变化的,变化的目的是在新的时空尺度下寻求新的耦合常数。耦合剂,也叫耦合介质,是体现系统之间为实现某种程度的耦合所依托的物质、能量、信息等介质的交换过程。没有系统之间的物质、能量、信息传输和交换,系统将无法完成耦合过程。图1
 新窗口打开|下载原图ZIP|生成PPT
图1耦合性的理论解释示意图
Fig. 1Theoretical interpretation of coupling
1.2 耦合度
耦合度是对系统间关联程度和协同程度的度量,系统间联系越多,耦合度越大,说明系统间的联系程度及依赖程度越密切,其耦合性越强。事实上,城镇化与生态环境交互胁迫与耦合的变化过程是一种非线性过程[19,20],其耦合圈变化过程的一般函数为:式中:x、y为两系统的元素;a、b为各元素的权重;
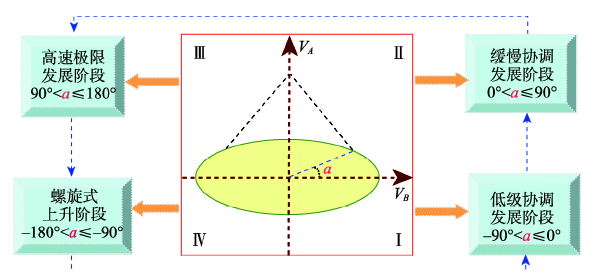
式中:A、B为受近远程要素影响下城镇化圈与生态环境圈的演化状态;VA、VB分别为两个圈在受近远程要素影响下的演化速度。由生态环境圈与城镇化圈构成的耦合系统演化速度V可看作是VA与VB的函数[23],则:V = f(VA, VB),由于V的变化由VA与VB引起,可把VA与VB的演化轨迹投影在一个二维平面(VA, VB)中构成一个椭圆(图2)。由图2可知,V与VB的夹角a满足tga = VA/VB,a称作城镇化圈与生态环境圈耦合度。理论上在一个演化周期内,城镇化圈与生态环境圈形成的耦合系统将经历低级协调发展(I,-90°< a ≤ 0°)、缓慢协调发展(II,0°< a ≤90°)、高速极限发展(III,90°< a ≤ 180°)、螺旋式上升(IV,-180° < a ≤ -90°)4个发展阶段[24]。
图2
 新窗口打开|下载原图ZIP|生成PPT
图2城镇化与生态环境耦合度测度及耦合圈的四大象限图
Fig. 2Measurement of urbanization and eco-environment coupling degree and four quadrants of the coupling coil
1.3 耦合塔
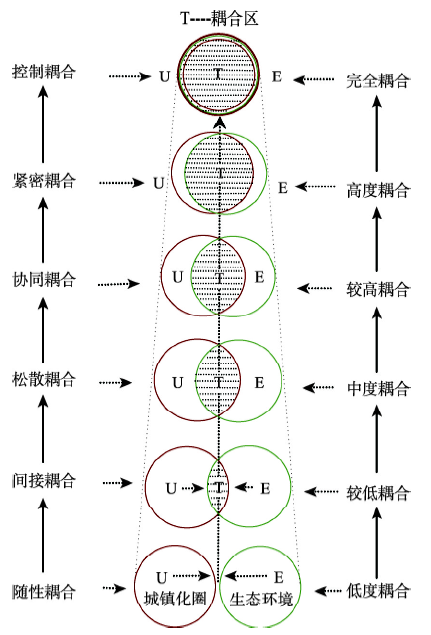
依据城镇化圈与生态环境圈耦合度大小,可将耦合性划分为随性耦合、间接耦合、松散耦合、协同耦合、紧密耦合和控制耦合6种类型,构成城镇化与生态环境耦合塔(图3、表1)。图3
 新窗口打开|下载原图ZIP|生成PPT
图3城镇化与生态环境耦合塔示意图
Fig. 3Urbanization and eco-environment coupling tower
Tab. 1
表1
表1耦合性的强弱类型与耦合塔结构
Tab. 1
| 耦合特性 | 独立性 | 关联关系 | 耦合性强弱类型 | 耦合度(%) | 耦合路径 | 在耦合塔中位置 |
|---|---|---|---|---|---|---|
| 随性耦合 | 最强 | 最弱 | 低度耦合 | 0~10 | 自适应耦合 | 最低端 |
| 简接耦合 | 较强 | 较弱 | 较低耦合 | 10~30 | 自适应组织 | 低端偏上 |
| 松散耦合 | 一般 | 一般 | 中度耦合 | 30~50 | 自适应调控 | 中段 |
| 协同耦合 | 较低 | 较大 | 较高耦合 | 50~70 | 调控 | 中段偏上 |
| 紧密耦合 | 很差 | 很大 | 高度耦合 | 70~90 | 调控 | 顶端偏下 |
| 控制耦合 | 最差 | 最大 | 完全耦合 | 90~100 | 管控 | 顶端 |
新窗口打开|下载CSV
1.3.1 随性耦合 是指城镇化系统与生态环境系统两大系统之间没有关系,或者两大系统相互独立不相互干扰,两大系统之间可随意协同也可不协同,但不影响系统正常功能的发挥,这就是随性耦合。城镇化系统与生态环境系统之间独立性最强,耦合程度最低,关联关系最弱或者没有关联关系,耦合路径一般采用自适应途径,属于低度耦合类型,处于耦合塔的最低端。
1.3.2 间接耦合 是指城镇化系统与生态环境系统两大系统之间没有直接关系,或者两大系统相互干扰的程度很低,两大系统之间关联程度较低,只是通过间接关系而非直接关系发生作用,这就是间接耦合。间接耦合的城镇化系统与生态环境系统之间独立性较强,耦合程度较低,一般在10%~30%之间,耦合路径一般采用自适应组织途径,属于较低耦合类型,处于耦合塔的最低端偏上位置。
1.3.3 松散耦合 是指城镇化系统与生态环境系统两大系统中,如果一个系统访问另一个系统时,彼此之间是通过数据参数(不是控制参数、公共数据结构或外部变量)来交换输入、输出信息的,则称这种耦合叫松散耦合。松散耦合的城镇化系统与生态环境系统之间独立性一般,具有中等耦合程度,一般在30%~50%之间,耦合路径一般采用自适应调控途径,属于中度耦合类型,处于耦合塔的中段位置。
1.3.4 协同耦合 是指城镇化系统与生态环境系统两大系统中,如果一个系统的运行需要另一个系统协同合作才能正常发挥作用时,称之为协同耦合。协同耦合的城镇化系统与生态环境系统之间独立性较差,具有较密切的关联关系和较高的耦合程度,一般在50%~70%之间,耦合路径一般采用调控途径,属于较高度耦合类型,处于耦合塔的中段偏上位置。
1.3.5 紧密耦合 是指城镇化系统与生态环境系统中,如果一个系统的运行必须高度依赖另一个系统的高度配合才能正常发挥作用时,称之为紧密耦合。紧密耦合的城镇化系统与生态环境系统之间独立性很差,具有高度密切的关联关系和很高的耦合程度,一般在70%~90%之间,耦合路径一般采用调控途径,属于高度耦合类型,处于耦合塔的顶端偏下位置。
1.3.6 控制耦合 是指城镇化系统与生态环境系统中,如果一个系统内部的某控制参数逻辑关系发生变化时,就会牵一发而动全身地影响到该系统本身和另外一个系统的正常运行时,称之为控制耦合。控制耦合的城镇化系统与生态环境系统之间独立性最差,具有完全密切的关联关系和完全的耦合程度,一般在90%~100%之间,耦合路径一般采用调控途径,属于完全耦合类型,处于耦合塔的顶端位置。
2 耦合关系与交互方式
城镇化与生态环境的非线性交互作用客观上存在着主控要素,其中既包括水、土地、能源、生态、污染、气候变化等6种自然主控要素,也包括人口、经济、社会、全球化、交通、政策等6种人文主控要素。自然主控要素和人文主控要素之间及内部存在着“一对一”“一对多”和“多对多”3种耦合方式[25]。自然主控要素与人文主控要素的复合叠加和交互影响,决定着城镇化与生态环境交互耦合的基本方向和路径[26,27]。正是通过城镇化与生态环境彼此之间的交互胁迫与交互促进过程,才驱使着资源配置向着不断优化的方向、经济结构向着不断升级的方向、城镇化与生态环境的关系向着高度协调、高度有序发展的方向不断演进[28],并最终推动整个城镇化与生态环境复合系统从低级协调共生向高级协调耦合的形态演化[29]。2.1 耦合关系的表现形式
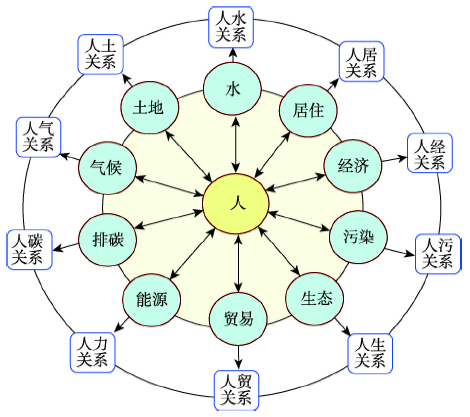
在城镇化与生态环境交互作用过程中,以人为本的城镇化和以地为本的生态环境之间的要素相互作用,形成以主控要素为主线的人地耦合10大要素关系(图4),具体包括:人水关系、人土关系、人碳关系、人经关系、人气关系、人力关系、人居关系、人生关系、人贸关系、人污关系等单要素双向胁迫与相互促进的动态演变轨迹关系。图4
 新窗口打开|下载原图ZIP|生成PPT
图4城镇化与生态环境之间主控要素耦合关系示意图
Fig. 4Coupling relationship of main controlling factors between urbanization and eco-environment
2.1.1 人水耦合关系 人水关系主要以水为主控要素,重点揭示人口增长、城镇化与水资源之间的交互耦合状态,构建人水关系诊断模型与方法,分析水资源约束下的城镇化过程、城镇化发展速度、规模、质量及其调控路径。
2.1.2 人土耦合关系 人土关系主要以土地为主控要素,重点揭示人口增长、城镇化与土地资源之间的交互耦合状态,构建城镇化与土地集约利用交互耦合诊断模型与方法,分析土地资源约束下的城镇化过程、城镇化发展速度、规模、质量及其调控路径。
2.1.3 人力耦合关系 人力关系主要以能源为主控要素,重点揭示人口增长、城镇化与能源之间的交互耦合状态,构建城镇化与能源利用交互耦合诊断模型与方法,分析能源资源约束下的城镇化过程、城镇化发展速度、规模、质量及其调控路径。
2.1.4 人经耦合关系 人经关系主要以经济为主控要素,重点揭示人口增长、城镇化与经济发展、结构调整之间的交互耦合状态,构建城镇化与经济发展交互耦合诊断模型与方法,分析经济增长背景下的城镇化过程、城镇化发展速度、规模、质量及其调控路径。
2.1.5 人贸耦合关系 人贸关系主要以全球化和贸易为主控要素,重点揭示人口增长、城镇化与全球化及贸易之间的交互耦合状态,构建城镇化与全球化及贸易交互耦合诊断模型与方法,分析全球化背景下的贸易对城镇化过程、城镇化发展速度、规模、质量的影响及其调控路径。
2.1.6 人碳耦合关系 人碳关系主要以碳排放为主控要素,重点揭示人口增长、城镇化与碳排放之间的交互耦合状态,构建城镇化与碳排放交互耦合诊断模型与方法,分析碳排放对城镇化过程、城镇化发展速度、规模、质量的影响及其调控路径。
2.1.7 人气耦合关系 人气关系主要以气候变化为主控要素,重点揭示城镇化与气候变化之间的交互耦合状态,构建城镇化与气候变化耦合模型与方法,分析气候变化对城镇化过程、城镇化发展速度、规模、质量的影响及其调控路径。
2.1.8 人居耦合关系 人居关系主要以人居环境变化为主控要素,重点揭示城镇化与人居环境之间的交互耦合状态,构建城镇化与人居环境变化耦合模型与方法,分析人居环境变化与城镇化过程、城镇化发展速度、规模、质量的关系及其调控路径。
2.1.9 人生耦合关系 人生关系主要以生态环境及生物多样性变化为主控要素,重点揭示城镇化与生态环境及生物多样性变化之间的交互耦合状态,构建城镇化与生态环境变化耦合模型与方法、城镇化与生物多样性变化耦合模型与方法,分析生态环境及生物多样性变化与城镇化过程、城镇化发展速度、规模、质量的关系及其调控路径。
2.1.10 人污耦合关系 人污关系主要以环境污染为主控要素,重点揭示城镇化与环境污染之间的交互耦合状态,构建城镇化与环境污染耦合模型与方法,分析环境污染变化与城镇化过程、城镇化发展速度、规模、质量的相互胁迫关系及其调控路径。
2.2 耦合关系的交互方式
城镇化与生态环境主控要素之间客观上存在着“一对一”“一对多”和“多对多”等3种交互作用与耦合方式,3种交互方式存在着由单要素到多要素、由简单到复杂、由有解、到有限有解到无限无解的变动规律[30]。2.2.1 “一对一”的单要素耦合 “一对一”的单要素交互方式是指城镇化的人文主控要素与生态环境的自然主控要素之间及其内部存在的“一对一”交互影响过程,例如自然主控要素内部水与土之间、土与生态之间、水与气候变化之间、人文要素内部的人口与经济之间、经济与贸易之间、经济与社会之间、自然主控要素与人文主控要素中的人与水之间,人与地之间,经济与环境之间、生态与经济之间等存在的一一对应的交互胁迫、交互促进过程。这是一种城镇化系统单要素与生态环境系统单要素之间交互胁迫的近远程耦合方式,也是最简单的一种交互耦合方式。通过双向分析测算第i个城镇化系统主控要素相对于第j个生态环境主控要素的交互耦合系数,定量表达城镇化系统单要素与生态环境系统单要素交互胁迫的耦合方程和耦合曲线,揭示单要素相互作用机理及强度。
2.2.2 “一对多”的多要素耦合 “一对多”的多要素交互方式是指城镇化的人文主控要素与生态环境的自然主控要素之间及其内部存在的“一对多”交互影响过程,是一个要素对两个以上要素交互作用的过程。例如自然主控要素内部水与土、能源、生态之间、土与生态、环境之间、人文要素内部的人口与经济、社会之间,自然主控要素与人文主控要素中的人与水、土、经济、环境之间等等存在的单要素对多要素的交互胁迫、交互促进过程。这是一种城镇化单要素或生态环境单要素与城镇化多要素或生态环境多要素之间存在的“一对多”的多要素交互胁迫的近远程耦合方式,也是较为复杂的一种交互耦合方式。通过多向分析测算第i个城镇化系统主控要素相对于第j个生态环境主控要素的交互耦合系数,定量表达城镇化系统与生态环境系统中单要素对多要素的交互胁迫耦合方程和耦合曲线,揭示单要素与多要素相互作用机理及强度。
2.2.3 “多对多”的多要素耦合 “多对多”的多要素交互方式是指城镇化的第i个人文主控要素与生态环境的第j个自然主控要素之间及其内部存在的“多对多”的交互影响过程,是两个以上的主控要素之间交互作用的过程。例如自然主控要素内部水、土、能源、生态、环境、气候变化之间、人文要素内部的人口、经济、社会、创新、全球化之间,以及自然主控要素与人文主控要素中的水、土、能源、生态、环境、气候变化、人口、经济、社会之间等多要素之间存在的多要素对多要素的交互胁迫、交互促进过程。这是一种城镇化多要素或生态环境多要素与城镇化多要素或生态环境多要素之间存在的“多对多”的交互胁迫的近远程耦合方式,也是最复杂、甚至无解的一种交互耦合方式。可从区际尺度、区内尺度和尺度耦合的角度,通过多向分析测算第i个城镇化系统主控要素相对于第j个生态环境主控要素的交互耦合系数,构建城镇化系统与生态环境两大系统的耦合关系方程,定量表达城镇化系统与生态环境系统中多要素对多要素的交互胁迫耦合曲线,揭示多要素与多要素相互作用机理及强度,为实现和谐的人水关系、人地关系、人力关系、人气关系和人碳关系调控等提供定量的科学依据。
3 耦合圈理论及图谱
城镇化过程与生态环境之间客观上存在着极其复杂的交互胁迫关系,但采用什么样的技术路径能够找到城镇化与生态环境交互胁迫的最佳耦合点,使城镇化圈与生态环境圈之间保持“最佳距离”,使城镇化与生态环境之间保持经常性的动态平衡状态,这是我们一直在苦苦寻找的问题,成为未来进一步开展理论研究的重要方向。城镇化与生态环境耦合圈理论以耦合论、整合论、共合论和圈合论作为理论基础,以笔者于1999年提出的区域持续圈与发展圈相互作用理论[31]、于2007年提出的城市化与生态环境交互耦合理论为理论支撑[32],其中耦合论和整合论是第六次科技革命的十大候选标志之一[33]。3.1 城镇化与生态环境耦合圈理论的基本观点
城镇化与生态环境耦合圈理论是在城镇化与生态环境交互耦合理论的基础上,将原来的三圈独立整合成两圈合一,将原来的外部干预调控改为内部自组织融合,将原来的单线图谱改为多线图谱之后,所形成的新理论和新图谱。城镇化与生态环境耦合圈理论的基本观点为,城镇化圈与生态环境圈之间客观上存在着非线性近远程耦合关系;这种非线性耦合关系可用耦合度量化,根据耦合度大小可形成耦合塔;理论上城镇化与生态环境耦合圈存在着直线、指数曲线、对数曲线、双指数曲线和“S”型曲线等多线耦合图谱,其中“S”型曲线耦合图谱是最佳图谱,代表着多种图谱中体现相互作用的最佳耦合状态;技术上耦合圈可通过研发耦合器进行调控,使城镇化圈与生态环境圈始终保持最佳的动态有序状态;随时间的推移,城镇化与生态环境耦合度呈现波浪式爬升规律,可称其为耦合爬升律或者耦合梯,每一次耦合就会爬上一个新的高度,推进城市可持续发展,每一次胁迫都会导致城市可持续发展能力下降。3.2 城镇化与生态环境耦合圈的理论图谱
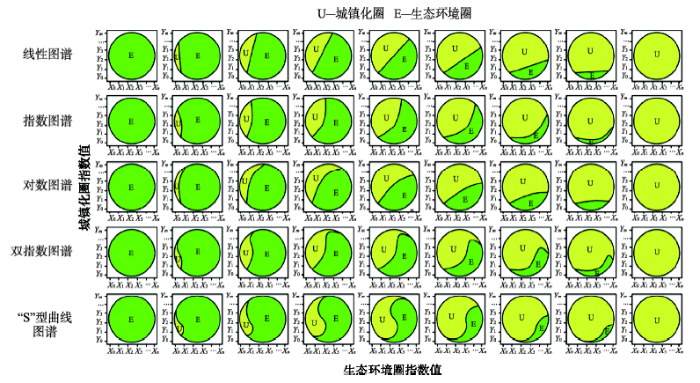
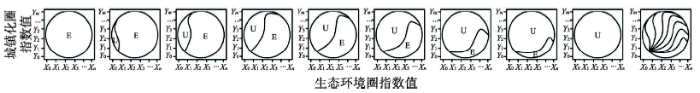
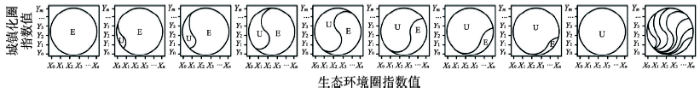
根据城镇化与生态环境耦合圈理论,为了反映不同类型城市城镇化发展阶段和模式,这里提出了城镇化与生态环境耦合圈的直线图谱、指数曲线图谱、对数曲线图谱、双指数曲线图谱和“S”型曲线图谱共5种类型的耦合图谱,每一种图谱根据其演替过程,按每旋转10°为一个图谱计算,则可分为9种图谱(图5),合计共45种耦合图谱。不同图谱存在着不同的变化规律,对应着不同类型的城市发展阶段、发展特征和发展模式。图5
 新窗口打开|下载原图ZIP|生成PPT
图5城镇化圈与生态环境圈耦合的45种彩色图谱
Fig. 545 kinds of coupled graphs of urbanization and eco-environment coupling coil
3.2.1 城镇化与生态环境的线性耦合图谱 线性耦合图谱是指在城镇化与生态环境耦合圈演变过程中,城镇化圈与生态环境圈耦合边界呈现线性函数形式(图6),其表达式为:
式中:y0、x0分别代表城镇化圈和生态环境圈对耦合圈的初始贡献;y、x分别代表城镇化圈和生态环境圈对耦合圈的末期贡献;k代表城镇化圈和生态环境圈相互作用的系数,随着系数的变化,城镇化圈U和生态环境圈E对耦合圈的贡献彼此消长,由生态环境圈占主导(贡献占100%)逐渐演变为生态环境圈和城镇化圈的贡献各占50%,再演化为城镇化圈占主导(贡献占100%)。这是一种理想的城镇化与生态环境演变线性耦合模式,城镇化的驱动力与生态环境圈的制动力匀速施力,结果形成以线性函数直线为耦合边界的城镇化与生态环境耦合圈。由于城镇化圈与生态环境圈是两个非常复杂的圈层体系,实际生活中不存在直线形式的城镇化与生态环境耦合圈。
图6
 新窗口打开|下载原图ZIP|生成PPT
图6城镇化圈与生态环境圈耦合的直线图谱
Fig. 6Linear graph of urbanization and eco-environment coupling coil
3.2.2 城镇化与生态环境的指数曲线耦合图谱 指数曲线耦合图谱是指在城镇化与生态环境耦合圈演变过程中,城镇化圈与生态环境圈耦合边界呈现指数函数形式(图7),其表达式为:
式中:y0、x0分别代表城镇化圈和生态环境圈对耦合圈的初始贡献;y、x分别代表城镇化圈和生态环境圈对耦合圈的末期贡献;k代表城镇化圈和生态环境圈相互作用系数,随着相互作用系数的变化,城镇化圈U和生态环境圈E对耦合圈的贡献彼此消长,由生态环境圈占主导(贡献占100%)逐渐演变为生态环境圈和城镇化圈的贡献各占50%,再演化为城镇化圈占主导(贡献占100%)。这是一种在现实中客观存在的城镇化与生态环境演变指数耦合模式,表现为城镇化和工业化加速发展,城镇化圈的驱动力加速施力,城镇化圈的驱动力远远超过生态环境圈的制动力,对生态环境造成了严重破坏,结果形成以指数函数曲线为耦合边界的城镇化与生态环境耦合圈。中国在城镇化中期的快速成长阶段,在某些城市和地区出现了类似指数曲线图谱。
图7
 新窗口打开|下载原图ZIP|生成PPT
图7城镇化圈与生态环境圈耦合的指数曲线图谱
Fig. 7Index curve graph of urbanization and eco-environment coupling coil
3.2.3 城镇化与生态环境的对数曲线耦合图谱 对数曲线耦合图谱是指在城镇化与生态环境耦合圈演变过程中,城镇化圈与生态环境圈耦合边界呈现对数函数形式(图8),其表达式为:
式中:y0、x0分别代表城镇化圈和生态环境圈对耦合圈的初始贡献;y、x分别代表城镇化圈和生态环境圈对耦合圈的末期贡献;k代表城镇化圈和生态环境圈相互作用的系数,随着相互作用系数的变化,城镇化圈U和生态环境圈E对耦合圈的贡献彼此消长,由生态环境圈占主导(贡献占100%)逐渐演变为生态环境圈和城镇化圈的贡献各占50%,再演化为城镇化圈占主导(贡献占100%)。这是一种在现实中客观存在的城镇化与生态环境演变对数耦合模式,表现为城镇化初期加速发展,城镇化圈的驱动力加速施力,中后期城镇化圈驱动力逐渐减弱,但远远超过生态环境圈的制动力,结果形成以对数函数曲线为耦合边界的城镇化与生态环境耦合圈。
图8
 新窗口打开|下载原图ZIP|生成PPT
图8城镇化圈与生态环境圈耦合的对数曲线图谱
Fig. 8Logarithmic curve graph of urbanization and eco-environment coupling coil
3.2.4 城镇化与生态环境的双指数曲线耦合图谱 双指数曲线耦合图谱是指在城镇化与生态环境耦合圈演变过程中,城镇化圈与生态环境圈耦合边界呈现双指数函数形式(图9),双指数曲线是环境库兹涅茨倒“U”型曲线和对数曲线的逻辑复合,揭示出生态环境随城镇化的发展存在先指数衰退、后指数改善的耦合规律。其表达式为:
式中:y0、x0分别代表城镇化圈和生态环境圈对耦合圈的初始贡献;y、x分别代表城镇化圈和生态环境圈对耦合圈的末期贡献;k代表城镇化圈和生态环境圈相互作用的系数,随着相互作用系数的变化,城镇化圈U和生态环境圈E对耦合圈的贡献彼此消长,由生态环境圈占主导(贡献占100%)逐渐演变为生态环境圈和城镇化圈的贡献各占50%,再演化为城镇化圈占主导(贡献占100%)。这是一种在现实中客观存在的城镇化与生态环境演变双指数耦合模式,表现为城镇化初期加速发展,城镇化圈的驱动力加速施力,中后期城镇化圈驱动力逐渐减弱,生态环境圈的制动力逐渐加大,限制性越来越大,迫使城镇化圈改变驱动力和施力方向,结果形成以双指数函数曲线为耦合边界的城镇化与生态环境耦合圈。
图9
 新窗口打开|下载原图ZIP|生成PPT
图9城镇化圈与生态环境圈耦合的双指数曲线图谱
Fig. 9Double index curve graph of urbanization and eco-environment coupling coil
3.2.5 城镇化与生态环境的“S”型曲线耦合图谱 “S”型曲线耦合图谱是指在城镇化与生态环境耦合圈演变过程中,城镇化圈与生态环境圈耦合边界呈现“S”型函数形式(图10),体现出城镇化圈与生态环境圈之间一开始就做到了很好的人地和谐,城镇化圈的发展充分考虑到了生态环境圈的保护,生态环境圈的保护又为城镇化圈的发展提供了自然基础和承载支撑,因而是一种城镇化圈与生态环境圈的最佳耦合图谱。其表达式为:
式中:y0、x0分别代表城镇化圈和生态环境圈对耦合圈的初始贡献;y、x分别代表城镇化圈和生态环境圈对耦合圈的末期贡献;k代表城镇化圈和生态环境圈相互作用的系数,随着相互作用系数的变化,城镇化圈U和生态环境圈E对耦合圈的贡献彼此消长,由生态环境圈占主导(贡献占100%)逐渐演变为生态环境圈和城镇化圈的贡献各占50%,再演化为城镇化圈占主导(贡献占100%)。这是一种在现实中客观存在的符合可持续发展目标的城镇化与生态环境演变耦合模式,表现为城镇化初期加速发展,城镇化圈的驱动力加速施力,生态环境圈的制动力较小并在承载范围之内,中后期城镇化圈驱动力逐渐减弱,并与生态环境圈的制动力形成相互消长相互制衡的格局,城镇化圈与生态环境圈始终保持在最佳的动态平衡有序状态,结果形成以“S”型函数曲线为耦合边界的城镇化与生态环境耦合圈。
图10
 新窗口打开|下载原图ZIP|生成PPT
图10城镇化圈与生态环境圈耦合的“S”型曲线图谱
Fig. 10S-shaped curve graph of urbanization and eco-environment coupling coil
4 耦合圈的优化调控
通过对城镇化与生态环境耦合圈理论的直线图谱、指数曲线图谱、对数曲线图谱、双指数曲线图谱和“S”型曲线图谱的对比分析发现:直线图谱是城镇化与生态环境耦合的理想图谱;指数曲线图谱是城镇化与生态环境耦合的最劣图谱;对数曲线图谱是城镇化与生态环境耦合的次劣图谱;双指数曲线图谱是城镇化与生态环境耦合的次优图谱;“S”型曲线图谱是城镇化与生态环境耦合的最优图谱(图11)。图11
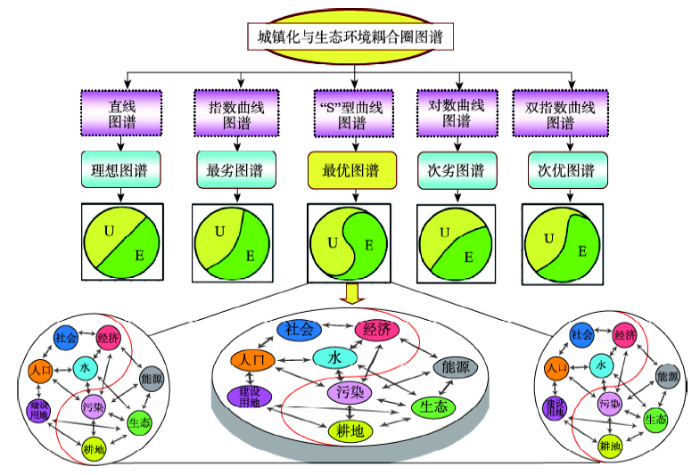 新窗口打开|下载原图ZIP|生成PPT
图11城镇化与生态环境耦合圈图谱及耦合调控器(UEC)
Fig. 11Coupled graphs of urbanization and eco-environment coupling coil and coupler
4.1 耦合器的模块
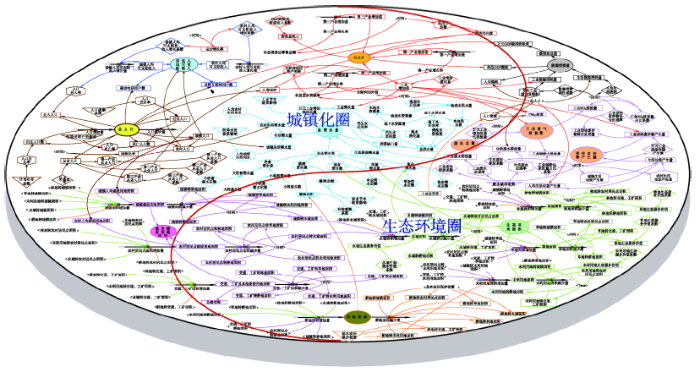
将最优的“S”型曲线图谱放大后到模块层面可知,“S”型曲线图谱的空间结构组成。以“S”型曲线为耦合边界,左半边为城镇化圈,由人口、经济、社会、建设用地等人文要素模块等组成,主要发生人文过程,遵循人文规律(图12);右半边为生态环境圈,由生态、环境、污染、能源、耕地等自然要素模块等组成,主要发生自然过程,遵循自然规律;两大圈层相互楔入,相互融合,形成一个互为存在、互为依赖、互为促进的有机共同体。水作为城镇化圈和生态环境圈都必需的关键要素模块,位于城镇化圈和生态环境圈的耦合边界中间地带,说明水在城镇化圈和生态环境圈耦合过程中发挥着决定性作用。图12
 新窗口打开|下载原图ZIP|生成PPT
图12城镇化圈与生态环境圈“S”型曲线耦合图谱的变量因果反馈结构与耦合调控器
Fig. 12Causal feedback structure of S-shaped curve graph and urbanization and eco-environment coupler
4.2 耦合器的变量
将最优的“S”型耦合曲线图谱由模块层面进一步放大到变量层面可知,“S”型曲线图谱中参与调控的变量数达到201个(表2),各变量之间的因果反馈流程如图12。各变量的选择根据变量对系统的贡献性、综合性、科学性、关联性、数据可获得性等原则,依据每个模块与其他模块之间、以及模块内部要素之间、变量之间和参数之间的因果反馈关系进行选择。由图12可知各模块之间和模块内部各变量之间存在的一对一、一对多和多对多的复杂关系,其中任何一个变量发生变化,就会牵一发而动全身,影响整个耦合器的结构、功能和调控结果。Tab. 2
表2
表2城镇化与生态环境耦合调控器变量统计表
Tab. 2
| 耦合器模块名称 | 耦合器变量数(个) | 耦合器变量名称 |
|---|---|---|
| 水模块 | 41 | 用水总量指标12个(总需水量、工业需水量、生活需水量、农业需水量、生态需水量、总供水量、再生水回用量、海水淡化量、调配水资源量、本地供水量、本地水资源量、供需缺口量)、用水结构指标16个(农村生活需水量、城镇生活需水量、牲畜需水量、大牲畜需水量、大牲畜头数、小牲畜需水量、小牲畜头数、灌溉需水量、灌溉面积、林业需水量、草场需水量、渔业需水量、地表水供水量、地表水资源量、地下水供水量、地下水资源量);用水定额/系数指标13个(万元工业增加值用水量、人均农村生活用水、人均城镇生活用水、大牲畜需水定额、小牲畜需水定额、有效灌溉系数、灌溉定额、林业需水定额、草场需水定额、渔业需水定额、再生水回用率、地表水开采率、地下水开采率)。 |
| 经济 模块 | 21 | 经济总量/结构指标9个(GDP、第一产业增加值、第二产业增加值、第三产业增加值、社会消费品零售总额、财政总收入、进出口总额、工业增加值、全社会固定资产投资),经济均量/系数指标6个(人均GDP、科技进步对经济增长贡献率、实际利用外资影响、GDP转化成财政收入系数、经济外向度、工业增加值比重),经济增长指标6个(第一产业增加量、第一产业增长率、第二产业增加量、第二产业增长率、第三产业增加量、第三产业增长率) |
| 社会 模块 | 9 | 居民人均收入指标3个(国民人均可支配收入、城镇人均可支配收入、农村人均可支配收入);居民收入增长指标4个(城镇人均可支配收入增加量、城镇人均可支配收入增长系数、农村人均可支配收入增加量、农村人均可支配收入增长系数);社会发展指标2个(移动电话数、国际互联网用户数) |
| 人口 模块 | 23 | 人口总量/结构指标5个(总人口、城镇人口、城镇化率、农村人口、人口密度);人口变化指标10个(人口增加量、迁入人口、人口迁入率、出生人口数、人口出生率、人口减少量、迁出人口、人口迁出率、死亡人口数、人口死亡率);人口就业指标8个(从业人口、从业人口系数、第一产业从业人口、第一产业从业人口系数、第二产业从业人口、第二产业从业人口系数、第三产业从业人口、第三产业从业人口系数) |
| 建设用 地模块 | 28 | 建设用地指标7个(城乡建设用地面积、城镇建设用地面积、城镇人均建设用地面积、农村居民点建设用地面积、农村人均建设用地面积、交通、工矿及其他建设用地面积、公路里程);建设用地变化指标6个(城镇面积增加量、城镇面积减少量、农村居民点面积增加量、农村居民点面积减少量、交通、工矿面积增加量、交通、工矿面积减少量);土地类型转换指标15个(城镇转林地面积、城镇转草地面积、城镇转未利用地面积、城镇转水域面积、城镇转耕地面积、农村居民点转林地面积、农村居民点转草地面积、农村居民点转未利用地面积、农村居民点转水域面积、农村居民点转耕地面积、交通、工矿转林地面积、交通、工矿转草地面积、交通、工矿转未利用地面积、交通、工矿转水域面积、交通、工矿转耕地面积) |
| 耕地 模块 | 11 | 耕地/土地指标2个(耕地面积、土地总面积);耕地变化指标2个(耕地面积增加量、耕地面积减少量);土地类型转换指标7个(耕地转林地面积、耕地转草地面积、耕地转未利用地面积、耕地转水域面积、耕地转城镇面积、耕地转农村居民点面积、耕地转交通、工矿面积) |
| 生态 模块 | 38 | 生态用地/生态系统服务指标13个(生态用地面积、林地面积、草地面积、未利用地面积、水域面积、林地生态服务价值、林地生态服务价值系数、草地生态服务价值、草地生态服务价值系数、未利用地生态服务价值、未利用地生态服务价值系数、水域生态服务价值、水域生态服务价值系数);生态用地变化指标8个(林地面积增加量、林地面积减少量、草地面积增加量、草地面积减少量、未利用地面积增加量、未利用地面积减少量、水域面积增加量、水域面积减少量);土地类型转换指标17个(林地转城镇面积、林地转农村居民点面积、林地转交通、工矿面积、林地转耕地面积、草地转城镇面积、草地转农村居民点面积、草地转交通、工矿面积、草地转耕地面积、未利用地转城镇面积、未利用地转农村居民点面积、未利用地转交通、工矿面积、未利用地转耕地面积、水域转城镇面积、水域转农村居民点面积、水域转交通、工矿面积、水域转耕地面积) |
| 污染 模块 | 20 | 三废排放/环境状况指标11个(废水总量、工业废水排放量、生活废水排放量、工业废气排放量、固体废弃物产生量、工业固体废弃物产生量、生活垃圾产生量、城镇生活垃圾产生量、农村生活垃圾产生量、人均生活垃圾产生量、PM2.5浓度);环境治理效率指标4个(工业废水处理率、生活废水处理率、工业固体废弃物综合处理量、工业固体废弃物综合处理率);污染排放强度指标5个(工业废水排放系数、万元工业增加值废气排放量、万元工业废弃物产生量、工业SO2排放量、工业SO2排放量占比系数) |
| 能源 模块 | 10 | 能源消耗总量指标4个(能源消费量、工业能源消费量、生活能源消费量、碳排放总量);能源消耗均量指标6个(单位工业增加值能耗、能源消费弹性系数、人均生活能耗、人均能耗、单位GDP能耗、万元GDP碳排放量) |
| 合计 | 201 | - |
新窗口打开|下载CSV
4.3 耦合器的动态调控
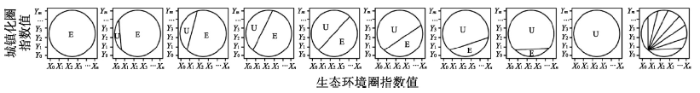
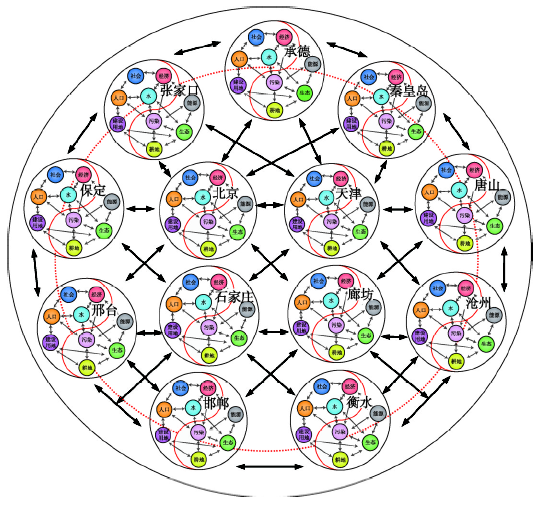
城镇化和生态环境耦合圈的动态调控包括同一时间多个城市城镇化与生态环境耦合圈之间的静态调控、不同时间同一城市城镇化与生态环境圈之间的动态调控、不同时间多个城市城镇化与生态环境圈之间的动态调控三大方面。4.3.1 同一时间多城市多要素的静态耦合 是指在城市群内部多个城市多个要素在同一时间内所形成的各种复杂耦合关系,表现为在同一时间截面的不同空间尺度上,城市群内的各种资源实现优化配置,区域生态环境实现良性改善,城市间基础设施和公共服务建设实现共建共享,多个城市之间通过合作,多个城市内部多个要素之间通过合理调控,最终实现在固定时间内的静态耦合。图13体现的就是在特定时间内,京津冀城市群13个城市在各个要素层面实现的静态耦合状态。随着时间的推移,多要素静态耦合状态很快被打破,在新的时间段要么演化为新的静态耦合,要么导致静态失调,取决于两个时间段多要素之间的年际优化和合理分配。
图13
 新窗口打开|下载原图ZIP|生成PPT
图13同一时间多城市多要素的静态耦合调控关系示意图
Fig. 13Static control of multiple cities at the same time
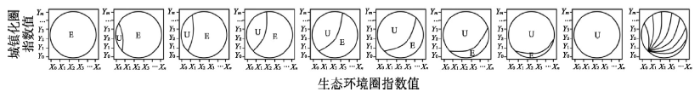
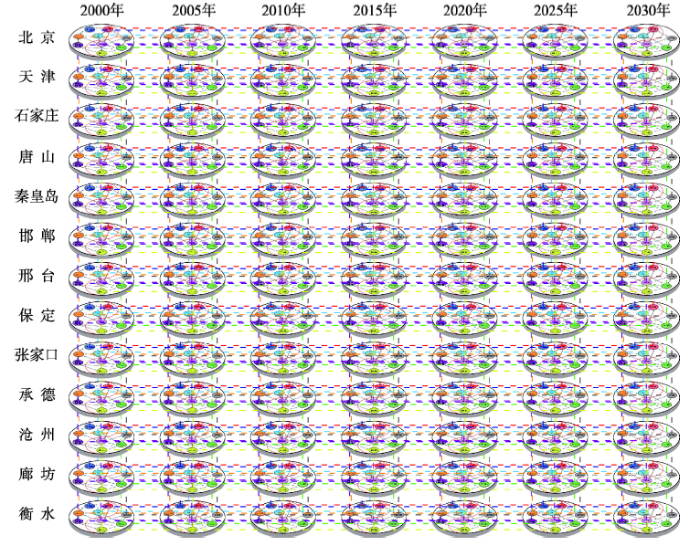
4.3.2 不同时间多城市多要素的动态耦合 是指在不同时间内,城市群内部的多个城市的多个要素在不同时间内所形成的各种动态耦合关系,表现为在不同时间截面的时间尺度上,城市群内各城市实现各种资源代际优化配置,区域生态环境实现代际良性改善,城市间基础设施和公共服务建设实现代际共建共享,多个城市之间通过合作,多个城市内部多个要素之间通过合理调控,最终实现在不同时间内多个城市的动态耦合。图14体现的就是在不同时间尺度内,京津冀城市群13个城市的各个要素在不同时间截面上实现的动态耦合状态。随着时间的推移,多要素动态耦合状态将逐步优化为新的动态耦合状态,推动城市群内城镇化与生态环境之间由低级耦合向高级耦合方向演进。
图14
 新窗口打开|下载原图ZIP|生成PPT
图14不同时间多城市多要素的动态耦合调控关系示意图
Fig. 14Dynamic control of multiple cities at different times
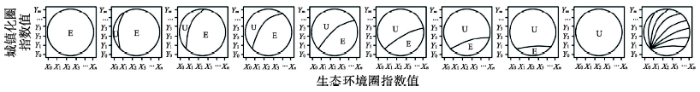
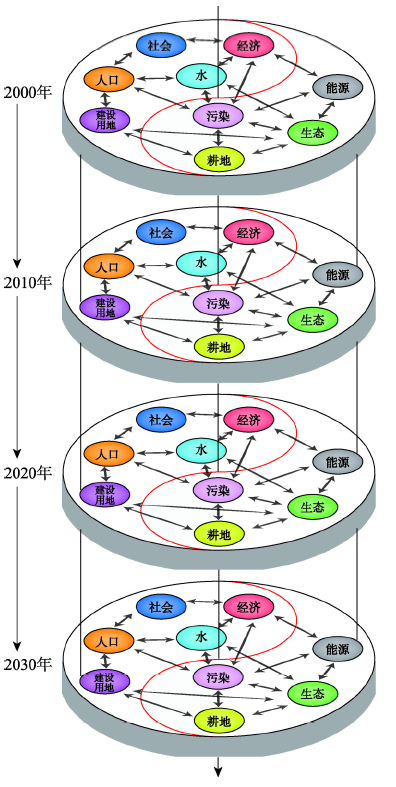
4.3.3 不同时间单城市多要素的动态耦合 是指将城市群作为一个整体的多要素在不同时间内,或者城市群内部的某一个城市的多个要素在不同时间内所形成的各种动态耦合关系,表现为在不同时间截面的时间尺度上,城市群内的各种资源实现代际优化配置,区域生态环境实现代际良性改善,城市间基础设施和公共服务建设实现代际共建共享,多个城市之间通过合作,多个城市内部多个要素之间通过合理调控,最终实现在不同时间内的动态耦合。图15体现的就是在不同时间尺度内,京津冀城市群13个城市的各个要素层面在不同时间截面上实现的动态耦合状态。随着时间的推移,多要素动态耦合状态将逐步优化为新的动态耦合态,推动城市群内城镇化与生态环境之间由低级耦合向高级耦合方向演进。
图15
 新窗口打开|下载原图ZIP|生成PPT
图15不同时间同一城市多要素的动态耦合调控关系
Fig. 15Dynamic control of a single city at different times
5 结论与讨论
(1)从客观上辨识了城镇化与生态环境之间存在着极其复杂的近远程耦合关系。揭示了城镇化与生态环境交互作用的耦合性、耦合关系、耦合度和耦合塔;根据主控要素总结出了城镇化与生态环境耦合的10种关系和交互方式;根据耦合度强弱将耦合性分为低度耦合、较低耦合、中度耦合、较高耦合、高度耦合和完全耦合6种类型,分别对应随性耦合、间接耦合、松散耦合、协同耦合、紧密耦合和控制耦合,进而形成城镇化与生态环境耦合塔。(2)从理论上创建了城镇化与生态环境耦合圈理论及图谱。按每旋转10°生成一个图谱构建了由直线图谱、指数曲线图谱、对数曲线图谱、双指数曲线图谱和“S”型曲线图谱等组合而成的45种多线耦合图谱,不同图谱对应着不同类型的城市发展模式、发展阶段和发展特征。在多种耦合图谱中,认为“S”型曲线耦合图谱是最佳图谱,代表着多种图谱中体现的城镇化与生态环境相互作用的最佳耦合状态。
(3)从技术上研发出耦合器(UEC)进行调控。以“S”型耦合曲线图谱为依托,将其放大,借助SD模型及各变量之间存在的一对一、一对多和多对多的复杂关系,构建了由11个调控要素和201个变量构成的耦合器(UEC)进行调控,这种调控包括同一时间多个城市城镇化圈与生态环境圈之间的静态调控、不同时间同一城市城镇化圈与生态环境圈之间的动态调控、不同时间多个城市城镇化圈与生态环境圈之间的动态调控3种时空尺度,通过调控使城镇化圈与生态环境圈始终保持最佳的动态有序状态。其中任何一个变量发生变化,就会牵一发而动全身,影响整个耦合器的结构、功能和调控结果。
(4)从应用上验证耦合圈理论和耦合器调控是进一步研究的重要方向。限于篇幅,本文主要从理论、方法和技术层面提出了城镇化与生态环境耦合圈理论的基本观点、主要图谱和耦合器调控的技术思路,并以京津冀城市群为案例做了验证分析,研发出了京津冀城市群城镇化与生态环境耦合调控器计算机软件,验证内容另文发表。有待选择其他城市群进一步做验证分析,以便总结出更普适性的规律和结论。
参考文献 原文顺序
文献年度倒序
文中引用次数倒序
被引期刊影响因子
[本文引用: 1]
[本文引用: 1]
[本文引用: 1]
DOI:10.1007/s11442-016-1317-9URL [本文引用: 1]
[本文引用: 1]
[本文引用: 1]
[本文引用: 1]
[本文引用: 1]
DOI:10.1579/0044-7447(2007)36[639:chans]2.0.co;2URLPMID:18240679 [本文引用: 1]

Humans have continuously interacted with natural systems, resulting in the formation and development of coupled human and natural systems (CHANS). Recent studies reveal the complexity of organizational, spatial, and temporal couplings of CHANS. These couplings have evolved from direct to more indirect interactions, from adjacent to more distant linkages, from local to global scales, and from simple to complex patterns and processes. Untangling complexities, such as reciprocal effects and emergent properties, can lead to novel scientific discoveries and is essential to developing effective policies for ecological and socioeconomic sustainability. Opportunities for truly integrating various disciplines are emerging to address fundamental questions about CHANS and meet society's unprecedented challenges.
[本文引用: 1]
DOI:10.1016/j.gloenvcha.2007.05.005URLPMID:19190718 [本文引用: 1]
This paper reviews and synthesizes findings from scholarly work on linkages among rural household demographics, livelihoods and the environment. Using the livelihood approach as an organizing framework, we examine evidence on the multiple pathways linking environmental variables and the following demographic variables: fertility, migration, morbidity and mortality, and lifecycles. Although the review draws on studies from the entire developing world, we find the majority of micro-level studies have been conducted in either marginal (mountainous or arid) or frontier environments, especially Amazonia. Though the linkages are mediated by many complex and often context-specific factors, there is strong evidence that dependence on natural resources intensifies when households lose human and social capital through adult morbidity and mortality, and qualified evidence for the influence of environmental factors on household decision-making regarding fertility and migration. Two decades of research on lifecycles and land-cover change at the farm level have yielded a number of insights about how households make use of different land-use and natural resource management strategies at different stages. A thread running throughout the review is the importance of managing risk through livelihood diversification, ensuring future income security, and culture-specific norms regarding appropriate and desirable activities and demographic responses. Recommendations for future research are provided.
DOI:10.1097/01.NEP.0000000000000592URLPMID:31851135 [本文引用: 1]
Knowing medications and their use in patient care is a component of safe practice. The Med-Match game transforms learning medications from a solitary task to an interactive activity. Educational games create real-life scenarios in a safe, context-rich environment without real-world consequences. Gaming is a form of active learning; learning occurs as a result of student-to-student interaction, peer feedback, and faculty debriefing. Although this activity was initially developed for nursing students, it can also be used with new RNs being oriented to a clinical setting or as an annual review for experienced nurses.
DOI:10.1111/hiv.12824URLPMID:31851448 [本文引用: 1]
On 28 March 2019, the Federal Joint Committee (G-BA) commissioned the Institute for Quality and Efficiency in Health Care (IQWiG) with the assessment of data-supported timely management in cooperation with a physician-staffed centre for telemedicine (hereinafter also referred to as “telemonitoring with defined minimum requirements”) for patients with advanced cardiac failure. RESEARCH QUESTION: The aim of the present report is the benefit assessment of telemonitoring with defined minimum requirements in addition to standard care and the resulting interventions as management strategy in comparison with standard care without telemonitoring in patients with advanced cardiac failure regarding patient-relevant outcomes. METHODS: The target population of the benefit assessment consisted of patients with advanced cardiac failure. The experimental intervention was telemonitoring with defined minimum requirements in addition to standard care and the resulting interventions as management strategy. Telemonitoring had to have the following specifics: at least daily transmission of at least the following parameters to a telemonitoring centre: heart rate and rhythm, as well as information on the general state of health (e.g. from self-assessment questionnaires or data on physical activity); close analysis of the data by a telemonitoring centre under the responsibility of a physician in addition to the treating physician; defined maximum reaction times of the telemonitoring centre (up to 1 working day) or of the treating physician (within 24 hours after knowledge). The comparator treatment was standard care without telemonitoring. Patient-relevant outcomes were considered in the assessment. Only randomized controlled trials (RCTs) were included in the benefit assessment. Studies with at least 6 months of follow-up observation were included. A systematic literature search for studies was conducted in the following databases: MEDLINE, Embase, and the Cochrane Central Register of Controlled Trials. In parallel, a search for relevant systematic reviews was conducted in the databases MEDLINE, Embase and the Cochrane Database of Systematic Reviews. In addition, the following information sources and search techniques were considered: study registries, documents sent by the G-BA, the websites of G-BA and IQWiG, as well as the screening of reference lists and author queries. In order to assess the qualitative certainty of the results, the criteria of the risk of bias across outcomes were evaluated, and the risk of bias was classified as low or high. If the studies were comparable regarding the research question and relevant characteristics and no relevant heterogeneity was observed, the individual results were pooled quantitatively by means of meta-analyses. RESULTS: The information retrieval identified 4 RCTs as relevant for the research question of the present benefit assessment. No planned or ongoing studies were identified. The last search was conducted on 9 May 2019. In the included studies, the data were either measured automatically by the implanted device (implantable cardioverter defibrillator [ICD] or cardiac resynchronization therapy [CRT]) and transmitted daily without involvement of the patients, or the patients themselves performed measurements once a day using external, non-invasive devices, and assessed their state of health. The data were then transmitted automatically. The risk of bias was high in all studies. The follow-up observation period was between 12 months and 24 months. CONCLUSION: The 4 included studies investigated 2 different telemonitoring strategies with defined minimum requirements. In telemonitoring type 1, the data were automatically measured by the implanted device (ICD or CRT-defibrillator [CRT-D]), no involvement of the patient was necessary. In telemonitoring type 2, it was the patient’s task to measure the data using external, non-invasive devices. Including all studies, there was no hint of a benefit or harm of telemonitoring for the outcome “all-cause mortality”. Data for the subgroups of patients with and without depressive symptoms were only available for telemonitoring type 2. For the outcome “all-cause mortality”, there was an indication of a benefit for patients without depressive symptoms. The joint consideration of telemonitoring type 1 and type 2 showed a hint of a benefit for the outcome “cardiovascular mortality”. There was no hint of a benefit or harm of telemonitoring with defined minimum requirements for the following outcomes: hospitalization overall, cardiovascular hospitalization, stroke, cardiac arrhythmia requiring treatment, thromboembolic events, shocks delivered by a cardiac device and morbidity due to cardiac failure. Due to the incomplete data, no conclusion on the benefit was drawn for the following outcomes: serious adverse events (SAEs), depressive symptoms, cardiac decompensation, health status and health-related quality of life.
DOI:10.1126/science.1172133URLPMID:19628857 [本文引用: 1]
A major problem worldwide is the potential loss of fisheries, forests, and water resources. Understanding of the processes that lead to improvements in or deterioration of natural resources is limited, because scientific disciplines use different concepts and languages to describe and explain complex social-ecological systems (SESs). Without a common framework to organize findings, isolated knowledge does not cumulate. Until recently, accepted theory has assumed that resource users will never self-organize to maintain their resources and that governments must impose solutions. Research in multiple disciplines, however, has found that some government policies accelerate resource destruction, whereas some resource users have invested their time and energy to achieve sustainability. A general framework is used to identify 10 subsystem variables that affect the likelihood of self-organization in efforts to achieve a sustainable SES.
DOI:10.1126/science.aab0031URLPMID:26068844 [本文引用: 1]
Jaramillo and Destouni claim that freshwater consumption is beyond the planetary boundary, based on high estimates of water cycle components, different definitions of water consumption, and extrapolation from a single case study. The difference from our analysis, based on mainstream assessments of global water consumption, highlights the need for clearer definitions of water cycle components and improved models and databases.
DOI:10.1016/j.landusepol.2011.05.009URL [本文引用: 1]
The Driver-Pressure-State-Impact-Response (DPSIR) framework was developed in the late 1990s to structure and organize indicators in a meaningful way. Since then, the framework has increasingly been applied in research projects with the aim of supporting decision making. A number of attributes of the framework regarding structuring and communication issues in research further strengthen its original purpose of bridging the science policy gap. We reviewed several studies that were mainly concerned with criticism and drawbacks of the DPSIR framework Based on these studies and our own experiences in applying the DPSIR framework in an EU project to develop a decision support tool, we developed two criteria that we believe are crucial for policy relevant research: (a) the development of conceptual models integrating knowledge from different disciplines, specialists and policy makers, as well as those affected by their decisions; and (b) the potential to explain the results and analysis of research to different disciplines, specialists, stakeholders and the public and to demonstrate alternatives and provide decision options. We analyzed 21 studies using the DPSIR framework with regard to their relevance for decision making. We analyzed the definitions of the five DPSIR elements and whether specific end users were addressed in the respective studies. We found that in many studies, the DPSIR elements were defined in literature review or by researchers and that only a few studies targeted specific government authorities as users of research results. Eight out of 21 studies applied transdisciplinary research concepts and integrated broad ranges of stakeholder opinions and values into the research. Nine out of 21 studies presented alternative outcomes to decision makers and used the valuation of these outcomes by stakeholders to add further support to the decision-making process. The different positive and negative implications of the DPSIR framework are discussed with reference to research that supports policy making. Finally, we conclude that studies employing DPSIR may provide effective solutions for "real world problems" by taking into account additional criteria based on knowledge integration, stakeholder involvement and the provision of alternatives. Therefore, DPSIR is a useful tool to support decision making by means of showing solid evidence with alternatives and decision options, rather than by presenting predetermined solutions. (C) 2011 Elsevier Ltd.
[本文引用: 1]
DOI:10.1126/science.1091015URLPMID:14671286 [本文引用: 1]
Human institutions--ways of organizing activities--affect the resilience of the environment. Locally evolved institutional arrangements governed by stable communities and buffered from outside forces have sustained resources successfully for centuries, although they often fail when rapid change occurs. Ideal conditions for governance are increasingly rare. Critical problems, such as transboundary pollution, tropical deforestation, and climate change, are at larger scales and involve nonlocal influences. Promising strategies for addressing these problems include dialogue among interested parties, officials, and scientists; complex, redundant, and layered institutions; a mix of institutional types; and designs that facilitate experimentation, learning, and change.
DOI:10.1016/j.gloenvcha.2006.04.002URL [本文引用: 1]
DOI:10.3389/fnsys.2019.00025URLPMID:31379521 [本文引用: 1]
In today's society, it becomes increasingly important to assess which non-human and non-verbal beings possess consciousness. This review article aims to delineate criteria for consciousness especially in animals, while also taking into account intelligent artifacts. First, we circumscribe what we mean with &quot;consciousness&quot; and describe key features of subjective experience: qualitative richness, situatedness, intentionality and interpretation, integration and the combination of dynamic and stabilizing properties. We argue that consciousness has a biological function, which is to present the subject with a multimodal, situational survey of the surrounding world and body, subserving complex decision-making and goal-directed behavior. This survey reflects the brain's capacity for internal modeling of external events underlying changes in sensory state. Next, we follow an inside-out approach: how can the features of conscious experience, correlating to mechanisms inside the brain, be logically coupled to externally observable (&quot;outside&quot;) properties? Instead of proposing criteria that would each define a &quot;hard&quot; threshold for consciousness, we outline six indicators: (i) goal-directed behavior and model-based learning; (ii) anatomic and physiological substrates for generating integrative multimodal representations; (iii) psychometrics and meta-cognition; (iv) episodic memory; (v) susceptibility to illusions and multistable perception; and (vi) specific visuospatial behaviors. Rather than emphasizing a particular indicator as being decisive, we propose that the consistency amongst these indicators can serve to assess consciousness in particular species. The integration of scores on the various indicators yields an overall, graded criterion for consciousness, somewhat comparable to the Glasgow Coma Scale for unresponsive patients. When considering theoretically derived measures of consciousness, it is argued that their validity should not be assessed on the basis of a single quantifiable measure, but requires cross-examination across multiple pieces of evidence, including the indicators proposed here. Current intelligent machines, including deep learning neural networks (DLNNs) and agile robots, are not indicated to be conscious yet. Instead of assessing machine consciousness by a brief Turing-type of test, evidence for it may gradually accumulate when we study machines ethologically and across time, considering multiple behaviors that require flexibility, improvisation, spontaneous problem-solving and the situational conspectus typically associated with conscious experience.
[本文引用: 1]
[本文引用: 1]
URLPMID:249797 [本文引用: 1]
URLPMID:249797 [本文引用: 1]
[本文引用: 1]
[本文引用: 1]
[本文引用: 1]
[本文引用: 1]
[本文引用: 1]
[本文引用: 1]
[本文引用: 1]
DOI:10.1016/j.scitotenv.2019.134656URLPMID:31839310 [本文引用: 1]
Widespread detrimental and long-lasting droughts are having catastrophic impacts around the globe. Researchers, organizations, and policy makers need to work together to obtain precise information, enabling timely and accurate decision making to mitigate drought impacts. In this study, a spatial modeling approach based on an adaptive neuro-fuzzy inference system (ANFIS) and several metaheuristic optimizations (ANFIS-BA, ANFIS-GA, ANFIS-ICA, ANFIS-PSO) was developed to predict the spatial occurrence of drought in a region in southeastern Queensland, Australia. In this approach, data describing the distribution of eight drought-contributing factors were prepared for input into the models to serve as independent variables. Relative departures of rainfall (RDR) and relative departures of soil moisture (RDSM) were analyzed to identify locations where drought conditions have occurred. The set of locations in the study area identified as having experienced drought conditions was randomly divided into two groups, 70% were used for training and 30% for validation. The models employed these data to generate maps that predict the locations that would be expected to experience drought. The prediction accuracy of the model-produced drought maps was scrutinized with two evaluation metrics: area under the receiver operating characteristic curve (AUC) and root mean square error (RMSE). The results demonstrate that the hybridized models (ANFIS-BA (AUCmean?=?83.7%, RMSEmean?=?0.236), ANFIS-GA (AUCmean?=?81.62%, RMSEmean?=?0.247), ANFIS-ICA (AUCmean?=?82.12%, RMSEmean?=?0.247), and ANFIS-PSO (AUCmean?=?81.42%, RMSEmean?=?0.255)) yield better predictive performance than the standalone ANFIS model (AUCmean?=?71.8%, RMSEmean?=?0.344). Furthermore, sensitivity analyses indicated that plant-available water capacity, the percentage of soil comprised of sand, and mean annual precipitation were the most important predictors of drought hazard. The versatility of the new approach for spatial drought modeling and the capacity of ANFIS model hybridization to improve model performance suggests great potential to assist decision makers in their formulations of drought risk, recovery, and response management, and in the development of contingency plans.
DOI:10.1016/S0140-1963(03)00087-9URL [本文引用: 1]
[本文引用: 1]
[本文引用: 1]
DOI:10.11820/dlkxjz.2005.06.004URL [本文引用: 1]
In 21 century, the restrictions of water resources shortage and eco-environmental crisis in the urbanization process in arid area are even more evident. However, what are the real roles of water resources and eco-environment in the urbanization process? What kind of urbanization modes should be adopted under the dual restraints of water resources and eco-environment? This paper reviewed the domestic and international research progress about the theories, ideas, methods and practices of the research of urbanization and eco-environment in arid area. Then the viewpoint that the relation between urbanization and eco-environment is mutual promotion while inter-coercing was put forward. Finally, the author pointed out the weak side of studying in this field at present, and prospected the main research directions in the future. Studies showed that international scholars generally paid close attention to the research of urbanization and eco-environment reciprocation relation, and thought much of the research of urbanization and eco-environment reciprocation mechanism in arid area. They generally adopted “3S” technology and quantitative analytical method to appraise the response course of urbanization and eco-environment respectively, and strengthened to research the sustainable developmental modes of urbanization and eco-environment in arid area progressively. Domestic scholars mainly studied on the phenomena of water deficiency and ecological degradation, the interactional mechanism between urbanization and eco-environment, the quantitative analysis models and the urbanization development modes in arid area. Although a series of theories to study the relation of urbanization and environment have emerged recently, there are a lot of weak points which should bring our attention in. For example the researches of urbanization or eco-environment solely were more, but the researches combining them together were less; the empirical researches were more, but the law summarization researches were less; and the researches of coercing effects were more, but the researches of restraint effects were less. So, an independent and integrated theoretical system of urbanization and eco-environment research in arid area has not formed yet. In the future, the multi-disciplinary merges, the close integration with practice and the application of new technical method and the dynamic simulation will be the main research directions.
[本文引用: 1]
[本文引用: 1]
[本文引用: 1]
[本文引用: 1]
DOI:10.1007/s11769-013-0591-zURL [本文引用: 1]
[本文引用: 1]
[本文引用: 1]
