2.
Local and distant virtual water trades in Beijing-Tianjin-Hebei region
SUN Si'ao1, ZHENG Xiangyi2, LIU Haimeng11. 2.
收稿日期:2018-04-25修回日期:2019-11-13网络出版日期:2019-12-25
| 基金资助: |
Received:2018-04-25Revised:2019-11-13Online:2019-12-25
| Fund supported: |
作者简介 About authors
孙思奥(1983-),女,湖南津市人,博士,副研究员,主要从事城市水文和水资源管理与政策相关研究E-mail:suns@igsnrr.ac.cn。

摘要
关键词:
Abstract
Keywords:
PDF (3581KB)元数据多维度评价相关文章导出EndNote|Ris|Bibtex收藏本文
本文引用格式
孙思奥, 郑翔益, 刘海猛. 京津冀城市群虚拟水贸易的近远程分析. 地理学报[J], 2019, 74(12): 2631-2645 doi:10.11821/dlxb201912015
SUN Si'ao.
1 引言
京津冀城市群(包括北京、天津两个直辖市和河北省)是以首都北京为核心的世界级城市群,是中国东部地区的重要增长极、国家经济发展的重要引擎、高水平参与国际竞争合作的战略区域[1,2]。京津冀城市群属于资源型缺水地区,1997-2016年期间人均水资源占有量不足200 m3,不及全国人均水资源量的1/9,是中国水资源匮乏最严重的地区之一[3,4,5,6]。长期以来,京津冀城市群水资源供需矛盾突出,高强度用水导致地表水断流、地下水超采,造成水环境恶化、生态退化、地面沉降等一系列问题[7,8,9]。由于人口和产业高度密集,京津冀城市群的可更新水资源量难以维系当地居民的生活与生产用水,外部水资源成为缓解该区域水资源供需矛盾的重要组成部分。近年来,南水北调东线与中线工程相继通水,将水资源从相对富足的南方流域调入,直接缓解了京津冀城市群的水资源压力。然而,南水北调工程耗资巨大,并可能给水源地的生态环境带来负面影响[10]。国际上通过地区间贸易实现隐含在商品中“虚拟水”转移的概念已得到广泛认可,进口虚拟水成为缓解贫水国家或地区水资源压力的另一重要途径[11]。虚拟水的概念最早是由Allan于20世纪90年代年提出,将水资源消费与经济活动联系起来[12,13]。虚拟水是指生产商品和服务过程中所需要的水资源量[14]。水足迹的概念与虚拟水紧密相关,是一个国家、地区或个人在一定时间段内消费所有产品和服务所包含的虚拟水[15]。在资源配置全球化的背景下,Hoekstra提出虚拟水战略,即在贫水国家或地区可以通过从其他国家或地区进口水资源密集型产品减少对当地水资源的开采、缓解当地水资源短缺[16]。在京津冀协同发展的背景下,全面分析京津冀城市群虚拟水贸易流动,厘清京津冀城市群与外部的虚拟水贸易及城市群内部的虚拟水流动,有助于深入理解该地区的水资源供需现状及问题,为制定虚拟水贸易相关政策、实现区域水资源优化配置、保障区域水资源安全提供决策支持。随着全球面临水资源短缺人数的持续增长及区域间贸易的发展与加强,国内外****广泛开展了虚拟水贸易及其对水资源配置影响的相关研究[17,18]。一个地区的水足迹可以通过自上而下法(top-down method)或自下而上法(bottom-up method)两种方法进行核算[19]。前者通过计算一个地区消耗的水资源与虚拟水贸易量的差值来测算水足迹,后者通过累加一个地区所有消费者消费产品与服务中隐含的虚拟水来测算。目前,在区域或多区域投入产出表的基础上通过追踪产品生产的产业链过程来估算商品中隐含的虚拟水成为测算水足迹与虚拟水的重要方法。应用该方法,国内外****已在国家、地区、省市等多个尺度开展了中国虚拟水贸易与水足迹的研究,深入分析了中国虚拟水贸易与水足迹的空间格局及特征[20]。Dong等[21]发现虚拟水的净流入区主要分布在发达地区,包括上海、北京、天津、山东,虚拟水的净流出区主要分布在北部和西部欠发达地区,包括新疆、黑龙江、内蒙古、广西;Chen等[22]通过分析中国省际之间虚拟水的转移量,发现中国虚拟水呈现出从南方向北方,从内陆向沿海,从不发达地区向发达地区流动的格局。在京津冀城市群地区,Zhao等[23]基于京津冀三省(市)区域间投入产出模型,分析了京津冀城市群地区的水足迹和内部虚拟水流动,结果表明,北京、天津是虚拟水的净输入地区,而河北是虚拟水净输出地区。
资源生态要素的近远程耦合成为近年来的国际研究热点[24,25]。从近远程角度来研究城市群与生态环境要素之间的耦合关系,能够区分城市群各城市对内外部生态环境资源的依赖,有助于研究城市群社会经济活动产生的内外部效应[26,27]。然而,当前关于区域虚拟水贸易与水足迹的研究,很少明确区分近、远程地区的作用与影响,无法辨别区域对内外部水资源的依赖程度,难以探讨内外部社会经济活动对区域水资源供给的效应。因而,本文借鉴近远程视角来分析京津冀城市群近远程虚拟水贸易流动具有一定的创新性。将京津冀城市群看作一个地域系统,其中近程虚拟水贸易流动指系统内部即北京、天津、河北三地之间通过商品和服务贸易形成的虚拟水交易,远程虚拟水贸易流动指系统以外各省域单元通过与北京、天津、河北的商品和服务贸易形成的虚拟水交易。本文在2010年中国区域间投入产出表的基础上,通过测算京津冀城市群与全国各省域单元之间的虚拟水贸易量,从近远程视角讨论京津冀城市群内部与外部水足迹特征及内外虚拟水流动的空间格局。在已有的京津冀城市群虚拟水有关研究的基础上[23, 28],明确区分近远程水足迹,分区讨论远程水足迹的贡献作用,并分析虚拟水贸易的距离特征,是本文拟解决的核心问题。本研究为提高京津冀地区水资源协同管理,实现水资源区域联合调度与水资源安全提供有效依据。
2 数据来源及方法
2.1 数据来源
本文用到的主要数据包括2010年中国30个省域单元(由于数据的不可获得性,数据不包括西藏、香港、澳门和台湾地区)区域间投入产出表[29]与相应的用水数据。区域间投入产出表给出了中国30省域单元30部门之间商品与服务的流动关系。区域间投入产出表的30个部门包括1个农业部门,煤炭开采和洗选业、石油和天然气开采业等23个工业部门以及批发零售业等6个服务业部门。各省域单元2010年农业、工业与服务业用水数据从2011年《中国统计年鉴》及各省域单元水资源公报获得。因区域间投入产出表与用水数据的部门划分不一致(前者包括30部门,后者仅划分为3大部门),将各省域单元工业与服务业用水量分别分解为区域间投入产出表中各细分部门的用水量。2010年各细分部门用水量参照Zhang等[30]得到。对应于区域间投入产出表中的30个部门,将各省域单元的工业用水总量按照《中国经济普查年鉴(2008)》[31]中各工业部门用水比例进行分配(2010年各细分工业部门用水数据不可获得),得到细分工业部门用水量;将服务业用水总量按照中国地区投入产出表[32]中“水的生产与供应部门”对服务业各部门的中间投入等比例分配(中国地区投入产出表中给出了中国30个省域单元42部门之间商品与服务的流动关系),再将相应部门用水量进行合并,得到区域间投入产出表中细分的服务业6部门的用水量。主要数据及相关信息如表1所示。Tab. 1
表1
表1京津冀城市群虚拟水贸易近远程分析主要数据
Tab. 1
| 编号 | 数据名称 | 数据来源及用途 |
|---|---|---|
| 1 | 中国区域间投入产出表(2010年) | 由中国科学院区域可持续发展分析与模拟重点实验室编制[30],包含全国30省市30部门投入产出关系,用于将生产过程中的直接用水量转化为最终消费品中的虚拟水量。 |
| 2 | 中国各省域单元2010年农 业、工业、服务业用水(包括服务业与居民生活用水) | 来源于中国统计年鉴与各省域单元的水资源公报。将根据数据信息3和4进一步细分为30部门用水量。 |
| 3 | 各省域单元23个细分工业部门用水量 | 来源于《中国经济普查年鉴(2008)》,用于将工业用水量分配到23个细分工业部门用水量。 |
| 4 | 中国地区投入产出表(2007年、2012年) | 由国家统计局国民经济核算司编制[32],提取“水的生产与供应部门”对服务业各部门的中间投入,用于将服务业用水量分配到6个细分的服务业部门。2010年的分配比例由2007年与2012年的数据插值获得。 |
新窗口打开|下载CSV
2.2 方法
2.2.1 基于投入产出的虚拟水与水足迹测算 本文在区域间投入产出表的基础上,计算区域之间的虚拟水贸易量与区域水足迹。在一个考虑R个区域N个经济部门的经济系统中,区域间的投入产出表可用下式表达:式中:xr(N×1向量)表征r省域单元N个部门的产出;Ars(N×N矩阵)为技术矩阵,其元素
式中:I为单位矩阵;
式中:wr(N×1向量)代表r区域N个部门的用水量;D为对角元素为[d1, d2, …, dN]的对角矩阵,其中,dT(N×N对角矩阵)代表直接用水系数,即各部门生产单位产品的直接用水量;T为包含直接与间接用水的完全用水系数矩阵。区域r流入到区域s的虚拟水量可由下式计算:
式中:tri(N×1行向量)为i区域生产单位最终消费产品在r区域的需水量,由式(3)中矩阵T得到;yis(N×1列向量)为s区域居民最终消费i区域生产的各部门产品量。
区域r的消费水足迹
式中:vwsr(s = r)为本地水足迹;
2.2.2 京津冀虚拟水贸易近远程分析 在省域单元虚拟水贸易量测算的基础上,区分京津冀城市群虚拟水近程与远程的交易量,分析该地区水足迹的近远程供给结构,评估该地区水资源的自给状况与对外部水资源的依赖。其中,近程虚拟水贸易指京津冀城市群内部即北京、天津、河北三地之间通过商品和服务贸易形成的虚拟水流动,远程虚拟水贸易指京津冀城市群与外部各省域单元之间随贸易产生的虚拟水交换。为方便对京津冀城市群远程虚拟水来源地进行分析,按照国家统计局公布的经济带划分标准将中国各地区分为东部、西部、中部、东北四大区域[33],除去京津冀,东部包括上海、江苏、浙江、福建、山东、广东和海南等7个省(市);中部涵盖山西、安徽、江西、河南、湖北和湖南等6个省(市);西部包括内蒙古、广西、重庆、四川、贵州、云南、陕西、甘肃、青海、宁夏和新疆等11个省(区、市);东北包括辽宁、吉林和黑龙江等3个省(市)。
通过研究各省域单元单位面积虚拟水输出量和其与北京、天津、河北的距离的关系来分析距离因素对于近远程虚拟水量的影响。北京、天津、河北的消费水足迹距离虚拟水来源地的平均距离由下式求得:
式中:
3 结果与讨论
首先根据京津冀三省(市)各部门的用水量与产出量以及基于区域投入产出表的Leontief逆矩阵,基于Matlab软件平台,按照式(3),计算得到三个省(市)2010年30个产业部门的直接用水系数与完全用水矩阵。根据京津冀三省(市)各部门完全用水矩阵和产品与服务的最终消费量,利用公式(4)~(5),计算得到京津冀各省(市)的虚拟水贸易量与水足迹。3.1 京津冀各部门用水强度分析
京津冀三省(市)2010年30个产业部门的直接用水系数与完全用水系数结果如表2所示。京津冀地区各部门的直接用水系数为0.01~352.2 m3/万元,完全用水系数为7.6~544.4 m3/万元,由于完全用水包括直接用水与间接用水,完全用水系数总是高于直接用水系数。不同部门用水系数差异大,其中,农业部门用水强度最高,直接用水系数超过300 m3/万元,完全用水系数超过400 m3/万元;工业与服务业各部门直接用水系数显著低于农业直接用水系数,其中直接用水强度较大的工业部门包括电力、热力的生产和供应业、金属冶炼及压延加工业、非金属矿及其他矿采选业和纺织业,有些省(市)直接用水系数超过10 m3/万元,但仍然低于农业部门直接用水强度一个数量级。由于中间投入产品较多,工业与服务业各部门的完全用水系数显著高于其直接用水系数,食品制造及烟草加工业等部门的直接用水不到完全用水的2%。完全用水强度较大的部门包括农林牧渔业、食品制造及烟草加工业、纺织业、住宿餐饮业等,其三省(市)的完全用水系数均超过100 m3/万元。Tab. 2
表2
表2北京、天津、河北30部门直接与完全用水系数(m3/万元)
Tab. 2
| 直接用水系数 | 完全用水系数 | ||||||
|---|---|---|---|---|---|---|---|
| 部门 | 北京 | 天津 | 河北 | 北京 | 天津 | 河北 | |
| 农林牧渔业 | 350.6 | 352.2 | 334.5 | 544.4 | 514.1 | 406.5 | |
| 煤炭开采和洗选业 | 0.7 | 0.01 | 4.7 | 26.2 | 22.5 | 33.5 | |
| 石油和天然气开采业 | 0.6 | 0.6 | 3.0 | 13.7 | 7.6 | 20.3 | |
| 金属矿采选业 | 1.3 | 0.1 | 6.1 | 23.5 | 11.4 | 24.7 | |
| 非金属矿及其他矿采选业 | 5.6 | 13.1 | 1.6 | 44.5 | 28.1 | 17.0 | |
| 食品制造及烟草加工业 | 4.3 | 2.3 | 2.3 | 228.9 | 357.5 | 216.2 | |
| 纺织业 | 7.1 | 11.4 | 2.7 | 125.3 | 181.5 | 165.9 | |
| 纺织服装鞋帽皮革羽绒及其制品业 | 0.2 | 0.3 | 8.0 | 94.5 | 135.7 | 125.5 | |
| 木材加工及家具制造业 | 1.5 | 3.9 | 0.3 | 67.4 | 100.9 | 106.0 | |
| 造纸印刷及文教体育用品制造业 | 3.1 | 2.2 | 9.8 | 40.7 | 51.7 | 95.0 | |
| 石油加工、炼焦及核燃料加工业 | 1.9 | 2.1 | 2.4 | 11.2 | 14.0 | 19.0 | |
| 化学工业 | 3.3 | 3.7 | 3.4 | 57.5 | 46.3 | 49.7 | |
| 非金属矿物制品业 | 3.8 | 2.4 | 1.6 | 31.0 | 36.4 | 29.4 | |
| 金属冶炼及压延加工业 | 31.5 | 2.0 | 3.2 | 46.0 | 20.5 | 22.5 | |
| 金属制品业 | 1.2 | 0.7 | 0.7 | 27.1 | 24.0 | 27.1 | |
| 通用、专用设备制造业 | 1.2 | 0.9 | 0.8 | 22.2 | 20.5 | 24.1 | |
| 交通运输设备制造业 | 0.6 | 0.7 | 0.8 | 21.4 | 20.2 | 22.3 | |
| 电气机械及器材制造业 | 0.4 | 0.8 | 0.6 | 22.9 | 20.3 | 23.5 | |
| 通信设备、计算机及其他电子设备制造业 | 0.9 | 0.7 | 0.9 | 10.9 | 16.4 | 16.0 | |
| 仪器仪表及文化办公用机械制造业 | 0.6 | 0.6 | 0.6 | 16.2 | 22.8 | 18.9 | |
| 其他制造业 | 1.2 | 1.1 | 0.3 | 40.3 | 29.0 | 58.8 | |
| 电力、热力的生产和供应业 | 6.6 | 8.2 | 42.8 | 35.9 | 35.3 | 83.1 | |
| 燃气及水的生产与供应业 | 0.7 | 0.3 | 0.4 | 32.8 | 19.5 | 20.4 | |
| 建筑业 | 4.4 | 7.0 | 8.9 | 36.2 | 36.9 | 35.9 | |
| 交通运输及仓储业 | 0.7 | 0.5 | 0.7 | 26.7 | 32.0 | 44.3 | |
| 批发零售业 | 8.3 | 3.9 | 7.7 | 23.0 | 25.2 | 10.9 | |
| 住宿餐饮业 | 0.5 | 2.8 | 2.3 | 160.3 | 167.7 | 120.0 | |
| 租赁和商业服务业 | 8.3 | 2.9 | 5.5 | 45.7 | 35.0 | 76.9 | |
| 研究与试验发展业 | 4.0 | 2.3 | 4.3 | 59.4 | 22.8 | 26.5 | |
| 其他服务业 | 3.5 | 1.8 | 1.7 | 31.1 | 26.3 | 27.1 | |
新窗口打开|下载CSV
直接与完全用水系数能有效反映不同省(市)不同行业生产活动对水资源的依赖程度[34]。由于用水效率、产业链输入中间产品、部门内产品结构等因素的不同,京津冀三省(市)不同部门的用水系数呈现出很大差异。各省(市)均有用水效率较高的优势部门。例如,比较各省(市)不同部门的完全用水系数,北京的纺织业等8个部门用水效率最高,天津的电力、热力的生产和供应业等15个部门用水效率最高,河北省的农林牧渔副业等7个部门用水效率最高。
根据各部门的直接和完全用水系数以及各部门的总产出,计算北京、天津、河北的所有部门综合直接用水系数分别为5.7 m3/万元、6.2 m3/万元、30.1 m3/万元,所有部门综合完全用水系数分别为37.8 m3/万元、44.9 m3/万元、86.9 m3/万元。产业结构的不同导致京津冀各省(市)所有部门综合的用水系数差别较大,北京农产品产出占比最低,占各部门总产出比例不足1%,因而各部门综合的直接与完全用水系数最低;河北农产品产出占比相对最高,各部门综合的直接与完全用水系数最高。这说明除了注重提高各生产部门的用水效率外,升级产业结构、优化用水结构也是节水、减少水资源供需压力的重要途径。
3.2 京津冀水足迹分析比较
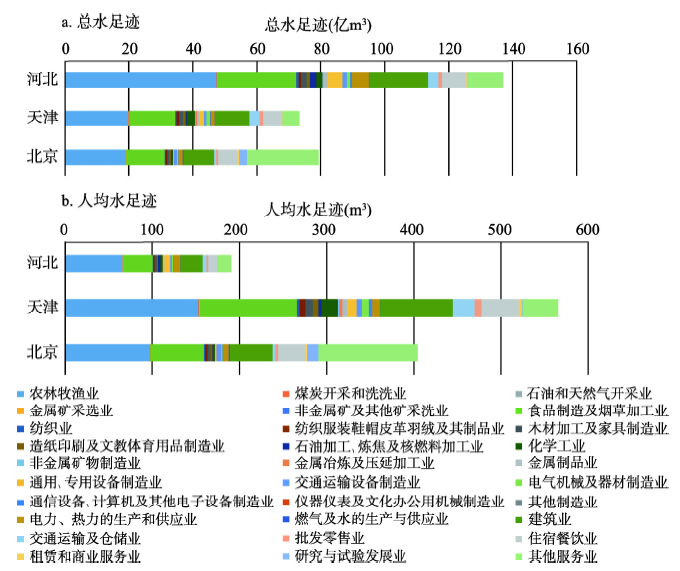
根据全国各部门完全用水系数和产品与服务的最终消费量,根据公式(4)~(5),计算得到京津冀各省(市)的水足迹(图1)。北京、天津、河北的总水足迹分别为79.4亿 m3、73.4 亿m3、137.1亿m3。尽管京津冀城市群地区农业用水占生产用水总量的70%以上,由于很多农产品并非直接用于最终消费,而是作为中间投入品进入生产链用于生产其他产品和服务,因而农业产品消费水足迹远低于用于农业产品生产的用水量,北京、天津、河北农业产品消费水足迹分别占总水足迹的24.0%、27.0%、34.6%。工业产品消费水足迹最大,北京、天津、河北的工业产品消费水足迹占总水足迹的比重分别为34.9%、51.7%、48.3%,其中食品和烟草加工业产品的消费水足迹最大,该部门产品消费水足迹占工业消费水足迹的50%以上。京津冀三地服务业消费水足迹分别占比总水足迹的40.1%、21.3%与17.1%,其中住宿餐饮业和其他服务业是消费水足迹最大的两个部门,这两个部门水足迹占服务业消费总水足迹的65%以上。图1
 新窗口打开|下载原图ZIP|生成PPT
图12010年北京、天津、河北各部门消费水足迹
Fig. 1Sectoral water footprints in Beijing, Tianjin and Hebei in 2010 (a. total water footprint; b. per capita water footprint)
京津冀三省(市)的总水足迹除以总人口,得到各省(市)的人均消费水足迹,分别为404.7 m3、565.3 m3、190.6 m3。省(市)之间人均消费水平的差异是造成人均消费水足迹差异巨大的最主要原因[35]。2010年北京、天津、河北的人均消费水平(包括最终消费支出与资本形成总额)分别为6.7万元、7.3万元、2.4万元,其中人均最终消费支出分别为3.8万元、2.5万元、1.1万元,人均固定资产形成分别为2.9万元、4.8万元、1.3万元。由于河北省人均消费水平远低于北京与天津,其人均水足迹水平也很低,仅为北京的47%、天津的34%。另外,用水效率也是造成人均消费水足迹地区差异的原因之一[36]。2010年,由于固定资产形成(指产业部门、政府服务生产者和非营利服务生产者在其固定资产存量上追加的净支出)较低,北京的总体人均消费水平低于天津8%,但由于北京的综合完全用水效率高于天津,北京的人均水足迹低于天津29%。
3.3 京津冀近远程水足迹分析
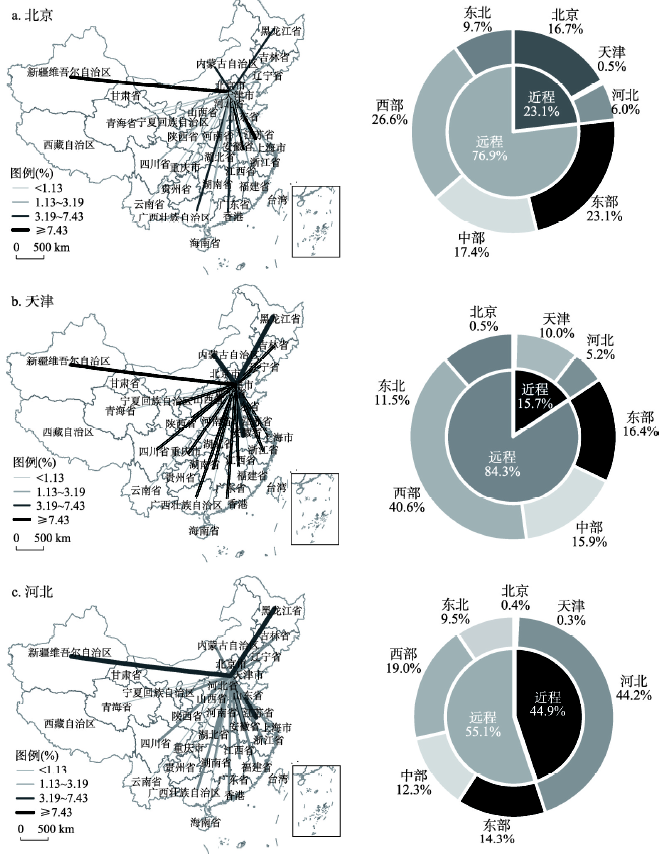
将京津冀三省(市)的消费水足迹按照水足迹来源地进行划分,分析近远程水足迹贸易对各省(市)水资源消费的贡献,结果如图2所示。北京、天津、河北远程水足迹流入总量分别为61.0亿m3、61.9亿m3、75.6亿m3,分别占三省(市)水足迹比重的76.9%、84.3%、55.1%。随着中国区域经济联系的不断加强,各省域单元分工协作,京津冀三省(市)远程水足迹的贡献量均大于近程,表明远程水源对于促进京津冀城市群发展的重要性。尤其是在人口与经济密度都超大的直辖市北京与天津,远程水足迹贡献率超过75%,高水平城市化地区的发展依赖于全国各地水资源的供养。将远程水足迹的来源地按东部、中部、西部和东北划分,水资源丰富的西部地区对京津冀城市群的贡献最大,通过输出水足迹含量较高的农业产品为北京、天津、河北分别提供占比26.6%,40.6%、19.0%的水足迹;东部也为北京输入了大量的水足迹,占北京消费水足迹的23.1%;东北和中部地区为北京、天津、河北输入9.5%~17.4%的水足迹。图2
 新窗口打开|下载原图ZIP|生成PPT
图22010年京津冀城市群地区近远程水足迹分析
Fig. 2Water footprints from local and external areas in 2010 (a. Beijing; b. Tianjin; c. Hebei)
近程水足迹分别为北京、天津、河北的水足迹贡献了23.1%、15.7%、44.9%,其中本地水足迹占比最大,北京、天津、河北的本地水足迹分别占比各省(市)总消费水足迹的16.7%、10.0%、44.9%。河北的本地水足迹占比远高于北京、天津的本地水足迹占比,对外部水资源的依赖性最低。另外,河北给北京和天津输入了大量的虚拟水,分别占两地水足迹的6.0%、5.2%,而北京与天津输出给河北的虚拟水极少,占河北水足迹比重不超过0.4%。
总体而言,京津冀城市群的近、远程水足迹分别为91.4亿m3、198.5亿m3,其占总水足迹的占比分别为31.5%、68.5%。北京、天津、河北分别为京津冀城市群提供占比4.9%,2.8%、23.9%的水足迹,东部、中部、西部、东北分别为京津冀城市群提供占比17.2%,14.6%、26.5%、10.1%的水足迹。
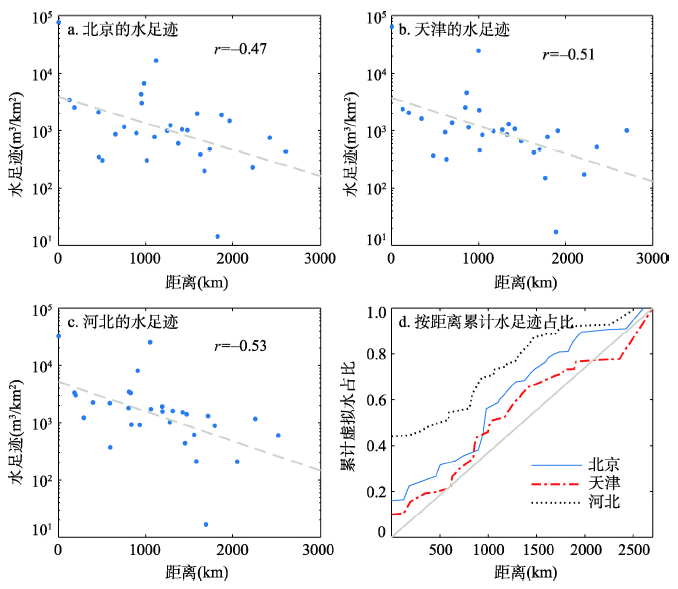
京津冀城市群的消费水足迹遍布全国各省域单元。京津冀三省(市)在全国各省域单元单位面积的水足迹和京津冀与各省域单元距离的关系如图3所示。图3显示,北京、天津、河北三省(市)在各省域单元单位面积的水足迹与到各省域单元的距离呈现出显著的负相关,相关系数在-0.53~-0.47之间(P < 0.01),这表明距离因素对虚拟水贸易有一定的影响。受运输难度与费用等因素的影响,在其他条件相似的情况下,虚拟水贸易倾向于在较近距离的区域间发生。图3d显示北京、天津、河北累积输入水足迹占比与虚拟水来源地距离的关系,各省(市)曲线均在对角线之上,再次表明京津冀城市群的消费水足迹总体偏向来源于距离较近的地区。其中由于河北很大一部分消费水足迹来自于本地,其水足迹来源于距离较近区域的偏向最明显,而天津的这种倾向最不明显。北京、天津、河北的消费水足迹距离来源地的平均距离分别为1049 km、1297 km、688 km,河北的消费水足迹距离来源地的平均距离最短。
图3
 新窗口打开|下载原图ZIP|生成PPT
图32010年北京、天津、河北在全国各省域单元单位面积的水足迹及与各其距离的关系
Fig. 3Relations between water footprint intensity provided to Beijing-Tianjin-Hebei region in different provinces and distances in 2010 (a. Beijing; b. Tianjin; c. Hebei; d. cumulative proportions of virtual water as a function of distances)
3.4 京津冀近远程虚拟水贸易分析
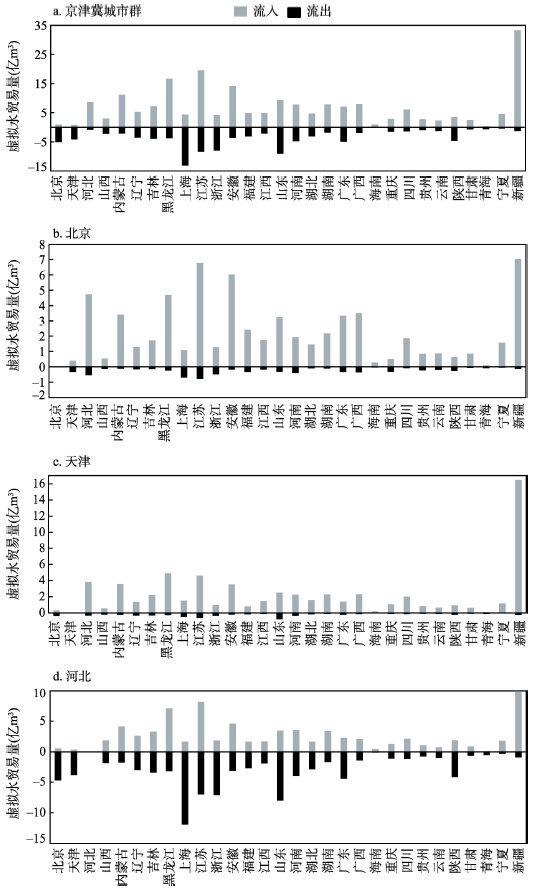
京津冀城市群在消费其他省域单元虚拟水的同时,也通过商品贸易将虚拟水输入到其他省域单元(图4a)。京津冀城市群与北京的虚拟水贸易量代表城市群内部天津、河北两省(市)与北京的虚拟水交换量。京津冀城市群近程虚拟水贸易量为10.2亿m3,为北京、天津、三省(市)之间的贸易总量。远程虚拟水贸易总量为291.3亿m3,其中虚拟水流入、流出量分别为198.5亿m3、92.8亿m3。远程虚拟水贸易量远大于近程。总体而言,京津冀城市群为虚拟水净流入区,虚拟水净流入量为105.7亿m3。在与全国其他省域单元的虚拟水贸易中,京津冀城市群相对于上海、浙江、陕西、青海为虚拟水净流出区,相对于其余23个省域单元为虚拟水净流入区。图4
 新窗口打开|下载原图ZIP|生成PPT
图42010年北京、天津、河北与全国各省域单元水足迹贸易流入流出量
Fig. 4Virtual water inflows and outflows between Beijing-Tianjin-Hebei region and other provinces in China in 2010(a. Beijing-Tianjin-Hebei region; b. Beijing; c. Tianjin; d. Hebei)
图4b、4c、4d分别给出了北京、天津、河北与全国各省域单元的虚拟水贸易情况。北京和天津两地为水足迹的净流入区,河北为水足迹的净流出区,为京津冀及其他省域单元提供水资源供给。北京与天津输出给其他省份的虚拟水量极少,分别为7.5亿m3和6.8亿m3,仅为虚拟水输入量的11.3%和10.3%,净流入量分别为66.2亿m3和66.1亿m3;河北为北京、天津以及其他省份输出了大量的虚拟水,共输出虚拟水88.7亿m3,输入虚拟水76.5亿m3,净输出虚拟水12.2亿m3。北京的虚拟水流出量中,近、远程虚拟水分别占比68.2%和31.8%,其中近程虚拟水包括提供给北京本地的虚拟水;天津的虚拟水流出量中,近、远程虚拟水流出量分别占比57.1%和43.9%;河北的虚拟水流出量中,近、远程虚拟水占比分别为46.3%和53.7%。北京和天津的近程虚拟水输出量大于远程输出量,表明在城镇人口聚集度相当高的北京和天津,投入生产的水资源最终主要在本地被消耗。而河北的远程虚拟水输出量大于近程输出量。在与全国各省域单元的贸易中,北京总是虚拟水净进口省;天津相对于北京是虚拟水净出口省,在与其他省域单元的贸易中,天津总是虚拟水净进口省;在与黑龙江、江苏、湖南、新疆等14省的贸易中,河北是虚拟水净进口省,在与北京、天津、上海、山东等15省的贸易中,河北是虚拟水净出口省。
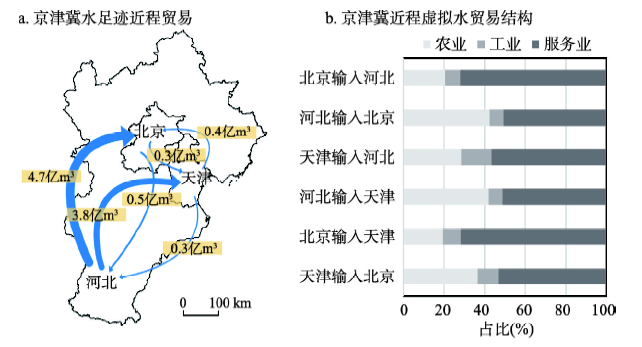
北京、天津、河北三省(市)内部的虚拟水贸易如图5所示。京津冀城市群内部虚拟水的流动呈现出单向的特征,河北提供给北京和天津的虚拟水远高于北京和天津输入给河北的虚拟水,北京与天津居民消费的水足迹极大的依赖于河北省水资源的输入,而向北京与天津虚拟水的净输出进一步加剧了河北的水资源短缺。由于省(市)之间传统分工、资源优势以及区域定位的不同,各省(市)之间虚拟水交换的农业、工业、服务业结构显著不同。河北向北京输入的农业虚拟水占比总虚拟水的42.5%,而北京向河北输入的农业虚拟水仅占比20.6%,可见,河北为北京提供虚拟水密度较大的农业产品,而北京向河北主要输出虚拟水密度较低、附加产值较大的工业及服务业产品。同样,河北向天津输入的农业虚拟水占比大于天津向河北输入的农业虚拟水占比。比较天津与河北的虚拟水交换结构,天津输出给北京的农业虚拟水比例大于输入,北京向天津输入更多的工业与服务业产品。
图5
 新窗口打开|下载原图ZIP|生成PPT
图52010年京津冀城市群水足迹近程贸易及贸易结构
Fig. 5Virtual water trades in Beijing-Tianjin-Hebei region and their structures in 2010
4 结论与建议
4.1 结论
随着中国区域间经济联系的不断加强,虚拟水贸易成为水资源重新配置与布局的重要途径。本文基于2010年全国区域间投入产出表,测算了京津冀城市群与全国各省域单元之间的虚拟水贸易量,从近远程视角分析京津冀城市群虚拟水流动网络与水足迹特征,定量评估了城市群对内、外部水资源的依赖程度。主要结论如下:(1)京津冀城市群内部各省(市)各部门用水系数显现出差异性。农业部门直接用水系数最大,其直接用水系数超过300 m3/万元,完全用水系数超过400 m3/万元,因而节水潜力最高,是未来重点节水部门。
(2)京津冀城市群内部各省(市)人均消费水足迹差异巨大。北京、天津、河北的人均水足迹分别为405 m3、565 m3、191 m3。由于河北省人均消费水平远低于北京与天津,其人均消费水足迹水平也最低。消费水平与用水效率为影响省(市)人均消费水足迹的重要因素。在协同发展的背景下,可以预见河北居民的消费水平将逐步改善,该因素的变化会带来京津冀城市群水足迹的显著增长,从而带来区域水资源压力的增大。
(3)京津冀城市群的消费水足迹遍布全国各省域单元,近、远程水足迹分别为91.4亿m3和198.5亿m3,远程水足迹大于近程水足迹,表明远程水源对于促进京津冀城市群发展的重要性。远程水足迹来源中,西部地区贡献虚拟水的总量最大。近程水足迹中,本地供应超过50%,河北给北京和天津输入的虚拟水远高于北京和天津对河北的输入量。受运输难度与费用等因素的影响,贸易倾向于在较近距离的区域间发生,距离因素对虚拟水贸易有一定的影响。京津冀城市群的虚拟水输入总体偏向来源于距离较近的省域单元。北京、天津、河北的水足迹来源地的平均距离分别为1049 km、1297 km、688 km,河北省的水足迹距离来源地的平均距离最短。
(4)北京和天津为虚拟水的净流入区,对外部水资源的依赖性强;河北为虚拟水的净流出区,为京津冀城市群及其他地区提供水资源供给,进一步加剧了河北的水资源短缺。
4.2 建议
本文从近远程视角讨论京津冀城市群虚拟水贸易与水足迹特征。长期以来,京津冀城市群水资源供需矛盾突出,理解该区域虚拟水贸易现状与水足迹特征是进行虚拟水贸易相关决策以缓解区域水资源短缺、保障区域水资源安全、促进人水系统和谐[37]的重要前提,并为区域产业发展与贸易决策提供科学支持。主要建议如下:(1)京津冀城市群的人均水资源量不足200 m3,但北京与天津人均水足迹远超过人均水资源量。在人口和经济密度大的城镇地区,应充分考虑远程虚拟水贸易对于提高当地水资源承载力的作用。未来在制定京津冀城市群水资源管理策略时,一方面需要利用南水北调水资源的调入为该地区增加直接的水资源供应量,另一方面需充分考虑虚拟水策略,通过远程虚拟水输入缓解京津冀水资源短缺。
(2)河北省为虚拟水的净流出区,在河北实行虚拟水战略,调整用水结构,减少用水密集型农业产品的出口,是未来缓解河北水资源短缺的重要途径。
(3)在社会经济发展水平高且人均水足迹水平也高的北京与天津,应鼓励选择消费虚拟水含量低的产品与服务,如鼓励加工食用雨养农作物,限制洗浴等高耗水行业发展。制定实施合理的虚拟水资源补偿政策(类似生态补偿政策),避免加剧对其他水资源匮乏地区(如河北)的水资源掠夺。
(4)京津冀城市群内部不同部门呈现出不同的用水特征,各地均存在用水效率不高的部门,因此提高用水效率、减少水资源浪费,是京津冀城市群应对水资源短缺的有效途径。升级产业结构、优化用水结构是节水、减少水资源供需压力的重要途径。
参考文献 原文顺序
文献年度倒序
文中引用次数倒序
被引期刊影响因子
DOI:10.18306/dlkxjz.2017.01.003URL [本文引用: 1]

The Beijing-Tianjin-Hebei region is an important population agglomeration area and economic growth pole in China. Research on the coordinated development between population and economy under the backgroud of coordinated development of the Beijing-Tianjin-Hebei region is of great significance for promoting sustainable development of regional economy. Based on the population and GDP of Beijing, Tianjin, and Hebei, this study applied elasticity, geographic concentration index, inconsistency index, and gravity center methods to analyze the coordinated development between population and economy in the Beijing-Tianjin-Hebei region. The results are as follows: (1) The degree of coordination between population growth and economic growth was generally high in the whole region, but differs among the cities. (2) Population and economic activities are concentrated in the southern and central parts of the region while the north was sparsely populated with few economic activities. The economic concentration index values were higher than the population concentration index values in Beijing and Tianjin. The population concentration index values were higher than the economic concentration index values in most cities of Hebei. The population gravity center and economic gravity center both moved towards the northeast of the Beijing-Tianjin-Hebei region, with the economic gravity center displaying a stronger movement momentum. Moreover, the population gravity center of each city in the Beijing-Tianjin-Hebei region deviates from the economic gravity center to different extents. This article also puts forward some policy recommendations for promoting the coordinated development between population and economy.
DOI:10.18306/dlkxjz.2017.01.003URL [本文引用: 1]
The Beijing-Tianjin-Hebei region is an important population agglomeration area and economic growth pole in China. Research on the coordinated development between population and economy under the backgroud of coordinated development of the Beijing-Tianjin-Hebei region is of great significance for promoting sustainable development of regional economy. Based on the population and GDP of Beijing, Tianjin, and Hebei, this study applied elasticity, geographic concentration index, inconsistency index, and gravity center methods to analyze the coordinated development between population and economy in the Beijing-Tianjin-Hebei region. The results are as follows: (1) The degree of coordination between population growth and economic growth was generally high in the whole region, but differs among the cities. (2) Population and economic activities are concentrated in the southern and central parts of the region while the north was sparsely populated with few economic activities. The economic concentration index values were higher than the population concentration index values in Beijing and Tianjin. The population concentration index values were higher than the economic concentration index values in most cities of Hebei. The population gravity center and economic gravity center both moved towards the northeast of the Beijing-Tianjin-Hebei region, with the economic gravity center displaying a stronger movement momentum. Moreover, the population gravity center of each city in the Beijing-Tianjin-Hebei region deviates from the economic gravity center to different extents. This article also puts forward some policy recommendations for promoting the coordinated development between population and economy.
[本文引用: 1]
[本文引用: 1]
DOI:10.11867/j.issn.1001-8166.2015.10.1151.URL [本文引用: 1]
The Beijing-Tianjin-Hebei (BTH) region is an important engine for China’s socioeconomic development. Timely and effectively assessing constraint factors of resources and environment is of great significance for the sustainability assessment and the sustainable development of this region. However, comprehensive assessment research considering key resource and environmental constraints are still lacking. In this study, therefore, the limiting factors of resources and the environment in the BTH region were assessed based on the framework of landscape sustainability science. First, we chose five limiting factors, including topographic condition, geological environment, water resource, land resource, and atmospheric environment, to assess the constraints of resources and the environment using the single-factor evaluation method and the multi-factor comprehensive evaluation method. Based on the results, we divided the whole region into five subregions, i.e., the ecological conservation subregion, the geological disaster subregion, the water resource scarcity subregion, the atmospheric pollution subregion, and the cropland protection subregion. The results revealed that the northern BTH region was highly constrained by topographic conditions, the central BTH region was strongly constrained by geological environment and water resources, whereas the southern BTH region was constrained mainly by land resources and atmospheric environment. In addition, water resource was the main limiting factor for regional population growth and economic development. In 2010, the water resource scarcity subregion had a total population of 39.59 million, an urban population of 76.90%, and a gross domestic product of 2 455.57 billion yuan. We argue that the sustainable development of the BTH region should explicitly consider the resource and environmental limiting factors, implement land use optimization according to local conditions, maintain multiple land use types and diverse management strategies, based on the perspective of “strong sustainability”, so as to promote the regional sustainable development.
[本文引用: 1]
[本文引用: 1]
[本文引用: 1]
[本文引用: 1]
DOI:10.17226/25466URLPMID:31855367 [本文引用: 1]
The correlation between the?presence of HLA-B27 and ankylosing spondylitis has been a known entity since the early 1970s.? Although common in the general population, this allele strongly contributes to the susceptibility of development of the linked family of inflammatory rheumatologic conditions collectively known as spondyloarthritis. Additional associated diseases, particularly acute anterior uveitis, are also highly correlated with possession of HLA-B27. Although associated with spondyloarthritis, the pathologic role of this allele in immune dysregulation remains under investigation. With lower frequency, the presence of the HLA-B27 allele has correlated with inflammatory bowel disease, psoriatic arthritis, and reactive arthritis.
[本文引用: 1]
[本文引用: 1]
DOI:10.1002/(ISSN)1099-1085URL [本文引用: 1]
DOI:10.1007/s11269-006-9051-1URL [本文引用: 1]
Water shortages and related environmental degradation in North China are major issues facing the country. As runoff from the mountainous parts of the region steadily decrease and water resources become overcommitted, serious water and environmental problems have resulted. These include drying-up of rivers, decline in groundwater levels, degradation of lakes and wetlands, and water pollution. Thus, 4000,km of the lower reaches of the Hai River – some 40% of its length – has experienced zero flows and, as result, parts of this river have become an ephemeral stream. The area of wetland within the Basin has decreased from 10,000,km2 at the beginning of 1950s to 1,000km2 at present. Over-extraction of groundwater occurs beneath 70% of the North China Plain, with the total groundwater over-extraction estimated at 90,billion m3. Thus, problems of water shortage and related environmental issues in North China have become the most significant limiting factors affecting sustainable development in this important region of China. This paper addresses the water security issues facing North China in the 21st Century using the Hai River basin as an example. We describe hydrologic cycles under changing environments, water-saving agriculture, assessment of water resource security, and efforts towards achieving integrated catchment management.
DOI:10.1016/j.scitotenv.2017.11.006URLPMID:29161597 [本文引用: 1]
Water availability and water demand are not evenly distributed in time and space. Many mega water diversion projects have been launched to alleviate water shortages in China. This paper analyzes the temporal and spatial features of 59 mega water diversion projects in China using statistical analysis. The relationship between nine major basins is measured using a network analysis method, and the associated economic, environmental and social impacts are explored using an impact analysis method. The study finds the development of water diversion has experienced four stages in China, from a starting period through to a period of high-speed development. Both the length of water diversion channels and the amount of transferred water have increased significantly in the past 50years. As of 2015, over 100billionm3 of water was transferred in China through 16,000km in channels. These projects reached over half of China's provinces. The Yangtze River Basin is now the largest source of transferred water. Through inter-basin water diversion, China gains the opportunity to increase Gross Domestic Product by 4%. However, the construction costs exceed 150 billion US dollars, larger than in any other country. The average cost per unit of transferred water has increased with time and scale but decreased from western to eastern China. Furthermore, annual total energy consumption for pumping exceeded 50billionkilowatt-hours and the related greenhouse gas emissions are estimated to be 48milliontons. It is worth noting that ecological problems caused by water diversion affect the Han River and Yellow River Basins. Over 500 thousand people have been relocated away from their homes due to water diversion. To improve the sustainability of water diversion, four kinds of innovative measures have been provided for decision makers: national diversion guidelines, integrated water basin management, economic incentives and ex-post evaluation.
[本文引用: 1]
[本文引用: 1]
DOI:10.1016/j.jclepro.2015.09.047URL [本文引用: 1]
DOI:10.17226/25466URLPMID:31855338 [本文引用: 1]
Children are the foundation of the United States, and supporting them is a key component of building a successful future. However, millions of children face health inequities that compromise their development, well-being, and long-term outcomes, despite substantial scientific evidence about how those adversities contribute to poor health. Advancements in neurobiological and socio-behavioral science show that critical biological systems develop in the prenatal through early childhood periods, and neurobiological development is extremely responsive to environmental influences during these stages. Consequently, social, economic, cultural, and environmental factors significantly affect a child's health ecosystem and ability to thrive throughout adulthood. Vibrant and Healthy Kids: Aligning Science, Practice, and Policy to Advance Health Equity builds upon and updates research from Communities in Action: Pathways to Health Equity (2017) and From Neurons to Neighborhoods: The Science of Early Childhood Development (2000). This report provides a brief overview of stressors that affect childhood development and health, a framework for applying current brain and development science to the real world, a roadmap for implementing tailored interventions, and recommendations about improving systems to better align with our understanding of the significant impact of health equity.
[本文引用: 1]
[本文引用: 1]
DOI:10.1016/j.jhydrol.2017.08.020URL [本文引用: 1]
DOI:10.1016/j.jclepro.2012.11.007URL [本文引用: 1]
DOI:10.17226/25466URLPMID:31855351 [本文引用: 1]
In the older population, one of the serious health concerns that are associated with comorbidity, impaired functioning, excessive use of health care resources, and increased mortality (including suicide) is a depressive disorder.[1] Depression that occurs among individuals greater than or equal to 65 years with no previous history of depression is known as late-life depression, which is characterized as the affective state of sadness that occurs as a response to various of human situations including loss of a loved one, failing to achieve goals, or disappointment in love relationships. Major depression differs only in the intensity and duration or quality of the emotional state.[2] The Diagnostic and Statistical Manual of Mental Disorders (DSM-5) defines major depressive disorder by the presence of depressed mood or a marked loss of interest or pleasure in activities along with 5 or more of the following associated symptoms: changes in appetite or weight (5% of the total body weight), sleep, energy, concentration, and psychomotor activity, feelings of inappropriate guilt or worthlessness and recurrent thoughts of death or suicide. There should be an impairment in social, occupational, and other areas of functioning. The symptoms of depression should have been present during the last two weeks.[3]?Depression in late-life is underdiagnosed and inadequately treated.?It is a serious and life-threatening disorder which affects every 1 in 5 individual in a lifetime.[4]?When it occurs in old age, it becomes challenging to distinguish it from dementia, as both these diagnoses have overlapping symptom profiles, especially when depression affects the cognition and is presented as ’pseudodementia.’[5]
[本文引用: 1]
[D].
[本文引用: 1]
DOI:10.1016/j.scitotenv.2014.08.094URLPMID:25222751 [本文引用: 1]
With rapid economic development in China, water crisis is becoming serious and may impede future sustainable development. The uneven distribution of water resources further aggravates such a problem. Under such a circumstance, the concepts of water footprint and virtual water have been proposed in order to respond water scarcity problems. This paper focuses on studying provincial disparity of China's water footprints and inter-provincial virtual water trade flows by adopting inter-regional input-output (IRIO) method. The results show that fast developing areas with larger economic scales such as Guangdong, Jiangsu, Shandong, Zhejiang, Shanghai and Xinjiang had the largest water footprints. The most developed and water scarce areas such as Shanghai, Beijing, Tianjin and Shandong intended to import virtual water, a rational choice for mitigating their water crisis. Xinjiang, Jiangsu, Heilongjiang, Inner Mongolia, Guangxi and Hunan, had the largest per GDP water intensities and were the main water import regions. Another key finding is that agriculture water footprint was the main part in water footprint composition and water export trade. On the basis of these findings, policy implications on agriculture geographical dispersion, consumption behavior changes, trade structure adjustment and water use efficiency improvement are further discussed.
DOI:10.1016/j.ecolind.2016.11.037URL [本文引用: 1]
DOI:10.1016/j.jclepro.2017.07.012URL [本文引用: 2]
DOI:10.1002/jobm.201900550URLPMID:31856361 [本文引用: 1]
Fungal biofilm is ubiquitous in natural environment. The major constituent of fungal biofilm other than biomass is the extracellular matrix (ECM), in which fungal hyphae are embedded. Physical properties of biofilms such as attachment, mechanical strength, and antibiotic resistance can be attributed to ECM. The present work probes various stages of biofilm formation by filamentous manglicolous fungus Aspergillus niger BSC-1. The spectroscopic analysis revealed that with an increase in incubation time the biofilm formation was significantly increased (p?<?.0001) up to 36?h. Scanning electron micrograph and confocal micrograph depicted the development of fungal biofilm comprising of six stages, that is, (a) adsorption, (b) active attachment, (c) germling and monolayer formation, (d) hyphal development and formation of ECM, (e) maturation of ECM, and (f) dispersal of spores. At maturation stage, thickness of biofilm was observed upto approximately 15?μm. Approximately, 8.1?mg of ECM materials were extracted from 20?ml of broth culture using ethanol precipitation method. Furthermore, attenuated total reflectance Fourier-transformed infrared spectroscopic analysis exhibited peaks at 3,398, 2,930, 1,571, 1,391, 1,092, 977?cm-1 which confirmed the presence of protein, carbohydrate, and lipid in the biofilm-associated matrix.
DOI:10.1002/(sici)1097-4636(199808)41:2&lt;251::aid-jbm10&gt;3.0.co;2-oURLPMID:9638530 [本文引用: 1]
We report here a novel method for blocking acute platelet deposition at the site of vessel injury by molecularly masking thrombogenic vascular wall proteins with covalently attached polyethylene glycol (PEG). To evaluate this technique, blood containing 111In-labeled platelets was perfused over damaged human placental arteries for 2 min at a wall shear rate of 200 s-1. Denuded vessel segments were incubated for 30, 15, 5, and 1 min with a solution of either reactive PEG-diisocyanate (PEG-ISO) or nonreactive PEG-dihydroxyl (PEG-OH). Vessels treated with PEG-ISO for 1 min exhibited 87 +/- 12% less platelet deposition (p &lt; 0.01) than untreated control vessels, and this reduction did not vary significantly among treatment times, indicating that this reaction occurs rapidly enough to be clinically applicable. To investigate the duration of this thrombotic barrier, denuded pig carotid arteries were treated with reactive PEG-ISO for 1 min, perfused with plasma for 30 min, and then perfused with blood containing radiolabeled platelets. PEG-ISO-treated arteries exhibited 84 +/- 9% less platelet deposition (p &lt; 0.05) than untreated controls. These data demonstrate that damaged arterial surfaces can be rendered resistant to platelet deposition after short contact periods with reactive PEG. Molecular PEG barriers ultimately might find application following vascular procedures to sterically inhibit blood cell interaction with damaged vascular surfaces.
[本文引用: 1]
[本文引用: 1]
[本文引用: 1]
[本文引用: 1]
[本文引用: 1]
[本文引用: 1]
[本文引用: 1]
[本文引用: 1]
DOI:10.1016/j.ecolecon.2014.02.006URL [本文引用: 2]
[本文引用: 1]
[本文引用: 1]
[本文引用: 2]
[本文引用: 2]
[EB/OL]. (
URL [本文引用: 1]
[EB/OL]. (
URL [本文引用: 1]
DOI:10.11849/zrzyxb.2009.02.013URL [本文引用: 1]
DOI:10.11849/zrzyxb.2009.02.013URL [本文引用: 1]
DOI:10.1016/j.jhydrol.2017.08.020URL [本文引用: 1]
DOI:10.17226/25466URLPMID:31855338 [本文引用: 1]
Children are the foundation of the United States, and supporting them is a key component of building a successful future. However, millions of children face health inequities that compromise their development, well-being, and long-term outcomes, despite substantial scientific evidence about how those adversities contribute to poor health. Advancements in neurobiological and socio-behavioral science show that critical biological systems develop in the prenatal through early childhood periods, and neurobiological development is extremely responsive to environmental influences during these stages. Consequently, social, economic, cultural, and environmental factors significantly affect a child's health ecosystem and ability to thrive throughout adulthood. Vibrant and Healthy Kids: Aligning Science, Practice, and Policy to Advance Health Equity builds upon and updates research from Communities in Action: Pathways to Health Equity (2017) and From Neurons to Neighborhoods: The Science of Early Childhood Development (2000). This report provides a brief overview of stressors that affect childhood development and health, a framework for applying current brain and development science to the real world, a roadmap for implementing tailored interventions, and recommendations about improving systems to better align with our understanding of the significant impact of health equity.
[本文引用: 1]
[本文引用: 1]
