 , 李红波, 张安录
Ecological risk assessment based on terrestrial ecosystem services in China
CHENFeng, LIHongbo, ZHANGAnlu通讯作者:
收稿日期:2018-01-15
修回日期:2018-12-10
网络出版日期:2019-03-25
版权声明:2019《地理学报》编辑部本文是开放获取期刊文献,在以下情况下可以自由使用:学术研究、学术交流、科研教学等,但不允许用于商业目的.
基金资助:
作者简介:
-->
展开
摘要
关键词:
Abstract
Keywords:
-->0
PDF (1928KB)元数据多维度评价相关文章收藏文章
本文引用格式导出EndNoteRisBibtex收藏本文-->
1 引言
自然生态系统及其生态过程产生的产品和服务对于维持地球生命支持系统的正常运转至关重要[1],生态系统结构和功能的稳定性是保障人类社会生存和发展的必要条件[2]。迄今,大约1/3到1/2的陆地表面已被人类活动所改变[3],同时引发了一系列负面反馈作用,人类活动的干扰和破坏已经对自然生态系统的自我调节和恢复能力造成了强大的压力和风险[4,5],这种改变可能最终威胁到人类自身在生物圈中的可持续性[6]。管控压力、规避生态风险攸关人类长远发展,是实现人类与自然界和谐共融的重要前提,而这首先就要求针对特定区域在兼顾人与自然充分协调发展的基础上对生态风险进行科学合理的评价。作为表征生态系统在多重压力下受损的不确定性及损失,生态风险密切影响人类福祉,是区域生态建设、环境修复等项目的重要指标[7]。多年以来,生态****侧重于从点源污染的层面模拟各种群、群落的风险评价框架,用以解决濒危动物物种灭绝、外来生物入侵等点源性生态威胁[8,9,10],此后区域生态风险评价逐渐兴起为风险评价研究的一个重要领域[11],它强调评价过程中更加关注压力及受体的空间相对位置关系,将空间因子纳入风险评价体系[12]。传统上人们往往基于景观格局空间异质性在景观尺度上对生态系统及其景观组分变化可能产生的不利后果进行评估,以景观稳定性、通达性、多样性的降低作为评估要素,构建景观格局和生态过程的集成表达[13,14,15]。然而,仅关注景观实体的特征属性割裂了人与自然的耦合关联系统,以人为本的生态理念要求发展相关的生态环境议题应该回溯至提升人类生活质量的本源。近年来,一些研究尝试将生态系统服务纳入生态风险评价框架中,基于生态系统服务的生态风险分析逐渐受到关注[16]。有****认为[12],传统风险评价方法通过单一因子或多因子风险源评估可能的不利影响时,缺乏对空间尺度、多压力因子、多风险受体的有效结合,同时难以兼顾多保护对象的相互关系和诉求。Cirone等[17]研究表明,生态风险评价如果仅仅关注生态实体的保护,则难以构建持续有效的决策支持以降低生态威胁,在此基础上需要加强整合与实体功能属性密切相关的人类福祉——生态系统服务。Galic等[18]分析认为,应用生态系统服务理念解决生态风险分析不仅适用于描述生态系统内部机制关系,同时与人类福祉等外部驱动因素对其如何施加影响产生联系。康鹏等[19]认为纳入联系人类福祉和生态系统过程的生态系统服务进行风险表征可极大提高风险评价的实用与高效性。但从检索文献来看,基于生态系统服务视角进行生态风险分析作概念性和理论探讨的占大多数,定量的风险分析实证案例很少。区域尺度上基于生态系统服务的风险评价实践应用仍有待于进一步发展和完善,这对于弥补传统生态风险评价方法的不足、提高风险管理效率具有重要意义。评价生态系统服务目前应用较为广泛的有物质量评价法、能值分析法、市场价值化方法[20,21,22,23]。传统评价方法以简单的物质、货币总量数字对区域生态系统服务进行表征,对生态系统作为复合功能体的非线性、动态性表达有所缺失[24],反而忽略了其自身在时空尺度上的内在丰富信息,不利于对生态系统的管理决策[25],因而存在诸多局限性[20, 26-27],生态系统服务的地理空间可视化表达及空间制图仍然时常面临着数据稀缺、制图方法的可靠性等重大挑战。目前,在全球、流域等大尺度范围,源于卫星遥感数据的地理—生态过程耦合关联研究在数据获取、时空分析、集成平台等方面发挥着越来越关键的作 用[28,29]。全球尺度上,Sutton等[30]基于卫星遥感影像建立了以生态系统服务和GDP为表征的全球各国生态系统非市场价值及市场价值,从生态学视角为国家尺度上的自然与社会综合发展水平评定提供了新的管理方案;区域或流域尺度上,Gret-Regamey等[31]综合GIS模型评估了欧洲阿尔卑斯地区的生态系统服务价值,帮助决策者更好地平衡不同计划选项的区域经济核算方案,从而指导制定可持续性和经济适用的发展战略。源于遥感数据的生态系统服务空间可视化表达在高效、动态、快速、范围广泛等方面具有显著优越性,并能有效地发挥传统方法不能解决的空间异质性、长期动态变化监测等优势。
尽管国内外已就生态系统服务的评估和应用开展了大量研究工作,但尚未形成统一的评估体系[32,33],其定量化水平仍有待提高;同时相关生态学新兴研究领域大量涌现,尤其是生态风险评价已经越来越关注与人类福祉息息相关的生态系统服务[19]。因此,面对现有评价方法的局限性和交叉领域的议题诉求,纳入生态系统服务作为生态风险监测的评判依据,对于增强生态系统服务评价的实用性及效用性、构建国家在生态风险识别领域的预防管控机制以及推动生态系统生态学的生产实践应用具有重要意义。本文运用GIS和遥感技术重构了中国陆地生态系统服务的空间图谱,采用生态风险分析模型给出了基于生态系统服务的中国陆地生态风险格局的定量描述和空间分布,划定了不同置信水平下的生态风险管控优先区,对于加强关键区域的生态保护措施、构建风险管控机制提供一定参考。
2 研究方法与数据来源
传统上的区域生态风险评价通常以景观格局变化特征为指标,通过建立生态风险识别体系,综合构建风险评价指数进行分析[34]。本文引入生态系统服务变化特征,采用层次分析法计算各主要生态系统服务指标,并建立反映总生态系统服务变化的综合指数,通过生态风险分析模型,构建基于生态系统服务的生态风险指数,计算每个评价单元的像元值定量的反映生态系统风险状况。2.1 生态系统服务评估技术
生态系统服务评估技术大致可分为模型评价法和NPP定量指标法[35]。众多生态生理模型被用于评估预测区域生态系统服务,如BEPS、CASA、BIOME-BGC模型广泛用于植被净初级生产力(NPP)的模拟[36,37,38],SWAT水量平衡模型用于评估水源涵养和水文调节服务[39],USLE、RUSLE、WEPP模型用于评估土壤保持服务[40,41],生态系统服务及其变化特征的模型模拟在流域、区域尺度上已有较多应用,但模型参数的获取严重依赖当地实测值及较长周期的观测实验,限制了其在全国尺度的进一步推广。NPP指植被在光合作用条件下固定在植被体内的净碳量,NPP定量指标法主要基于NPP数据,结合相关参数,直接或间接的依据相关算法求得各项生态系统服务的模拟值。de Groot等[42]的研究证实一系列生态系统服务与陆地覆盖的生物量数量具有直接关联,而NPP是用于表征生物量数量的重要指标;MEA[43]的研究表明,生态系统服务中与水供应(FPRE)有关的服务(水资源供给、水文调节)随陆地生态系统中水体覆盖的景观比例变化而改变。以NPP和FPRE为主要数据源结合环境变量参数建立关系模型可表征一系列生态系统服务,在国内外相关研究中得到实证应用。Paula等[44]通过建立NPP、FPRE和环境因子的关系等式分析了阿根廷南部草原的生态系统服务变化与土地利用的关系。张立伟等[45]利用NPP与环境变量因子建立的因果关系模型提出了生态系统服务保护的优先性分级。相较于传统模型法,NPP定量指标法所需参数较少,易于操作,且所需数据主要来源于卫星遥感数据,覆盖广泛且时间分辨率较高,无疑更适用于模拟长时间序列、较大尺度的生态系统服务空间定量化评估。本文基于此法模拟了中国范围内所提供的主要生态系统服务。2.1.1 植被固碳服务 固碳服务是指植被通过光合作用合成有机碳的过程,是自然界一切食物、原料的基本来源,也是维持大气二氧化碳含量稳定、促进生态平衡的重要服务源。植被固碳服务能力与NPP和NPP稳定性具有直接关联,计算式为:
式中:
2.1.2 水土保持服务 生态系统具有水土保持功能,它是在水土保持过程中保护和改良人类赖以生存的自然环境条件的综合效用。生态系统类型及其地理特征密切影响水土保持功能的强弱,水土保持服务的测定有如下公式:
式中:
2.1.3 水源供给与涵养服务 水源供给与涵养服务对陆地生态系统的功能主要体现在保水、蓄积、调节径流、净化水质等方面,它是自然界生态系统调节雨量平衡、促进生态健康的重要服务功能。降雨、生态系统类型、地质环境等要素均与该服务有显著关联,公式如下:
式中:
2.1.4 生物多样性保护服务 生物多样性保护服务是生态系统对于生物及它们所构成的系统的总体多样性和变异性具有维持、保护能力。生物多样性服务具有消费、生产等直接使用价值及保护基因库、生态旅游等众多间接价值,它对于保存地球上珍贵的生物资源具有重要的战略意义。生物多样性保护服务能力可用下式进行评价:
式中:
计算过程中,所用数据包含气象数据、地形数据、遥感数据、土壤数据等分别来源于国家气象科学数据共享服务平台、地理空间数据云、美国NASA数据及产品中心、寒区旱区科学数据中心等数据平台,像元的空间分辨率为1 km。公式中各因子的具体含义及算法详见环境保护部《生态保护红线划定技术指南》[35]、文献[44]、文献[46]。
2.2 总生态系统服务指数评价
区域范围内所有生物群落所提供生态系统服务的总价值大小代表着区域总生态系统服务水平。作为一种新兴概念实体,生态系统服务在过去多年中主要以货币作为中间媒介,通过构建各服务指标和市场价值的比例关系,以加法、等权结构进行区域总服务的合成计算[25]。以这种结构特点合成的总生态系统服务不仅会导致各具体指标的数值替补性,而且有可能出现数据冗余;同时引入货币作为中间媒介,生态系统服务和货币数值关系的构建本身也带来合成结果的不确定性。本文关注的是各生态系统服务指标的均衡性问题,应当认为,无论是固碳服务、水土保持服务,还是水源供给与涵养服务、生物多样性保护服务,这些服务之间的均衡性不应当被忽略,作为所提供的人类福利,各项服务自身相互依存、相互联系,固碳服务为其余生态系统服务提供原料资本,水土保持服务、水源涵养与供给服务之间的增减互为相关,生物多样性服务的丰富与完善同时又是其它服务良好的重要体现。区域生态系统服务的充分提高应当是所有服务指标平衡发展的结果,当其中一项或某些生态系统服务存在明显短板时,势必会影响区域生态福利的整体协调性与持续改善,妨碍决策的有效制定和执行,显然传统的总生态系统服务合成法并未考虑生态系统内部之间的联系和均衡。基于此,本文在回顾、参考相关合成算法的基础上,提出一种区域生态系统服务的综合指数计算法,以期弥补传统方法的不足并对生态系统服务的内涵更具包容性。Foster等[47]在测量人类发展分布的研究中,顾及各指标的均衡性及空间分布的敏感性,提出了一套基于转移准则的广义均值计算方法论,并将其应用于评价墨西哥人口健康、教育、预期寿命等人类发展指标状况。所谓转移准则,是一种用于判别统计指标是否具有分布敏感性的标准,一般可以解释为,对于一个非负数据序列
各类型生态系统服务指标具有显著的空间分布敏感性,满足转移准则,例如区域降雨量的空间变化引起水源供给服务能力的分布改变,进而发生数值转移,而这种分布的改变则足以导致区域总生态系统服务的结果变化。以此为准则,基于广义均值形式合成区域总生态系统服务不仅可以反映各类生态系统服务指标本身的分布敏感性,并有利于降低不同指标间的数值替代,判别它们间的发展是否相互均衡,因为区域生态系统服务的整体优异表现需要所有服务指标都表现良好,而广义均值的乘法结构可以使任意一种服务短板可以直接反映在总服务指数中。因此,顾及各服务指标的联系和均衡性,本文根据像元的广义均值计算法,建立生态系统服务的总指数合成,首先在尽可能小的地域内取得各生态系统服务指标,作标准化指数处理,接着求取全国所有地区的
式中:
2.3 生态系统服务风险分析模型
生态风险分析是对生态系统的不确定性风险及其可能遭受损失的定量化分析。这里生态风险定义为在给定的时间水平和置信区间内,生态系统服务在未来一定时间内的预期可能损失值。在规模尺度上利用生态系统服务进行风险分析还鲜有开展,基于生态风险分析模型进行计算,可将暴露于风险中的生态指标直观的作数字化、空间化映射,便于生态系统的风险管理和决策。这里基于生态系统服务变化构建生态风险分析的EVR(Ecological Value at Risk)模型[49],它是在金融系统风险分析的基础之上建立的生态风险模型[50,51],借此对人类大规模活动下生态系统可能遭受的影响进行定量评价。当生态系统服务的供应不能满足于人们的需求时,即人们生产、生活所消耗的生态产品和服务超过了自然生态系统的供应阀值,那么此时的生态系统被认为是暴露于风险之中。由于人类对生态系统服务的消耗会随着社会的发展水平作相应变化,因此生态风险也被认为不是一成不变的,它需要根据历史数据作动态预测。
为了设定并计算EVR值,以一定时间一定区域范围内所有生物群落提供的生态系统服务总价值定义供给价值,以历年不同年份间总生态系统服务的损失值定义风险价值,以风险价值和供给价值的比值定义生态风险指数,公式为:
式中:
以
式中:
假设生态系统服务风险值是随机变量且服从正态分布,
给定置信水平
式中:
2.4 其他分析方法
一元线性回归趋势线方法可以通过解析像元值大小反映不同时期的像元值变化趋势特征[52],采用该方法分析中国陆地生态系统2000-2010年间每个栅格生态系统服务的变化趋势:式中:
根据上述方法计算中国陆地生态系统的总生态系统服务指数及其生态风险指数,基于ArcGIS平台对求得的风险数值按照风险程度的高低进行分级处理,采用Quantile分级法,分为5个等级:极轻度风险、轻度风险、中度风险、重度风险、极重度风险。
3 结果与分析
3.1 中国陆地生态系统服务的时空演化分析
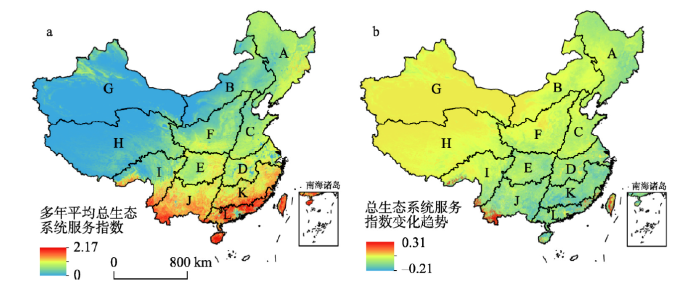
生态地理区划是在自然地理系统研究的基础上,引入生态学理论和方法对自然生态相似区域进行整合分区,划分出的生态环境区域单元。徐继填等[53]依据相对一致性、主导生态系统、区域生态系统共轭性等原则,将全国划分为12个一级生态区划,区划结果保留了县级行政区的完整性,并与中国地貌轮廓三级阶梯呈现良好关联性。本文参考该生态地理区划方案,将全国划分为东北平原生态区(A)、内蒙古高原生态区(B)、华北平原生态区(C)、长江中下游平原生态区(D)、四川盆地生态区(E)、黄土高原生态区(F)、西北内陆生态区(G)、青藏高原生态区(H)、横断山生态区(I)、云贵高原生态区(J)、江南山地丘陵生态区(K)、东南沿海丘陵生态区(L)。分析表明,2000-2010年间中国陆地多年平均总生态系统服务呈现明显的空间分异格局(表1、图1),基本特点是南高北低、东高西低,沿西北向东南一带逐渐递增,总生态系统服务指数取值在0~2.17,平均值约为0.37。分区来看,平均总生态系统服务指数从高到低依次为东南沿海丘陵生态区、云贵高原生态区、江南山地丘陵生态区、四川盆地生态区、长江中下游平原生态区、东北平原生态区、华北平原生态区、横断山生态区、黄土高原生态区、内蒙古高原生态区、青藏高原生态区、西北内陆生态区。总体上台湾中东部、粤闽等东南沿海丘陵地带以及云贵高原西南河谷区由于光热资源丰富,气候适宜,植被类型以常绿阔叶林、季雨林、热带雨林为主,供应的生态系统服务在全国占有较高水平,总生态系统服务指数达到0.9以上,而青藏高原和新疆西北内陆区气候干旱恶劣,植被稀疏、荒漠密布,平均指数值不足0.1。从变化趋势及显著性检验结果来看,全国陆地生态系统服务年际间呈现小幅波动趋势,年平均总指数在0.30~0.57之间变化,其中24.7%的区域显著增加,主要分布在台湾、云贵高原及新疆西北内陆区,37.1%的区域显著减少,主要分布在东北、青藏高原及中东部地区。结合土地利用变化数据来看,这主要是由于21世纪初10年间中国中东部地区快速的工业化、城镇化使得林地、草地等土地类型大量转化为人工用地,植被覆盖有所降低,减弱了生态系统服务的供应,而台湾、云贵高原地区的植被覆盖率始终维持在较高水平,加之退耕还林、还草等生态工程的有序实施,一定程度上改善生态环境,使得生态系统服务指数有所增长。
Tab. 1
表1
表12000-2010年中国陆地各生态地理区划的生态系统服务指数特征
Tab. 1Characteristics of ecosystem services index of different eco-regions in China from 2000 to 2010
| 生态地理区划 | 多年平均总生态 系统服务指数均值 | 总生态系统服务指数变化趋势均值 |
|---|---|---|
| 东北平原生态区(A) | 0.522 | -0.026 |
| 内蒙古高原生态区(B) | 0.224 | -0.010 |
| 华北平原生态区(C) | 0.492 | -0.020 |
| 长江中下游平原生态区(D) | 0.633 | -0.031 |
| 四川盆地生态区(E) | 0.658 | -0.030 |
| 黄土高原生态区(F) | 0.423 | -0.014 |
| 西北内陆生态区(G) | 0.048 | -0.001 |
| 青藏高原生态区(H) | 0.091 | -0.004 |
| 横断山生态区(I) | 0.482 | -0.016 |
| 云贵高原生态区(J) | 0.947 | -0.029 |
| 江南山地丘陵生态区(K) | 0.922 | -0.043 |
| 东南沿海丘陵生态区(L) | 1.132 | -0.032 |
新窗口打开
 显示原图|下载原图ZIP|生成PPT
图12000-2010年中国陆地生态系统服务指数时空格局
-->Fig. 1Spatio-temporal change pattern of ecosystem services index in China from 2000 to 2010
-->
3.2 基于生态系统服务的中国陆地生态风险状况
根据中国陆地生态系统服务时空演化格局分析得到历年平均总生态系统服务指数的统计特征(表2),其中平均总生态系统服务指数变化率的期望Tab. 2
表2
表2中国陆地历年平均生态系统服务指数数值统计
Tab. 2Statistics of average ecosystem services index in China over the years
| 年份 | 平均生态 系统服务指数 | 平均生态系统 服务指数变化率(%) | 平均生态系统 服务指数变化率期望(%) | 平均生态系统服务 指数变化率标准差(%) |
|---|---|---|---|---|
| 2000 | 0.423 | -1.147 | 18.87 | |
| 2001 | 0.372 | -12.06 | ||
| 2002 | 0.415 | 11.56 | ||
| 2003 | 0.574 | 38.31 | ||
| 2004 | 0.343 | -40.24 | ||
| 2005 | 0.332 | -3.21 | ||
| 2006 | 0.315 | -5.12 | ||
| 2007 | 0.335 | 6.35 | ||
| 2008 | 0.332 | -0.90 | ||
| 2009 | 0.297 | -10.54 | ||
| 2010 | 0.310 | 4.38 |
新窗口打开
Tab. 3
表3
表3中国陆地不同置信水平下的生态系统服务风险指数
Tab. 3Risk index at different confidence levels based on ecosystem services in China
| 置信水平(%) | 1-α对应 分位数 | 生态系统服务 最大损失值(%) | 生态风险 指数 |
|---|---|---|---|
| 99 | -2.326 | 42.19 | 0.433 |
| 95 | -1.645 | 31.04 | 0.322 |
| 90 | -1.282 | 24.19 | 0.253 |
| 85 | -1.036 | 19.55 | 0.207 |
| 80 | -0.842 | 15.89 | 0.170 |
新窗口打开
结果表明,在不同的置信水平下,中国陆地生态系统服务均存在一定的可能最大损失值,如当置信水平为90%时,总生态系统服务指数的可能损失比例为24.19%,此时的生态风险指数为0.253,即未来一年中国生态系统服务最大损失所占百分比不超过24.19%的概率是90%,此时预期的生态系统服务风险比例为25.30%。根据该结果,可以通过获取次年生态系统服务的风险损失定量水平,对未来预期的生态系统服务作合理有效的管控和预测。通过置信水平和生态风险指数间的关系比较,当置信水平较高时,生态系统服务蒙受风险的概率相应降低,但此时出现风险时所承受的损失也逐渐增加,因此需要权衡风险概率及其预期损失的相互影响,在风险可控的手段下保障自然生态系统服务的有效供应,降低生态系统的可能风险,最大化生态系统服务效益。
3.3 基于生态系统服务的中国陆地生态风险管控优先区分析
对中国陆地生态系统的风险状况进行具体分析,以90%置信水平为例,得到生态系统服务风险指数的空间分布(图2)及不同生态地理区划的生态风险特征值(表4)。分析表明,全国生态系统服务风险指数空间分异显著,各生态分区的风险等级所占面积比例差别较大,重度、极重度风险区域主要分布在东北平原生态区、内蒙古高原生态区、华北平原生态区、黄土高原生态区、青藏高原生态区、横断山生态区,东南部生态区则整体上风险指数较低,尤其是云贵高原西南一带、台湾地区基本上为极轻度风险生态区。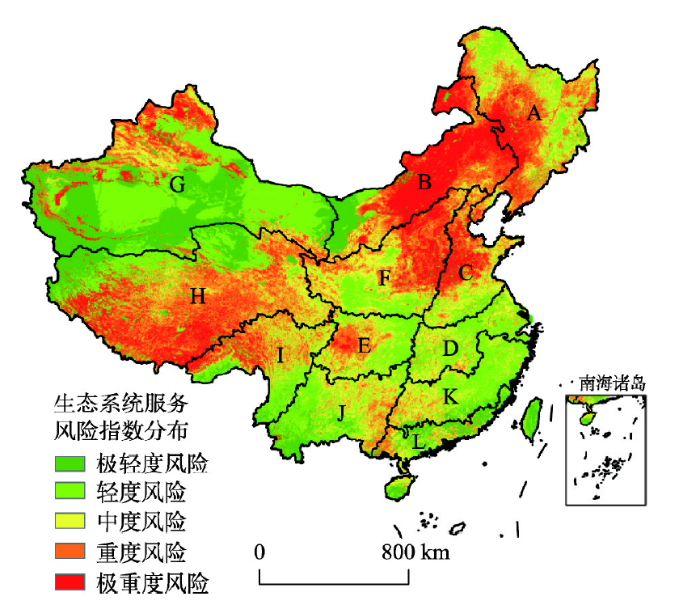 显示原图|下载原图ZIP|生成PPT
图2中国陆地生态系统服务风险指数空间分布
-->Fig. 2Spatial distribution of risk index based on ecosystem services in China
-->
Tab. 4
表4
表4中国陆地各生态地理区划的风险指数特征
Tab. 4Risk index characteristics of different eco-regions in China
| 生态地理区划 | 平均生态系统 服务风险指数 | 各等级风险所占面积百分比(%) | ||||
|---|---|---|---|---|---|---|
| 极轻度 | 轻度 | 中度 | 重度 | 极重度 | ||
| 东北平原生态区(A) | 0.374 | 0.51 | 19.55 | 28.52 | 30.80 | 20.62 |
| 内蒙古高原生态区(B) | 0.447 | 11.99 | 2.75 | 7.75 | 21.62 | 55.89 |
| 华北平原生态区(C) | 0.390 | 0.31 | 21.10 | 29.54 | 22.42 | 26.63 |
| 长江中下游平原生态区(D) | 0.295 | 1.07 | 60.32 | 31.41 | 3.99 | 3.21 |
| 四川盆地生态区(E) | 0.333 | 0.18 | 37.49 | 34.11 | 21.82 | 6.4 |
| 黄土高原生态区(F) | 0.384 | 0.30 | 20.89 | 28.02 | 26.44 | 24.35 |
| 西北内陆生态区(G) | 0.233 | 51.16 | 22.74 | 6.54 | 10.39 | 9.17 |
| 青藏高原生态区(H) | 0.347 | 21.56 | 11.43 | 13.35 | 28.54 | 25.12 |
| 横断山生态区(I) | 0.357 | 1.51 | 32.16 | 25.17 | 22.46 | 18.70 |
| 云贵高原生态区(J) | 0.308 | 0.94 | 47.80 | 35.02 | 14.18 | 2.06 |
| 江南山地丘陵生态区(K) | 0.290 | 1.41 | 57.14 | 31.64 | 8.68 | 1.13 |
| 东南沿海丘陵生态区(L) | 0.323 | 1.20 | 41.18 | 36.90 | 16.17 | 4.55 |
新窗口打开
进一步看,中国陆地平均生态系统服务风险指数居前列的六位依次为内蒙古高原生态区(0.447)、华北平原生态区(0.390)、黄土高原生态区(0.384)、东北平原生态区(0.374)、横断山生态区(0.357)、青藏高原生态区(0.347),极重度风险所占面积比例超过15%的区域依次为内蒙古高原生态区(55.89%)、华北平原生态区(26.63%)、青藏高原生态区(25.12%)、黄土高原生态区(24.35%)、东北平原生态区(20.62%)、横断山生态区(18.70%)。综合来看,处于中国地貌轮廓一级台阶的青藏高原地区海拔大都较高,达至4000 m以上,气温较低,气候条件极其恶劣,生态系统生产力水平也极低,生态系统服务极易随自然环境的恶化而受损,中度以上风险所占面积比例约53.66%,属于生态风险高值区;而紧邻青藏高原东侧的横断山生态区毗邻中国地貌轮廓一二级阶梯的分界线,多为海拔4000 m左右的高原和盆地,这些区域气候恶劣,多数地区山势陡峻、切割强烈,降雨量严重偏低,同时山地灾害频繁,种植结构单一,生态系统服务供应水平明显偏低,中度以上风险所占面积比例约41.16%,生态风险指数同样较高;黄土高原位于中国地貌轮廓的二级阶梯,大部分属于海拔2000 m左右的山地、丘陵,区域内植被覆盖率低、地表坡度较高,是中国水土流失最严重、生态环境最脆弱的地区之一,水土流失引起生态环境恶化、土壤肥力下降,引发一系列生态灾害,严重威胁生态系统服务的供给能力,中度以上风险所占面积比例约50.79%,也是生态风险指数高值区;内蒙古高原位于二级阶梯内,海拔约1000 m以上,属于干旱、半干旱生态区,生态系统结构类型以天然林、草地为主,其中西部地区气候干燥,为干草原、荒漠草原、荒漠,植被覆盖率相对较低,土地荒漠化等生态问题严重影响了区域生态系统服务的供给,约55.89%的土地面积处于极重度生态风险;处于第三阶梯的东北平原及华北平原生态区也是生态风险指数较高的地区,中度以上风险所占面积比例分别为51.42%、49.05%,东北平原由于受季风影响,属于寒温带湿润、半湿润生态区,其耕地生产力水平处于中低等水平,水土流失、土壤盐渍化、荒漠化等生态环境问题较为复杂,且区域草地植被、天然湿地退化严重,威胁了生态系统服务的有效供应,华北平原植被净初级生产力处于中低水平,水资源匮乏,是中国大气污染和水污染最严重的区域之一,人为的干扰和破坏造成区域生态系统调节能力减弱,是华北平原生态系统服务供应不足的重要原因。
综上,青藏高原生态区、横断山生态区、黄土高原生态区、内蒙古高原生态区、东北及华北平原生态区由于平均生态风险指数较高,同时重度、极重度风险所占面积比例也较高,是中国生态风险管控的优先区域,因此应加强对上述区域的生态系统服务供应水平实时有效监测,可结合风险指数的空间分布和变化趋势针对具体区划范围制定相应的风险管控政策措施,完善生态保护区的划定和管理,保障区域生态系统服务的正常供给,维护生态系统效益。
4 讨论
本文以NPP定量指标法为基础,通过评估对于生态风险管控极为重要的四类主要的生态系统服务,顾及各指标的联系和均衡,基于生态系统服务的总指数合成法重构了中国陆地生态系统服务的空间图谱,并以合成的总指数数据特征为依据,建立了基于生态系统服务的中国陆地生态风险指数空间分布,根据各生态地理区划所受外部干扰强弱和内部抵抗力的不同,以区域生态系统服务的动态变化对自然和人为风险源进行综合反映。总的来看,本文采用的方法虽然没有给出衡量区域生态系统服务供给的具体物质量或货币量价值,而是旨在通过平衡对人类生产生活十分重要且不可或缺的每一类生态系统服务,建立可以反映区域生态系统服务综合发展水平的高低序列,并以总生态系统服务指数变化率导入生态风险分析模型对生态系统所面临的不确定性风险给出定量描述,其优势在于更好的平衡了不同生态系统服务类型的权重,并且精确的给出了生态系统产出型服务的变化,回避了传统的生态系统服务计算模型中常忽略生态负面效应而难以进行风险估算的问题。这对于探索卓有成效的生态风险评价的方法、把握中国国家尺度上的生态风险状况、权衡与协同生态系统服务与人类活动之间的关系具有重要的应用价值。但是,受数据源和工作量所限,本文仅选取了2000-2010年时间段进行生态系统服务的风险评价研究,其时代背景具有一定特殊性和历史局限性,风险模型的评价中只讨论了当研究对象呈现正态分布规律时的计算方法和模型,未来应当进一步加大所研究时间年限及历史数据资料的检验工作,从而获得更加准确的生态系统服务特征统计规律及其风险指数分布规律。
5 结论
(1)2000-2010年,中国陆地多年平均总生态系统服务指数取值在0~2.17间,年际间呈现小幅波动趋势,年平均总指数在0.30~0.57之间变化,其中24.7%的区域显著增加,主要分布在台湾、云贵高原及新疆西北内陆区,37.1%的区域显著减少,主要分布在东北、青藏高原及中东部地区。减少区主要是由于林地、草地等地类大量转化为人工用地而导致植被覆盖率降低,增长区主要是由于区域的植被覆盖始终维持较高水平以及退耕还林、还草等生态工程对生态环境的改善。(2)在不同的置信水平下,中国陆地生态系统服务均存在一定的可能最大损失值,当置信水平为90%时,总生态系统服务指数的可能损失比例为24.19%,生态风险指数为0.253。比较置信水平和生态风险指数间的关系,发现当置信水平较高时,生态系统服务蒙受风险的概率相应降低,但此时出现风险时所承受的损失也对应增加。
(3)以90%置信水平为例,中国各生态地理区划的风险特征表现为:平均生态系统服务风险指数居前列的六位依次为内蒙古高原生态区、华北平原生态区、黄土高原生态区、东北平原生态区、横断山生态区、青藏高原生态区,极重度风险所占区域面积比例依次为55.89%、26.63%、24.35%、20.62%、18.70%、25.12%。
The authors have declared that no competing interests exist.
参考文献 原文顺序
文献年度倒序
文中引用次数倒序
被引期刊影响因子
| [1] | . |
| [2] | . Society needs a quantitative and systematic way to estimate and compare the impacts of environmental problems that affect large geographic areas. This paper presents an approach for regional risk assessment that combines regional assessment methods and landscape ecology theory with an existing framework for ecological risk assessment. Risk assessment evaluates the effects of an environmental change on a valued natural resource and interprets the significance of those effects in light of the uncertainties identified in each component of the assessment process. Unique and important issues for regional risk assessment are emphasized; these include the definition of the disturbance scenario, the assessment boundary definition, and the spatial heterogeneity of the landscape. |
| [3] | . Human alteration of Earth is substantial and growing. Between one-third and one-half interact with the atmosphere, with aquatic of the land surface has been transformed by human action; the carbon dioxide con- systems, and with surrounding land. Morecentration in the atmosphere has increased by nearly 30 percent since the beginning of over, land trallsformation interacts strongly the Industrial Revolution; more atmospheric nitrogen is fixed by humanity than by all with most other components of global ennatural terrestrial sources combined; more than half of all accessible surface fresh water rironmental change. is put to use by humanity; and about one-quarter of the bird species on Earth have been The measurement of land transformadriven to extinction. By these and other standards, it is clear that we live on a human- tion on a global scale is challenging; changdominated planet. es can be measured more or less straightforwardly at a eiven site, but it is difficult to aggregate these changes regionally and globallv. In contrast to analvses of human al-A11 organisms modify their environment, reasonably well quantified; all are ongoing, teraiion of the global carbon cycle, we and humans are no exceotion. As the hu- These relativelv well-documented changes cannot install instruments on a tro~ical man population has and the power of in turn entrail; further alterations to;he mountain to collect evidence of land tians-technology has expanded, the scope and f~~nctioning of the Earth system, most no- formation. Remote sensing is a most useful |
| [4] | . Global environmental change and sustainability science increasingly recognize the need to address the consequences of changes taking place in the structure and function of the biosphere. These changes raise questions such as: Who and what are vulnerable to the multiple environmental changes underway, and where? Research demonstrates that vulnerability is registered not by exposure to hazards (perturbations and stresses) alone but also resides in the sensitivity and resilience of the system experiencing such hazards. This recognition requires revisions and enlargements in the basic design of vulnerability assessments, including the capacity to treat coupled human-environment systems and those linkages within and without the systems that affect their vulnerability. A vulnerability framework for the assessment of coupled human-environment systems is presented. |
| [5] | . AbstractUrbanization is a common development trend of countries all over the world, which is a mark of civilization and progress of human beings. The number of urbanization-induced environmental geological hazards has grown steadily in recent years and is receiving increased attention throughout the world. The purpose of this paper is to generalize China urbanization process and induced environmental geological hazards. Driving forces and characteristics of urbanization are briefly introduced in this study; specifically, the distribution of urban agglomerations is principally related to water resources, transportation and energy. Common geological hazards and particular ones in mountain city, mining city and coastal city are also summarized. The type and severity of hazards are different due to the differences of natural conditions and various urban functions. Main environmental geological hazards in cities are land subsidence, landslide and seawater intrusion, etc. Accordingly, reasons for these urbanization-induced geological hazards in different type of cities are analyzed and discussed. The research results may provide a clear perspective for urban geological hazard prevention, and suggestions for urban geological hazard control are pointed out. |
| [6] | . 面向全球城市化进程的快速推进与生物圈环境变化的不断增强,生态风险评价能够明晰制约区域生态持续性的主要生态要素与过程,成为当前自然地理学与宏观生态学应对社会—生态系统综合管理的热点研究领域之一。景观生态学高度关注空间异质性及景观格局—过程互馈,景观生态风险评价则为这一领域提供了新的研究视角。本文明确界定了景观生态风险评价的概念内涵,系统梳理了景观生态风险评价与生态风险评价、区域生态风险评价的异同;从评价对象的类型选择、评价单元的景观意义表征、评价方法的范式统一、评价模型的指数化途径和评价指标权重设定等方面,探讨了国内外景观生态风险评价的近今进展;同时,研究还展望了景观生态风险评价的重点发展方向,即基于景观过程的生态内涵明晰、尺度推绎在风险评价中的应用、评价结果的不确定性分析、耦合非线性生态模型的风险阈值判定、生态系统服务及其价值的整合、源汇景观过程识别与模型综合集成。 . 面向全球城市化进程的快速推进与生物圈环境变化的不断增强,生态风险评价能够明晰制约区域生态持续性的主要生态要素与过程,成为当前自然地理学与宏观生态学应对社会—生态系统综合管理的热点研究领域之一。景观生态学高度关注空间异质性及景观格局—过程互馈,景观生态风险评价则为这一领域提供了新的研究视角。本文明确界定了景观生态风险评价的概念内涵,系统梳理了景观生态风险评价与生态风险评价、区域生态风险评价的异同;从评价对象的类型选择、评价单元的景观意义表征、评价方法的范式统一、评价模型的指数化途径和评价指标权重设定等方面,探讨了国内外景观生态风险评价的近今进展;同时,研究还展望了景观生态风险评价的重点发展方向,即基于景观过程的生态内涵明晰、尺度推绎在风险评价中的应用、评价结果的不确定性分析、耦合非线性生态模型的风险阈值判定、生态系统服务及其价值的整合、源汇景观过程识别与模型综合集成。 |
| [7] | . This paper reviews state-of-the-art models developed for ecological risk assessment and presents a system-oriented perspective for holistic risk evaluation and management. Ecological risk assessment (ERA), which is aimed at appraising a wide range of undesirable impacts on ecosystems exposed to a possible eco-environmental hazard, has been highly recommended for environmental decision-making. The existing system-based eco-risk models at different levels of hierarchical organization are reviewed, including food web-based models, ecosystem-based models and socio-ecological models are reviewed. Based on this inspection, an integrated framework characterizing problem formulation, risk characterization and risk assessment is depicted to illumine future ecological risk assessments. The possibility of integrating the various ERA modeling systems is addressed through examining the interconnections between models shown within the context of our diagrams. Furthermore, some refinements of the current system-level techniques are proposed to meet the requirements of risk evaluation in a holistic and regulatory context. We conclude that assessing ecological risk by using system-based models at different levels of organization in a combined way is an evolutionary step for the application of risk evaluation in environmental management. |
| [8] | . Ecological risk assessments evaluate the likelihood of adverse ecological effects caused by stressors related to human activities such as draining of wetlands or release of chemicals. The term stressor is used to describe any chemical, physical, or biological entity that can induce adverse effects on ecological components (i.e., individuals, populations, communities, or ecosystems). In this review article, a historical perspective on ecological risk assessment activities at the U.S. Environmental Protection Agency (EPA) is followed by a discussion of the EPA's Framework Report, which describes the basic elements for conducting an ecological risk assessment. The Framework Report is neither a procedural guide nor a regulatory requirement within the EPA. Rather, it is intended to foster a consistent approach to ecological risk assessments within the Agency, identify key issues, and define terminology. |
| [9] | . The aim of this study was to study ecological risk assessment of trace elements (As, Cd, Cr, Cu, Ni, Pb and Zn) in zmit Bay surface sediments in the <63 m fraction. Sediment samples were collected from 8 sites along the north coastline of the bay. Samples were subjected to a total digestion technique and analyzed for major (organic carbon) and minor (As, Cd, Cr, Cu, Ni, Pb and Zn) elements. Sediments heavily contaminated are evaluated by the Sediment Quality Guidelines (SQG) of US EPA. The degree of contamination ( C d) is estimated as very high at each site. Two sets of SQGs, effect range-low/effect range median values and TEL/probable effect level (PEL) values were used in our study. Sediments from the each site are judged toxic when two or more of the PEL values exceed EPA guidelines. Our results are in agreement with previously reported sediment toxicity test results. |
| [10] | . <p>生态风险评价是伴随着环境管理目标和环境观念的转变而逐渐兴起并得到发展的一个新的研究领域,它区别于生态影响评价的重要特征在于其强调不确定性因素的作用,区域生态风险评价所涉及的风险源以及评价受体等都在区域内具有空间异质性,因而比一般生态风险评价更复杂。通过讨论区域生态风险评价的特点和方法论基础,对有关概念和评价的方法步骤进行了理论探讨。</p> . <p>生态风险评价是伴随着环境管理目标和环境观念的转变而逐渐兴起并得到发展的一个新的研究领域,它区别于生态影响评价的重要特征在于其强调不确定性因素的作用,区域生态风险评价所涉及的风险源以及评价受体等都在区域内具有空间异质性,因而比一般生态风险评价更复杂。通过讨论区域生态风险评价的特点和方法论基础,对有关概念和评价的方法步骤进行了理论探讨。</p> |
| [11] | . 20多年来,生态风险评价研究经历了从环境风险到生态风险到区域生态风险评价的发展历程,风险源由单一风险源扩展到多风险源,风险受体由单一受体发展到多受体,评价范围由局地扩展到区域景观水平。区域生态风险评价就是大尺度上研究复杂环境背景下包含多风险源、多风险受体的综合风险研究。目前,区域生态风险评价的理论框架已经搭建起来,统计方法多采用相对评价法。区域生态风险评价未来的发展方向为继续加强实验和野外调查,进一步减小不确定性,逐步解决尺度推移问题。区域生态风险评价必须与经济、社会、文化相结合,才能充分发挥它在管理决策中的作用。 . 20多年来,生态风险评价研究经历了从环境风险到生态风险到区域生态风险评价的发展历程,风险源由单一风险源扩展到多风险源,风险受体由单一受体发展到多受体,评价范围由局地扩展到区域景观水平。区域生态风险评价就是大尺度上研究复杂环境背景下包含多风险源、多风险受体的综合风险研究。目前,区域生态风险评价的理论框架已经搭建起来,统计方法多采用相对评价法。区域生态风险评价未来的发展方向为继续加强实验和野外调查,进一步减小不确定性,逐步解决尺度推移问题。区域生态风险评价必须与经济、社会、文化相结合,才能充分发挥它在管理决策中的作用。 |
| [12] | . 生态风险评价是一种重要的生态环境管理手段。从区域尺度着手,分析生态系统所遭受的风险,对加强生态系统管理、区域生态安全具有重要的现实意义。本文在回顾国内外区域生态风险评价概念内涵、主要内容及其发展历程的基础上,对当前研究区域、研究尺度、研究模型和研究的不确定性分析等关键性问题做了较为系统的探讨,并就其未来研究方向进行了展望。 . 生态风险评价是一种重要的生态环境管理手段。从区域尺度着手,分析生态系统所遭受的风险,对加强生态系统管理、区域生态安全具有重要的现实意义。本文在回顾国内外区域生态风险评价概念内涵、主要内容及其发展历程的基础上,对当前研究区域、研究尺度、研究模型和研究的不确定性分析等关键性问题做了较为系统的探讨,并就其未来研究方向进行了展望。 |
| [13] | . 本研究以城市社会—生态系统为风险评价对象,引入生态适应性循环三维框架,将景观生态风险评价指标从单一的景观指数层面扩展至"潜力—连通度—恢复力"三维准则,并以深圳市为研究区,基于有序加权平均(OWA)算法对评价结果进行情景设置。研究结果显示,评价中干扰指标主要影响风险评价结果属性值域,而风险空间格局则受暴露指标制约;深圳全市景观生态风险整体呈现"西高东低"的分布格局,城市新建成区风险最高,大鹏半岛风险最低,羊台山与笔架山公园则是城区内部的相对风险低值区;基于OWA方法设置情景偏好,绘制"忽视"、"正常"及"重视"三种风险情景下的城市景观生态风险图。本研究基于生态适应性循环理念集成社会—生态系统时空动态干扰与暴露指标表征城市景观生态风险,并通过OWA方法变换主观偏好、降低评价不确定性,可以满足不同发展思路下的城市开发布局需求,从而为城市景观发展空间权衡提供决策支持。 . 本研究以城市社会—生态系统为风险评价对象,引入生态适应性循环三维框架,将景观生态风险评价指标从单一的景观指数层面扩展至"潜力—连通度—恢复力"三维准则,并以深圳市为研究区,基于有序加权平均(OWA)算法对评价结果进行情景设置。研究结果显示,评价中干扰指标主要影响风险评价结果属性值域,而风险空间格局则受暴露指标制约;深圳全市景观生态风险整体呈现"西高东低"的分布格局,城市新建成区风险最高,大鹏半岛风险最低,羊台山与笔架山公园则是城区内部的相对风险低值区;基于OWA方法设置情景偏好,绘制"忽视"、"正常"及"重视"三种风险情景下的城市景观生态风险图。本研究基于生态适应性循环理念集成社会—生态系统时空动态干扰与暴露指标表征城市景观生态风险,并通过OWA方法变换主观偏好、降低评价不确定性,可以满足不同发展思路下的城市开发布局需求,从而为城市景观发展空间权衡提供决策支持。 |
| [14] | . 合理评估流域生态风险,对于优化流域景观格局、建立流域生态风险预警机制、降低流域生态环境风险、维护流域生态功能具有十分重要的意义。文章以干旱内陆河典型流域为研究对象,以三期遥感数据为基础,构建生态风险指数,结合ArcGIS的空间分析功能,对流域生态风险的时空特征进行分析,结果表明:1987—2010年,流域景观发生较大了变化,草地面积减少12.73×10⁴hm2,未利用地面积增加15.59×10⁴hm2;将生态风险划分为5个等级,其中低生态风险区向流域上游不断迁移,面积减少31.89×10⁴hm2,较低生态风险区向上游和中游不断延伸,面积增加29.30×10⁴hm2,高生态风险区向下游不断扩展,面积增加58.69×10⁴hm2;流域生态风险转换方式共有7种,低向高等级转化的总面积为122.56×10⁴hm2,高向低等级转化的总面积为6.12×10⁴hm2,生态风险呈增高趋势。 . 合理评估流域生态风险,对于优化流域景观格局、建立流域生态风险预警机制、降低流域生态环境风险、维护流域生态功能具有十分重要的意义。文章以干旱内陆河典型流域为研究对象,以三期遥感数据为基础,构建生态风险指数,结合ArcGIS的空间分析功能,对流域生态风险的时空特征进行分析,结果表明:1987—2010年,流域景观发生较大了变化,草地面积减少12.73×10⁴hm2,未利用地面积增加15.59×10⁴hm2;将生态风险划分为5个等级,其中低生态风险区向流域上游不断迁移,面积减少31.89×10⁴hm2,较低生态风险区向上游和中游不断延伸,面积增加29.30×10⁴hm2,高生态风险区向下游不断扩展,面积增加58.69×10⁴hm2;流域生态风险转换方式共有7种,低向高等级转化的总面积为122.56×10⁴hm2,高向低等级转化的总面积为6.12×10⁴hm2,生态风险呈增高趋势。 |
| [15] | . 通过生态风险指数构建和碳储量服务模拟,评价土地整理对生态风险和固碳功能的影响,由于生态系统服务在生态风险研究中的缺乏,利用土地整理前后生态风险变化和碳储量服务变化之间的相关关系分析,探讨利用生态系统服务变化评价生态风险的可能。以吉林省西部重大土地整理区为研究对象,基于景观格局变化构建生态风险指数,利用InVEST模型分析碳储量服务变化,结果表明:土地整理使整理区的景观结构发生较大变化,优势景观类型由盐碱地和草地转变为耕地,耕地破碎度和分离度降低,盐碱地和草地的分离度和破碎度增加。土地整理后,耕地、建设用地和其他用地的景观损失度指数降低,其他景观类型的景观损失度指数增加。土地整理前后整理区生态风险等级以较低风险区和中等风险区为主,整理后低和较低风险区面积变化明显,其他等级风险区的面积变化不大。InVEST模拟结果表明,土地整理前后整理区总碳储量分别为990.82、1 145.22万t,总碳储量增加154.40万t,土地整理导致固碳功能的增加。相关分析结果表明整理区碳储量服务变化与生态风险变化呈显著负相关关系,表明生态系统服务变化在生态风险评价中应用的可能。 . 通过生态风险指数构建和碳储量服务模拟,评价土地整理对生态风险和固碳功能的影响,由于生态系统服务在生态风险研究中的缺乏,利用土地整理前后生态风险变化和碳储量服务变化之间的相关关系分析,探讨利用生态系统服务变化评价生态风险的可能。以吉林省西部重大土地整理区为研究对象,基于景观格局变化构建生态风险指数,利用InVEST模型分析碳储量服务变化,结果表明:土地整理使整理区的景观结构发生较大变化,优势景观类型由盐碱地和草地转变为耕地,耕地破碎度和分离度降低,盐碱地和草地的分离度和破碎度增加。土地整理后,耕地、建设用地和其他用地的景观损失度指数降低,其他景观类型的景观损失度指数增加。土地整理前后整理区生态风险等级以较低风险区和中等风险区为主,整理后低和较低风险区面积变化明显,其他等级风险区的面积变化不大。InVEST模拟结果表明,土地整理前后整理区总碳储量分别为990.82、1 145.22万t,总碳储量增加154.40万t,土地整理导致固碳功能的增加。相关分析结果表明整理区碳储量服务变化与生态风险变化呈显著负相关关系,表明生态系统服务变化在生态风险评价中应用的可能。 |
| [16] | . 土地整治的生态风险评价与管理是生态文明背景下土地整治项目可持续发展的客观要求。"十三五"期间,土地整治投资和力度规模持续加大,在对区域社会和经济发展带来积极作用的同时,也会对区域生态系统结构与功能产生深远影响,如何管控土地整治的生态风险受到越来越多的关注。在系统阐述了土地整治生态风险的内涵与特点的基础上,分析了土地整治不同生态效应所对应的生态风险因子与评价指标体系,提出了基于土地整治全过程分析的生态风险识别、评价与管控的思路,并将生态系统服务功能的提升作为生态风险评价的重要内容,克服了以往生态风险研究更多侧重生态系统结构与功能本身变化的局限性,并指出了土地整治生态风险所需要关注的科学问题与发展趋势。 . 土地整治的生态风险评价与管理是生态文明背景下土地整治项目可持续发展的客观要求。"十三五"期间,土地整治投资和力度规模持续加大,在对区域社会和经济发展带来积极作用的同时,也会对区域生态系统结构与功能产生深远影响,如何管控土地整治的生态风险受到越来越多的关注。在系统阐述了土地整治生态风险的内涵与特点的基础上,分析了土地整治不同生态效应所对应的生态风险因子与评价指标体系,提出了基于土地整治全过程分析的生态风险识别、评价与管控的思路,并将生态系统服务功能的提升作为生态风险评价的重要内容,克服了以往生态风险研究更多侧重生态系统结构与功能本身变化的局限性,并指出了土地整治生态风险所需要关注的科学问题与发展趋势。 |
| [17] | . The interconnections between ecosystems, human health and welfare have been increasingly recognized by the US government, academia, and the public. This paper continues this theme by addressing the use of risk assessment to integrate people into a single assessment. In a broad overview of the risk assessment process we stress the need to build a conceptual model of the whole system including multiple species (humans and other ecological entities), stressors, and cumulative effects. We also propose converging landscape ecology and evaluation of ecosystem services with risk assessment to address these cumulative responses. We first look at how this integration can occur within the problem formulation step in risk assessment where the system is defined, a conceptual model created, a subset of components and functions selected, and the analytical framework decided in a context that includes the management decisions. A variety of examples of problem formulations (salmon, wild insects, hyporheic ecosystems, ultraviolet (UV) radiation, nitrogen fertilization, toxic chemicals, and oil spills) are presented to illustrate how treating humans as components of the landscape can add value to risk assessments. We conclude that the risk assessment process should help address the urgent needs of society in proportion to importance, to provide a format to communicate knowledge and understanding, and to inform policy and management decisions. |
| [18] | . http://linkinghub.elsevier.com/retrieve/pii/S0048969711007236 |
| [19] | . 生态风险评价对科学管理与保护生态系统具有重要的意义,为弥补传统生态风险评价方法的不足和提高风险管理的效率,将生态系统服务引入生态风险评价中进行发展和完善, 成为了当前生态风险评价研究的前沿和热点。系统分析了生态系统服务在生态风险评价中的应用,指出生态系统服务在问题形成阶段中可明确保护对象和属性,在风险分析阶段可联系生态系统结构过程作用,在风险表征阶段及后续阶段能可提供清晰明确的评价结果,加强风险交流和管理,能有效地改进生态系统传统生态风险评价。在实践上,基于生态系统服务的生态风险评价可从3个不同层面开展:一是针对外界压力对某类特定功能或者系统中某些服务功能的影响,构建基于某种特定服务的实体属性评价方法;二是针对外界压力作用下生态系统结构与过程变化下对功能影响,构建基于复杂生态系统作用的评价方法,实现对生态风险的模拟评价;三是评价社会生态系统下外界驱动对人类福祉的影响时,可将DPSIR(Drive-Pressure-State-Impact-Response)理论模型运用到生态风险管理中,也可基于景观生态系统服务与压力源的空间作用关系,实现社会生态系统风险评价与管理。作为生态风险表征手段,可基于生态系统服务损失与不利服务进行表征,也可选取热力学等指标作为评估量纲。从理论、评价方法、风险管理等方面对基于生态系统服务生态风险评价给予展望。 . 生态风险评价对科学管理与保护生态系统具有重要的意义,为弥补传统生态风险评价方法的不足和提高风险管理的效率,将生态系统服务引入生态风险评价中进行发展和完善, 成为了当前生态风险评价研究的前沿和热点。系统分析了生态系统服务在生态风险评价中的应用,指出生态系统服务在问题形成阶段中可明确保护对象和属性,在风险分析阶段可联系生态系统结构过程作用,在风险表征阶段及后续阶段能可提供清晰明确的评价结果,加强风险交流和管理,能有效地改进生态系统传统生态风险评价。在实践上,基于生态系统服务的生态风险评价可从3个不同层面开展:一是针对外界压力对某类特定功能或者系统中某些服务功能的影响,构建基于某种特定服务的实体属性评价方法;二是针对外界压力作用下生态系统结构与过程变化下对功能影响,构建基于复杂生态系统作用的评价方法,实现对生态风险的模拟评价;三是评价社会生态系统下外界驱动对人类福祉的影响时,可将DPSIR(Drive-Pressure-State-Impact-Response)理论模型运用到生态风险管理中,也可基于景观生态系统服务与压力源的空间作用关系,实现社会生态系统风险评价与管理。作为生态风险表征手段,可基于生态系统服务损失与不利服务进行表征,也可选取热力学等指标作为评估量纲。从理论、评价方法、风险管理等方面对基于生态系统服务生态风险评价给予展望。 |
| [20] | . 生态系统服务研究是生态学研究的前沿和热点。对生态系统服务文献发表情况和生态系统服务主要研究方向进行阐述分析。(1)通过Thomson Reuters公司ISI Web of knowledge 信息平台提供的Science Citation Index Expanded 数据库为数据源检索分析得到:生态系统服务研究从文献数量、作者、国家和机构上近年来都表现出陡增的趋势;最主要的研究国家为美国、英国、德国、澳大利亚和中国;涉及54 个学科,不同的国家侧重的研究领域不同;来自258 个期刊,55% 的文献集中在24 个主要期刊上,主要期刊平均影响因子5.976。(2)从生态系统服务评价方法、生态系统内部和生态系统外部驱动因素、基于生态系统服务的生态系统管理4个方面来评述生态系统服务的研究进展。其中生态系统内部驱动主要是指生物多样性和土地利用变化,生态系统外部驱动因素包括自然因素和人为活动。最后,对生态系统服务研究的发展做了展望。 . 生态系统服务研究是生态学研究的前沿和热点。对生态系统服务文献发表情况和生态系统服务主要研究方向进行阐述分析。(1)通过Thomson Reuters公司ISI Web of knowledge 信息平台提供的Science Citation Index Expanded 数据库为数据源检索分析得到:生态系统服务研究从文献数量、作者、国家和机构上近年来都表现出陡增的趋势;最主要的研究国家为美国、英国、德国、澳大利亚和中国;涉及54 个学科,不同的国家侧重的研究领域不同;来自258 个期刊,55% 的文献集中在24 个主要期刊上,主要期刊平均影响因子5.976。(2)从生态系统服务评价方法、生态系统内部和生态系统外部驱动因素、基于生态系统服务的生态系统管理4个方面来评述生态系统服务的研究进展。其中生态系统内部驱动主要是指生物多样性和土地利用变化,生态系统外部驱动因素包括自然因素和人为活动。最后,对生态系统服务研究的发展做了展望。 |
| [21] | . This study mapped the production of five ecosystem services in South Africa: surface water supply, water flow regulation, soil accumulation, soil retention, and carbon storage. The relationship and spatial congruence between services were assessed. The congruence between primary production and these five services was tested to evaluate its value as a surrogate or proxy ecosystem service measure. This study illustrates that (1) most of South Africa's land surface is important for supplying at least one service, (2) there are low levels of congruence between the service ranges and even lower levels between the hotspots for different ecosystem services, and (3) primary production appears to show some potential as a surrogate for ecosystem service distribution. The implications of a heterogeneous landscape for the provision of ecosystem services and their management are highlighted and the potential for managing such services in a country like South Africa is discussed. |
| [22] | . No Abstract available for this article. |
| [23] | . Costanza等提出的生态服务价值化评估方法在中国直接运用存在一些缺陷:低估或者忽略了某些生态系统服务价值。因此,笔者在其生态系统服务价值评估体系的基础上分别在2002年和2006年对中国700位具有生态学背景的专业人员进行问卷调查,得出了新的生态系统服务评估单价体系。通过对比发现,调查获得的基于专家知识的生态系统服务单价体系与基于物质量估算的生态系统服务价值之间具有较好的可比性。该基于专家知识的生态系统服务评估体系可以用于已知土地利用面积的生态系统服务价值估算,能在较短时间内获得较为精确的结果。 . Costanza等提出的生态服务价值化评估方法在中国直接运用存在一些缺陷:低估或者忽略了某些生态系统服务价值。因此,笔者在其生态系统服务价值评估体系的基础上分别在2002年和2006年对中国700位具有生态学背景的专业人员进行问卷调查,得出了新的生态系统服务评估单价体系。通过对比发现,调查获得的基于专家知识的生态系统服务单价体系与基于物质量估算的生态系统服务价值之间具有较好的可比性。该基于专家知识的生态系统服务评估体系可以用于已知土地利用面积的生态系统服务价值估算,能在较短时间内获得较为精确的结果。 |
| [24] | No abstract is available for this item. |
| [25] | . 生态系统服务是人类可持续发展的物质基础和自然资本。对生态系统服务价值的评估有利于人们认识自然生态系统对人类福利的重要性,是生态学、地理学等自然科学利用经济学方法进一步影响社会决策的尝试。但由于生态系统的复杂性和经济系统对生态系统服务反映的模糊性,目前尚难准确评估生态系统服务价值。多尺度综合研究与动态参与式评估、物产价值与非物质性服务价值的分离研究、对边际价值的调查与模拟研究、与生态补偿等相关领域的结合研究、非物质性服务价值的市场化研究等是生态系统服务价值评估研究的深化方向。 . 生态系统服务是人类可持续发展的物质基础和自然资本。对生态系统服务价值的评估有利于人们认识自然生态系统对人类福利的重要性,是生态学、地理学等自然科学利用经济学方法进一步影响社会决策的尝试。但由于生态系统的复杂性和经济系统对生态系统服务反映的模糊性,目前尚难准确评估生态系统服务价值。多尺度综合研究与动态参与式评估、物产价值与非物质性服务价值的分离研究、对边际价值的调查与模拟研究、与生态补偿等相关领域的结合研究、非物质性服务价值的市场化研究等是生态系统服务价值评估研究的深化方向。 |
| [26] | . No abstract is available for this item. |
| [27] | . A ‘value of ecosystem services’ (VES) may be calculated by multiplying a set of ecosystem services by a set of corresponding shadow prices. This paper examines the role of the VES concept in measuring trends in human well-being. Under conventional arguments from applied welfare economics, standard measures of market consumption may be extended to include the value of direct environmental services, which affect welfare in ways that are not mediated by the consumption of purchased goods. The VES concept does not capture values such as ecological sustainability and distributional fairness that are not reducible to individual welfare. And its operationalization is constrained by the well-known limitations of nonmarket valuation methods. Nonetheless, attempts to calculate the value of environmental services can provide insights into the tradeoffs between market activity and environmental quality that are implicit in the process of economic growth. Such efforts can promote informed debate concerning the achievement of sustainable development. |
| [28] | . <p>土地荒漠化已成为一个全球性的重大环境问题,也是我国面临的严重生态环境问题。遥感技术以其信息量 大、获取速度快、覆盖范围广、受人力物力的限制小等优点,在过去的30 多年中,已逐渐成为土地荒漠化监测的重 要数据来源和技术手段。本文首先概述了土地荒漠化遥感监测中使用的遥感数据源,综述了各类卫星遥感影像、影 像的不同季相、波段和各类植被指数的选择等;讨论了土地荒漠化信息遥感提取的多种方法,综合比较不同遥感提 取方法的优缺点,进而分析土地荒漠化遥感监测中多采用计算机自动分类与人工手动分类结合的原因。最后,指出 遥感技术在土地荒漠化监测中存在的一些问题,并提出土地荒漠化遥感监测中综合指标与综合方法集成研究等发 展方向。</p> . <p>土地荒漠化已成为一个全球性的重大环境问题,也是我国面临的严重生态环境问题。遥感技术以其信息量 大、获取速度快、覆盖范围广、受人力物力的限制小等优点,在过去的30 多年中,已逐渐成为土地荒漠化监测的重 要数据来源和技术手段。本文首先概述了土地荒漠化遥感监测中使用的遥感数据源,综述了各类卫星遥感影像、影 像的不同季相、波段和各类植被指数的选择等;讨论了土地荒漠化信息遥感提取的多种方法,综合比较不同遥感提 取方法的优缺点,进而分析土地荒漠化遥感监测中多采用计算机自动分类与人工手动分类结合的原因。最后,指出 遥感技术在土地荒漠化监测中存在的一些问题,并提出土地荒漠化遥感监测中综合指标与综合方法集成研究等发 展方向。</p> |
| [29] | . 生态系统服务价值评估是当前生态系统管理领域研究的热点,密切联系着人类的生活福祉.本文系统综述了基于地理信息系统(GIS)和遥感(RS)技术的生态系统服务价值评估的研究进展,归纳为以下3个特征:生态经济学理论作为价值定量计算的核心方法被普遍采纳;GIS和RS在数据获取、时空分析和集成平台方面发挥着关键作用;运用生态系统服务功能机理模型模拟自然现象与人类活动之间的关系.根据目前该领域的研究现状及不足,提出了可扩展、分布式的集成研究框架——“生产线”框架,探讨了GIS和RS技术与生态系统服务价值评估集成研究的未来发展趋势. . 生态系统服务价值评估是当前生态系统管理领域研究的热点,密切联系着人类的生活福祉.本文系统综述了基于地理信息系统(GIS)和遥感(RS)技术的生态系统服务价值评估的研究进展,归纳为以下3个特征:生态经济学理论作为价值定量计算的核心方法被普遍采纳;GIS和RS在数据获取、时空分析和集成平台方面发挥着关键作用;运用生态系统服务功能机理模型模拟自然现象与人类活动之间的关系.根据目前该领域的研究现状及不足,提出了可扩展、分布式的集成研究框架——“生产线”框架,探讨了GIS和RS技术与生态系统服务价值评估集成研究的未来发展趋势. |
| [30] | . We estimated global marketed and non-marketed economic value from two classified satellite images with global coverage at 1 km 2 resolution. GDP (a measure of marketed economic output) is correlated with the amount of light energy (LE) emitted by that nation as measured by nighttime satellite images. LE emitted is more spatially explicit than whole country GDP, may (for some nations or regions) be a more accurate indicator of economic activity than GDP itself, can be directly observed, and can be easily updated on an annual basis. As far as we know, this is the first global map of estimated economic activity produced at this high spatial resolution (1 km 2). Ecosystem services product (ESP) is an important type of non-marketed value. ESP at 1 km 2 resolution was estimated using the IGBP land-cover dataset and unit ecosystem service values estimated by Costanza et al. [Valuing Ecosystem Services with Efficiency, Fairness and Sustainability as Goals. Nature's Services, Island Press, Washington DC, pp. 49 70]. The sum of these two (GDP+ESP)=SEP is a measure of the subtotal ecological conomic product (marketed plus a significant portion of the non-marketed). The ratio: (ESP/SEP) 100=%ESP is a measure of proportion of the SEP from ecosystem services. Both SEP and %ESP were calculated and mapped for each 1 km 2 pixel on the earth's surface, and aggregated by country. Results show the detailed spatial patterns of GDP, ESP, and SEP (also available at: http://www.du.edu/ sutton/esiindexisee/EcolEconESI.htm). Globally, while GDP is concentrated in the northern industrialized countries, ESP is concentrated in tropical regions and in wetlands and other coastal systems. %ESP ranges from 1% for Belgium and Luxembourg to 3% for the Netherlands, 18% for India, 22% for the United States, 49% for Costa Rica, 57% for Chile, 73% for Brazil, and 92% for Russia. While GDP per capita has the usual northern industrialized countries at the top of the list, SEP per capita shows a quite different picture, with a mixture of countries with either high GDP/capita, high ESP/capita, or a combination near the top of the list. Finally, we compare our results with two other indices: (1) The 2001 Environmental Sustainability Index (ESI) derived as an initiative of the Global Leaders of Tomorrow Environment Task Force, World Economic Forum, and (2) Ecological Footprints of Nations: How much Nature do they use? How much Nature do they have? developed by Mathis Wackernagel and others. While both of these indices purport to measure sustainability, the ESI is actually mainly a measure of economic activity (and is correlated with GDP), while the Eco-Footprint index is a measure of environmental impact. The related eco-deficit (national ecological capacity minus national footprint) correlates well with %ESP. |
| [31] | . http://linkinghub.elsevier.com/retrieve/pii/S0301479707002381 |
| [32] | . 生态系统服务价值是生态保护、生态功能区划、自然资产核算和生态补偿决策的依据和基础,并且生态系统服务功能呈现出与生态结构和生态功能密切相关的时空动态变化特征,但目前国内尚缺乏统一和完整的生态系统服务价值的动态评估方法。研究基于文献调研、专家知识、统计资料和遥感监测等数据源,通过模型运算和地理信息空间分析等方法,对单位面积价值当量因子静态评估方法进行了改进和发展,构建了基于单位面积价值当量因子法的中国陆地生态系统服务价值的动态评估方法,实现了对全国14种生态系统类型及其11类生态服务功能价值在时间(月尺度)和空间(省域尺度)上的动态综合评估。初步的应用与评估结果表明,2010年我国不同类型生态系统服务的总价值量为38.1×10¹²元,总体变化趋势为从东南向西北逐渐降低,年内变化多表现为以7月为最高,1月和12月最低。总体而言,尽管还需要进一步地改进和完善,论文构建的评价体系为我国生态系统服务价值的时空动态评估提供了一个相对全面的综合评估方案,从而为我国自然资产评估、生态补偿等方面提供更为全面的科学依据与决策支持。 . 生态系统服务价值是生态保护、生态功能区划、自然资产核算和生态补偿决策的依据和基础,并且生态系统服务功能呈现出与生态结构和生态功能密切相关的时空动态变化特征,但目前国内尚缺乏统一和完整的生态系统服务价值的动态评估方法。研究基于文献调研、专家知识、统计资料和遥感监测等数据源,通过模型运算和地理信息空间分析等方法,对单位面积价值当量因子静态评估方法进行了改进和发展,构建了基于单位面积价值当量因子法的中国陆地生态系统服务价值的动态评估方法,实现了对全国14种生态系统类型及其11类生态服务功能价值在时间(月尺度)和空间(省域尺度)上的动态综合评估。初步的应用与评估结果表明,2010年我国不同类型生态系统服务的总价值量为38.1×10¹²元,总体变化趋势为从东南向西北逐渐降低,年内变化多表现为以7月为最高,1月和12月最低。总体而言,尽管还需要进一步地改进和完善,论文构建的评价体系为我国生态系统服务价值的时空动态评估提供了一个相对全面的综合评估方案,从而为我国自然资产评估、生态补偿等方面提供更为全面的科学依据与决策支持。 |
| [33] | . Ecosystem services and value evaluation have become research focus of ecology, ecological economics, environmental economics and other frontier fields; moreover, it is a national economic accounting and an important basis for market operations. At present, studies of ecosystem services falls far from what the nation needs. This paper summarizes progress of Chinese ecosystem services and valuation research during the past decade. We discussed some key issues and future directions in ecosystem services function. An aim of our paper is to provide ideas for the development of ecosystem services and evaluation research in China, and support a more detailed reference for government. |
| [34] | . 以云南省红河流域为研究区域,利用GIS和RS技术,建立基于景观格局和土壤侵蚀过程的景观生态风险指数,分析研究区域内景观生态风险分布规律。研究结果表明:重度和极重度格局风险区域、土壤侵蚀区域及综合景观生态风险区域主要沿红河主干道分布;综合景观生态风险指数在空间上呈现正的自相关性,高风险聚集区主要沿河流分布;不同景观类型中,建设用地、未利用地和水域的景观格局风险大于耕地、草地和林地,未利用地的土壤侵蚀风险最高,综合景观生态风险度依次为建设用地>水域>未利用土地>耕地>林地>草地;坡度在一定程度上影响着景观格局、土壤侵蚀以及综合景观生态风险。 . 以云南省红河流域为研究区域,利用GIS和RS技术,建立基于景观格局和土壤侵蚀过程的景观生态风险指数,分析研究区域内景观生态风险分布规律。研究结果表明:重度和极重度格局风险区域、土壤侵蚀区域及综合景观生态风险区域主要沿红河主干道分布;综合景观生态风险指数在空间上呈现正的自相关性,高风险聚集区主要沿河流分布;不同景观类型中,建设用地、未利用地和水域的景观格局风险大于耕地、草地和林地,未利用地的土壤侵蚀风险最高,综合景观生态风险度依次为建设用地>水域>未利用土地>耕地>林地>草地;坡度在一定程度上影响着景观格局、土壤侵蚀以及综合景观生态风险。 |
| [35] | . . |
| [36] | . This paper presents a modeling approach aimed at seasonal resolution of global climatic and edaphic controls on patterns of terrestrial ecosystem production and soil microbial respiration. We use satellite imagery (Advanced Very High Resolution Radiometer and International Satellite Cloud Climatology Project solar radiation), along with historical climate (monthly temperature and precipitation) and soil attributes (texture, C and N contents) from global (100°) data sets as model inputs. The Carnegie-Ames-Stanford approach (CASA) Biosphere model runs on a monthly time interval to simulate seasonal patterns in net plant carbon fixation, biomass and nutrient allocation, litterfall, soil nitrogen mineralization, and microbial CO2 production. The model estimate of global terrestrial net primary production is 48 Pg C yr0908081 with a maximum light use efficiency of 0.39 g C MJ0908081PAR. Over 70% of terrestrial net production takes place between 3000°N and 3000°S latitude. Steady state pools of standing litter represent global storage of around 174 Pg C (94 and 80 Pg C in nonwoody and woody pools, respectively), whereas the pool of soil C in the top 0.3 m that is turning over on decadal time scales comprises 300 Pg C. Seasonal variations in atmospheric CO2 concentrations from three stations in the Geophysical Monitoring for Climate Change Flask Sampling Network correlate significantly with estimated net ecosystem production values averaged over 5000°0900098000° N, 1000°0900093000° N, and 000°0900091000° N. |
| [37] | . This paper describes a boreal ecosystems productivity simulator (BEPS) recently developed at the Canada Centre for Remote Sensing to assist in natural resources management and to estimate the carbon budget over Canadian landmass (10 |
| [38] | . remote sensing; NPP; GPP; terrestrial land of China; BIOME-BGC |
| [39] | . |
| [40] | . |
| [41] | . |
| [42] | . An increasing amount of information is being collected on the ecological and socio-economic value of goods and services provided by natural and semi-natural ecosystems. However, much of this information appears scattered throughout a disciplinary academic literature, unpublished government agency reports, and across the World Wide Web. In addition, data on ecosystem goods and services often appears at incompatible scales of analysis and is classified differently by different authors. In order to make comparative ecological economic analysis possible, a standardized framework for the comprehensive assessment of ecosystem functions, goods and services is needed. In response to this challenge, this paper presents a conceptual framework and typology for describing, classifying and valuing ecosystem functions, goods and services in a clear and consistent manner. In the following analysis, a classification is given for the fullest possible range of 23 ecosystem functions that provide a much larger number of goods and services. In the second part of the paper, a checklist and matrix is provided, linking these ecosystem functions to the main ecological, socio ultural and economic valuation methods. |
| [43] | . |
| [44] | . A methodological protocol of strategic environmental assessment was developed to incorporate the valuation of ecosystem services in land use plans. The protocol was applied in rural land planning at Balcarce, a department representative of the Southeast Pampas Region (Argentina). The ecosystem services approach was used as valuation criteria of the 14 principal ecosystems classified in the studied area, where agricultural is the predominant economic activity. The provision of seven principal ecosystem services related to regulation functions or food production was estimated for each ecosystem using a set of indicators integrating climatic, vegetation and terrain variables. The assessment of land use changes showed a significant increase in agriculture in the past 20 years, which affected mainly natural grasslands. The environmental impact of this replacement varied according to the ecosystem and the area. Hills and riparian zones were identified as key areas for grassland conservation in order to provide regulation ecosystem services in agricultural landscapes. On the basis of this analysis, a preliminary zoning was proposed, aimed to retain critical support and regulation ecosystem services without significantly sacrificing food production for humans. Strategic environmental assessment based on ecosystem services appears as a powerful tool to prevent negative environmental costs of land use plans which can remain unnoticed under traditional environmental impact assessment techniques. |
| [45] | . 将生态系统服务保护纳入到传统的以保护区为基础的自然保护之中是生态保护研究的新领域。利用综合指标方法,分析了中国从2000-2010年的4种生态系统服务时空变化特征;并对中国的七大生态保护和恢复区域的服务空间保护成效进行评价,提出了国家尺度上的生态系统服务保护优先性分级。主要结论为:1中国的生态系统服务自西北向东南逐渐增加,显著增加区主要分布在黄土高原地区,显著减少区主要分布在东北及华北地区。黄土高原的生态系统服务提高主要是农田向草地和林地、草地向林地的转换引的;华北地区的降低主要是耕地的减少以及人工用地的增加引起的;东北地区是由于林地向耕地草地、耕地向湿地与人工用地的转换引起的。2七大生态保护和恢复区的生态系统服务均为增加趋势而且显著增加面积大于减少面积;显著增加面积最大的为三北防护林工程区、最小的为重点生态功能区;显著减少最大为重要生态功能区、最小的为三北防护林工程区。而且,对服务的保护成效在重要生态功能区最高,其次为天然林保护工程区,其余区域均小于全国平均水平。3提出的生态系统服务保护优先性等级中,极高级别占到了国土面积的26.18%,保护的生态系统服务量占到全国总量的64.19%,保护成效为全国平均水平的2.47倍。 . 将生态系统服务保护纳入到传统的以保护区为基础的自然保护之中是生态保护研究的新领域。利用综合指标方法,分析了中国从2000-2010年的4种生态系统服务时空变化特征;并对中国的七大生态保护和恢复区域的服务空间保护成效进行评价,提出了国家尺度上的生态系统服务保护优先性分级。主要结论为:1中国的生态系统服务自西北向东南逐渐增加,显著增加区主要分布在黄土高原地区,显著减少区主要分布在东北及华北地区。黄土高原的生态系统服务提高主要是农田向草地和林地、草地向林地的转换引的;华北地区的降低主要是耕地的减少以及人工用地的增加引起的;东北地区是由于林地向耕地草地、耕地向湿地与人工用地的转换引起的。2七大生态保护和恢复区的生态系统服务均为增加趋势而且显著增加面积大于减少面积;显著增加面积最大的为三北防护林工程区、最小的为重点生态功能区;显著减少最大为重要生态功能区、最小的为三北防护林工程区。而且,对服务的保护成效在重要生态功能区最高,其次为天然林保护工程区,其余区域均小于全国平均水平。3提出的生态系统服务保护优先性等级中,极高级别占到了国土面积的26.18%,保护的生态系统服务量占到全国总量的64.19%,保护成效为全国平均水平的2.47倍。 |
| [46] | Farmland expanded quickly at the expense of natural lands in Argentina since the mid-1950's without consideration of ecological costs. In order to analyze the implications of such changes we aimed to (i) develop a simple biophysical model to estimate the relative (0–100) provision of ecosystem services, (ii) calculate the economic value of food and fiber production derived from farming activities (economic services), and (iii) assess the tradeoffs between the provision of ecosystem and economic services. Land-use/land cover changes were studied through data from agricultural censuses in three historical periods (1956–1960, 1986–1990 and 2001–2005). The model uses biophysical data about biomass, water coverage, slope, soil infiltration capacity, temperature, precipitation and altitude. After testing the consistency of the model, its results were used to assess the relative ecological value of main regions across the country. On the other hand, the annual gross margin per hectare of farming activities was estimated in order to compare 1956–1960 and 2001–2005 periods that greatly differ in their regional farming model. Results showed that different regions respond differently to human intervention, both in economic and ecological terms, and any attempt to apply sole and centralized land-use strategies to different biomes may lead to undesirable outcomes. Economic and ecological criteria should be regionally balanced as a pre-requisite to the application of land-use policies. |
| [47] | . The Human Development Index (HDI) improves upon per‐capita Gross Domestic Product as an indicator of development by incorporating information on health and education. However, like its predecessor, it fails to account for the inequality with which the benefits of development are distributed among the population. Subsequent work by Anand and Sen (1993) and Hicks (1997) has led to a useful distribution‐sensitive measure of human development, but at the cost of a key property of the HDI that ensures consistency between regional and aggregate analyses. This paper presents a new parametric class of human develop-ment indices that includes the original HDI as well as a family of distribution sensitive indices that satisfy all the basic properties for an index of human development. An empirical application using the year 2000 Mexican Population Census data shows how the new measures can be applied to analyze the distribution of human development at the national level and for individual states. |
| [48] | . CAMSHIFT algorithm and Comaniciu/Meer algorithm are two fundamental frameworks of mean shift procedure for video target tracking. This paper generalizes the two well-known mean shift tracking algorithms, originally due to Bradski and Comaniciu/Meer. A new general similarity function which defines the distance between the target model and target candidate is employed to calculate the pixel weights and the target location. The target size is iteratively estimated and updated based on the zeroth order moment of the pixel weights. Then we prove that both the CAMSHIFT algorithm and the Comaniciu/Meer algorithm can be included in the generalized mean shift tracking framework. The tracking performances of three mean shift algorithms in the unified framework are shown and compared in the experimental results. . CAMSHIFT algorithm and Comaniciu/Meer algorithm are two fundamental frameworks of mean shift procedure for video target tracking. This paper generalizes the two well-known mean shift tracking algorithms, originally due to Bradski and Comaniciu/Meer. A new general similarity function which defines the distance between the target model and target candidate is employed to calculate the pixel weights and the target location. The target size is iteratively estimated and updated based on the zeroth order moment of the pixel weights. Then we prove that both the CAMSHIFT algorithm and the Comaniciu/Meer algorithm can be included in the generalized mean shift tracking framework. The tracking performances of three mean shift algorithms in the unified framework are shown and compared in the experimental results. |
| [49] | . |
| [50] | . |
| [51] | . Abstract This review is the most comprehensive currently available of the effects and accumulation of environmental contaminants on lizards. The importance of lizards was emphasized in hope that they be included in ecological risk assessments as well as any study on environmental contamination. Some studies presented here indicated that lizards are ideal bioindicators. They are important as a component of biodiversity, and many species are listed as threatened or endangered. In addition, lizards are a significant part of many ecosystems as well as an important link in many food chains. There are large gaps in data for many environmental contaminants, particularly data on lizards. Ecotoxicological studies on a wide variety of lizard species are needed; both laboratory and field studies would provide useful information. Because the majority of lizards are insectivores, studies of the effects and accumulation of pesticides are essential. A few current studies are available from Africa and Australia, but most, especially those conducted in the U.S., were not current. Studies are needed on the effects and accumulation of ubiquitous contaminants, such as heavy metals and PCBs. Because of the many contaminated sites and the significant waste disposal problem, studies are needed on the effects and accumulation of radionuclides on lizards. Furthermore, effects of multiple stressors must be studied. Last, studies are needed linking the effects of contaminants to tissue residues. It is hoped that the convenience of having the vast majority of lizard environmental contaminant data available in one document will encourage its use. |
| [52] | . The interannual variability and trend of above-ground photosynthetic activity of Arctic tundra vegetation in the 1990s is examined for the north slope region of Alaska, based on the seasonally integrated normalized difference vegetation index (SINDVI) derived from local area coverage (LAC) National Oceanic and Atmospheric Administration (NOAA) Advanced Very High Resolution Radiometer (AVHRR) data. Smaller SINDVI values occurred during the three years (1992-1994) following the volcanic eruption of Mt Pinatubo. Even after implementing corrections for this stratospheric aerosol effect and adjusting for changes in radiometric calibration coefficients, an apparent increasing trend of SINDVI in the 1990s is evident for the entire north slope. The most pronounced increase was observed for the foothills physiographical province. |
| [53] | . The regionalization of ecosystem productivity in China is the process and result of dividing China into different regions according to the difference and likelihood of biota productivity. The ecosystem productivity region considers the modern topographic delineation and its macro control on the formation of ecosystem landscape characteristics and the influences of monsoon climate and the differentiation of ecosystems caused by light, temperature, water, and other conditions. The productivity zone firstly considers different ecosystem types and their combination characteristics, and then considers difference of ecosystem productivity for different types (e.g., farmland, forest and grassland). According to the value of comprehensive ecosystem productivity for each productivity zone in China, the comprehensive ecosystem productivity of China is divided into 5 grades. Finally, the regionalization divides the whole country into 12 first level ecosystem productivity regions, and 64 second level ecosystem productivity zones.It can be seen clearly from the regionalization that the grade distribution of ecosystem productivity of China is stepwise, which correlates well with the three steps of China topographic profiles. The regionalization also indicates that the level of farmland ecosystem productivity can well evaluate the level of ecosystem productivity for most parts of China (i.e., 46 zones). However, for the rest of China (i.e., 18 zones), there exists sharp difference between the level of farmland ecosystem productivity and ecosystem productivity because of the imbalance of regional development. . The regionalization of ecosystem productivity in China is the process and result of dividing China into different regions according to the difference and likelihood of biota productivity. The ecosystem productivity region considers the modern topographic delineation and its macro control on the formation of ecosystem landscape characteristics and the influences of monsoon climate and the differentiation of ecosystems caused by light, temperature, water, and other conditions. The productivity zone firstly considers different ecosystem types and their combination characteristics, and then considers difference of ecosystem productivity for different types (e.g., farmland, forest and grassland). According to the value of comprehensive ecosystem productivity for each productivity zone in China, the comprehensive ecosystem productivity of China is divided into 5 grades. Finally, the regionalization divides the whole country into 12 first level ecosystem productivity regions, and 64 second level ecosystem productivity zones.It can be seen clearly from the regionalization that the grade distribution of ecosystem productivity of China is stepwise, which correlates well with the three steps of China topographic profiles. The regionalization also indicates that the level of farmland ecosystem productivity can well evaluate the level of ecosystem productivity for most parts of China (i.e., 46 zones). However, for the rest of China (i.e., 18 zones), there exists sharp difference between the level of farmland ecosystem productivity and ecosystem productivity because of the imbalance of regional development. |
