 , 刘时银
, 刘时银Research progress on debris thickness estimation and its effect on debris-covered glaciers in western China
ZHANGYong, LIUShiyin收稿日期:2016-12-27
修回日期:2017-05-2
网络出版日期:2017-09-30
版权声明:2017《地理学报》编辑部本文是开放获取期刊文献,在以下情况下可以自由使用:学术研究、学术交流、科研教学等,但不允许用于商业目的.
基金资助:
作者简介:
-->
展开
摘要
关键词:
Abstract
Keywords:
-->0
PDF (1481KB)元数据多维度评价相关文章收藏文章
本文引用格式导出EndNoteRisBibtex收藏本文-->
1 引言
表碛覆盖型冰川是指消融区部分或全部为表碛所覆盖的冰川,该类型冰川在中国天山、帕米尔高原、喀喇昆仑山、昆仑山、念青唐古拉山、喜马拉雅山、横断山等山区分布广泛[1-6]。据中国第二次冰川编目统计,中国境内表碛覆盖型冰川共有1723条,总面积为12974.7 km2,表碛覆盖面积占这些冰川总面积的11.5%[7]。其中,天山地区表碛覆盖型冰川数量最多、面积最大,其次为喜马拉雅山、帕米尔高原东部、念青唐古拉山、喀喇昆仑山和昆仑山地区(表1)。在这些表碛覆盖型冰川中,有299条冰川表碛面积超过1.0 km2,总面积为7474.0 km2,表碛覆盖面积占冰川面积的比例达15.5%,其中21条冰川表碛面积超过10.0 km2[7]。在中国面积超过100.0 km2的22条冰川中,10条为表碛覆盖型冰川[7]。在兴都库什—喀喇昆仑—喜马拉雅山地区的287条表碛覆盖型冰川中,表碛面积比例介于2.8%~34.6%[5],青藏高原东南部贡嘎山地区表碛覆盖型冰川的表碛面积比例介于1.7%~53.0%[8]。与裸冰或雪相比,表碛覆盖层由于反射率、颗粒大小、颜色等物理性质的差异,具有独特的热力过程,导致其下覆冰川冰的消融过程不同[9-12],使得表碛覆盖型冰川与无表碛覆盖型冰川对同样的气候变化条件显示了不同的响应特征[5, 13]。野外观测试验与研究表明[9-12, 14-16],表碛厚度及其空间分布对下覆冰川消融过程的影响显著,从而影响冰川物质平衡的空间分布特征与高度结构特征[13, 16-17]。然而中国西部地区仅少数冰川有表碛厚度的实测资料[2, 4, 15-16, 18-23],区域冰川表碛厚度空间分布及其影响尚不清楚。Tab. 1
表1
表1中国境内各山系表碛覆盖型冰川分布特征
Tab. 1Distribution characteristics of debris-covered glaciers in different mountains of China
| 山系 | 条数 | 面积 (km2) | 所占全部冰川 面积比例(%) | 表碛区域面积(km2) | 表碛区域占表碛型冰川面积比例(%) |
|---|---|---|---|---|---|
| 阿尔金山 | 6 | 30.5 | 10.3 | 2.3 | 7.4 |
| 阿尔泰山 | 10 | 46.0 | 25.7 | 1.2 | 2.6 |
| 冈底斯山 | 9 | 28.1 | 2.2 | 2.5 | 9.0 |
| 横断山 | 26 | 166.5 | 11.8 | 30.0 | 18.0 |
| 喀喇昆仑山 | 274 | 2249.3 | 37.5 | 188.4 | 8.4 |
| 昆仑山 | 349 | 2214.6 | 18.9 | 182.3 | 8.2 |
| 念青唐古拉山 | 170 | 1336.5 | 13.7 | 125.7 | 9.4 |
| 帕米尔 | 132 | 1094.1 | 56.9 | 191.2 | 17.5 |
| 祁连山 | 12 | 28.0 | 1.8 | 1.1 | 4.0 |
| 羌塘高原 | 2 | 26.6 | 1.3 | 0.3 | 1.0 |
| 唐古拉山 | 7 | 47.1 | 2.6 | 2.3 | 4.9 |
| 天山 | 578 | 3938.0 | 54.1 | 480.9 | 12.2 |
| 喜马拉雅山 | 148 | 1769.4 | 27.6 | 285.6 | 16.1 |
| 总计 | 1723 | 12974.7 | 25.0 | 1493.7 | 11.5 |
新窗口打开
消融区是冰川主要的产流区,表碛的不均匀分布及其加速或抑制冰川消融这一过程深刻影响着冰川流域径流的形成与变化过程[13, 24-26]。在天山南坡科其喀尔冰川流域的冰川径流模拟中发现,与假设消融区无表碛覆盖冰面条件下的冰川径流相比,表碛覆盖条件下的冰川径流量减少了约35%[26],而在青藏高原东南部的海螺沟冰川流域,表碛覆盖导致冰川径流增加了约22%[24]。大多数表碛覆盖型冰川面积较大[5, 7, 13],其在不同时空尺度的变化势必导致以冰川融水补给为主河流水量的变化,从而影响流域水资源及其未来趋势。尽管部分流域的水文模拟考虑了表碛对冰川消融及其径流的影响[26-28],但这些研究并没有考虑表碛厚度空间分布的影响。表碛厚度不均匀的空间分布使得冰川表面产生了差异性的消融,从而在消融区容易形成冰面湖塘[29-30]和冰崖[31-33]。冰面湖塘和冰崖在表碛覆盖型冰川消融区分布较为广泛,这些冰面湖塘和冰崖是冰川流域水文过程的重要影响因素[13, 25, 32-34],同时冰面湖塘还是冰川灾害的策源地(如溃决洪水),影响下游地区生产和生活[13, 35-38]。因此,迫切需要发展较好刻画表碛覆盖型冰川消融区表碛厚度空间分布及其下覆冰川消融物理过程的模型,将有助于研究该类型冰川的气候响应过程和水资源效应。
对于表碛厚度的不均匀分布及其影响这一过程的模拟一直以来都为人们所关注。Kraus[39]首先从冰雪表面能量平衡的角度,构建了一个理论消融模型,该模型特别考虑了表碛覆盖、地形风系统和坡度等的变化对冰面消融的影响。Nakawo等[10-11]基于能量平衡方程,对薄层表碛覆盖下的冰面消融进行了估算,估算结果与实测消融量有着较好的一致性。随后,基于热传导理论和能量平衡原理,在不同表碛覆盖型冰川区发展了不同类型的基于物理过程的表碛覆盖冰川消融模型[11, 15, 23, 40-43],在冰川尺度上能够较好模拟不同厚度表碛层下的冰川消融过程,从物理机制上分析了表碛空间分布的影响。然而,这些模型均需要较多的输入参数,尤其是表碛厚度、地表温度、表碛热属性参数等,限制了这类模型在流域/区域尺度上的应用。本文旨在介绍中国西部表碛覆盖型冰川区表碛厚度分布估算及其影响的研究进展,重点介绍近期发展的基于遥感影像热红外波段和可见光近红外波段、大气—表碛层—冰川界面能量平衡过程的表碛厚度估算方法和表碛覆盖综合评估模型及其应用,为进一步研究中国西部流域/区域尺度表碛覆盖型冰川区表碛影响及该类型冰川对气候变化响应特征和区域水资源效应奠定基础。
2 表碛—海拔分布特征
青藏高原东南部海螺沟冰川开展的表碛厚度观测表明[16],消融区上部表碛相对较薄,随着海拔高度的降低,表碛厚度呈增加趋势,冰川末端最厚(图1)。冰川在重力的作用下能够通过冰川内部的塑性变形和底部滑动实现向下游的运动,在运动过程中除通过刨蚀和掘蚀从冰床上获得冰碛物外,冻融作用、冰/雪崩都会导致冰川两侧山坡上的岩屑物质崩落至冰川表面或进入冰川内部[2, 44-45]。随着冰川向下的运动,冰川内部分布较浅的岩屑由于冰面消融而暴露于冰川表面,与冰面岩屑物质等形成了大量粒度不一(从细粒到巨大的漂砾)、成分复杂的表碛。表碛与冰川一起向下游运动,随着冰川运动速度的减缓,表碛在不同海拔高度堆积,尤其在冰川末端。因此冰川末端的表碛较厚,而消融区上部较薄。在其他典型表碛覆盖型冰川开展的表碛厚度观测中,也发现了相同的表碛—海拔高度分布特征[2, 4, 18-20, 46-47]。在海螺沟冰川区的表碛厚度观测中发现,在同一海拔高度上表碛厚度的空间分布差异较大,其厚度一般由中间向两侧逐渐增厚[16]。基于中国西部少数几条冰川表碛厚度—海拔分布数据[2, 4, 16, 18-19]分析发现,不同区域、不同类型的表碛覆盖型冰川区的表碛厚度差异显著。天山南坡科其喀尔冰川(亚大陆型)末端表碛平均厚度为1.5 m,局部超过2.0 m[19];位于青藏高原东南部贡嘎山东坡的海螺沟冰川(海洋型),其冰川末端表碛平均厚度为0.4 m,最大表碛厚度约1.0 m[16](图1),贡嘎山西坡的大贡巴冰川和小贡巴冰川末端平均厚度分别为1.0 m和0.3 m左右[2]。表碛在冰川区的积累受多个因素的影响,其中最重要的因素是冰川流域潜在表碛供应陡坡的分布[6, 44],该类型陡坡在冰川流域分布越广,通过冻融作用、冰/雪崩等使得陡坡上的岩屑物质崩落至冰川表面或进入冰川内部的越多[2, 6, 44-45]。表碛在冰川区积累后随冰川一起向下游运动,从而在不同海拔高度堆积,形成厚度不一的表碛层。通过对比上述4条冰川的运动速度[2, 48-49]发现,海螺沟冰川平均冰川运动速度最大[49],其次是科其喀尔冰川[48],大贡巴和小贡巴冰川相对较小[2]。尽管海螺沟冰川与小贡巴冰川末端表碛平均厚度差别不大,但二者的冰川运动速度相差很大,前者最大冰川流速可达205.0 m a-1[49],而后者仅为36.0 m a-1[2],由此可见,冰川运动速度的大小对表碛厚度的影响较小。然而,由于表碛厚度监测数据的限制,目前对中国西部不同区域、不同类型冰川表碛厚度差异特征及原因尚需进一步分析。
3 表碛厚度估算方法
目前发展的各类表碛覆盖冰川消融模型,均需要表碛厚度、表碛层热属性及其分布等输入参数[14-15, 23, 40-42]。由于获取困难,仅少数表碛覆盖型冰川有表碛厚度、地表温度、热属性参数等实测资料[4, 15-16, 18-23, 40],因而制约了在流域/区域尺度上认识表碛的影响。随着遥感技术的发展,由于其监测的全球覆盖能力、区域快速重复观测能力以及高空间分辨率优势,为流域/区域尺度表碛厚度、表碛层热属性参数及其空间分布的估算提供了数据支持。基于遥感影像,发展了不同的表碛厚度估算方法,已在不同地区表碛覆盖型冰川的研究中得到了广泛地应用[8, 20-21, 47, 50-61]。3.1 地表温度—表碛厚度关系法
表碛层属于不良导热体,而其下覆的冰川冰具有冷却作用,导致不同厚度的表碛向下传导的热量和所受的冰川冰冷却作用不同。与裸冰相比,不同厚度的表碛具有不同的温度差,从而基于表碛层的表面温度对其厚度进行间接的反演。基于遥感影像的热红外波段数据,利用定标系数对图像整型数值(DN值)进行辐射定标,将像元的DN值转换为大气层上界光谱辐射亮度,然后利用与传感器对应的近似普朗克函数公式转化为地表温度[62-64],获取冰川区地表温度及其空间分布。基于冰川区不同海拔高度表碛厚度实测数据和相应位置遥感反演的地表温度,建立地表温度—表碛厚度经验关系;基于该关系式和遥感反演的地表温度值,估算表碛的厚度及其空间分布[20-21, 50, 65]。Mihalcea等[20-21]基于ASTER影像的热红外波段反演了冰川区的地表温度,结合野外实测的表碛厚度,利用统计回归方法获取了不同海拔高度带地表温度与表碛厚度之间的统计关系,以此为基础,分别估算了喀喇昆仑山巴托拉冰川和意大利Miage冰川消融区的表碛厚度,分析了表碛厚度的空间分布特征。Juen等[50]利用3种不同的回归方法构建了天山南坡科其喀尔冰川消融区ASTER影像反演地表温度与表碛厚度之间的关系式,但3类方法获取的相关关系都不显著,这可能是由于表碛在消融区的分布具有显著的异质性特征,消融区冰崖、冰面湖塘等广泛分布[31],导致冰川消融区地形条件非常复杂,实测数据很难代表整个海拔高度的表碛厚度分布特征。然而,依据这些统计关系式和遥感反演的地表温度对表碛层厚度进行间接反演时会产生一定误差,尤其不适用于较厚的表碛分布区[20, 58-59];同时这些经验关系式通常不能直接应用于其他冰川区,需要针对不同的气象条件和不同的冰川对地表温度—表碛厚度关系重新进行校准。
3.2 SAR表碛厚度探测
中国西部表碛覆盖型冰川地处偏远,海拔较高,进行冰川区实地监测较为困难。如上所述,遥感现已成为大范围表碛覆盖型冰川研究的必备手段,尤其是合成孔径雷达(SAR)技术。在全极化SAR图像中,表碛粗糙度比周边地物的高,显示了其独特的散射信息[51-53],进而可有效区分表碛覆盖区与非表碛覆盖区。在天山南坡科其喀尔冰川的研究表明,在交叉极化通道,无论是SAR的L波段还是C波段,与周围地物相比,表碛的后向散射系数高,从而有效区分表碛与非表碛,其精度达到了90%[51]。合成孔径雷达,尤其是长波段雷达,对地物具有一定的穿透性,特别是L波段的全极化雷达,在其对表碛穿透深度范围内,体散射分量随着表碛厚度的增加而增大,而C波段的雷达没有这一现象[51],基于此,通过合成孔径雷达估算表碛的厚度。与热红外波段相比,全极化合成孔径雷达分辨率更高,且几乎不受天气条件的影响[52],为地处偏远、海拔较高的冰川区表碛厚度的估算提供了可能,使其在表碛覆盖型冰川研究中有着广泛的应用前景。然而,SAR对表碛层的穿透深度较浅,对厚层表碛很难识别。
3.3 基于能量平衡方程估算表碛厚度
发展基于物理机制的表碛厚度估算模型是表碛覆盖型冰川研究的重要研究内容之一。基于热传导理论和能量平衡原理,该类模型首先通过对表碛层能量平衡方程求解,获取表碛层中的传导热通量;同时,基于傅立叶定律,假定表碛—冰川冰界面处的温度为0 ℃,表碛层传导热通量可作为表碛层导热系数、地表温度和表碛厚度的函数;然后将两类不同方法获取的表碛层传导热通量相结合,从而估算表碛厚度[54-55, 61]。需要指出的是,由于潜热通量在表碛层能量组成中所占比例较小[66],在模型计算过程中忽略不计。Foster等[61]利用遥感影像的热红外波段数据、实测的表碛厚度、表碛温度和气象数据,发展了基于能量平衡方程估算表碛厚度的模型。该模型在计算过程中,假定表碛层内的温度剖面呈线性变化,且认为遥感影像获取时段的表碛层较为干燥,同时基于机载激光雷达测量生成的数字高程模型评估了冰川表面坡度等地形特征对模型估算表碛厚度的影响。该模型已应用于意大利的Miage冰川,与该冰川表碛厚度实测值和已发布的表碛厚度分布图[20]对比发现,能够较为准确地估算出表碛厚度及其分布,并基于不同时期的遥感影像数据,成功验证了该模型在同一冰川区的时间可转移性。Schauwecker等[54-55]进一步发展了上述模型,认为表碛层内的温度剖面呈非线性变化而不是线性变化,且表碛层能量平衡闭合于表碛层的上层而非整层,并成功应用于喜马拉雅山区的Bara Shigri冰川。
模型越是基于物理基础,其受到所使用的输入数据质量的影响就越大。上述模型使用了大量的冰川区实测数据[54-55, 61],如机载雷达测量数据、地表特征数据、表碛厚度、地表温度、表碛导热系数等,导致模型很难移植到其他表碛覆盖型冰川区,尤其是很难在流域/区域尺度上应用于较为偏远的表碛覆盖型冰川的研究。
3.4 基于表碛热阻系数估算表碛厚度
为了获取流域/区域尺度表碛厚度及其空间分布特征,提出了表碛层热阻系数这一概念,其定义为表碛厚度与表碛层导热系数的比值[10-11],并采用这一参数作为冰川区不同厚度表碛空间分布的代用指标[10-11, 16, 25, 47, 56, 60]。由其定义可知,在表碛厚度和表碛层导热系数已知的情况下可计算出表碛热阻系数,然而,在较大尺度上,尤其区域尺度上,上述各参数很难获取。在实际计算表碛热阻系数的过程中,通常假定冰内热传导为零、表碛层内储热变量忽略不计,且表碛层的温度剖面呈线性变化[10, 39],表碛层内的传导热通量可描述为地表温度与表碛热阻系数的函数;同时传导热通量也可描述为表碛层能量平衡的残余项,可基于能量平衡方程求解获取;上述两种方法获取的表碛层传导热通量相结合,可以计算表碛热阻系数[8, 10-11, 16, 25, 56, 60]。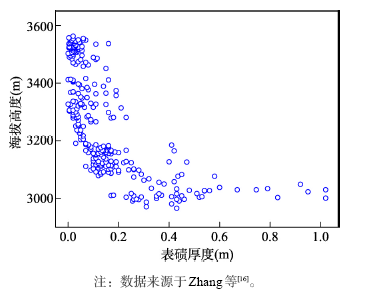 显示原图|下载原图ZIP|生成PPT
图1青藏高原东南部海螺沟冰川区表碛厚度随海拔高度的变化特征
-->Fig. 1Variation in debris thickness with altitude on the Hailuogou Glacier in the southeastern Tibetan Plateau
-->
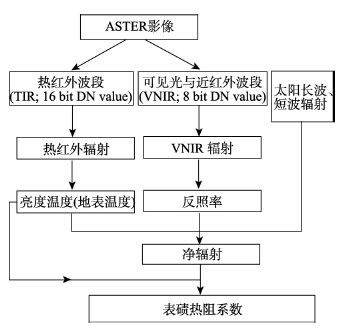
在喜马拉雅山、喀喇昆仑山、贡嘎山等地区表碛覆盖型冰川开展的能量平衡野外观测试验与研究中发现,在能量组成中,净辐射是主要的热量来源,湍流热通量(感热和潜热通量)所占比例较小,尤其在冰川消融期的晴朗天气条件下,这一能量组成特征更显著[9, 11, 14, 16, 60, 67]。因此,在表碛热阻系数的计算过程中忽略了湍流热通量。图2是基于ASTER影像的可见光近红外波段(VNIR;波段1~3)、热红外波段(TIR;波段10~14)和太阳辐射(包括长波、短波辐射)数据估算冰川区表碛热阻系数的流程图。其中,地表温度是基于ASTER影像数据的热红外波段应用3.1节中方法进行估算[62-64],ASTER影像可见光近红外波段大气顶部的光谱反射率用来估算宽波段的反照率[68],然后结合太阳长波、短波辐射数据,计算冰川区的净辐射;最后依据估算的净辐射和地表温度获取冰川区的表碛热阻系数(图2)。需要指出的是,太阳辐射数据来源于冰川区观测资料或再分析数据,如NCEP/NCAR数据[69]、FLASHFlux数据[70]等,其获取的时间和位置必须与ASTER影像获取时间和位置一致。
 显示原图|下载原图ZIP|生成PPT
图2基于ASTER数据反演表碛层热阻系数流程(TIR和VNIR分别指ASTER数据的热红外波段和可见光近红外波段)
-->Fig. 2Schematic diagram of the method used to calculate the thermal resistance of the debris cover using ASTER data (TIR and VNIR denote thermal infrared and visible/near-infrared bands of ASTER)
-->
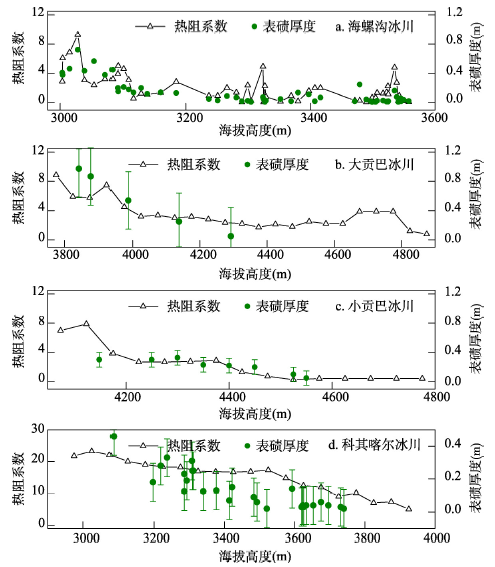
上述方法已应用于喜马拉雅山[25, 47, 56, 60]、贡嘎山[8, 16]、高加索山[70]和西南天山等地区的不同典型表碛覆盖型冰川的研究中。在不同规模、不同类型典型冰川区研究中发现,遥感反演的表碛热阻系数与表碛厚度实测值具有较好的相关性,且二者的空间分布较为一致(图3)。同样,在喜马拉雅山Khumbu冰川也发现了表碛热阻系数与表碛厚度空间分布相一致的规律[60]。尽管该方法具有一定的不确定性,但Zhang等[16]成功地验证了表碛热阻系数作为不同厚度表碛空间分布的代用指标,并且这一方法的不确定性已在不同地区表碛覆盖型冰川开展的研究中进行了深入探讨[8, 16, 25, 60]。在喜马拉雅山不同表碛覆盖型冰川的研究中,Suzuki等[60]采用两种完全不同的方法获取了同一冰川区表碛的热阻系数及其空间分布,首先基于多期ASTER影像数据和NCEP/NCAR太阳辐射资料,应用上述方法估算了表碛的热阻系数;同时,基于该冰川区的野外观测数据(包括温度、湿度、风速、太阳辐射等),采用能量平衡模型估算了同一冰川区的表碛热阻系数,在这一计算过程中考虑了所有能量组分,包括湍流热通量(感热和潜热通量)。对比发现,在表碛热阻系数估算过程中,忽略湍流热通量和应用不同时段ASTER影像数据基本不影响表碛热阻系数的空间分布趋势;同时发现山体对太阳辐射的遮蔽作用对热阻系数空间分布的影响不明显[60]。Fujita等[25]评估了基于ASTER影像和NCEP/NCAR太阳辐射数据反演的表碛热阻系数及其不确定性对冰川流域径流模拟的影响,结果发现,应用上述方法计算的表碛热阻系数和反照率所产生的不确定性对流域径流模拟的影响相对较小,在没有校准数据的情况下,二者所产生的不确定性对径流的影响仅占径流总量的8%,且表碛热阻系数不确定性的影响比反照率的影响小。由此可见,遥感反演的表碛热阻系数可作为不同厚度表碛空间分布的代用指标,其在流域/区域尺度表碛影响的研究中具有广泛的应用前景。
 显示原图|下载原图ZIP|生成PPT
图3不同冰川区表碛厚度实测数据与ASTER影像反演的表碛热阻系数(×10-2 m2 K W-1)对比图
-->Fig. 3Comparison of ground-surveyed debris thicknesses and ASTER-derived thermal resistances of debris layers (×10-2 m2 K W-1) on the Hailuogou (a), Dagongba (b), Xiaogongba (c) and Keqicar (d) glaciers. Error bars denote standard deviation
-->
4 表碛厚度分布影响及其评估
4.1 表碛厚度分布影响
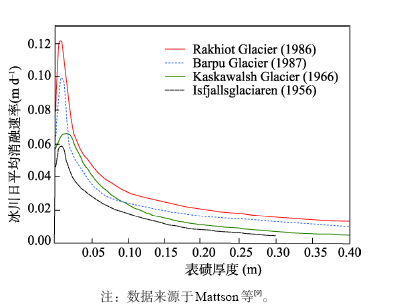
研究表明[9-12, 14],当表碛层厚度小于某一临界厚度(<约20~30 mm),其下覆冰川冰消融大于裸冰消融,即表碛加速了冰川消融;随着表碛厚度的增大(大于临界厚度),表碛的阻热作用抑制了冰川消融(图4)。表碛层的反照率远低于冰雪表面,能够接受更多的太阳辐射,对于较薄的表碛来说,在加热表碛层的同时,仍有大量热量向下覆冰层输送,进而使下覆冰层融化增加;当表碛层较厚时,大部分热量用于加热表碛层,随表碛厚度的增加,到达下覆冰面的热量随之减少,且在气层不稳定层结条件下,表碛层表面部分热量还要向上传导给空气,从而减少了到达冰川表面的热量,对冰面消融起到了抑制作用[3, 9, 13, 15]。在天山南坡科其喀尔冰川海拔3620 m处的消融观测点,表碛厚度约为30 mm左右,与裸冰区消融量相比,该处的消融量减少了46.5%[19];而在喜马拉雅山绒布冰川海拔5750 m处的消融观测点,相比裸冰,表碛厚度为50 mm处的冰川消融速率增加了67%[18]。在青藏高原东南部海螺沟冰川消融区的研究表明,由于表碛厚度的不均匀分布,消融区44.0%的区域处于加速消融状态,约17%的冰川消融受到抑制[8]。对于青藏高原东南部贡嘎山地区的表碛覆盖型冰川来说,当表碛覆盖比例小于20%时,表碛的存在导致该地区25%的表碛覆盖型冰川物质损失加速,随着表碛覆盖比例的增加,冰川物质损失逐渐受到抑制[8]。基于不同表碛覆盖型冰川的消融观测资料分析发现[13, 16, 18-19, 72],冰川区最大消融量并没有出现在冰川末端,而是出现于消融区中部区域,与无表碛覆盖型冰川不同。冰川消融的这种空间分布特征势必影响冰川物质平衡梯度[13]和冰川径流的空间分布[24-25]。在尼泊尔喜马拉雅山Trambau冰川流域的径流模拟表明,表碛覆盖冰川区是该流域径流主要的产流区,大约55.5%的流域径流量来源于表碛覆盖冰川区,特别是海拔较低的表碛分布区[25]。
 显示原图|下载原图ZIP|生成PPT
图4不同冰川区日平均消融强度与表碛厚度的关系
-->Fig. 4Relationship between ice ablation rate and debris thickness on different debris-covered glaciers
-->
基于不同山区有限的表碛厚度观测及其影响分析发现(表2),冰川区表碛覆盖比例介于2.0%~36.0%之间,且不同山区表碛覆盖比例差异很大。尽管这些山区表碛覆盖比例差异显著,但总体上表碛的影响以抑制冰川消融为主,仅部分表碛厚度分布较薄的区域以加速冰川消融为主,如喜马拉雅山的Trambau冰川流域和贡嘎山区。
Tab. 2
表2
表2不同山区表碛影响的特征
Tab. 2Characteristics of the debris-cover effect in different mountains
| 区域 | 表碛覆盖比例(%) | 表碛影响 | 表碛厚度(m) | 参考文献 |
|---|---|---|---|---|
| 高加索山 | 8.1~23.0 | 抑制消融为主 | - | [73] |
| 阿尔泰山 | 3.7~25.8 | 抑制消融为主 | - | [74] |
| 天山托木尔峰地区 | 7.5~22.0 | 抑制消融为主,2%的区域加速消融 | 0~2.5 | [1, 3, 26] |
| 兴都库什—喀喇昆仑—喜马拉雅山地区 | 2.0~36.0 | 抑制消融为主 | - | [5] |
| Langtang流域 | 19.0 | 抑制消融为主 | - | [32, 56] |
| Trambau冰川流域 | 15.1 | 加速消融为主 | - | [25] |
| 贡嘎山地区 | 13.5 | 10.2%的消融区加速消融,40.8%抑制消融 | 0~1.4 | [8] |
| 新西兰南阿尔卑斯山区 | 8.0 | 抑制消融为主 | 0~3 | [75] |
新窗口打开
4.2 表碛覆盖综合评估模型及应用
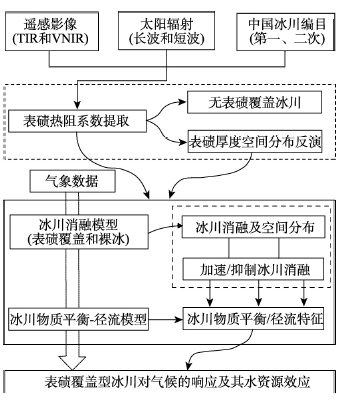
综上所述,表碛覆盖及其影响的区域差异显著(表2)。在兴都库什—喀喇昆仑—喜马拉雅山地区,基于不同的遥感数据,评估了该地区冰川的物质变化特征,分析发现,尽管表碛影响以抑制冰川消融为主,但表碛覆盖冰川平均物质损失速率与无表碛覆盖冰川相差无几[76-77],即使在同一海拔范围内也具有类似的结果[78];而在喜马拉雅山区的Langtang流域冰川物质变化研究中没有发现类似的现象[79]。然而,这些研究中对表碛覆盖影响的评估是基于不同的方法获取的,加之使用的遥感数据类型、空间分辨率等的不同[76-79],尤其是很多区域没有表碛厚度分布的观测数据(表2),导致在流域/区域尺度上表碛影响的空间变异性较大[77-78],且仍存在一定的争议。因此,迫切需要发展表碛空间分布与影响评估方法对表碛分布及影响进行综合评估,将有助于研究表碛覆盖型冰川物质平衡变化过程及其水资源效应。为了克服上述困难,Zhang等[8]在综合评估青藏高原东南部贡嘎山地区表碛厚度空间分布的影响研究中,基于遥感影像热红外波段和可见光近红外波段、大气—表碛层—冰川界面能量平衡过程构建了表碛覆盖综合评估模型。该模型基于遥感反演的表碛热阻系数及其空间分布,耦合了大气、表碛层、冰川等不同界面的能量收支过程,主要包括三个模块:表碛空间特征提取模块、冰川消融模块和冰川物质平衡/径流模块(图5)。
 显示原图|下载原图ZIP|生成PPT
图5表碛覆盖综合评估模型在中国西部冰川区应用流程图
-->Fig. 5Flow chart of debris-cover effect assessment model applied to the Chinese glaciers
-->
表碛空间特征提取模块是基于遥感影像的热红外波段和可见光近红外波段,反演表碛热阻系数及其空间分布(图2),从而表征冰川区表碛厚度的空间分布特征。依据表碛热阻系数(R),将冰川区划分为表碛覆盖区(R > 0)和无表碛覆盖区(R ≤ 0)。在消融模块中,表碛覆盖区和无表碛覆盖区的冰川消融量是基于相应界面的能量平衡过程计算获取。在冰川物质平衡/径流模块中,冰川区任一点的物质平衡与径流量可基于对冰川消融、降雨和融水再冻结量的计算获取。为综合评估表碛空间分布的影响,提出了消融比率(MR)这一概念,其定义为表碛覆盖格网冰川消融量与同一格网假定无表碛覆盖时冰川消融量的比值。当MR > 1.0,表明表碛覆盖冰川冰消融量大于无表碛覆盖冰川冰的消融量,即表碛覆盖促进冰川消融;当MR < 1.0,说明表碛抑制冰川消融;当MR = 1.0,说明表碛下覆冰川消融量与裸冰消融量一致。该模型及其计算过程的详细介绍可参考Zhang等[8]。
上述模型已成功应用于不同尺度的表碛影响研究中[8, 24]。在流域尺度上,Zhang等[24, 80]应用该模型评估了青藏高原东南部海螺沟冰川流域表碛空间分布对流域冰川消融和径流的影响。该流域有7条冰川,其中3条较大的冰川属于表碛覆盖型冰川。基于ASTER影像数据,反演了3条冰川区的表碛热阻系数及其空间分布,分析发现表碛覆盖面积占3条冰川消融区总面积的39%[80]。以此作为模型输入计算了不同表碛厚度下的冰川消融速率和流域径流量。与不同时期、不同表碛厚度下的冰川消融、流域径流实测值对比发现,尽管个别时间点的模拟值有偏差,但大多数情况下的模拟消融与径流比较准确[8, 24, 80]。由此可见,该模型能够较好的模拟不同厚度表碛下的冰川消融速率和流域径流过程。基于模型效果,评估了表碛空间分布对该流域消融和径流的影响。分析发现,该流域表碛的不均匀分布主要起到了加速冰川消融的作用,而抑制作用相对较小;与无表碛覆盖条件下的流域径流相比,表碛覆盖状态下的流域径流将增加约8.1%[24]。这一发现与Fujita等[25]在尼泊尔喜马拉雅山Trambau冰川流域所获取的结果类似,而与Nakawo等[56]在尼泊尔Lirung冰川流域获取的结果相反。在区域尺度上,Zhang等[8]获取了贡嘎山地区冰川消融区表碛的空间分布特征,分析了其空间分布的影响,结果发现,贡嘎山地区冰川的表碛分布十分广泛,68%的冰川属于表碛覆盖型冰川,表碛覆盖面积为32 km2,占冰川面积的13.5%,且多分布于面积较大的冰川;依据消融比率值可知,约10.2%的区域表碛起到了促进冰川消融的作用,约40.8%的区域表碛抑制了冰川消融。对于该地区5条长于10 km的冰川来说,其表碛覆盖率介于1.74%~20.1%之间,其中,磨子沟冰川的表碛覆盖面积最小,南门关沟冰川最大;仅海螺沟冰川区以表碛促进消融为主,其余冰川区则以抑制作用为主(表3)。
Tab. 3
表3
表3青藏高原东南部贡嘎山区长度大于10 km冰川表碛分布及其影响
Tab. 3Distribution of debris cover and its effect on five debris-covered glaciers with length >10 km on Mount Gongga of the southeastern Tibetan Plateau
| 冰川 | 海拔 (m a.s.l.) | 面积 (km2) | 长度 (km) | 表碛面积 比例(%) | 表碛覆盖影响(%) | |
|---|---|---|---|---|---|---|
| 加速 | 抑制 | |||||
| 海螺沟 | 2990~7556 | 25.7 | 13.1 | 6.4 | 44.0 | 17.0 |
| 大贡巴 | 3660~6684 | 21.2 | 11.0 | 16.8 | 3.0 | 56.0 |
| 磨子沟 | 3600~6886 | 26.8 | 11.6 | 1.74 | 2.0 | 11.0 |
| 燕子沟 | 3680~7556 | 32.2 | 11.7 | 11.7 | 41.0 | 50.1 |
| 南门关 | 3460~6540 | 16.7 | 10.0 | 20.1 | 17.0 | 35.6 |
新窗口打开
5 结论与展望
中国西部表碛覆盖型冰川分布广泛,其冰川物质平衡模拟、径流预估以及冰面湖泊突发洪水评估等都需要考虑表碛厚度的空间分布及其对冰川消融过程的影响,这一特征完全不同于无表碛覆盖型冰川。目前,在流域/区域尺度上,对表碛厚度、表碛热属性参数及其空间分布等进行实地观测较为困难,导致观测资料缺乏,使得表碛影响的系统评估能力不强。为了克服上述的困难,发展了基于遥感影像和大气—表碛层—冰川界面能量平衡过程的表碛覆盖综合评估模型。该模型以遥感反演的表碛热阻系数为核心,能够有效地模拟冰川消融、物质平衡和径流,系统分析表碛厚度空间分布对这些物理过程的影响。该模型不需要直接测量表碛层厚度及相关的热属性参数,直接以遥感影像反演的表碛层热阻系数为输入参数,有效地评估表碛对消融、物质平衡和径流过程的影响,减少了野外监测工作,简化了计算过程。表碛覆盖型冰川所分布的区域是很多大江大河的水资源形成区,这些表碛覆盖型冰川在不同时空尺度的变化势必导致这些河流水量的丰枯变化,从而影响各流域及下游地区的水资源。表碛覆盖综合评估模型为分析这些地区表碛覆盖型冰川对气候变化的响应及其对水资源的影响提供方法支持。基于遥感影像数据(包括可见光近红外和热红外波段)、中国第一、二次冰川编目数据[81]和太阳辐射数据(包括长波、短波辐射)(图5),可以估算中国西部表碛覆盖型冰川区表碛热阻系数;基于表碛热阻系数的空间分布,区分表碛覆盖冰川区和无表碛覆盖冰川区,进而反演表碛厚度及其空间分布,从而分析表碛厚度分布的区域差异;以此作为表碛覆盖综合评估模型的输入数据,结合长序列的气象观测资料或再分析资料,系统评估表碛对冰川消融、物质平衡与水资源的影响,进而研究该类型冰川对气候响应的区域性差异。
表碛厚度空间分布具有显著的异质性特征,导致冰川表面显著地差异性消融,从而在消融区表面形成了复杂的地表形态,即冰崖、冰面湖塘、裸冰、表碛覆盖等共同存 在[13, 29-31, 37, 82-84]。研究表明[13, 82-83],表碛覆盖区这一地表组合分布较为广泛,能提供相当于同面积中厚层表碛覆盖区数倍的冰川融水。冰面湖形成后,通过湖岸冰崖面消融、湖水位线附近的热融扩张、湖底冰面消融、湖岸冰崖冰崩解等方式扩张[84]。而许多高大的冰崖下侧常常发育有巨大的冰湖,一方面,冰崖的存在对冰湖起到了拦蓄的作用;另一方面,在气候因子作用下,冰崖的不断消融与形态演化也可能为冰湖的溃决创造条件。然而,表碛覆盖综合评估模型没有考虑这一复杂地表组合对该界面能量平衡过程的影响,因此,通过强化野外综合观测(如典型冰面湖—大气界面能量通量等)和室内分析,结合高分辨率数字高程模型,发展表碛覆盖消融区复杂地表过程模型,如冰崖消融—演化模型[34, 85]和冰面湖塘能量平衡模型[86],并集成到现有的表碛覆盖综合评估模型中,从而实现表碛影响系统的、全面的评估,以便更好地认识表碛及周边复杂地表相互作用机理,提升对区域表碛影响的评估能力,准确认识中国西部表碛覆盖型冰川对气候响应的机理,促进其对区域水资源和冰川灾害的模拟和预测能力。
The authors have declared that no competing interests exist.
参考文献 原文顺序
文献年度倒序
文中引用次数倒序
被引期刊影响因子
| [1] | . 基于2003—2005年考察期间观测的气温与降水资料,运用度日物质平衡模型模拟了天山南坡科契卡尔巴西冰川近期的物质平衡变化状况.结果表明:度日物质平衡模型模拟的冰川物质平衡值与实测值的变化趋势基本一致,模型模拟结果较为理想;2003/2004年度和2004/2005年度两个物质平衡年的平均物质平衡值分别为-494和-384 mm,平衡线高度(<i>ELA</i>)比20世纪70年升高了300 m左右.由此可见,在由暖干向暖湿转型的气候背景下,尽管降水增加显著,但强烈的升温导致科契卡尔巴西冰川处于强烈的物质亏损状态. . 基于2003—2005年考察期间观测的气温与降水资料,运用度日物质平衡模型模拟了天山南坡科契卡尔巴西冰川近期的物质平衡变化状况.结果表明:度日物质平衡模型模拟的冰川物质平衡值与实测值的变化趋势基本一致,模型模拟结果较为理想;2003/2004年度和2004/2005年度两个物质平衡年的平均物质平衡值分别为-494和-384 mm,平衡线高度(<i>ELA</i>)比20世纪70年升高了300 m左右.由此可见,在由暖干向暖湿转型的气候背景下,尽管降水增加显著,但强烈的升温导致科契卡尔巴西冰川处于强烈的物质亏损状态. |
| [2] | |
| [3] | |
| [4] | . <p>青藏高原海洋型冰川在气候变化和水资源利用等方面具有重要的理论与现实意义, 但对其近期变化的研究却相对薄弱. 通过对藏东南帕隆藏布流域内6条海洋型冰川的物质平衡和末端变化观测研究, 揭示出2005/2006~2007/2008物质平衡年内, 6条监测冰川的物质平衡均为负值, 冰川末端持续后退的事实. 从面积等级来看, 面积较小的冰川相对于面积较大的冰川显现出更大的相对物质损失. 结合横断山、喜马拉雅山地区海洋性冰川物质平衡变化趋势及藏东南冰川近期面积萎缩的事实, 如果现在气候变化趋势继续, 预测该区海洋型冰川在今后的一段时间内还将处于物质损失和末端后退状态.</p> . <p>青藏高原海洋型冰川在气候变化和水资源利用等方面具有重要的理论与现实意义, 但对其近期变化的研究却相对薄弱. 通过对藏东南帕隆藏布流域内6条海洋型冰川的物质平衡和末端变化观测研究, 揭示出2005/2006~2007/2008物质平衡年内, 6条监测冰川的物质平衡均为负值, 冰川末端持续后退的事实. 从面积等级来看, 面积较小的冰川相对于面积较大的冰川显现出更大的相对物质损失. 结合横断山、喜马拉雅山地区海洋性冰川物质平衡变化趋势及藏东南冰川近期面积萎缩的事实, 如果现在气候变化趋势继续, 预测该区海洋型冰川在今后的一段时间内还将处于物质损失和末端后退状态.</p> |
| [5] | . Controversy about the current state and future evolution of Himalayan glaciers has been stirred up by erroneous statements in the fourth report by the Intergovernmental Panel on Climate Change(1,2). Variable retreat rates(3-6) and a paucity of glacial mass-balance data(7,8) make it difficult to develop a coherent picture of regional climate-change impacts in the region. Here, we report remotely-sensed frontal changes and surface velocities from glaciers in the greater Himalaya between 2000 and 2008 that provide evidence for strong spatial variations in glacier behaviour which are linked to topography and climate. More than 65% of the monsoon-influenced glaciers that we observed are retreating, but heavily debris-covered glaciers with stagnant low-gradient terminus regions typically have stable fronts. Debris-covered glaciers are common in the rugged central Himalaya, but they are almost absent in subdued landscapes on the Tibetan Plateau, where retreat rates are higher. In contrast, more than 50% of observed glaciers in the westerlies-influenced Karakoram region in the northwestern Himalaya are advancing or stable. Our study shows that there is no uniform response of Himalayan glaciers to climate change and highlights the importance of debris cover for understanding glacier retreat, an effect that has so far been neglected in predictions of future water availability(9,10) or global sea level(11). |
| [6] | |
| [7] | |
| [8] | . |
| [9] | . Reports on ablation research carried out on the Rakhiot Glacier, Punjab, Himalaya. Specifically, detailed measurements of ablation rates on debris covered and debris free surfaces allow specification of relationships between ablation and debris cover thickness. Direct ablation measurements indicate a sharp increase in ablation with debris cover thickness increasing from 0.0 to 10 mm followed by a decrease in ablation with debris cover thickness increasing beyond 10 mm. Field observations reveal a critical thickness of 30 mm indicating that at any greater debris thickness ablation is suppressed from that expected on debris-free ice. A comparison with previous research indicates similar hyperbolic trends in the relationship between debris cover thickness and ablation, however, the intensity of these trends differ with global location. -Authors |
| [10] | . Ablation of glacier ice has been observed with artificial debris layers prepared with Ottawa sand (ASTM C-109) ranging from 0.01 to 0.1 m thick. Data on external variables observed during the experiments and determination of physical constants of the debris layers have allowed the testing of a proposed simple model. Theoretical predictions compare favourably with the observations. Discussion is extended to a proposal for a simple method by which ablation under a debris layer could be estimated even if the thermal conductivity or thermal resistance of the material were unknown. |
| [11] | . A simple model suggests that the ablation under a debris layer could be estimated from meteorological variables if the surface temperature data of the layer are available. This method was tested by analyzing the data obtained from experiments with artificial debris layers. Fairly good agreement was obtained between the estimated and the experimental data. |
| [12] | . |
| [13] | . An important threshold is crossed when downwasting glacier surfaces intersect the hydrological base level of the glacier. Base-level lakes formed behind intact moraine dams can grow monotonically, and in some cases can pose serious GLOF hazards. Glacier termini can evolve in different ways in response to the same climatic forcing, so that potentially hazardous lakes will form in some situations but not others. Additionally, the probability of a flood is not simply a function of lake volume, but depends on the geometry and structure of the dam, and possible trigger mechanisms such as ice- or rockfalls into the lake. Satellite-based measurements of glacier surface gradient and ice velocities allow probable future locations of base-level lakes to be identified. A base-level lake has begun to grow rapidly on Ngozumpa Glacier west of Mount Everest, and could attain a volume of ~ 10 8 m 3 within the next 2 or 3 decades. Unless mitigation efforts are undertaken, this lake could pose considerable GLOF hazard potential. |
| [14] | . |
| [15] | . Generalized numerical models of sub-debris ice ablation are preferable to empirical approaches for predicting runoff and glacier response to climate change, as empirical methods are site-specific and strongly dependent upon the conditions prevailing during the measurement period. We present a modified surface energy-balance model to calculate melt beneath a surface debris layer from daily mean meteorological variables. Despite numerous simplifications, the model performs well and modelled melt rates give a good match to observed melt rates, suggesting that this model can produce reliable estimates of ablation rate beneath debris layers several decimetres thick. This is a useful improvement on previous models which are inappropriate for thick debris cover. |
| [16] | . Debris cover is widely present in glacier ablation areas of the Tibetan Plateau, and its spatial distribution greatly affects glacier melt rates. High-resolution in situ measurements of debris thickness on Hailuogou glacier, Mount Gongga, southeastern Tibetan Plateau, show pronounced inhomogeneous debris distribution. An analysis of transverse and longitudinal profiles indicates that the ground-surveyed debris thicknesses and Advanced Spaceborne Thermal Emission and Reflection Radiometer (ASTER)-derived thermal resistances of debris layers correlate strongly over the entire ablation area. Across- and along-glacier patterns of ASTER-derived thermal resistance correspond well with spatial patterns of debris thickness, which may reflect large-scale variations in the extent and thickness of the debris cover. The ice melt rate variability over the ablation area simulated by a surface energy-balance model that considered thermal resistance of the debris layer indicates clearly the crucial role of debris and its spatial continuity in modifying the spatial characteristics of melt rates. Because of the inhomogeneous distribution of debris thickness, about 67% of the ablation area on Hailuogou glacier has undergone accelerated melting, whereas about 19% of the ablation area has experienced inhibited melting, and the sub-debris melt rate equals the bare-ice melt rate in only 14% of the ablation area. |
| [17] | |
| [18] | . 根据1959年和2009年在喜马拉雅山珠穆朗玛峰北坡绒布冰川获得的冰川消融数据, 分析了该冰川消融速率变化特征.结果表明: 1) 在珠峰绒布冰川表碛覆盖区, 表碛厚度随海拔升高而降低. 2) 不同厚度表碛下的冰川消融速率差别较大; 当表碛厚度>8.5 cm时, 消融速率随表碛厚度的增加而减小; 促进冰川消融的表碛厚度阈值大于5 cm. 3) 从冰川消融速率的空间分布看, 绒布冰川大部分区域的消融速率<20 mm·d<sup>-1</sup>, 最大消融速率出现在海拔5 400~5 450 m处. 4) 绒布冰川消融速率受表碛厚度和气温综合影响, 低海拔处表碛太厚, 高海拔处气温较低, 冰川消融在上述两海拔处均受抑制, 冰川消融速率较小; 在中海拔处, 表碛相对较薄, 气温相对较高, 冰川消融速率最大; 冰川日均消融速率与日均正积温正相关. 5) 喜马拉雅山南坡冰川消融速率大于北坡冰川消融速率. . 根据1959年和2009年在喜马拉雅山珠穆朗玛峰北坡绒布冰川获得的冰川消融数据, 分析了该冰川消融速率变化特征.结果表明: 1) 在珠峰绒布冰川表碛覆盖区, 表碛厚度随海拔升高而降低. 2) 不同厚度表碛下的冰川消融速率差别较大; 当表碛厚度>8.5 cm时, 消融速率随表碛厚度的增加而减小; 促进冰川消融的表碛厚度阈值大于5 cm. 3) 从冰川消融速率的空间分布看, 绒布冰川大部分区域的消融速率<20 mm·d<sup>-1</sup>, 最大消融速率出现在海拔5 400~5 450 m处. 4) 绒布冰川消融速率受表碛厚度和气温综合影响, 低海拔处表碛太厚, 高海拔处气温较低, 冰川消融在上述两海拔处均受抑制, 冰川消融速率较小; 在中海拔处, 表碛相对较薄, 气温相对较高, 冰川消融速率最大; 冰川日均消融速率与日均正积温正相关. 5) 喜马拉雅山南坡冰川消融速率大于北坡冰川消融速率. |
| [19] | [D]. [D]. |
| [20] | . High resolution in situ surface temperature measurements of supraglacial debris cover on Miage Glacier, Mont Blanc Massif, Italy, are compared to ASTER-derived surface temperature data (TIR band, acquisition time 10:4002UTC + 1:00 on 01–08–2005, in the frame of GLIMS project). Spatial patterns of surface temperature and supraglacial debris cover distribution revealed in the two datasets are described. The ground- and remotely sensed temperatures correlate strongly over continuously debris-covered areas ( r = 0.8), while on partially debris-covered ice (i.e. crevassed areas and ice cliffs) the correlation is weaker ( r = 0.69 over the whole glacier tongue). A map representing the spatial distribution and thickness of the debris cover is derived from the ASTER surface temperature data using debris-surface temperature–thickness relationships ( r = 0.8), calculated in 10002m elevation bands. Over < 102day, surface temperature is influenced by surface meteorological conditions, shading, roughness and elevation; over period of > 102week, debris thickness is the primary control. Both ground and remotely sensed data predict well the thick debris cover at the terminus and its upstream decrease, and broad cross- and along-glacier patterns of debris thickness are revealed in the ASTER data, e.g. moraines, crevassed areas. Finer details in the debris thickness distribution are not revealed in the ASTER data, due mainly to the coarse 9002m resolution of the thermal-band imagery. |
| [21] | . A distributed surface energy-balance study was performed to determine sub-debris ablation across a large part of Baltoro glacier, a wide debris-covered glacier in the Karakoram range, Pakistan. The study area is 124 km2. The study aimed primarily at analyzing the influence of debris thickness on the melt distribution. The spatial distribution of the physical and thermal characteristics of the debris was calculated from remote-sensing (ASTER image) and field data. Meteorological data from an automatic weather station at Urdukas (4022 m a.s.l.), located adjacent to Baltoro glacier on a lateral moraine, were used to calculate the spatial distribution of energy available for melting during the period 1-15 July 2004. The model performance was evaluated by comparisons with field measurements for the same period. The model is reliable in predicting ablation over wide debris-covered areas. It underestimates melt rates over highly crevassed areas and water ponds with a high variability of the debris thickness distribution in the vicinity, and over areas with very low debris thickness (<0.03 m). We also examined the spatial distribution of the energy-balance components (global radiation and surface temperature) over the study area. The results allow us to quantify, for the study period, a meltwater production of 0.058 km3. |
| [22] | . As debris-covered glaciers become a more prominent feature of a shrinking mountain cryosphere, there is increasing need to successfully model the surface energy and mass balance of debris-covered glaciers, yet measurements of the processes operating in natural supraglacial debris covers are sparse. We report measurements of vertical temperature profiles in debris on the Ngozumpa glacier in Nepal, that show: (i) conductive processes dominate during the ablation season in matrix-supported diamict; (ii) ventilation may be possible in coarse surface layers; (iii) phase changes associated with seasonal change have a marked effect on the effective thermal diffusivity of the debris. Effective thermal conductivity determined from vertical temperature profiles in the debris is generally ~30% higher in summer than in winter, but values depend on the volume and phase of water in the debris. Surface albedo can vary widely over small spatial scales, as does the debris thickness. Measurements indicate that debris thickness is best represented as a probability density function with the peak debris thickness increasing down-glacier. The findings from Ngozumpa glacier indicate that the probability distribution of debris thickness changes from positively skewed in the upper glacier towards a more normal distribution nearer the terminus. Although many of these effects remain to be quantified, our observations highlight aspects of spatial and temporal variability in supraglacial debris that may require consideration in annual or multi-annual distributed modelling of debris-covered glacier surface energy and mass balance. Copyright 2012 John Wiley & Sons, Ltd. |
| [23] | . Extensive covers of supraglacial debris are often present in glacier ablation areas, and it is essential to assess exactly how the debris affects glacier melt rates. This paper presents a physically based energy-balance model for the surface of a debris-covered glacier. The model is driven by meteorological variables, and was developed using data collected at Miage glacier, Italy, during the ablation seasons of 2005, 2006 and 2007. The debris surface temperature is numerically estimated by considering the balance of heat fluxes at the air/debris interface, and heat conduction through the debris is calculated in order to estimate melt rates at the debris/ice interface. The predicted hourly debris surface temperatures and debris internal temperatures provide a good fit to temperatures measured on rock-covered Miage glacier (r2 > 0.94) and the tephra-covered glacier on Villarrica volcano, Chile (r2 > 0.82). The model can also be used to reproduce observed changes in melt rates below debris layers of varying types and thicknesses, an important consideration for the overall mass balance of debris-covered glaciers. |
| [24] | . We investigate past and future trends in glacier runoff and the associated hydrological impacts on river runoff in the Hailuogou catchment, a highly glacierized catchment with extensive debris cover in the southeastern Tibetan Plateau, using a catchment-scale glacio-hydrological model. Past trends in various runoff components of the catchment indicate that glacier runoff has been a large component of total runoff, contributing 53.4% of total runoff during the period 1952 2013. Future changes in runoff calculated using the outputs of ten global climate models for representative concentration pathway (RCP) 4.5 and RCP8.5 reveal that glacier runoff plays different roles in the water supply of the catchment for the two RCPs, and the discrepancies between the two RCPs increase in the second half of this century, leading to a considerable difference in the hydrological regime of the catchment. In particular, changes are more remarkable under RCP8.5, under which all glaciers are projected to retreat dramatically and total runoff to decrease slightly by the end of this century. An experimental analysis, in which no debris cover is assumed on glacier ablation zones, indicates that excess meltwater from the debris-covered area provides an 8.1% increase in total runoff relative to the no-debris assumption case. |
| [25] | . Although the processes by which glacial debris mantles alter the melting of glacier ice have been well studied, the mass balance and runoff patterns of Himalayan debris-covered glaciers and the response of these factors to climate change are not well understood. Many previous studies have addressed mechanisms of ice melt under debris mantles by applying multiplicative parameters derived from field experiments, and other studies have calculated the details of heat conduction through the debris layer. However, those approaches cannot be applied at catchment scale because distributions of thickness and thermal property of debris are heterogeneous and difficult to measure. Here, we established a runoff model for a Himalayan debris-covered glacier in which the spatial distribution of the thermal properties of the debris mantle is estimated from remotely sensed multi-temporal data. We applied the model to the Tsho Rolpa Glacial Lake rambau Glacier basin in the Nepal Himalaya, using hydro-meteorological observations obtained for a 3.5-year period (1993 1996). We calculated long-term averages of runoff components for the period 1980 2007 using gridded reanalysis datasets. Our calculations suggest that excess meltwater, which implies the additional water runoff compared with the ice-free terrain, from the debris-covered area contributes significantly to the total runoff, mainly because of its location at a lower elevation. Uncertainties in runoff simulation due to estimations of the thermal properties and albedo of the debris-covered surface were assessed to be approximately 8% of the runoff from the debris-covered area. We evaluated the sensitivities of runoff components to changes in air temperature and precipitation. As expected, warmer air temperatures increase the total runoff by increasing the melting rate; however, increased precipitation slightly reduces the total runoff, as ice melting is suppressed by the increased snow cover and associated high albedo. The response of total runoff to changing precipitation is complex because of the different responses of individual components (glacier, debris, and ice-free terrain) to precipitation. |
| [26] | . Meltwater and runoff from Keqicar Baqi glacier, a large glacier in the southwestern Tien Shan, northwestern China, are simulated using a modified degree-day model including potential clear-sky direct solar radiation, coupled with a linear reservoir model for the period 1 July to 12 September 2003. There is good agreement between modelled and measured meltwater at ablation stakes and between simulated and observed runoff at the glacier terminus. A reconstruction of glacier meltwater and runoff from an assumed debris-free surface during the study period shows that the effect of the debris layer on glacier meltwater generation crucially affects glacier runoff. The model is also used to calculate glacier runoff given the climate scenario resulting from a doubling of CO2 as projected by the ReCM2 regional climate model. The projected changes in temperature and precipitation vary from 0 to 2.7 C and from 0 to 25%, respectively. Results indicate that glacier runoff increases linearly with temperature over these ranges whether or not the debris layer is taken into consideration. The effect of change in temperature is much more noticeable than that for change in precipitation. Due to the debris layer predominantly covering (and insulating) the ablation area, the response of glacier runoff is less sensitive to temperature increase with a debris-covered surface than with a debris-free surface. Glacier runoff is also markedly reduced when a reduced glacier area is prescribed in the +2.7 C scenario. |
| [27] | . The analysis of climate change impact on the hydrology of high altitude glacierized catchments in the Himalayas is complex due to the high variability in climate, lack of data, large uncertainties in climate change projection and uncertainty about the response of glaciers. Therefore a high resolution combined cryospheric hydrological model was developed and calibrated that explicitly simulates glacier evolution and all major hydrological processes. The model was used to assess the future development of the glaciers and the runoff using an ensemble of downscaled climate model data in the Langtang catchment in Nepal. The analysis shows that both temperature and precipitation are projected to increase which results in a steady decline of the glacier area. The river flow is projected to increase significantly due to the increased precipitation and ice melt and the transition towards a rain river. Rain runoff and base flow will increase at the expense of glacier runoff. However, as the melt water peak coincides with the monsoon peak, no shifts in the hydrograph are expected. |
| [28] | . Rivers originating in the high mountains of Asia are among the most meltwater-dependent river systems on Earth, yet large human populations depend on their resources downstream. Across High Asia’s river basins, there is large variation in the contribution of glacier and snow melt to total runoff, which is poorly quantified. The lack of understanding of the hydrological regimes of High Asia’s rivers is one of the main sources of uncertainty in assessing the regional hydrological impacts of climate change. Here we use a large-scale, high-resolution cryospheric–hydrological model to quantify the upstream hydrological regimes of the Indus, Ganges, Brahmaputra, Salween and Mekong rivers. Subsequently, we analyse the impacts of climate change on future water availability in these basins using the latest climate model ensemble. Despite large differences in runoff composition and regimes between basins and between tributaries within basins, we project an increase in runoff at least until 2050 caused primarily by an increase in precipitation in the upper Ganges, Brahmaputra, Salween and Mekong basins and from accelerated melt in the upper Indus Basin. These findings have immediate consequences for climate change policies where a transition towards coping with intra-annual shifts in water availability is desirable. |
| [29] | . Supraglacial ponds on Tasman Glacier, New Zealand, initiated the development of the large Tasman Lake during the 1980s and still play an important role for ice loss and further terminus disintegration. Limnological and glaciological measurements between 2001 and 2003 reveal distinct differences between ponds. The hydraulic connection of a pond to the englacial water level exerts a key control on whether the pond contributes to longer-term terminus disintegration. In the earlier stages of pond development, ice loss occurs predominantly in the horizontal dimension by subaerial melt. Subaqueous calving at later stages plays a major role for ice loss. During the capture of a pond by the lake, substantial limnological changes lead to changes in relative significance and rates of ice loss processes, the most important being the change from melting to predominantly calving. As a result, ice loss accelerated from around 11 m a-1 of melt under partial debris cover to a retreat by calving and melting of 34 m a-1. Ice loss at the ponds accounted for only 10% of the surface loss in the lower terminus area, but is likely to increase in the future with enlargement and coalescence of ponds. |
| [30] | . ; ; Graduate School of Environmental Studies, Nagoya University, F3-1(200), Chikusa-ku, Nagoya 464-8601, JAPON02 0202 02 0202JOGLAO02 2010,02vol.0256,02n195,02pp.02177-18102[5 page(s) (article)]02(3/4 p.)AnglaisInternational Glaciological Society, Cambridge, ROYAUME-UNI02 (1947) (Revue); ; ; ; ; ; ; ; ; ; ; ; ; ; ; ; ; ; ; ; ; ; ; ; ; ; ; ; ; ; ; ; ; ; ; INIST-CNRS, Cote INIST : 5524,0235400018190372.0180 |
| [31] | . 采用随机抽样的方法对科其喀尔冰川表碛区冰崖的规模及形态进行了调查.在冰崖比较集中的表碛区东侧任意选取了20个冰崖,利用测绳、皮尺并结合GPS测量的方法对冰崖的长度和高度进行了调查,同时用地质罗盘对冰崖的坡向和坡度进行了测量,从而了解冰崖的长度、高度、坡面面积、坡向和坡度等形态特征及其关系.对冰崖形态的分析表明,消融区内冰崖的规模相差很大,且随着海拔高度的增加,冰崖规模有减小的趋势;这可能主要与地形起伏随海拔高度的差异性变化有关,消融区下部冰崖表面消融过程较为活跃也是一个重要的因素.通过对冰崖的坡向和规模之间的分析可以看到,坡向为NW和NNE方向的冰崖最多,其规模也较大,而太阳直接辐射是影响冰崖发育坡向和发育规模的重要因素. . 采用随机抽样的方法对科其喀尔冰川表碛区冰崖的规模及形态进行了调查.在冰崖比较集中的表碛区东侧任意选取了20个冰崖,利用测绳、皮尺并结合GPS测量的方法对冰崖的长度和高度进行了调查,同时用地质罗盘对冰崖的坡向和坡度进行了测量,从而了解冰崖的长度、高度、坡面面积、坡向和坡度等形态特征及其关系.对冰崖形态的分析表明,消融区内冰崖的规模相差很大,且随着海拔高度的增加,冰崖规模有减小的趋势;这可能主要与地形起伏随海拔高度的差异性变化有关,消融区下部冰崖表面消融过程较为活跃也是一个重要的因素.通过对冰崖的坡向和规模之间的分析可以看到,坡向为NW和NNE方向的冰崖最多,其规模也较大,而太阳直接辐射是影响冰崖发育坡向和发育规模的重要因素. |
| [32] | . Sakai, A.; Nakawo, M.; Fujita, K. |
| [33] | . The ablation areas of debris-covered glaciers typically consist of a complex mosaic of surface features with contrasting processes and rates of mass loss. This greatly complicates glacier response to climate change, and increases the uncertainty of predictive models. In this paper we present a series of high-resolution DEMs and repeat lake bathymetric surveys on Ngozumpa Glacier, Nepal, to study processes and patterns of mass loss on a Himalayan debris-covered glacier in unprecedented detail. Most mass loss occurs by melt below supraglacial debris, and melt and calving of ice cliffs (backwasting). Although ice cliffs cover only 5% of the area of the lower tongue, they account for 40% of the ablation. The surface debris layer is subject to frequent re-distribution by slope processes, resulting in large spatial and temporal differences in debris-layer thickness, enhancing or inhibiting local ablation rates and encouraging continuous topographic inversion. A moraine-dammed lake on the lower glacier tongue (Spillway Lake) underwent a period of rapid expansion from 2001 to 2009, but later experienced a reduction of area and volume as a result of lake level lowering and sediment redistribution. Rapid lake growth will likely resume in the near future, and may eventually become up to 7 km long. |
| [34] | . We use high-resolution digital elevation models (DEMs) from unmanned aerial vehicle (UAV) surveys to document the evolution of four ice cliffs on the debris-covered tongue of Lirung Glacier, Nepal, over one ablation season. Observations show that out of four cliffs, three different patterns of evolution emerge: (i) reclining cliffs that flatten during the ablation season; (ii) stable cliffs that maintain a self-similar geometry; and (iii) growing cliffs, expanding laterally. We use the insights from this unique data set to develop a 3-D model of cliff backwasting and evolution that is validated against observations and an independent data set of volume losses. The model includes ablation at the cliff surface driven by energy exchange with the atmosphere, reburial of cliff cells by surrounding debris, and the effect of adjacent ponds. The cliff geometry is updated monthly to account for the modifications induced by each of those processes. Model results indicate that a major factor affecting the survival of steep cliffs is the coupling with ponded water at its base, which prevents progressive flattening and possible disappearance of a cliff. The radial growth observed at one cliff is explained by higher receipts of longwave and shortwave radiation, calculated taking into account atmospheric fluxes, shading, and the emission of longwave radiation from debris surfaces. The model is a clear step forward compared to existing static approaches that calculate atmospheric melt over an invariant cliff geometry and can be used for long-term simulations of cliff evolution and to test existing hypotheses about cliffs' survival. |
| [35] | . 全球气候变暖,青藏高原冰川普遍处于退缩趋势,由此引发的冰湖溃决洪水的灾害也随之增加.通过对2000/2001年度卫星遥感数据解译结果和1987年国际联合考察的朋曲流域冰湖溃决洪水结果的分析,研究了近20a来朋曲流域内冰湖的变化.结果显示,该流域中的冰湖数量有减少,但冰湖的面积却在增加,这是同期全球气候变暖的结果.在提供了冰湖编目数据的基础上,识别了有潜在危险的冰湖,为冰湖溃决洪水早期预警系统提供了科学依据. . 全球气候变暖,青藏高原冰川普遍处于退缩趋势,由此引发的冰湖溃决洪水的灾害也随之增加.通过对2000/2001年度卫星遥感数据解译结果和1987年国际联合考察的朋曲流域冰湖溃决洪水结果的分析,研究了近20a来朋曲流域内冰湖的变化.结果显示,该流域中的冰湖数量有减少,但冰湖的面积却在增加,这是同期全球气候变暖的结果.在提供了冰湖编目数据的基础上,识别了有潜在危险的冰湖,为冰湖溃决洪水早期预警系统提供了科学依据. |
| [36] | . 近年来,随着全球气候的变暖,冰碛湖溃决灾害正日益严重地威胁着人们生命和财产安全.在我国 喜马拉雅山区尤其突出,对冰碛湖溃决灾害的研究也日益受到重视。基于大比例尺地形图、DEM和2004—2008年间的ASTER影像等数据.应用直接判 别方法和基于事件树模型.通过确定不同类型冰碛湖溃决模式发生的定性描述和概率转换关系.对我国喜马拉雅山地区冰湖进行潜在危险性冰碛湖的识别和危险性冰 碛湖溃决概率等级估算。结果显示,在2004-2008年间.我国喜马拉雅山区共有143个具有潜在危险性冰湖,其中溃决概率等级为“非常高”的44个、 “高”的47个、“中”的24个、“低”的24个、“非常低”的4个.溃决概率为“非常高”和“高”等级的91个潜在危险性冰碛湖亟需进一步进行溃决风险 评价. . 近年来,随着全球气候的变暖,冰碛湖溃决灾害正日益严重地威胁着人们生命和财产安全.在我国 喜马拉雅山区尤其突出,对冰碛湖溃决灾害的研究也日益受到重视。基于大比例尺地形图、DEM和2004—2008年间的ASTER影像等数据.应用直接判 别方法和基于事件树模型.通过确定不同类型冰碛湖溃决模式发生的定性描述和概率转换关系.对我国喜马拉雅山地区冰湖进行潜在危险性冰碛湖的识别和危险性冰 碛湖溃决概率等级估算。结果显示,在2004-2008年间.我国喜马拉雅山区共有143个具有潜在危险性冰湖,其中溃决概率等级为“非常高”的44个、 “高”的47个、“中”的24个、“低”的24个、“非常低”的4个.溃决概率为“非常高”和“高”等级的91个潜在危险性冰碛湖亟需进一步进行溃决风险 评价. |
| [37] | . . |
| [38] | . Field and geophysical studies have allowed us to identify processes leading to ice-cored moraine degradation for three natural dams investigated in Peru and Nepal. As potentially hazardous lakes form on the snouts of debris-covered glaciers they may separate a stagnant ice body from the upper reaches of the glacier to form an ice-cored end-moraine complex. The ice-cored moraines appear to degrade through ablation beneath the debris cover, by localized thermokarst development, and by associated mass movement. Relict glacier structures serve as a focal point for the onset of accelerated thermokarst degradation. Once exposed, the ice core then undergoes accelerated wastage through the combined affects of solar radiation and mechanical failure due to the rheological response of the ice to deepening kettle forms. Continuing degradation reduces the lake freeboard, weakens the moraine dam, and can lead to its catastrophic failure. |
| [39] | . Abstract Ablation of snow and ice occurs by melting and evaporation, and both processes are strongly related to the energy balance of the surface. The equation Q + (B + S) + L+V=0 describing this balance by the components of net radiation Q, change of heat content in the ice B, energy used for melting (-S), turbulent flux of sensible heat L and turbulent flux of latent heat V can be considered as the basic equation for treating the problems of ablation at the air-ice boundary. Since the physical laws concerning Q, L and V have been studied intensively by micro- meteorologists, it is possible to present an energy balance model for computing the ablation as a function of the meteorological parameters (global radiation, wind velocity, air temperature, air humidity and atmospheric pressure) and of the surface parameters (albedo and roughness length). The model is appropriate for considering the manifold phenomena of the energy balance of snow and ice surfaces in mountainous areas. Special effects, such as the influence of orographic wind systems on the turbulent fluxes of sensible and latent heat, the energy balance on mountain slopes, the influence of air pressure on the amount of ablation and the ablation of ice that is covered by sand or other materials can be simulated easily. The results of these model computations lead to a better physical understanding of complex ablation phenomena (for example, selective ablation); they give quantitative values of the dependence of ablation on special meteorological situations (for example, for the ratio of runoff and evaporation) and offer the possibility of ablation forecasts based on the laws of micro- meteorology. |
| [40] | . This paper presents a simple model to estimate ice ablation under a thick supraglacial debris cover. The key method employed in the model is to establish a link between the debris heat flux and the debris temperature at a certain depth when the heat transfer in the debris is described by a diffusion process. Given surface temperature, debris thermal properties and relevant boundary conditions, the proposed model can estimate mean debris temperature at interfaces of different debris layers using an iterative procedure, and then the heat flux for ice ablation. The advantage of the proposed model is that it only requires a few parameters to conduct the modeling, which is simpler and more applicable than others. The case study on Koxkar glacier, west Tien Shan, China, shows, in general, that the proposed model gives good results for the prediction of debris temperatures, except for an apparent phase shift between modeled and observed values. We suggest that this error is mainly due to complex phase relations between debris temperature and debris heat flux. The modeled ablation rates at three experimental sites also show good results, using a direct comparison with observed data and an indirect comparison with a commonly used energy-balance model. |
| [41] | . Debris-covered glaciers respond to atmospheric conditions in different ways from debris-free glaciers, due to the presence of debris at the surface during the ablation season and at the snow/ice interface during the accumulation season. Understanding the response of debris-covered glaciers to a variety of meteorological conditions in a physically sound manner is essential to quantify meltwater discharge and to predict their response to climate change. To tackle this issue, we developed the Crocus-DEB model as an adaptation of the detailed snowpack model Crocus, to simulate the energy and mass balance of debris-covered glaciers, including periods when debris is covered by snow. Crocus-DEB was evaluated with data gathered during a field experiment using artificial debris covering the snowpack at Col de Porte, France, with very good results in terms of conductive heat flux, both at the surface and at the interface between the debris and the underlying dense snow taken as a surrogate for ice, with and without snow overlying the debris. The model was also evaluated using field data from the debris-covered glacier Changri Nup, Nepal, Himalaya. This paper introduces the design of the model, its performance and its ability to explore relationships between model parameters, meteorological conditions and the critical debris thickness. |
| [42] | . Distributed glacier melt models generally assume that the glacier surface consists of bare exposed ice and snow. In reality, many glaciers are wholly or partially covered in layers of debris that tend to suppress ablation rates. In this paper, an existing physically based point model for the ablation of debris-covered ice is incorporated in a distributed melt model and applied to Haut Glacier d rolla, Switzerland, which has three large patches of debris cover on its surface. The model is based on a 10 m resolution digital elevation model (DEM) of the area; each glacier pixel in the DEM is defined as either bare or debris-covered ice, and may be covered in snow that must be melted off before ice ablation is assumed to occur. Each debris-covered pixel is assigned a debris thickness value using probability distributions based on over 1000 manual thickness measurements. Locally observed meteorological data are used to run energy balance calculations in every pixel, using an approach suitable for snow, bare ice or debris-covered ice as appropriate. The use of the debris model significantly reduces the total ablation in the debris-covered areas, however the precise reduction is sensitive to the temperature extrapolation used in the model distribution because air near the debris surface tends to be slightly warmer than over bare ice. Overall results suggest that the debris patches, which cover 10% of the glacierized area, reduce total runoff from the glacierized part of the basin by up to 7%. |
| [43] | . Debris thickness plays an important role in regulating ablation rates on debris-covered glaciers as well as controlling the likely size and location of supraglacial lakes. Despite its importance, lack of knowledge about debris properties and associated energy fluxes prevents the robust inclusion of the effects of a debris layer into most glacier surface energy balance models. This study combines fieldwork with a debris-covered energy balance model to estimate debris temperatures and ablation rates on Imja-Lhotse Shar glacier located in the Everest region of Nepal. The debris properties that significantly influence the energy balance model are thermal conductivity, albedo, and surface roughness. Fieldwork was conducted to measure thermal conductivity and a method was developed using Structure from Motion to estimate surface roughness. Debris temperatures measured during the 2014 melt season were used to calibrate and validate a debris-covered energy balance model by optimizing the albedo, thermal conductivity, and surface roughness at 10 debris-covered sites. Furthermore, three methods for estimating the latent heat flux were investigated. Model calibration and validation found the three methods had similar performance; however, comparison of modeled and measured ablation rates revealed that assuming a zero latent heat flux may overestimate ablation. Results also suggest that where debris moisture is unknown, measurements of the relative humidity or precipitation may be used to estimate wet debris periods, i.e., the latent heat flux is non-zero. The effect of temporal resolution on the model was also assessed and results showed that both 6 h data and daily average data slightly underestimate debris temperatures and ablation rates, thus these should only be used to estimate rough ablation rates when no other data are available. |
| [44] | . To understand the formation conditions of debris-covered glaciers, we examined the dimension and shape of debris-covered areas and potential debris-supply (PDS) slopes of 213 glaciers in the Bhutan Himalaya. This was undertaken using satellite images with 2.5 m spatial resolution for manual delineation of debris-covered areas and PDS slopes. The most significant correlation exists between surface area of southwest-facing PDS slopes and debris-covered area. This result suggests that the southwest-facing PDS slopes supply the largest quantity of debris mantle. The shape of debris-covered areas is also an important variable, quantitatively defined using a geometric index. Elongate or stripe-like debris-covered areas on north-flowing glaciers are common throughout the Bhutan Himalaya. In contrast, south-flowing glaciers have large ablation zones, entirely covered by debris. Our findings suggest that this difference is caused by effective diurnal freeze haw cycles rather than seasonal freeze haw cycles, permafrost degradation, or snow avalanches. In terms of geographic setting, local topography also contributes to glacier debris supply and the proportion of debris cover on the studied glaciers is suppressed by the arid Tibetan climate, whereas the north-to-south asymmetric topography of the Bhutan Himalaya has less influence on the proportion of debris cover. |
| [45] | . |
| [46] | . The thickness of supraglacial debris on the Khumbu Glacier, Nepal Himalaya, has been mapped by a combination of direct measurements and morphological and lithological studies. All three processes, englacial, supraglacial, and subglacial, must be considered in establishing the distribution of debris. Taking advantage of the lithological characteristics of the debris and their bedrock source, the denudation rate of the schistose bedrock was estimated to be about 0.02 mm a0908081. A rough estimate of the production rate of supraglacial debris indicated that most of the present debris has formed since the last advance of the glacier, which took place a few hundred years B.P. |
| [47] | . Debris thickness is an important characteristic of debris-covered glaciers in the Everest region of the Himalayas. The debris thickness controls the melt rates of the glaciers, which has large implications for hydrologic models, the glaciers' response to climate change, and the development of glacial lakes. Despite its importance, there is little knowledge of how the debris thickness varies over these glaciers. This paper uses an energy balance model in conjunction with Landsat7 Enhanced Thematic Mapper Plus (ETM+) satellite imagery to derive thermal resistances, which are the debris thickness divided by the thermal conductivity. Model results are reported in terms of debris thickness using an effective thermal conductivity derived from field data. The developed model accounts for the nonlinear temperature gradient in the debris cover to derive reasonable debris thicknesses. Fieldwork performed on Imja- Lhotse Shar Glacier in September 2013 was used to compare to the modeled debris thicknesses. Results indicate that accounting for the nonlinear temperature gradient is crucial. Furthermore, correcting the incoming shortwave radiation term for the effects of topography and resampling to the resolution of the thermal band's pixel is imperative to deriving reasonable debris thicknesses. Since the topographic correction is important, the model will improve with the quality of the digital elevation model (DEM). The main limitation of this work is the poor resolution (60m) of the satellite's thermal band. The derived debris thicknesses are reasonable at this resolution, but trends related to slope and aspect are unable to be modeled on a finer scale. Nonetheless, the study finds this model derives reasonable debris thicknesses on this scale and was applied to other debris-covered glaciers in the Everest region. |
| [48] | . 基于2009年5月至2011年10月科其喀尔冰川的花杆观测资料,对其消融区的表面运动特征进行分析. 结果表明:冰川消融区的年水平运动速度最大值为86.69 m·a<sup>-1</sup>,年垂直运动速度最大值为15.34 m·a<sup>-1</sup>,均出现在冰川海拔4 000~4 200 m的消融区上部;在靠近冰川末端的冰舌下部,受冰量补给减弱、厚层表碛覆盖等影响,冰川运动缓慢,年水平运动速度小于5 m·a<sup>-1</sup>,而垂直运动速度值小于2 m·a<sup>-1</sup>. 大多数横剖面的水平运动速度具有从中部向边缘逐渐减小的特征,而有的剖面却出现局部速度增大的区域. 整体而言,冰川水平及垂直运动速度随海拔降低而减小,符合冰川运动的一般规律,但主要受地形作用的影响,垂直运动速度随海拔的变化会出现波动. 消融期月水平运动速度与同期气温和降水的变化具有一定的相关性,可能反映出气候快速变化对冰川运动的影响. . 基于2009年5月至2011年10月科其喀尔冰川的花杆观测资料,对其消融区的表面运动特征进行分析. 结果表明:冰川消融区的年水平运动速度最大值为86.69 m·a<sup>-1</sup>,年垂直运动速度最大值为15.34 m·a<sup>-1</sup>,均出现在冰川海拔4 000~4 200 m的消融区上部;在靠近冰川末端的冰舌下部,受冰量补给减弱、厚层表碛覆盖等影响,冰川运动缓慢,年水平运动速度小于5 m·a<sup>-1</sup>,而垂直运动速度值小于2 m·a<sup>-1</sup>. 大多数横剖面的水平运动速度具有从中部向边缘逐渐减小的特征,而有的剖面却出现局部速度增大的区域. 整体而言,冰川水平及垂直运动速度随海拔降低而减小,符合冰川运动的一般规律,但主要受地形作用的影响,垂直运动速度随海拔的变化会出现波动. 消融期月水平运动速度与同期气温和降水的变化具有一定的相关性,可能反映出气候快速变化对冰川运动的影响. |
| [49] | . Digital elevation models (DEMs) of the ablation area of Hailuogou glacier, China, produced from Advanced Spaceborne Thermal Emission and Reflection Radiometer (ASTER) data obtained in 2009, differential GPS (DGPS) data surveyed in 2008 and aerial photographs acquired in 1966 and 1989 are differenced to estimate long- and short-term glacier surface elevation change (d/d). The mean d/dof the ablation area over 43 years (1966–2009) is –1.1 ± 0.4 m a. Since 1989 the thinning has accelerated significantly. Ice velocities measured by DGPS at 28 fixed stakes implanted in the ablation area increase with distance from the glacier terminus, ranging from 41.0 m aapproaching the glacier terminus to a maximum of 205.0 m aat the base of an icefall. Our results reveal that the overall average ice velocity in the ablation area has undergone significant temporal variability over the past several decades. Changes in glacier surface elevation in the ablation area result from the combined effects of climate change and glacier dynamics, which are driven by different factors for different regions and periods. |
| [50] | . 中国科学院寒区旱区环境与工程研究所机构知识库(CASNW OpenIR)以发展机构知识能力和知识管理能力为目标,快速实现对本机构知识资产的收集、长期保存、合理传播利用,积极建设对知识内容进行捕获、转化、传播、利用和审计的能力,逐步建设包括知识内容分析、关系分析和能力审计在内的知识服务能力,开展综合知识管理。 |
| [51] | . Debris cover is widely present in the ablation areas of mountain glaciers. Such debris plays an important role in glacier mass balance, but it complicates the glacier boundary and area estimation when using remotely sensed images. Automatic recognition of the debris is much more difficult than recognizing bare ice on optical remotely sensed images because the debris has almost the same spectral characteristics of the surrounding terrain. In this paper, the scattering characteristics of the debris on the C- and L-band polarimetric SAR images are presented and analyzed to study the possibility of recognizing debris thickness and extent. The Koxkar glacier, in the central Tianshan Mountain Range, was selected as the study area. It was found that debris is distinct from bare ice in cross polarization (HV) of both the L- and C-bands. The L-band volume scattering component, acquired from target decomposition, increases with debris thickness when the debris is less than 25 cm deep, but the volume scattering does not increases if the debris is thicker than 25 cm. In contrast, the C-band SAR data does not appear to be sensitive to debris thickness. This difference may be caused by different radar penetration depth of the debris. On the basis of the polarimetric property analysis, two methods were developed to determine the extent of the debris. In the first method, the simple threshold to distinguish debris from non-debris areas is presented. Using this threshold, approximately 90% of the debris can be recognized. In the second method, by combining more polarimetric features and support vector machines, recognition of debris reaches an accuracy greater than 95%. |
| [52] | |
| [53] | . <p>使用光学图像进行表碛覆盖型冰川边界判断相对比较困难。采用日本高级陆地观测卫星(ALOS)携带的L波段相控阵型合成孔径雷达(PALSAR)数据的干涉相干对表碛覆盖型冰川边界进行判断,并使用ALOS PALSAR 数据的特征匹配方法获得表面流速进行验证分析,发现公格尔山区5Y663D0009冰川表碛覆盖区呈现高相干性且运动速度十分缓慢,表明该表碛区域可能已经演化成非活动区;而该冰川中碛覆盖区则表现出低相干性,运动速度比较高(5 m/a),表明相干性是有效的判断依据,利用PALSAR数据相干性及获得的表面流速可以区分表碛覆盖型冰川活动与非活动区域,使气候波动情景下该类型冰川的动态变化监测成为可能并对该方法的可靠性与不确定性进行了探讨。</p> . <p>使用光学图像进行表碛覆盖型冰川边界判断相对比较困难。采用日本高级陆地观测卫星(ALOS)携带的L波段相控阵型合成孔径雷达(PALSAR)数据的干涉相干对表碛覆盖型冰川边界进行判断,并使用ALOS PALSAR 数据的特征匹配方法获得表面流速进行验证分析,发现公格尔山区5Y663D0009冰川表碛覆盖区呈现高相干性且运动速度十分缓慢,表明该表碛区域可能已经演化成非活动区;而该冰川中碛覆盖区则表现出低相干性,运动速度比较高(5 m/a),表明相干性是有效的判断依据,利用PALSAR数据相干性及获得的表面流速可以区分表碛覆盖型冰川活动与非活动区域,使气候波动情景下该类型冰川的动态变化监测成为可能并对该方法的可靠性与不确定性进行了探讨。</p> |
| [54] | . Despite the important role of supraglacial debris in ablation, knowledge of debris thickness on Himalayan glaciers is sparse. A recently developed method based on reanalysis data and thermal band satellite imagery has proved to be potentially suitable for debris thickness estimation without the need for detailed field data. In this study, we further develop the method and discuss possibilities and limitations arising from its application to a glacier in the Himalaya with scarce in situ data. Surface temperature patterns are consistent for 13 scenes of Advanced Spaceborne Thermal Emission and Reflection Radiometer (ASTER) and Landsat 7 imagery and correlate well with incoming shortwave radiation and air temperature. We use an energy-balance approach to subtract these radiation or air temperature effects, in order to estimate debris thickness patterns as a function of surface temperature. Both incoming shortwave and longwave radiation are estimated with reasonable accuracy when applying parameterizations and reanalysis data. However, the model likely underestimates debris thickness, probably due to incorrect representation of vertical debris temperature profiles, the rate of heat storage and turbulent sensible heat flux. Moreover, the uncertainty of the result was found to increase significantly with thicker debris, a promising result since ablation is enhanced by thin debris of 1-2 cm. |
| [55] | [D]. |
| [56] | . The ablation rate under a debris layer is very difficult to measure directly at debris-covered glaciers, because the surface is highly heterogeneous, and the ablation rate varies tremendously from place to place. Heat budget considerations with a debris layer on top of glacier ice suggested that 'thermal resistance' of the debris layer could be estimated from surface temperature and the heat fluxes at the debris surface, and the ablation rate of the underlying glacier ice from the thermal resistance and meteorological data. The method was tested at the Lirung Glacier in Langtang Valley, Nepal Himalayas, using the thermal band of LANDSAT satellite for estimating surface temperature distribution of the debris top surface. The amount of melt water thus estimated was compatible with the observed discharge data from the glacier basin for periods of the monsoon season in 1985 and the pre-monsoon to the monsoon season in 1996. The investigation also revealed that the amount of discharge was much larger than the amount of precipitation over the basin, and it was suggested that the melt water from the debris-covered glacier contributes significantly to the river flow as a result of the shrinkage of the glacier. |
| [57] | . Automated glacier mapping from satellite multispectral image data is hampered by debris cover on glacier surfaces. Supraglacial debris exhibits the same spectral properties as lateral and terminal moraines, fluvioglacial deposits, and bedrock outside the glacier margin, and is thus not detectable by means of multispectral classification alone. Based on the observation of low slope angles for debris-covered glacier tongues, we developed a multisource method for mapping supraglacial debris. The method combines the advantages of automated multispectral classification for clean glacier ice and vegetation with slope information derived from a digital elevation model (DEM). Neighbourhood analysis and change detection is applied for further improvement of the resulting glacier/debris map. A significant percentage of the processing can be done automatically. In order to test the sensitivity of our method against different DEM qualities, it was also applied to a DEM obtained from ASTER stereo data. Additionally, we compared our multisource approach to an artificial neural network (ANN) classification of debris, using only multispectral data. While the combination with an ASTER-derived DEM revealed promising results, the ANN classification without DEM data does not. |
| [58] | . On 16 18 June 2008 the US National Snow and Ice Data Center held a GLIMS workshop in Boulder, CO, USA, focusing on formulating procedures and best practices for operational glacier mapping using satellite imagery. Despite the progress made in recent years, there still remain many cases where automatic delineation of glacier boundaries in satellite imagery is difficult, error prone or time-consuming. This workshop identified six themes for consideration by focus groups: (1) mapping clean ice and lakes; (2) mapping ice divides; (3) mapping debris-covered glaciers; (4) assessing changes in glacier area and elevation through comparisons with older data; (5) digital elevation model (DEM) generation from satellite stereo pairs; and (6) accuracy and error analysis. Talks presented examples and work in progress for each of these topics, and focus groups worked on compiling a summary of available algorithms and procedures to address and avoid identified hurdles. Special emphasis was given to establishing standard protocols for glacier delineation and analysis, creating illustrated tutorials and providing source code for available methods. This paper summarizes the major results of the 2008 GLIMS workshop, with an emphasis on definitions, methods and recommendations for satellite data processing. While the list of proposed methods and recommendations is not comprehensive and is still a work in progress, our goal here is to provide a starting point for the GLIMS regional centers as well as for the wider glaciological community in terms of documentation on possible pitfalls along with potential solutions. |
| [59] | |
| [60] | . The rapid retreat of Himalayan glaciers generates moraine-dammed glacial lakes which have potential to cause Glacial Lake Outburst Floods (GLOFs). Glacial lakes are generally at different evolutionary stages even under the same climatic conditions. Such evolutionary processes are not well studied due to difficulties in field observations. The present study investigates thermal resistances on the debris-covered glaciers around Mt. Everest and Lunana region in Bhutan using satellite images taken by ASTER. The thermal resistance is defined as thickness divided by thermal conductivity of a debris layer, and is an essential thermal property for evolution of glacial lakes through melting process. Assuming a linear temperature profile within a debris layer and a bottom temperature of 0 degree Celsius, the conductive heat term in a heat balance equation can be expressed as a surface temperature divided by the thermal resistance. The conductive heat can be obtained from net radiation which is a dominant energy source on the Himalayan glaciers. The net radiation is calculated by combining downward radiation fluxes of NCEP/NCAR reanalysis data with the surface temperature and albedo which are obtained from ASTER data. Then the thermal resistance can be calculated from the net radiation and the surface temperature. The result shows that the thermal resistances on 10 glaciers among 25 target glaciers without lakes are twice as large as the mean of thermal resistances of 7 target glaciers with lakes. Spatial characteristics of thermal resistances are also identified; large increases appear toward glacier termini on glaciers without lakes, whereas relatively small and uniform values appear along those with lakes. These results imply that the different patterns and magnitudes in thermal properties on debris-covered glaciers are related to different evolutionary stages of glacial lakes in the Himalayas. Furthermore, the present study demonstrates that ASTER data provide valuable information for glacial lake studies. |
| [61] | . |
| [62] | . Lillesand, T. M.; Kiefer, R. W. |
| [63] | . |
| [64] | . The decorrelation stretch is a process that is used to enhance (stretch) the color differences found in a color image. |
| [65] | . Remote sensors face challenges in characterizing mountain permafrost and ground thermal conditions or mapping rock glaciers and debris-covered glaciers. We explore the potential of thermal imaging and in particular thermal inertia mapping in mountain cryospheric research, focusing on the relationships between ground surface temperatures and the presence of ice-debris landforms on one side and land surface temperature (LST) and apparent thermal inertia (ATI) on the other. In our case study we utilize ASTER daytime and nighttime imagery and in-situ measurements of near-surface ground temperature (NSGT) in the Mediterranean Andes during a snow-free and dry observation period in late summer. Spatial patterns of LST and NSGT were mostly consistent with each other both at daytime and at nighttime. Daytime LST over ice-debris landforms was decreased and ATI consequently increased compared to other debris surfaces under otherwise equal conditions, but NSGT showed contradictory results, which underlines the complexity and possible scale dependence of ATI in heterogeneous substrates with the presence of a thermal mismatch and a heat sink at depth. While our results demonstrate the utility of thermal imaging and ATI mapping in a mountain cryospheric context, further research is needed for a better interpretation of ATI patterns in complex thermophysical conditions. |
| [66] | . During the 2005–2007 June–September ablation seasons, meteorological conditions were recorded on the lower and upper parts of the debris‐covered ablation zone of Miage Glacier, Italy. In 2005, debris temperature and subdebris ice melt were also monitored at 25 points with debris thickness of 0.04–0.55 m, spread over 5 km2 of the glacier. The radiative fluxes were directly measured, and near‐closure of the surface energy balance is achieved, providing support for the bulk aerodynamic calculation of the turbulent fluxes. Surface‐layer meteorology and energy fluxes are dominated by the pattern of incoming solar radiation which heats the debris, driving strong convection.Mean measured subdebris ice melt rates are 6–33 mm d611, and mean debris thermal conductivity is 0.96 W m611 K611, displaying a weak positive relationship with debris thickness. Mean seasonal values of the net shortwave, net longwave, and debris heat fluxes show little variation between years, despite contrasting meteorological conditions, while the turbulent latent (evaporative) heat flux was more than twice as large in the wet summer of 2007 compared with 2005. The increase in energy output from the debris surface in response to increasing surface temperature means that subdebris ice melt rates are fairly insensitive to atmospheric temperature variations in contrast to debris‐free glaciers. Improved knowledge of spatial patterns of debris thickness distribution and 2 m air temperature, and the controls on evaporation of rainwater from the surface, are needed for distributed physically based melt modeling of debris‐covered glaciers. |
| [67] | . ABSTRACT Ablation and heat balance were measured in debris-covered and debris-free areas of the ablation zone of Khumbu Glacier from 22 May to 1 June 1999. On the debris-free ice, the ablation rates ranged from 1.4 to 4.7 cm day" 1 and were inversely correlated with the albedo. The contribution of turbulent heat flux to melting was very small, so net radiation accounted for about 98% of the incoming heat. Melting under debris decreased sharply with increasing thickness. Debris with thickness of 10 cm slowed melting to about 40% of that of bare ice with the same low albedo. The primary cause of melt reduction was the insulating effect of the debris. The heat stored in the debris layer during daytime was released to the atmosphere during night-time and warmed the air rather than being conducted downward to melt ice. |
| [68] | . The satellite imagery has been effectively utilized for classifying land covertypes and detecting land cover conditions. The Advanced Spaceborne Thermal Emissionand Reflection Radiometer (ASTER) sensor imagery has been widely used in classificationprocess of land cover. However, atmospheric corrections have to be made by preprocessingsatellite sensor imagery since the electromagnetic radiation signals received by the satellitesensors can be scattered and absorbed by the atmospheric gases and aerosols. In this study,an ASTER sensor imagery, which was converted into top-of-atmosphere reflectance(TOA), was used to classify the land use/cover types, according to COoRdination ofINformation on the Environment (CORINE) land cover nomenclature, for an arearepresenting the heterogonous characteristics of eastern Mediterranean regions inKahramanmaras, Turkey. The results indicated that using the surface reflectance data ofASTER sensor imagery can provide accurate (i.e. overall accuracy and kappa values of83.2% and 0.79, respectively) and low-cost cover mapping as a part of inventory forCORINE Land Cover Project. |
| [69] | . |
| [70] | . Abstract The Clouds and the Earth's Radiant Energy Systems (CERES) project utilizes radiometric measurements taken aboard the Terra and Aqua spacecrafts to derive the world-class data products needed for climate research. Achieving the exceptional fidelity of the CERES data products, however, requires a considerable amount of processing to assure quality and to verify accuracy and precision, which results in the CERES data being released more than 6 months after the satellite observations. For most climate studies such delays are of little consequence; however, there are a significant number of near-real time uses for CERES data products. The Fast Longwave and Shortwave Radiative Flux (FLASHFlux) data product was therefore developed to provide a rapid release version of the CERES results, which could be made available to the research and applications communities within 1 week of the satellite observations by exchanging some accuracy for speed. FLASHFlux has both achieved this 1-week processing objective and demonstrated the ability to provide remarkably good agreement when compared with the CERES data products for both the instantaneous single-scanner footprint (SSF) fluxes and the time-and space-averaged (TISA) fluxes. This paper describes the methods used to expedite the production of the FLASHFlux SSF fluxes by utilizing data from the CERES and Moderate Resolution Imaging Spectroradiometer instruments, as well as other meteorological sources. This paper also reports on the validation of the FLASHFlux SSF results against ground-truth measurements and the intercomparison of FLASHFlux and CERES SSF results. A complementary paper will discuss the production and validation of the FLASHFlux TISA fluxes. |
| [71] | . It is important to estimate medium-to long-term melting rate of mountain glaciers, which significantly affect global sea-level rise and changes in water resources. Debris cover on glacier is widely present in glacier ablation area and its spatial distribution greatly affects glacier melt rates. However, it is difficult to estimate the spatial distribution of debris thickness at large scale only from field measurements. In this study, we attempted to estimate the spatial distribution of debris cover of the whole Caucasus region using satellite data. A comparison of our results and field measurements by previous studies indicated that the debris cover more than 5cm in thickness can be estimated reasonably. Also, we found that the degree-day factor of about 20% of glaciers in Caucasus region becomes around half relative to that of debris-free surface condition, due to the insulating effect of debris cover. Our results highlight the importance of debris cover and its spatial distribution for understanding glacier mass change in this region. |
| [72] | . <FONT face=Verdana>冰川消融过程与水热条件、气象要素、冰面局地和周边地形以及冰川表面状况等密切相关. 利用海螺沟冰舌段GPS测量的结果,对冰舌段的冰川近期变化包括规模变化和厚度减薄进行了新的评估. 结果表明:自1989年以来冰舌段冰川厚度减薄约26%,远显著于20世纪60年代以来冰川面积的减少比例4.05%. 基于对海螺沟冰川消融区冰舌段详细消融过程的观测,从冰川消融同气温的关系入手,分析了海洋型冰川的消融过程和特征,并探讨了影响冰川消融的其它因素.</FONT> . <FONT face=Verdana>冰川消融过程与水热条件、气象要素、冰面局地和周边地形以及冰川表面状况等密切相关. 利用海螺沟冰舌段GPS测量的结果,对冰舌段的冰川近期变化包括规模变化和厚度减薄进行了新的评估. 结果表明:自1989年以来冰舌段冰川厚度减薄约26%,远显著于20世纪60年代以来冰川面积的减少比例4.05%. 基于对海螺沟冰川消融区冰舌段详细消融过程的观测,从冰川消融同气温的关系入手,分析了海洋型冰川的消融过程和特征,并探讨了影响冰川消融的其它因素.</FONT> |
| [73] | . The glacier coverage in the Caucasus Mountains underwent considerable changes during the last decades. In some regions, the observed reduction in glacier area is comparable to those in the European Alps and the extent of supra-glacial debris increased on many glaciers. Only a few glaciers in the Caucasus are monitored on a regular basis, while for most areas no continuous field measurements are available. In this study, regional differences of the conditions for glacier melt with a special focus on debris covered glacier tongues in the well-studied Adyl-su basin on the northern slope of the Caucasus Mountains (Russia) is compared with the Zopkhito basin which has similar characteristics but is located on the southern slope in Georgia. The paper focuses on the effect of supra-glacial debris cover on glacier summer melt. There are systematic differences in the distribution and increase of the debris cover on the glaciers of the two basins. In the Adyl-su basin an extensive debris cover on the glacier tongues is common, however, only those glacier tongues that are positioned at the lowest elevations in the Zopkhito basin show a considerable extent of supra-glacial debris. The observed increase in debris cover is considerably stronger in the north. Field experiments show that thermal resistance of the debris cover in both basins is somewhat higher than in other glaciated regions of the world, but there is also a significant difference between the two regions. A simple ablation model accounting for the effect of debris cover on ice melt shows that melt rates are considerably higher in the northern basin despite a wider debris distribution. This difference between the two regions can be attributed to different meteorological conditions which are characterised by more frequent cloud cover and precipitation in the south. Furthermore ablation is strongly influenced by the occurrence of supra-glacial debris cover in both basins, reducing the total amount of melt on the studied glaciers by about 25 %. This effect mitigates glacier retreat in the lower sectors of the ablation zones considerably. The sensitivity to moderate changes in the debris cover, however, is rather small which implies only gradual changes of the melt regime due to debris cover dynamics during the near future. |
| [74] | . Glaciers are important water storages on a seasonal and long-term time scale. Where high mountains are surrounded by arid lowlands, glacier runoff is an important source of water during the growing season. This situation can be found in the Altay mountains in Southern Siberia, where the recent glacierization of >700 km2 is subject to continuous mass loss, even though the shrinking is comparably slow. The glacier retreat is accompanied by an extension of supra-glacial moraine, which itself strongly influences ablation rates. To quantify these effects, the spatial evolution of debris cover since 1952 was analysed for three glaciers in the North Chuya Ridge using satellite and airborne imagery. In summer 2007, an ablation experiment was carried out on debris covered parts of Maliy Aktru glacier. Thermistors in different depths within the moraine provided data to calculate thermal resistance of the debris. A set of ablation stakes was installed at locations with differing debris thickness and observed regularly throughout the entire melt season. Air temperature from an AWS was used to calculate degree day factors in dependence of the debris thickness. To take into account the shading effect of surrounding walls and peaks, the potential solar radiation and its evolution throughout the summer was determined from a digital elevation model. This allows us to extrapolate our measurements from Maliy Aktru to the other two glaciers of the Aktru basin and to estimate basin melt rates. In addition accumulated ice melt was derived for 12 glaciers in the North Chuya Range. Changes in summer runoff from the 1960s are compared to the results from our melt model and the evolution of debris cover is analysed in respect to the melt activity. |
| [75] | . The ass balance sensitivity of a glacier provides a means for assessing its response to future warming and contribution to sea level rise. Many studies have concluded that the first-order control on mass balance sensitivity is climatic, where higher-precipitation (and less continental) glaciers are most sensitive while lower-precipitation (and more continental) glaciers are least sensitive. The Southern Alps in New Zealand experience a limited range of continentality (9-13 K) but strong gradients in precipitation (2.5-11 m a). Using an energy balance model applied on a regional scale we find that the central Southern Alps glaciers are very sensitive to temperature change (1.9 m w.e. aK, with a range of -1.1 to -4.0 m w.e. aK) and that an 82% increase in precipitation is required to offset a 1 K warming. Spatial variations in mass balance sensitivity cannot be simply explained as a function of precipitation. Topographic effects are important, and we find that debris cover reduces mass balance sensitivity. Mass balance amplitude, which takes into account debris cover, hypsometry and other topographic characteristics, is a better predictor of mass balance sensitivity than precipitation. The mass balance gradient is almost as good a predictor indicating that hypsometry is not a necessary component of sensitivity calculations. Estimating mass balance sensitivity as a function of mass balance gradient allows for parameterizations of mass balance sensitivity based on glacier inventory data. This provides a simple and robust way to assess glacier mass balance sensitivity on a global scale, which may refine future predictions of valley glacier melt and its contribution to sea level rise. |
| [76] | . Due to remoteness and high altitude, only a few ground-based glacier change studies are available in high-mountain areas in the Himalaya. However, digital elevation models based on remotely sensed data (RS-DEMs) provide feasible opportunities to evaluate how fast Himalayan glaciers are changing. Here we compute elevation changes in glacier surface (total area 183.3km2) in the Khumbu region, Nepal Himalaya, for the period 1992–2008 using multitemporal RS-DEMs and a map-derived DEM calibrated with differential GPS survey data in 2007. Elevation change is calculated by generating a weighted least-squares linear regression model. Our method enables us to provide the distribution of uncertainty of the elevation change. Debris-covered areas show large lowering rates. The spatial distribution of elevation change shows that the different wastage features of the debris-covered glaciers depend on their scale, slope and the existence of glacial lakes. The elevation changes of glaciers in the eastern Khumbu region are in line with previous studies. The regional average mass balance of –0.40 0.25mw.e. a–1 for the period 1992–2008 is consistent with a global value of about –0.55mw.e. a–1 for the period 1996–2005. |
| [77] | . Glaciers are among the best indicators of terrestrial climate variability, contribute importantly to water resources in many mountainous regions(1,2) and are a major contributor to global sea level rise(3,4). In the Hindu Kush-Karakoram-Himalaya region (HKKH), a paucity of appropriate glacier data has prevented a comprehensive assessment of current regional mass balance(5). There is, however, indirect evidence of a complex pattern of glacial responses(5-8) in reaction to heterogeneous climate change signals(9). Here we use satellite laser altimetry and a global elevation model to show widespread glacier wastage in the eastern, central and southwestern parts of the HKKH during 2003-08. Maximal regional thinning rates were 0.66 +/- 0.09 metres per year in the Jammu-Kashmir region. Conversely, in the Karakoram, glaciers thinned only slightly by a few centimetres per year. Contrary to expectations, regionally averaged thinning rates under debris-mantled ice were similar to those of clean ice despite insulation by debris covers. The 2003-08 specific mass balance for our entire HKKH study region was -0.21 +/- 0.05 m yr(-1) water equivalent, significantly less negative than the estimated global average for glaciers and ice caps(4,10). This difference is mainly an effect of the balanced glacier mass budget in the Karakoram. The HKKH sea level contribution amounts to one per cent of the present-day sea level rise(11). Our 2003-08 mass budget of -12.8 +/- 3.5 gigatonnes (Gt) per year is more negative than recent satellite-gravimetry-based estimates of -5 +/- 3 Gt yr(-1) over 2003-10 (ref. 12). For the mountain catchments of the Indus and Ganges basins(13), the glacier imbalance contributed about 3.5% and about 2.0%, respectively, to the annual average river discharge(13), and up to 10% for the Upper Indus basin(14). |
| [78] | . |
| [79] | . Himalayan glaciers are losing mass at rates similar to glaciers elsewhere, but heavily debris-covered glaciers are receding less than debris-free glaciers or even have stable fronts. There is a need for multi-temporal mass balance data to determine if glacier wastage of debris-covered glaciers is accelerating. Here, we present glacier volume and mass changes of seven glaciers (5 partially debris-covered, 2 debris-free) in the upper Langtang catchment in Nepal of 28 different periods between 1974 and 2015 based on 8 digital elevation models (DEMs) derived from high-resolution stereo satellite imagery. We show that glacier volume decreased during all periods between 2006 and 2015 (2006–2015: 610.60 ± 0.34 m a611) and at higher rates than between 1974 and 2006 (610.28 ± 0.42 m a611). However, the behavior of glaciers in the study area was highly heterogeneous, and the presence of debris itself does not seem to be a good predictor for mass balance trends. Debris-covered tongues have highly non-linear thinning profiles, and we show that local accelerations in thinning correlate with complex thinning patterns characteristic of areas with a high concentration of supraglacial cliffs and lakes. At stagnating glacier area near the glacier front, on the other hand, thinning rates may even decrease over time. We conclude that trends of glacier mass loss rates in this part of the Himalaya cannot be generalized, neither for debris-covered nor for debris-free glaciers. |
| [80] | |
| [81] | . 以2004年之后的Landsat TM/ETM+和ASTER遥感影像为基础,参考第一次中国冰川目录及其他文献资料,经过影像校正、自动解译、野外考察、人工修订、交互检查和成果审定等技术环节,完成占全国冰川总面积85.5%的现状冰川编目,确定中国目前共有冰川48571条,总面积约5.18×104km2,约占全国国土面积的0.54%,冰川储量约4.3~4.7×103km3。中国冰川数量和面积分别以面积0.5 km2的冰川和面积介于1.0~50.0 km2的冰川为主,面积最大的冰川是音苏盖提冰川(359.05 km2)。中国西部14座山系(高原)均有冰川分布,其中昆仑山冰川数量最多,其次是天山、念青唐古拉山、喜马拉雅山和喀喇昆仑山,这5座山系冰川数量占全国冰川总数量的72.3%;冰川面积和冰储量位列前3位的山系分别为昆仑山、念青唐古拉山和天山,尽管喀喇昆仑山冰川数量和面积均小于喜马拉雅山,但前者冰储量高于后者。从冰川海拔分布来看,海拔4500~6500 m之间是冰川集中发育区域,约占全国冰川总面积的4/5以上。冰川资源在各流域分布差异显著,东亚内流区(5Y)是中国冰川分布数量最多、面积最大的一级流域,约占全国冰川总量的2/5以上;黄河流域(5J)是冰川数量最少、规模最小的一级流域,仅有冰川164条,面积126.72 km2。新疆和西藏的冰川面积和冰储量约占全国冰川总面积的9/10。 . 以2004年之后的Landsat TM/ETM+和ASTER遥感影像为基础,参考第一次中国冰川目录及其他文献资料,经过影像校正、自动解译、野外考察、人工修订、交互检查和成果审定等技术环节,完成占全国冰川总面积85.5%的现状冰川编目,确定中国目前共有冰川48571条,总面积约5.18×104km2,约占全国国土面积的0.54%,冰川储量约4.3~4.7×103km3。中国冰川数量和面积分别以面积0.5 km2的冰川和面积介于1.0~50.0 km2的冰川为主,面积最大的冰川是音苏盖提冰川(359.05 km2)。中国西部14座山系(高原)均有冰川分布,其中昆仑山冰川数量最多,其次是天山、念青唐古拉山、喜马拉雅山和喀喇昆仑山,这5座山系冰川数量占全国冰川总数量的72.3%;冰川面积和冰储量位列前3位的山系分别为昆仑山、念青唐古拉山和天山,尽管喀喇昆仑山冰川数量和面积均小于喜马拉雅山,但前者冰储量高于后者。从冰川海拔分布来看,海拔4500~6500 m之间是冰川集中发育区域,约占全国冰川总面积的4/5以上。冰川资源在各流域分布差异显著,东亚内流区(5Y)是中国冰川分布数量最多、面积最大的一级流域,约占全国冰川总量的2/5以上;黄河流域(5J)是冰川数量最少、规模最小的一级流域,仅有冰川164条,面积126.72 km2。新疆和西藏的冰川面积和冰储量约占全国冰川总面积的9/10。 |
| [82] | The ablation amount for entire ice cliffs reaches about 20% of that at the whole debris-covered area; the ablation rate at the ice cliff mainly depends on shortwave radiation, which differs widely with the orientation of an ice cliff. Therefore, the distribution of ice cliffs in relation to their orientation was observed on a debris-covered glacier. The south-facing cliffs were small in area because they have low slope angles and tended to be covered with debris. The north-facing cliffs, on the other hand, were large in the studied area and maintain a slope angle larger than the repose angle of debris. They, therefore, are stable. Longwave radiation from the debris surface opposite the ice cliffs was larger on the lower portion of ice cliffs than on the upper portion in every azimuth. This difference in longwave radiation maintained a steep slope angle on ice cliff. Shortwave radiation was stronger at the upper portion of ice cliffs than at the lower portion due to the local shading effect, causing gentle sloping of ice cliffs. This was especially pronounced at cliffs facing to south. Therefore, the dependency of the ice cliff angle in orientation can be explained by the difference in local radiation between the upper and lower portion of the ice cliff. |
| [83] | . ABSTRACT There are many supraglacial ponds on debris-covered glaciers in the Nepal Himalayas. The heat absorbed at the surface of a pond was estimated from heat budget observations on the Lirung Glacier in Langtang Valley, Nepal. The results indicated an average heat absorption of 170 W m" 2 during the summer monsoon season. This rate is about 7 times the average for the whole debris-covered zone. Analysis of the heat budget for a pond suggests that at least half of the heat absorbed at a pond surface is released with the water outflow from the pond, indicating that the water warmed in the pond enlarges the englacial conduit that drains water from the pond and produces internal ablation. Furthermore, the roof of the conduit could collapse, leading to the formation of ice cliffs and new ponds, which would accelerate the ablation of the debris-covered glacier. |
| [84] | . Ablation of debris-mantled glaciers in Nepal has resulted in the formation of several potentially unstable moraine-dammed lakes, some of which constitute serious hazards. Ngozumpa Glacier, Khumbu Himal, has undergone significant downwasting in recent decades, and is believed to lie close to the threshold for moraine-dammed lake formation. The debris-mantled ablation area of the glacier is studded with numerous supraglacial lakes, the majority of which occupy closed basins with no perennial connections to the englacial drainage system ("perched lakes''). Perched lakes can undergo rapid growth by subaerial and water-line melting of exposed ice faces, and calving. Subaerial and subaqueous melting beneath thick(>1m) debris mantles is comparatively insignificant. Although lake expansion can contribute substantially to ablation of the glacier, perched lakes cannot continue to grow indefinitely, but are subject to rapid drainage once a connection is made to englacial conduits. The level of one of the lakes on the Ngozumpa, however, is controlled by the altitude of a spillway through the lateral moraine of the glacier. This lake underwent only limited growth in the period 1998-2000, but is likely to experience monotonic growth if glacier mass balance continues to be negative. |
| [85] | . Ice cliffs have been identified as a reason for higher ablation rates on debris-covered glaciers than are implied by the insulation effects of the debris. This study aims to improve our understanding of cliff backwasting, and the role of radiative fluxes in particular. An energy-balance model is forced with new data gathered in May and October 2013 on Lirung Glacier, Nepalese Himalaya. Observations show substantial variability in melt between cliffs, between locations on any cliff and between seasons. Using a high-resolution digital elevation model we calculate longwave fluxes incident to the cliff from surrounding terrain and include the effect of local shading on shortwave radiation. This is an advance over previous studies, that made simplified assumptions on cliff geometry and radiative fluxes. Measured melt rates varied between 3.25 and 8.6 cm d(-1) in May and 0.18 and 1.34 cm d(-1) in October. Model results reproduce the strong variability in space and time, suggesting considerable differences in radiative fluxes over one cliff. In October the model fails to reproduce stake readings, probably due to the lack of a refreezing component. Disregarding local topography can lead to overestimation of melt at the point scale by up to similar to 9%. |
| [86] | . Supraglacial ponds on debris-covered glaciers present a mechanism of atmosphere/glacier energy transfer that is poorly studied, and only conceptually included in mass-balance studies of debris-covered glaciers. This research advances previous efforts to develop a model of mass and energy balance for supraglacial ponds by applying a free-convection approach to account for energy exchanges at the subaqueous bare-ice surfaces. We develop the model using field data from a pond on Lirung Glacier, Nepal, that was monitored during the 2013 and 2014 monsoon periods. Sensitivity testing is performed for several key parameters, and alternative melt algorithms are compared with the model. The pond acts as a significant recipient of energy for the glacier system, and actively participates in the glacieru2019s hydrologic system during the monsoon. Melt rates are 2-4 cm d-1 (total of 98.5 m3 over the study period) for bare ice in contact with the pond, and -1</sup> (total of 10.6m3) for the saturated debris zone. The majority of absorbed atmospheric energy leaves the pond system through englacial conduits, delivering sufficient energy to melt 2612 m3 additional ice over the study period (38.4 m3 d-1). Such melting might be expected to lead to subsidence of the glacier surface. Supraglacial ponds efficiently convey atmospheric energy to the glacieru2019s interior and rapidly promote the downwasting process. |
