 , ����ʢ
Application of GWR model in hyperspectral prediction of soil heavy metals
JIANGZhenlan, YANGYushengͨѶ����:
�ո�����:2016-09-27
������:2016-12-13
�����������:2017-03-15
��Ȩ����:2017������ѧ�����༭�������ǿ��Ż�ȡ�ڿ����ף�����������¿�������ʹ�ã�ѧ���о���ѧ�����������н�ѧ�ȣ���������������ҵĿ��.
��������:
�����:
-->
չ��
ժҪ
�ؼ��ʣ�
Abstract
Keywords��
-->0
PDF (1675KB)Ԫ������ά��������������ղ�����
�������ø�ʽ����EndNoteRisBibtex�ղر���-->
1 ����
������ũҵ��������Ҫ����Ȼ��Դ������ũҵ��Լ�������ķ�չ�Լ����л����̵ļӿ�,�ؽ���ͨ����ˮ��ȡ�������ʪ����������ũ�õ�;����������,�ؽ�����Ⱦ�ѳ�Ϊ����������Ⱦ����Ⱦ�����㡢Σ�����Ļ�������֮һ[1-4]����������ؽ�����Ⱦ����������Ҫ������Ⱦ���,2016��5��31�չ���Ժӡ�����ڡ�������Ⱦ�����ж��ƻ��������2018���ǰ����������Ⱦ��������ֲ�[5]���߹���ң�м���������ͬʱ��þ�ϸ�ļ��������Ĺ���,�Ӷ��ܹ����ݵ���Ĺ��������Ե�����з��ݺ�ʶ��,Ϊ���ٻ�ȡ�����ؽ���Ԫ����Ϣ�ṩ���µ�;��[6-8]�������ؽ����߹���Ԥ��Ļ�������,�߹���ң�������ȡ����������ϸ�ķ�������п��ܲ��������ؽ����Ĺ�����������,ͨ�����������ؽ����Ĺ�������,ɸѡ�������ؽ�����Ӧ�����в���,�Ӷ�����ģ�Ͷ��ؽ������ж���Ԥ��[9]��ĿǰӦ���ڸ߹��������ؽ�����Ԥ�ⷽ����Ҫ�ж�Ԫ���Իع�[10-11]��ƫ��С���˻� ��[10, 12-13]��֧��������[14]���˹�������[11, 15]��С������[16-17]���Ŵ��㷨[18]�����ɭ��[19]��,��Щ�������ض����о�����ȡ���˽Ϻõ�Ч��������Щ�����ٶ��о����������ؽ��������ڲ�ͬ�ռ�λ���϶Թ������ʵ�Ӱ������ͬ��,��ϵ���Dz����,�����������ؽ��������뷴�����֮���ϵ�Ŀռ������ԡ�Ȼ��,�����ؽ���Ԫ�غ����������������ĸ�ʡ��������͡����Ρ�ˮ�ġ�С�������Ȼ�����Լ����н��衢��ҵ��ũҵ���ɿ����Ϊ���ص�Ӱ��,��ЩӰ����������Ժ�������,ʹ�ؽ����ķֲ����ֳ�һ���Ŀռ��������[20-26]������,�������������������й����ʵ��ۺϷ�ӳ,���ؽ�����,���ܵ������ṹ�ͳɷ֡�ֲ���Ȼ�������Ӱ��,���ڲ�ͬ���о�����,��ͬ��λ��,�����������͡���ֺ���Ⱦˮƽ��ͬ,�����ؽ�����������������Ĺ�ϵҲ�������仯[27-30],��ǰ���о���,�����о����������ؽ��������Թ������ʵ�Ӱ������ͬ�ļ���������ʵ����������Ǻ�,ģ�͵�Ԥ�⾫��Ҳ���ܵ�Ӱ�졣
��Ӣ��New Castle��ѧ����ѧ��Fortheringham��[31]��1996������ĵ���Ȩ�ػع飨Geographically Weighted Regression, GWR��ģ��,��һ�ֶԲ�ͬ�ռ��������Ա����������֮���ϵ��ռ�仯���н�ģ�ķDz����ֲ��ռ�ع��������,���㷺Ӧ���ڿռ��ƽ���Թ�ϵ̽��,�����������ԵĿռ�Ԥ����ȡ�ýϺ�Ч��[32-34],���й�����ģ���������ؽ����߹���Ԥ���о��е�Ӧ����δ�����ױ���������ѡ��ʡ������Ϊ�о�����,�������ؽ����ӣ�Cd����ͭ��Cu����Ǧ��Pb��������Cr����п��Zn��������Ni��Ϊ����,���������ؽ���Ԥ���GWRģ��,��̽��GWRģ�������������ؽ����߹����о��е������Լ�������,Ϊģ���ƹ��ṩ���ۺͼ���֧�֡�
2 �о����ſ�
�о���ѡ���ڸ���ʡ�����С������еش��й������غ�,��ɽ�溣,λ��118��08��E~120��31��E��25��15��N~26��29��N֮��,�������ȴ������Լ�������,�������16~20 ��,�꽵ˮ��Ϊ900~1200 mm�����������ڵ����ڵ��͵ĺӿ����,������ܱ�Ⱥɽ�����Χ,��ò��ɽ�ء�����Ϊ��,���ζ���600~1000 m֮��,������������б,����ܱߺ��νϸߴ��ĵش�������Ϊ��������Ϊ����ʡ��ʡ�����,�����������˿��ܶȴ�ũҵ�Ϸ���,������Ⱦ�����ս�ͻ��,�������ڵ��θ�������,ʹ�������ؽ����ڿռ�ֲ��ϳ��ֳ������Դ���ص㡣3 ������Դ���䴦��
3.1 ������Ʒ�ɼ��ͷ���
���о�����Χ����ƽ̶���⣩,���ɼ�132��0~20 cm������������,����ֲ���Ϊ���ȣ�ͼ1����������ͬʱ,�����ֳ�GPS��λ����ľ�γ�����꼰�̡߳�ÿ���������Ϻ�ȡ500 g����,��ʵ���ҷ��,ȥ��ɳ������ֲ��������ĥ,��100Ŀ����ɸ��ÿ����Ʒ�ֳ����ݣ�ÿ�ݸ�Լ250 g��,һ���������л�ѧ����,��һ���������й������������ؽ����������õ����ϵ��������ף�ICP-MS,����Thermo Electron�����вⶨ��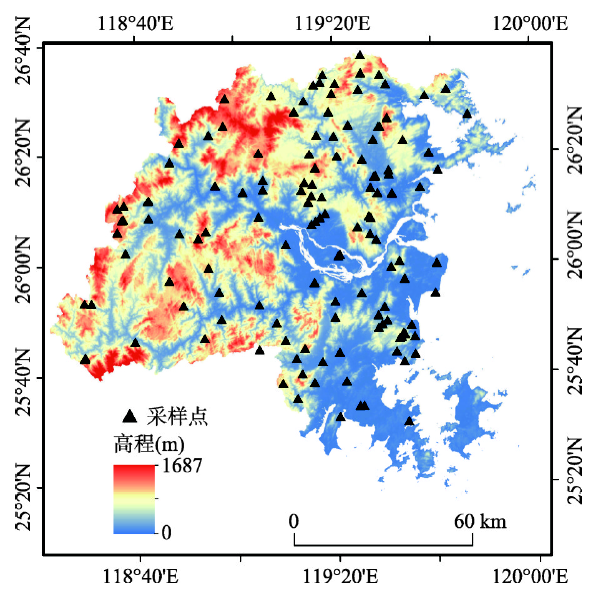 ��ʾԭͼ|����ԭͼZIP|����PPT
ͼ1�о����������ֲ�
-->Fig. 1Study area and sample sites
-->
3.2 �������ײⶨ����Ԥ����
������Ʒ���ײⶨ��������ASD��Analytical Spectral Device����˾�����ĵ��������FieldSpec 3�����ڲ���,���η�ΧΪ350~2500 nm,��350~1100 nm��1000~2500 nm��Χ�ڵĹ��ײ�������ֱ�Ϊ1.4 nm��2 nm,�����ز�����ļ��Ϊ1 nm,���2151�����Ρ�������Ԥ���������������ֱ������10 cm,��ȴ���5 cm��ʢ��������,����������ʹ�������������Ȼ״̬,��1000 W��±�����Ϊ��Դ,����15��Ĺ�Դ����Ƕȡ�15 cm��̽ͷ���뼰30 cm�Ĺ�Դ����,�Ӵ�ֱ����������ķ����������������ײ���,������40 cm��40 cm�İװ���ж���,��ȡ���Է����ʡ�Ϊ���������IJ��ȶ���,ÿ�������ɼ�10����������,����ViewSpec Pro�������쳣���ߺ�ȡ��������ƽ��ֵ��Ϊ������ԭʼ�����ʹ���ֵ[35]������Ԥ������Ҫ�������� ����Savitzky-Golayƽ�������߽��д���,���������������ϴ��ڵġ�ë�̡�����;�� ��ƽ�����������10 nmΪ�����������ƽ����������ز���,�õ�10 nm���ֱ��ʵ�������������,�Դﵽѹ������,�������ڲ��μ�������Ϣ��Ŀ�ġ�3.3 �������ױ任����������ѡȡ
Ϊ������������,ͻ����������ֵ,���Ķ����������ʣ�Reflectance, R���������±任��һ���֣�First Derivative, FD���������֣�Second Derivative, SD���������任��Reciprocal Transformation, RT����������һ���֣�RTFD���������Ķ����֣�RTSD�������������任��������,Absorbance Transform, AT��������������һ���֣�ATFD�������������Ķ����֣�ATSD��������ͳȥ����Continuum Removal, CR���ȡ��������ؽ���������任��Ĺ������ݽ�����ط���,ɸѡ�����ϵ�����Ĺ����������Ρ��ڴ˻�����,�������ؽ�������Ϊ�����,����������ֵΪ�Ա���,ͨ���ع��������,ɸѡ��������С�ı�������ģ�͵Ĺ�����4 �о�����
GWR����Fotheringham��[31]�����һ���ռ�����ģ��,�Ƕ���ͨ��С���˷��ع飨Ordinary Least Squares Regression, OLS��ģ�ͣ�ʽ��1�����Ŀռ���չ,�����ݵĵ���λ��Ƕ�뵽�ع����֮��,ʹ�ò������Խ��оֲ�����,��չ���ģ����ʽ��2����ʽ�У�yiΪ����i�������;xikΪ��i�������ϵ�k�������Ĺ۲�ֵ;
GWRģ���е�
ʽ�У�
ʽ�У�WijΪ����֪��j���ƴ����iʱ��Ȩ��;dijΪ�����i������j���ŷ�Ͼ���;hΪ���������д���h����СAIC��Ϣ��Akaike Information Criterion��ȷ�������ĵ�GWR�ع������Fotheringham�ȿ�����GWR 4.0����֧�������,ģ�;������۲���AIC���ھ���ϵ����Adj-R2�����в�ƽ���ͣ�RSS����ָ��������ۡ�����,�ؽ�����Ԥ��ֵ��ʵ��ֵ������ϵ�����ع�ĵ��ھ���ϵ����R2���;��������Ҳ�������Ƚ�GWR��OLS��Ԥ��Ч����
5 �������
5.1 �����ؽ���������ͳ�Ʒ���
��1Ϊ��������������ʵ����ؽ���ͳ������ֵ�����ؽ����ĺ�����,Cd��ֵΪ0.74 mg��kg-1,���ڹ���������������������;�ؽ���Pb��Zn��ֵ���ڹ�������������������һ���Ͷ���֮��;���ؽ���Cu��Cr��Ni����ڹ���������������һ����[36]��˵���о������ؽ���Cd����Ⱦ��Ϊ����,��Pb��ZnԪ�������Ⱦ,������Ԫ�ص�Ӱ�����ؽ����Ŀռ�ֲ���,6���ؽ����ı���ϵ����50%~75%֮��,���еȱ���,˵���⼸���ؽ����������еķֲ�������,�ռ������Խ�Ϊ������Tab. 1
��1
��1�����������ؽ���������ͳ������
Tab. 1Statistical values for measured content of soil heavy metals in Fuzhou City
| �ؽ��� | ��Сֵ (mg��kg-1) | ���ֵ (mg��kg-1) | ƽ��ֵ (mg��kg-1) | ���� (mg��kg-1) | ƫ�� (mg��kg-1) | ��� (mg��kg-1) | ����ϵ�� (%) |
|---|---|---|---|---|---|---|---|
| Cd | 0.01 | 2.94 | 0.74 | 0.38 | 1.49 | 8.21 | 51.35 |
| Cu | 5.68 | 94.60 | 23.54 | 14.89 | 1.93 | 5.32 | 63.25 |
| Pb | 8.78 | 155.96 | 44.85 | 24.37 | 1.76 | 3.97 | 54.34 |
| Cr | 0.75 | 111.55 | 26.13 | 17.85 | 1.69 | 4.53 | 68.31 |
| Zn | 1.15 | 383.13 | 101.19 | 54.73 | 1.63 | 5.54 | 54.09 |
| Ni | 0.23 | 50.96 | 12.25 | 8.73 | 1.79 | 4.86 | 71.27 |
�´��ڴ�
5.2 �����ؽ�����������ױ�������ط���
���任�����������ֵ�������ؽ�����������Pearson��ط���,ɸѡ��������ϵ�������Ӧ�Ĺ���������������2��ʾ������2�п��Կ������� ����PbԪ����ԭʼ�����ʼ����������任ֵ֮������Բ�������,�����ؽ�����������ױ������������ϵ�����ﵽ0.01�ļ�������ˮƽ��0.05��������ˮƽ;�� ��ͬ�ؽ����Ĺ����������������Dz�ͬ��,Cd��Pb��ZnԪ�ص���������������Ҫ�ڽ����Ⲩ��,��Cu��NiԪ�ص�����������������Ҫ�ڿɼ��Ⲩ��;�� ��ͬ���ױ任���ؽ���������������ǿ���ò�����ͬ,����,�����任�͵��������任�������ؽ���������������ǿ����������,����Ϊ�����ֱ任���ؽ�����������ϵ������CrԪ���⣩������ԭʼ���������ؽ����������������ϵ��;�� ���ڲ�ͬ�ؽ�����˵,���ױ任��Cd��PbԪ�صĹ�����������ǿ�������,�任��Ĺ�������ֵ��Cd��Pb֮���������ϵ��������ԭʼ�����������ǵ�������ϵ����Tab. 2
��2
��2�����������ؽ�����������ױ�����������ϵ��
Tab. 2Maximum correlation coefficients between soil heavy metal content and spectral variables in Fuzhou City
| �ؽ��� | R | FD | SD | RT | RTFD | RTSD | AT | ATFD | ATSD | CR | |
|---|---|---|---|---|---|---|---|---|---|---|---|
| Cd | �������� ���ϵ�� | 1040 -0.211* | 2420 0.347** | 1990 0.329** | 1040 0.230** | 2420 -0.327** | 1990 -0.352** | 1040 0.220** | 2420 -0.345** | 1250 0.354** | 2170,2190 0.251** |
| Cu | �������� ���ϵ�� | 420 -0.478** | 470 -0.426** | 940 0.330** | 380,390,400 0.519** | 510 -0.534** | 450 0.480** | 410 0.511** | 1150 -0.371** | 410 -0.353** | 410 -0.337** |
| Pb | �������� ���ϵ�� | 2500 -0.164 | 2490 -0.212* | 1940 -0.240** | 2500 0.182* | 2500 0.234** | 2490 0.237** | 2500 0.171 | 2500 0.222** | 2490 0.218** | 1630 0.190* |
| Cr | �������� ���ϵ�� | 520 0.415** | 2230 -0.434** | 1440 0.351** | 360 0.357** | 410 -0.337** | 430 0.319** | 2010 0.411** | 1440 -0.327** | 1440 -0.327** | 2210 0.310** |
| Zn | �������� ���ϵ�� | 2240 -0.469** | 390 -0.437** | 440 0.332** | 2150,2160 0.497** | 1050 -0.359** | 2100 0.335** | 2150,2160 0.483** | 2170 -0.313** | 2080 -0.322** | 1480 0.212* |
| Ni | �������� ���ϵ�� | 2410 -0.430** | 390 -0.374** | 560 0.300** | 2470 0.438** | 480 -0.399** | 780 0.410** | 2470 0.436** | 600 0.325** | 780 0.294** | 450 -0.293** |
�´��ڴ�
5.3 �����ؽ���Ԥ��ģ�͵���ѹ����������
Ϊ�������ױ�����Ķ��ع�����,�������ؽ�������Ϊ�����,�������εĹ���ֵΪ�Ա���,���������Իع����ɸѡ���ӵ�������,��Ϊ�ع����ĵ���R2���,�Ա�����ķ����������ӣ�Variance inflation factor, VIF��С��7.5,�������3��ʾ��Tab. 3
��3
��3���ù��ױ����Ը����������ؽ������������Իع�Ľ��
Tab. 3Results of stepwise linear regression between soil heavy metals and spectral variances in Fuzhou City
| �ؽ��� | ģ�ͱ��� | ����R2 | ������� | F | ������ˮƽ |
|---|---|---|---|---|---|
| Cd | ����, SD_1990, RT_1040 | 0.179 | 0.343 | 15.413 | 0.000 |
| Cu | ����, FD_470, RT_380, RTSD_450 | 0.300 | 12.442 | 19.658 | 0.000 |
| Pb | ����, FD_2490, SD_1940, RTSD_2490, CR_1630 | 0.141 | 22.430 | 7.781 | 0.000 |
| Cr | ����, SD_1440, RTSD_430 | 0.226 | 15.685 | 20.170 | 0.000 |
| Zn | ����, RT_2150, RTFD_1050 | 0.312 | 45.235 | 30.706 | 0.000 |
| Ni | ����, RT_2470, RTFD_480 | 0.180 | 7.874 | 15.427 | 0.000 |
�´��ڴ�
����3���Կ���,ԭʼ�����ʾ�δ��Ϊ������ӳ����ڻع鷽����,˵���������ؽ����ĸ߹���Ԥ����,���ñ任��Ĺ����������β���ģ������Ч��������ԭʼ������Ԥ���Ч��Ҫ�á�����,�Թ��ĵ����任��Ԥ��ģ�����е�������Ϊͻ��,�ֱ������Cd��Cu��Zn��NiԪ��Ԥ��ģ�͵Ĺ���,˵�������任����������ͻ���ؽ����Ĺ�������,���ɺܺõ����ģ��Ԥ��ľ��ȡ����Ϊ�����ֱ任�͵����任�Ķ�����,�ֱ������Cd��Pb��CrԪ�غ�Cu��Pb��CrԤ��ģ�͵Ĺ���������һ���ֱ任�͵����任��һ������ģ�͵Ĺ�����Ҳ�нϺõı���,�ֱ��������������Ԫ�ص�Ԥ��ģ���������������ؽ�������������������ǿ���õĵ��������任,�ڱ��ĵĸ߹���Ԥ��������ֲ���,��˵������Ȼ���������任���Ը��õ�ͻ�������ؽ����Ĺ�����Ϣ,���������ģ��Ԥ��ľ��ȡ�
5.4 �����ؽ�����OLS��GWR����
Ϊ������֤��ģ��������֤������Χһ��,���������ݰ������ؽ��������Ӵ�С����,ÿ��������Ʒȡһ����Ϊ��֤����,��44����33%��,�����88����67%����Ϊ��ģ�������ع�ɸѡ��Ĺ���������Ϊ�Ա���,�ֱ�����OLS��GWRģ�Ͷ��ؽ������лع����,�ع��AIC������R2���в�ƽ�����Լ���֤����Ԥ��ֵ��ʵ��ֵ�ع�ĵ���R2����������RMSE����ͳ��������4��ʾ��Tab. 4
��4
��4�����������ؽ���OLS��GWRԤ��ģ�͵ľ��ȼ���
Tab. 4Prediction accuracy of OLS and GWR regression models in Fuzhou City
| �ؽ��� | ��ģ���� | ��֤���� | |||||||||
|---|---|---|---|---|---|---|---|---|---|---|---|
| AIC | ����R2 | �в�ƽ���� | ����R2 | ��������� | |||||||
| OLS | GWR | OLS | GWR | OLS | GWR | OLS | GWR | OLS | GWR | ||
| Cd | 75.807 | 78.544 | 0.181 | 0.196 | 10.986 | 10.330 | 0.167 | 0.192 | 0.302 | 0.294 | |
| Cu | 730.248 | 698.162 | 0.323 | 0.649 | 13758.666 | 4141.423 | 0.217 | 0.613 | 11.658 | 8.192 | |
| Pb | 1204.227 | 1199.618 | 0.141 | 0.216 | 64334.784 | 55866.254 | 0.083 | 0.213 | 24.700 | 22.884 | |
| Cr | 742.016 | 720.703 | 0.266 | 0.716 | 21484.197 | 5441.275 | 0.090 | 0.396 | 15.487 | 12.463 | |
| Zn | 925.785 | 916.964 | 0.281 | 0.525 | 194869.446 | 92018.520 | 0.247 | 0.456 | 39.781 | 31.934 | |
| Ni | 602.693 | 605.455 | 0.212 | 0.219 | 5406.102 | 5179.912 | 0.094 | 0.117 | 7.392 | 7.292 | |
�´��ڴ�
��ģ�͵Ļع�Ч����,�����ؽ�����OLSԤ��Ч�������ϲ�̫����,����CuԪ�ص�Ԥ��Ч����ԽϺ�,���Ͷȣ�����R2��Ϊ32.3%,���ΪZn�����Ͷ�Ϊ28.1%����Cr�����Ͷ�Ϊ26.6%����Ni�����Ͷ�Ϊ21.2%��,��Cd��PbԤ��Ľ��ͳ̶���С��20%����GWRԤ��ģ����,����CrԪ�ص�Ԥ��Ч�����,���Ͷ�Ϊ71.6%,���ΪCu,���Ͷ�64.9%,�������ΪZn��Pb��Cd��Ni��
GWR�����Բ�ͬ�ؽ���Ԥ�⾫�ȵ���������Dz�ͬ�ġ�����Cu��Pb��Cr��Zn 4���ؽ�����˵,GWRԤ�⾫���������,����Ϊ��Cu��Pb��Cr��Zn 4���ؽ�����GWRԤ��AICֵ�ֱ������32.09��4.61��21.31��8.82,������3����ͬģ���е�AICֵ���ܼ���3����λ,��Ϊģ������������[37]��,˵����4��Ԫ�ص�GWR�������ؽ���Ԥ���Ч���������ԡ�����,CrԪ�ص�GWRԤ�⾫����ߵ�Ч����Ϊ����,����R2��OLSģ�͵�0.266��ߵ�GWR��0.716,������GWRģ�Ͷ�CrԤ��Ľ��ͳ̶ȱ�OLS�����45%,ΪOLSģ�͵�2.69��,���в�ƽ���ͼ�����16042.92,��ΪOLS��25.33%;���ΪCuԪ��,GWRģ�͵ĵ���R2��OLSģ�͵�0.323�ᵽ0.649,�����32.6%,ΪOLSģ�͵�2.01��,���в�ƽ���ͼ�����9617.24,��ΪOLS��30.09%���������ΪZnԪ�غ�PbԪ��,GWRģ�͵Ľ��ͳ̶ȱ�OLS�ֱ������24.4%��7.5%,���в�ƽ���ͷֱ������52.78%��13.16%������Cd��NiԪ����˵,GWR�ع�ĵ���R2��OLSģ���������ӣ��ֱ��0.181��0.212�ᵽ0.196��0.219��,�в�ƽ�������н��ͣ��ֱ���5.97%��4.18%��,��GWR��AICֵ��OLSģ��ȴ������������ֵС��3��,˵��GWRģ�ͶԸ�����Ԫ��Ԥ�⾫�ȸ���Ч�������ԡ�
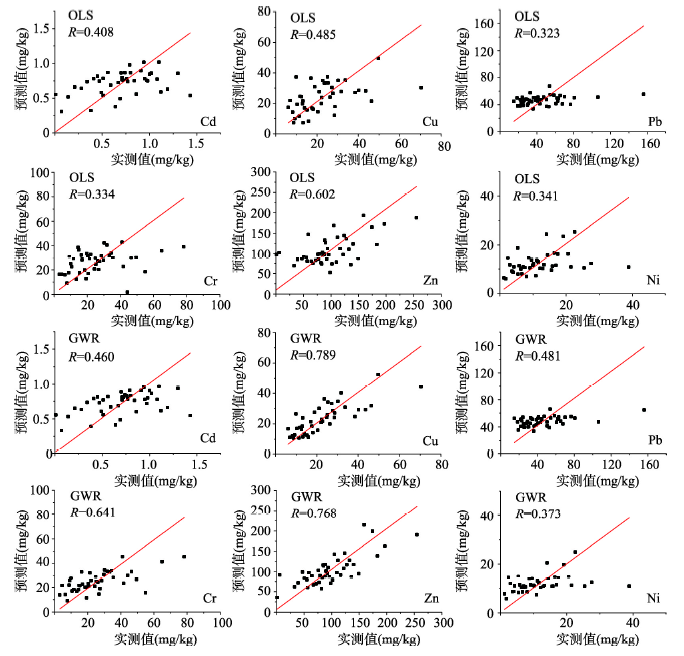
ģ�͵���֤Ч��Ҳ��һ��֤ʵ�����Ͻ��,Cu��Pb��Cr��Zn 4���ؽ�����GWRԤ��ֵ��ʵ��ֵ�ع�ĵ���R2��OLSģ�����˺ܴ����,������������������ԵĽ��͡�Ϊ�˸��õ�˵����һ����,������֤���������ؽ�����OLS��GWR��Ԥ��ֵ��ʵ��ֵɢ��ͼ��ͼ2������ͼ2����ֱ�ۿ���,OLSģ�͵������ؽ���Ԥ�⾫���ձ鲻��,����ZnԤ��ֵ��ʵ��ֵ֮������ϵ��Ϊ0.602��,����Ԫ�ص�Ԥ��ֵ��ʵ��ֵ֮������ϵ����С��0.5��GWRģ�͵�Ԥ������ʵ��ֵ���Ǻϳ̶�Ҫ����OLSģ�͡�����,Cu��Cr��Zn��Pb��GWRģ��Ԥ������OLSģ�����˽ϴ�ĸ���,Ԥ��ֵ��ʵ��ֵ֮����ֳ��Ϻõ��Ǻ϶�,���ϵ���ֱ�Ϊ0.789��0.641��0.768��0.481,��OLSģ�ͷֱ������0.304��0.307��0.166��0.158����Cd��Ni��GWRģ�͵�Ԥ��ֵ��ʵ��ֵ֮������ϵ����OLS��߲����ԡ�������OLSģ�ͻ���GWRģ��,ʵ��ֵ�ϵ�ʱ,��Ԥ��ֵ��ʵ��ֵ���Ǻ϶ȽϺ�,����ʵ��ֵ�ϴ�ʱ,Ԥ��Ч������ƫ�ͣ�ͼ2��,˵��ģ�͵������Ҫ���������ؽ��������ϸߵ�����,����Ҫ�����ڱ��ĵ�����������,�ɼ�������ؽ��������Ե�ֵΪ��,�������ĸ�ֵ�������Ϊ��Եļ�ֵ����,����Ԥ�⾫��ƫ�͡�������������GWRģ�Ϳ����ں����ϵ�����������ؽ���Ԥ��,���ƹ��������ؽ������ղ鹤����,������������,�ʵ��Ӵ��ؽ��������ϸߵ�������,�����ڸ���ģ�͵�Ԥ�⾫�ȼ������ԡ�
 ��ʾԭͼ|����ԭͼZIP|����PPT
ͼ2�����������ؽ���������OLS��GWRģ�͵�Ԥ��ֵ��ʵ��ֵɢ��ͼ
-->Fig. 2Scatter plot of measured and predicted soil heavy metal contents in OLS and GWR models in Fuzhou City
-->
5.4 �����ؽ�����������ױ�����Ŀռ��ƽ���Է���
��ģ�Ͳ�������ͳ��,ͨ��GWRģ�;ֲ����������ķ�λ����upper quartiles, UQ�������ķ�λ����lower quartiles, LQ����ֵ��Χ��OLSģ��ȫ�ֲ�������������standard errors, SE�����бȽϷ���,�ж������ؽ�������Ӧ��������ع�ϵ�Ƿ���ڿռ���ȶ��ԣ���5������GWRģ�ͱ���������UQ-LQֵ����OLS��Ӧ����������SEֵ������2��SE��ʱ,�����ؽ�������Ӧ���ױ����Ĺ�ϵ�������ԵĿռ��ƽ����,��֮,��ռ��ƽ���Բ����ԡ�Tab. 5
��5
��5�����������ؽ�����������ϵ�Ŀռ��ƽ���Լ���
Tab. 5Test of spatial non-stationarity of the relationship between soil heavy metal and variables in Fuzhou City
| �ؽ��� | ���� | ����1 | ����2 | ����3 | ����4 | |||||||||
|---|---|---|---|---|---|---|---|---|---|---|---|---|---|---|
| UQ-LQ | SE | UQ-LQ | SE | UQ-LQ | SE | UQ-LQ | SE | UQ-LQ | SE | |||||
| Cd | 0.04 | 0.18 | 3286.93 | 2440.54 | 0.03 | 0.09 | ||||||||
| Cu | 27.71 | 11.23 | 24251.91 | 10698.67 | 2.51 | 0.82 | 15446.67 | 3914.22 | ||||||
| Pb | 252.90 | 287.82 | 1035.71 | 978.55 | 323742.57 | 155253.07 | 1329.4 | 1314.67 | 234.69 | 289.44 | ||||
| Cr | 15.78 | 3.60 | 277645.03 | 51064.04 | 6360.06 | 1981.41 | ||||||||
| Zn | 153.11 | 31.68 | 80.30 | 17.37 | 17108.15 | 6167.21 | ||||||||
| Ni | 6.39 | 5.03 | 2.39 | 2.32 | 61.63 | 70.43 | ||||||||
�´��ڴ�
����5��֪,Cr��Cu��ZnԪ��GWRԤ��ģ��������UQ-LQֵ������OLSģ�͵�2��SEֵ,˵����3���ؽ���Ԥ��ĸ������ڿռ��Ͼ����ֳ������Ŀռ��ƽ����;PbԪ�ص�ֻ�б���2��SD_1940����UQ-LQֵ����OLSģ�͵�2��SEֵ,˵��ֻ�б���SD_1940��Pb֮��Ĺ�ϵ���������Ŀռ��ƽ����,��������������ֳ���ԵĿռ�ͬ����;Cd��NiԪ��ģ��������UQ-LQֵ��С��OLSģ�͵�2��SEֵ,��2��Ԫ��Ԥ��ĸ������ڿռ��ϳ��ֳ���ǿ�Ŀռ�ͬ���ԡ�
�ɴ˿ɼ�,�����OLSģ��,GWR�������ؽ�����Ԥ�⾫�ȵ���̶߳�ȡ���������ؽ���������ױ������ϵ�Ŀռ��ƽ���Գ̶�,����Cr��Cu��Zn��Ԫ��,����ģ�͵ĸ����ױ����������������ԵĿռ��ƽ����,GWRģ��Ԥ��Ч����OLS�������;������PbԪ��,���в��ֹ��ױ����������������ռ��ƽ����,GWRģ�ͽ�OLSģ���ƽ�Ϊ����;������Cd��Ni��Ԫ��,���ڸ����ױ�������������ԵĿռ�ͬ��������,GWRԤ��Ч����OLSģ����û��������ߡ�
6 ����
��1����OLSģ����Ƚ�,����GWRģ�ͽ��������ؽ���Ԥ��,���ڳ�ֿ������ؽ�������ױ�������ع�ϵ�Ŀռ��ƽ����,���ؽ�����Ԥ�⾫������һ������ߡ�������GWRģ��Ӧ�õ�ǰ���DZ������ϵ�Ŀռ��ƽ����,��GWRģ�Ͷ������ؽ�����Ԥ��Ч����ߵ����ô�Сȡ���������ؽ��������������ع�ϵ�Ŀռ��ƽ���Գ̶ȣ��� ����Cr��Cu��Zn��Pb��Ԥ��ģ�Ͳ������������ռ��ƽ���Ե�Ԫ��,GWRģ��Ԥ�⾫�Ƚ�OLS�������ԡ���4��Ԫ��GWR�ع�ĵ���R2�ֱ�ΪOLSģ�͵�2.69����2.01����1.87����1.53��,�����0.716��0.649��0.525��0.216;��AICֵ�Ͳв�ƽ���������Խ���,GWRԤ���AICֵΪ720.703��698.112��916.964��1199.618,��OLSģ�ͷֱ������21.31��32.09��8.82��4.61,���в�ƽ������ֱ�Ϊ5441.275��4141.423��92018.520��55866.254,��ΪOLSģ�͵�25.33%��30.09%��47.22%��86.84%���� ����Cd��Ni��Ԥ��ģ�Ͳ��������������ռ������Ե�Ԫ��,GWRԤ��Ч����OLS����Ʋ����ԡ�������Ԫ��GWR�ع�ĵ���R2��OLSģ��������ߣ��ֱ������0.015��0.007��,�в�ƽ���������½����ֱ���5.97%��4.18%��,��GWR��AICֵ��OLSģ��ȴ�����������ֱ�������2.737��2.762������2�����������ؽ���������,��ӳ������������Ϣ����,ֱ������ԭʼ���������ģ����Ч���ϲ�,��ͨ����ͬ�Ĺ��ױ任�����ؽ���������������ǿ������,���ĵ����任Ч�����,����������Ч��ǿ�����ؽ����Ĺ�������,���Ҹñ任��������ʽ,�ڸ��ؽ�����Ԥ��ģ�����о��нϺõı���,�ܺõ���������ؽ�����Ԥ��Ч���������ĵ��������任,��Ȼ������Ч����ǿ�����ؽ����Ĺ�������,������Ԥ��ģ�͵Ĺ�������ȴ����
��3�����ڱ�����������ؽ��������Ե�ֵΪ��,�������ĸ�ֵ�������Ϊ��Եļ�ֵ����,ʹ��ʵ��ֵ�ϵ������Ԥ��Ч����,ʵ��ֵ�ϴ������Ԥ��ֵƫ��,�Ӷ�Ӱ��ģ�͵�Ԥ�⾫�ȡ��ڽ����о���,Ӧ�ʵ��Ӵ��ؽ��������ϸߵ���������,��һ����֤��ģ���Ƿ������ں����ϸ�����������ؽ�������,ΪGWRģ���������ؽ����ĸ߹����о����ƹ��ṩ���ۺͼ���֧�֡�
The authors have declared that no competing interests exist.
�ο����� ԭ��˳��
������ȵ���
������������
�����ڿ�Ӱ������
| [1] | . ABSTRACT Both general and specific investigations of soil and crop heavy metal contamination were carried out across China. The former was focused mainly on Cd, Hg, As, Pb, and Cr in soils and vegetables in suburbs of four large cities; the latter investigated Cd levels in both soils and rice or wheat in contaminated areas throughout 15 provinces of the country. The results indicated that levels of Cd, Hg, and Pb in soils and some in crops were greater than the Governmental Standards (Chinese government limits for soil and crop heavy metal contents). Soil Cd ranged from 0.46 to 1.0465mg kg611, on average, in the four cities and was as high as 14565mg kg611 in soil and 765mg kg611 in rice in the wide area of the country. Among different species, tuberous vegetables seemed to accumulate a larger portion of heavy metals than leafy and fruit vegetables, except celery. For both rice and wheat, two staple food crops, the latter seemed to have much higher concentrations of Cd and Pb than the former grown in the same area. Furthermore, the endosperm of both wheat and rice crops had the highest portion of Cd and Cr. Rice endosperm and wheat chaff accumulated the highest Pb, although the concentrations of all three metals were variable in different parts of the grains. For example, 8.3, 6.9, 1.4, and 0.665mg kg611 of Pb were found in chaff, cortex, embryo, and endosperm of wheat compared with 0.11, 0.65, 0.71, and 0.1965mg kg611 in the same parts of rice, respectively. Untreated sewage water irrigation was the major cause of increasing soil and crop metals. Short periods of the sewage water irrigation increased individual metals in soils by 2 to 80% and increased metals in crops by 14 to 209%. Atmospheric deposition, industrial or municipal wastes, sewage sludge improperly used as fertilizers, and metal-containing phosphate fertilizers played an important role as well in some specific areas. |
| [2] | . <h2 class="secHeading" id="section_abstract">Abstract</h2><p id="">This paper reviews quite a few heavy metal contamination related studies in several cities from China over the past 10 years. The concentrations, sources, contamination levels, sample collection and analytical tools of heavy metals in urban soils, urban road dusts and agricultural soils were widely compared and discussed in this study. The results indicate that nearly all the concentrations of Cr, Ni, Cu, Pb, Zn, As, Hg and Cd are higher than their background values of soil in China. Among the cities, the contamination levels of the heavy metals vary in a large range. The geoaccumulation index shows that the contamination of Cr, Ni, Cu, Pb, Zn and Cd is widespread in urban soils and urban road dusts of the cities. Generally, the contamination levels of Cu, Pb, Zn and Cd are higher than that of Ni and Cr. Agricultural soils are also significantly influenced by Cd, Hg and Pb derived from anthropogenic activities. The integrated pollution index (IPI) indicates that the urban soils and urban road dusts of the developed cities and the industrial cities have higher contamination levels of the heavy metals. The comparison of the IPIs of heavy metals in urban soils and urban road dusts of Shanghai, Hangzhou, Guangzhou and Hongkong reveals that the contamination levels of the metals in urban road dusts are higher than that in urban soils in the cities. Moreover, the main sources of the metals in urban soils, urban road dusts and agricultural soils are also different.</p> |
| [3] | . Heavy metal pollution has pervaded many parts of the world, especially developing countries such as China. This review summarizes available data in the literature (2005-2012) on heavy metal polluted soils originating from mining areas in China. Based on these obtained data, this paper then evaluates the soil pollution levels of these collected mines and quantifies the risks these pollutants pose to human health. To assess these potential threat levels, the geoaccumulation index was applied, along with the US Environmental Protection Agency (USEPA) recommended method for health risk assessment The results demonstrate not only the severity of heavy metal pollution from the examined mines, but also the high carcinogenic and non-carcinogenic risks that soil heavy metal pollution poses to the public, especially to children and those living in the vicinity of heavily polluted mining areas. In order to provide key management targets for relevant government agencies, based on the results of the pollution and health risk assessments, Cd, Pb, Cu, Zn, Hg, As, and Ni are selected as the priority control heavy metals; tungsten, manganese, lead-zinc, and antimony mines are selected as the priority control mine categories; and southern provinces and Liaoning province are selected as the priority control provinces. This review, therefore, provides a comprehensive assessment of soil heavy metal pollution derived from mines in China, while identifying policy recommendations for pollution mitigation and environmental management of these mines. (C) 2013 Published by Elsevier B.V. |
| [4] | . |
| [5] | |
| [6] | . The aim of this study is to derive parameters from spectral variations associated with heavy metals in soil and to explore the possibility of extending the use of these parameters to hyperspectral images and to map the distribution of areas affected by heavy metals on HyMAP data. Variations in the spectral absorption features of lattice OH and oxygen on the mineral surface due to the combination of different heavy metals were linked to actual concentrations of heavy metals. The ratio of 610 to 500 nm (R |
| [7] | . A new method was put forward to assess the cadmium pollution of soil by hyperspectra technology.175 soil samples were collected using a FieldSpec 3 spectrometer in mine and factory area.All samples were divided randomly into 2 groups,one group with 135 samples used as calibration set,and another with 40 samples used as prediction set.The samples data were pretreated with the methods of wavelet denoising and standard normalization variate(SNV),and then analyzed by principal component analysis(PCA).The top 5 principal components of PCA were used as the new variables,and modeling by fisher linear discrimination,Bayes multi-types stepwise discrimination,fuzzy pattern recognition,back-propagation artificial neural network(ANN-BP) and support vector machine(SVM) algorithms.Then,the 40 unknown samples in the prediction set were predicted,and the result showed that the discriminating accuracy rate was 77.5% with the methods of fisher linear discrimination,80.0% with the method of Bayes multi-types stepwise discrimination and fuzzy pattern recognition,82.5% with the method of BP-ANN model,and 85.0% with the method of SVM model.Therefore,the feasibility of assessment the cadmium pollution of soil in rapid and non-invasive way by hyperspectra technology was proved,and PCA combined with SVM was confirmed as a preference method. |
| [8] | . Soil contamination by heavy metals is an increasingly important problem worldwide. Quick and reliable access to heavy metal concentration data is crucial for soil monitoring and remediation. Visible and near-infrared reflectance spectroscopy, which is known as a noninvasive, cost-effective, and environmentally friendly technique, has potential for the simultaneous estimation of the various heavy metal concentrations in soil. Moreover, it provides a valid alternative method for the estimation of heavy metal concentrations over large areas and long periods of time. This paper reviews the state of the art and presents the mechanisms, data, and methods for the estimation of heavy metal concentrations by the use of visible and near-infrared reflectance spectroscopy. The challenges facing the application of hyperspectral images in mapping soil contamination over large areas are also discussed. (C) 2014 Elsevier B.V. All rights reserved. |
| [9] | . <p>���ø߹���ң�����ݽ������Ͼ����������ؽ���Ԫ��Ǧ�ĺ������ݣ����ڸ߹������ݲ����ڶ࣬����ѡ���任������Ҫ���Ƚ��˻��ڴ�̰����ǰ��ѡ��ģ�͵���С�Ƕ���Ϻͻ����Ŵ��㷨���в���ѡ�����С���˺�ƫ��С������ϣ�������ֻ����Ŵ��㷨��ƫ��С���˷��ݽ������ȫ���ε�ƫ��С���ˣ���������ѡ���ڸ߹������ؽ�����������ġ����ܲ�ȡ�˲���ѡ���ĸ������ڷ���ʱ���ܴﵽ70�����ϵ�ѵ�����ȣ������Ŵ��㷨�����Ľ�ռ䷶Χ�����㣬ʹ�û����Ŵ��㷨��ƫ��С��������ǰ��ѡ��ģ�͵���С�Ƕ���ϡ���Ƚ��˻����Ŵ��㷨����ͨ��С���˺�ƫ��С������ϣ��������ƫ��С���˸��ţ�����ڸ߹������ؽ����������У�ƫ��С���˾��Ƚϸߣ����ڲ���ѡ���У��Ŵ��㷨���š���</p> . <p>���ø߹���ң�����ݽ������Ͼ����������ؽ���Ԫ��Ǧ�ĺ������ݣ����ڸ߹������ݲ����ڶ࣬����ѡ���任������Ҫ���Ƚ��˻��ڴ�̰����ǰ��ѡ��ģ�͵���С�Ƕ���Ϻͻ����Ŵ��㷨���в���ѡ�����С���˺�ƫ��С������ϣ�������ֻ����Ŵ��㷨��ƫ��С���˷��ݽ������ȫ���ε�ƫ��С���ˣ���������ѡ���ڸ߹������ؽ�����������ġ����ܲ�ȡ�˲���ѡ���ĸ������ڷ���ʱ���ܴﵽ70�����ϵ�ѵ�����ȣ������Ŵ��㷨�����Ľ�ռ䷶Χ�����㣬ʹ�û����Ŵ��㷨��ƫ��С��������ǰ��ѡ��ģ�͵���С�Ƕ���ϡ���Ƚ��˻����Ŵ��㷨����ͨ��С���˺�ƫ��С������ϣ��������ƫ��С���˸��ţ�����ڸ߹������ؽ����������У�ƫ��С���˾��Ƚϸߣ����ڲ���ѡ���У��Ŵ��㷨���š���</p> |
| [10] | . Heavy metals contaminated soils and water will become a major environmental issue in the mining areas. This paper intends to use field hyper-spectra to estimate the heavy metals in the soil and water in Wan-sheng mining area in Chongqing. With analyzing the spectra of soil and water, the spectral features deriving from the spectral of the soils and water can be found to build the models between these features and the contents of Al, Cu and Cr in the soil and water by using the Stepwise Multiple Linear Regression (SMLR). The spectral features of Al are: 48002nm, 50002nm, 56502nm, 61002nm, 68002nm, 75002nm, 100002nm, 143002nm, 175502nm, 188702nm, 192002nm, 195002nm, 221002nm, 226002nm; The spectral features of Cu are: 48002nm, 50002nm, 61002nm, 75002nm, 86002nm, 130002nm, 143002nm, 192002nm, 215002nm, 226002nm; And the spectral features of Cr are: 48002nm, 50002nm, 61002nm, 71502nm, 75002nm, 86002nm, 130002nm, 143002nm, 175502nm, 192002nm, 195002nm. With these features, the best models to estimate the heavy metals in the study area were built according to the maximal R 2 . The R 2 of the models of estimating Al, Cu and Cr in the soil and water are 0.813, 0.638, 0.604 and 0.742, 0.584, 0.513 respectively. And the gradient maps of these three types of heavy metals�� concentrations can be created by using the Inverse distance weighted (IDW).The gradient maps indicate that the heavy metals in the soil have similar patterns, but in the North-west of the streams in the study area, the contents are of great differences. These results show that it is feasible to predict contaminated heavy metals in the soils and streams due to mining activities by using the rapid and cost-effective field spectroscopy. |
| [11] | . Heavy metal contamination from anthropogenic sources is a threat to human health. To assess the feasibility of predicting surface soil arsenic (As) concentration from hyperspectral reflectance measurement, three different regression algorithms are compared in this paper, i.e., multiple linear regression (MLR), partial least squares regression (PLSR), and adaptive neural fuzzy inference system (ANFIS) modeling. Soil samples were taken from three study sites in mining/agricultural areas after reclamation. As concentration was determined by hydride generation atomic fluorescence spectrometry (HG-AFS) analysis, and the reflectance was measured with an analytical spectral devices (ASD) field spectrometer covering the spectral region of 350-2500 nm. First, after preprocessing of the original reflectance spectroscopy, the correlation coefficients between the As concentration and spectral reflectance measurement were derived. Characteristic bands were then chosen for the quantitative retrieval model. Finally, all of the 30 samples were divided into a calibration set and a validation set of 18 and 12 samples, respectively. When compared with the MLR and PLSR algorithms, the ANFIS model was the best retrieval model, with a coefficient of determination (R-2) of 0.94 and a root-mean-square error (RMSE) of 0.88. ANFIS model and reflectance spectroscopy therefore have the potential to map the spatial distribution of As abundance, with the aim of improving public health. |
| [12] | . ABSTRACT During the past decades, large amounts of diffuse cadmium (Cd) and zinc (Zn) contaminated soil material have been deposited in the floodplains of the river Rhine in the Netherlands. As spatial information on soil quality is required at different scale levels covering the whole area, characterisation exclusively based on soil sampling and analysis is time-consuming and very expensive. A quicker method is developed based on a multivariate calibration procedure using partial least squares (PLS) regression to establish a relationship between reflectance spectra in the visible�Cnear-infrared (VNIR) region and spec-trally active soil characteristics (organic matter and clay content) that are inter-correlated with concentration levels of Cd and Zn. Several spectral pre-processing methods (normalisation, multiplicative scatter correction (MSC), derivation, standard normal variate (SNV) transform) were employed to improve the robustness and performance of the calibration models. No pre-processing gave the best results for Cd and Zn with RMSECV equal to 0.676 and 80.97 mg kg 611 , respectively. Application of the calibration models for soil quality characterisation in river floodplains is promising. The future possibilities of multi-variate calibration and pre-processing in remote sensing have to be explored. 08 2001 Elsevier Science B.V. All rights reserved. |
| [13] | . <h2 class="secHeading" id="section_abstract">Abstract</h2><p id="">Due to rapid economic development, high levels of potentially harmful elements are continuously being released into the suburban soils of the Nanjing area, China. Conventional methods for investigating soil potentially harmful element contamination based on raster sampling and chemical analysis are time consuming and relatively expensive. Reflectance spectroscopy within the visible-near-infrared region has been widely used to predict soil constituents due to its rapidity, convenience and accuracy. The objective of this study was to examine the possibility of using soil reflectance spectra as a rapid method to simultaneously assess contaminant metals (Ni, Cr, Cu, Hg, Pb, Zn) and As in the suburban soils of the Nanjing area. One hundred and twenty soil samples were collected for chemical analyses and spectral measurements. Prediction of contaminant elements was achieved by a partial least-square regression (PLSR) approach. According to their relationships with Fe, the seven contaminant elements could be categorized into two groups. The results showed that the prediction accuracy for Group II (Ni, Cr, Cu and Hg) was higher than that for Group I (Pb, Zn and As). This finding was consistent with the fact that the correlation coefficients between Group II and Fe were higher than that between Group I and Fe. It was concluded that element-sorption by spectrally active Fe oxides was the major mechanism by which to predict spectrally featureless contaminant elements. This conclusion was strengthened by the fact that the PLSR regression coefficients, which revealed the most important wavelengths for prediction, were attributed to absorption features of Fe oxides. Future study with real remote sensing data and field measurements are strongly recommended.</p> |
| [14] | . The development of rapid techniques, such as hyperspectral spectrophotometry, for investigating arsenic (As) soil contamination could be of great value with respect to conventional methods. This study was conducted to detect As concentrations in artificially polluted soils (from 25 to 1045 mg kg(-1)) through hyperspectral visible-near infrared spectrophotometry and to compare two multivariate statistical regression analyses: partial least squares and support vector machines. The correlation coefficient r is greater in the partial least squares in both model (0.93%) and test (0.87%) with respect to support vector machines (0.88% for the model and 0.82% for the test). The most important model variables extracted from the variable importance in projection scores resulted the absorption peaks at 580, 660, 715, and 780 nm. Bands in the visible spectra are not directly associated to As, but the metalloid can interact with the main spectrally active components of soil permitting to multivariate statistical models to screen As concentrations. |
| [15] | . A generalized dynamic fuzzy neural network (GDFNN) was created to estimate heavy metal concentrations in rice by integrating spectral indices and environmental parameters. Hyperspectral data, environmental parameters, and heavy metal content were collected from field experiments with different levels of heavy metal pollution (Cu and Cd). Input variables used in the GDFNN model were derived from 10 variables acquired by gray relational analysis. The assessment models for Cd and Cu concentration employed five and six input variables, respectively. The results showed that the GDFNN for estimating Cu and Cd concentrations in rice performed well at prediction with a compact network structure using the training, validation, and testing sets (for Cu, fuzzy rules=9, R 2 greater than 0.75, and RMSE less than 2.5; for Cd, fuzzy rules=9, R 2 greater than 0.75, and RMSE less than 1.0). The final GDFNN model was then compared with a back-propagation (BP) neural network model, adaptive-network-based fuzzy interference systems (ANFIS), and a regression model. The accuracies of GDFNN model prediction were usually slightly better than those of the other three models. This demonstrates that the GDFNN model is more suitable for predicting heavy metal concentrations in rice. |
| [16] | ABSTRACT Remote sensing allows monitoring heavy metal pollution in crops for agricultural production and food security. This paper presents an approach to wavelet-fractal analysis for exploring a set of sensitive spectral parameters to monitor the heavy metal pollution levels in rice crops from hyperspectral reflectance data. Hyperspectral and biochemical data were collected from three study farms in Changchun, Jilin Province, China. Our study explored the fractal dimension of reflectance with wavelet transform (FDWT) that demonstrated a better performance than other existing methods. Our results obtained in this study show that the red edge position (REP) was the most sensitive indicator for monitoring the heavy metal pollution levels in rice crops among common indices. As compared with REP, the FDWT is more sensitive to biochemical composition, namely with respect to chlorophyll concentrations, N, Cu and Cd. The established linear models showed a correlation coefficient (R2) above 0.70, model efficiency (ME) above 0.65 and a root mean square error (RMSE) below 3.5. Minimum FDWT values occurred in rice with Level II pollution followed by Level I pollution, and finally the safe level. This study suggests that wavelet transform is well suited as a spectral analysis method to eliminate noise and amplify the stress information from heavy metals. The wavelet transform in conjunction with fractal analysis is promising for detecting heavy metal-induced stress in rice crops. |
| [17] | . Accurate detection of heavy metal-induced stress on the growth of crops is essential for agricultural ecological environment and food security. This study focuses on exploring singularity parameters as indicators for a crop's Zn stress level assessment by applying wavelet analysis to the hyperspectral reflectance. The field in which the experiment was conducted is located in the Changchun City, Jilin Province, China. The hyperspectral and biochemistry data from four crops growing in Zn contaminated soils: rice, maize, soybean and cabbage were collected. We performed a wavelet transform to the hyperspectral reflectance (350-1300 nm), and explored three categories of singularity parameters as indicators of crop Zn stress, including singularity range ( S), singularity amplitude ( S) and a Lipschitz exponent ( ). The results indicated that (i) the wavelet coefficient of the fifth decomposition level by applying Daubechies 5 (db5) mother wavelets proved successful for identifying crop Zn stress; the Sof crop concentrated on the region was around 550-850 nm of the spectral signal under Zn stress; (ii) the Sstabilized, but Sand had developed some variations at the growth stages of the crop; (iii) the S, Sand were found among four crop species differentially; and moreover the Sincreased in relation to an increase in the Sof crop species; (iv) the had a strong non-linear relationship with the Zn concentration ( R:0.7601-0.9451); the Shad a strong linear relationship with Zn concentration ( R:0.5141-0.8281). Singularity parameters can be used as indicators for a crop's Zn stress level as well as offer a quantitative analysis of the singularity of spectrum signal. The wavelet transform technique has been shown to be very promising in detecting crops with heavy metal stress. |
| [18] | . In order to monitor the accumulation of heavy metals effectively and avoid the damage to the health of agricultural soils, a promising approach is to predict low concentrations of heavy metals in soils using visible and near-infrared (VNIR) reflectance spectroscopy coupled with calibration techniques. This study aimed to (i) compare the performance of a combination of partial least squares regression with genetic algorithm (GA-PLSR) against a general PLSR for predicting low concentrations of four heavy metals (i.e., As, Pb, Zn and Cu) in agricultural soils; (ii) explore the transferability of GA-PLSR models defined on one subset of land-use types to the other types; and (iii) to investigate the predictive mechanism for the prediction of the metals. One hundred soil samples were collected in the field locating at Yixing in China, and VNIR reflectance (350-2500 nm) spectra were measured in a laboratory. With the entire soil samples, GA-PLSR and PLSR models were calibrated for the four heavy metals using a leave-one-out cross-validation procedure. The GA-PLSR models achieved better cross-validated accuracies than the PLSR models. For the transferability of GA-PLSR models, the soil samples were divided into three pairs of training sets and test sets from different land-use types. Three GA-PLSR models defined on the training sets had good transferability to the test sets, but nine GA-PLSR models were not successful. As for the predictive mechanism, besides the widely-used correlation analysis between OM and the metals, the relationship between the content of OM and the prediction accuracy of the metals was investigated and the similarity of the important wavelengths for OM and the metals was compared. The three methods verified that OM had a significant correlation with the predictions of the spectrally-featureless metals (Pb, Zn and Cu) from VNIR reflectance. We conclude that GA-PLSR modeling has a better capability for the prediction of the low heavy metal concentrations from VNIR reflectance, and it has a potential of transferability between different land-use types, and its accuracy is fundamentally influenced by OM. (C) 2013 Elsevier B.V. All rights reserved. |
| [19] | . ��ɽ�����ձ���������ؽ�����Ⱦ���⣬��Ч�Ľ���β����ũ�������ؽ���������������ü�ޡ���������ѳǿ���β��Ϊ�о������ɼ��������������������ɼ����������ף����Է�������ͭԪ�غ�������Isomap��Isometrio mapping����LLE��locally linear embedding������ѧϰ����Ӧ���������߹���ά���������ɭ�ֹ�������ģ�ͣ���������ͭ�����������������ά��ĸ߹������ݷ��ݾ��ȸ��ߣ�Isomap��ά��ģ��Ԥ�������������Ϊ30.50��R2=0.76������LLE��ά������о�Ϊβ��������CuԪ�غ����Ŀ��ٷ��ݹ����ṩ���������ݡ� . ��ɽ�����ձ���������ؽ�����Ⱦ���⣬��Ч�Ľ���β����ũ�������ؽ���������������ü�ޡ���������ѳǿ���β��Ϊ�о������ɼ��������������������ɼ����������ף����Է�������ͭԪ�غ�������Isomap��Isometrio mapping����LLE��locally linear embedding������ѧϰ����Ӧ���������߹���ά���������ɭ�ֹ�������ģ�ͣ���������ͭ�����������������ά��ĸ߹������ݷ��ݾ��ȸ��ߣ�Isomap��ά��ģ��Ԥ�������������Ϊ30.50��R2=0.76������LLE��ά������о�Ϊβ��������CuԪ�غ����Ŀ��ٷ��ݹ����ṩ���������ݡ� |
| [20] | . The development and formation of chemical elements in soil are affected not only by parent material, climate, biology and topology factors, but also by human activities. The pollution sources of heavy metals in the environment are mainly derived from anthropogenic sources, and heavy metal elements in soil have been considered to be powerful tracers for monitoring the impacts of human activities. The present study attempts to analyze whether and how a connection can be made between macroscopical control and microcosmic analysis, to estimate the impacts of human activities on heavy metals in soil, and to determine a way to describe the spatial relationship between heavy metals in soil and human activities, by means of landscape geochemical theories and methods. In addition, the disturbances of human activities on Zn, Cr, Cu, Pb, Hg, Cd, Ni and Ag are explored through the analysis of the spatial relationship between human disturbed landscapes and element anomalies, thereby determining the diversified rules of the effects. The study results show that the rules of different landscapes influencing heavy metal elements are diversified, and that the Zn, Ni, Pb, Hg and Ag elements are closely related with city landscapes, but Cu and Cd are not significantly affected by city landscapes; furthermore, the elements Ni, Pb, Hg, Ag and Cd are shown to be closely related with river landscapes, while evidently Zn is not affected by river landscapes; the relationships between mine landscapes and the elements Cr, Cu, Pb, Ni and Hg are apparent, among which Zn is not included; the relationships between the elements Zn, Cr, Cu, Pb, Hg, Cd, Ni and Ag and road landscapes are quite close, which shows that road landscapes have significant effects on these elements. Therefore, the conclusion is drawn that the response mechanism analysis of-human disturbance and soil chemical element aggregation is feasible, based on the landscape geochemical theories and methods. The results of the study provide the possibility for applying spatial information techniques, such as remote sensing and geographic information systems, to study chemical elements in soil, thereby realizing the effective combination of macroscopic spatial information and microscopic mechanism of soil element migration research. (C) 2014 Elsevier B.V. All rights reserved. |
| [21] | . The present paper aims to map pollution and assess the risk for agricultural soils in a wider lignite opencast mining and industrial area. Geochemical data related to environmental studies show that the waste characteristics favor solubilization and mobilization of inorganic contaminants and in some cases the generation of acidic leachates.<br/>The spatiotemporal distribution of soil contamination is studied by the application of the Bayesian Maximum Entropy (BME) theory which allows merging spatial and temporal estimations in a single model.<br/>Results reveal a correlation range of contaminant concentrations up to 5000 m and indicate a potential forecasting range up to 4 years. Inspection of the produced spatiotemporal maps indicates that the whole study area is contaminated by As and various heavy metals, a situation which seems to be more or less stable over time. (C) 2012 Elsevier B.V. All rights reserved. |
| [22] | . ABSTRACT Soil heavy metal concentrations exhibit significant space-time trends due to their accumulation along the time axis and the varying distances from the pollution sources. Thus, concentration trends cannot be ignored when performing spatiotemporal soil heavy metal predictions in an area. In this work, datasets were used of soil cadmium (Cd) concentrations in the Qingshan district (Wuhan City, Hubei Province, China) sampled during the period 2010-2014. Spatiotemporal Kriging with four Trend models (STKT) and non-separable space-time correlation was implemented to assimilate multi-temporal data in the mapping of Cd distribution within the contaminated soil area. Soil Cd trends were represented by four different space-time polynomial functions, and a non-separable power function-exponential variogram model of Cd distribution was assumed. Plots of the predicted space-time Cd distributions revealed a marked tendency of the Cd concentrations over time to spread from the southwest part to the entire study area (higher soil Cd concentrations are found in the southwest part of the Qingshan area, whereas the temporal Cd trend is characterized by a constant increase from 2010 to 2014). Thus, the maps indicate that the entire study area is contaminated by Cd, a situation that seems to be stable over time. STKT can reduce prediction errors in practically and statistically significant ways. A numerical comparison of the STKT technique vs. the mainstream Spatiotemporal Ordinary Kriging (STOK) technique showed that STKT can perform better than STOK when the trend model's goodness of fit to the Cd data was satisfactory (producing minimal data fit error statistics), implying that adequate trend modeling is a key issue for space-time prediction accuracy purposes. In particular, quantitative results obtained at the Qingshan region showed that, by incorporating local Cd values and distance-based dependence structures the STKT techniques produced the best prediction error statistics, resulting in considerable prediction error reductions (the level of which depend on the trend model specification; e.g., in the case of STKT with trend model 3 the improvement comparing to STOK was almost 30%). Future studies of Cd contamination in the region (sampling design optimization) can benefit from the results of the geostatistical analysis of the present paper (variogram and trend modeling, etc.). |
| [23] | . <p>With rapid economic and social development, soil contamination arising from heavy metals has become a serious problem in many parts of China. We collected a total of 445 samples (0-20 cm) at the nodes of a 2 km��2 km grid in surface soils of Rizhao city, and analyzed sources and risk pattern of 10 heavy metals (As, Cd, Co, Cr, Cu, Hg, Mn, Ni, Pb and Zn). The combination of Multivariate statistics analysis and Geostatistical methods was applied to identify the sources and hazardous risk of heavy metals in soils. The result indicated that Cr, Ni, Co, Mn, Cu, and As were mainly controlled by parent materials and came from natural sources. Cd and Hg originated from anthropogenic sources. Pb and Zn, belonging to different groups in multivariate analysis, were associated with joint effect of parent materials and human inputs. Ordinary Kriging and Indicator Kriging suggested that single element and elements association from the same principal components had similar spatial distribution. Through comprehensive assessment on all elements, we also found the high risk areas were located in the populated urban areas and western study area, which could be attributed to the higher geological background in the western part and strong human interference in the eastern part.</p> |
| [24] | . . |
| [25] | . Ϊ�˶������������ؽ���������Ӱ�����أ��Գ�ɳ�ǽ�ũ������Pb��CdΪ�������ô�ͳ�ع�ģ�ͣ�ordinary least squares, OLS���͵�����Ȩ�ع�ģ�ͣ�geographically weighted regression, GWR�������Ƚ�������Pb��Cd������Ӱ�����ؼ����ع�ϵ�������������ɳ�ǽ�ũ������Pb��Cd�������ڿռ�������ԣ�Pb��Cd��GWRģ����϶Ƚ�OLSģ�ߣ��в���ڿռ�����أ�GWRģ���ܸ��õؽ�������Pb��Cd��Ӱ�����ر����Ŀռ������ԡ�����Pb��Cd�����ʼ���������أ�����pHֵ���л��ʡ���������Ӱ������Pb��Cd��������Ҫ���أ�����������������õصľ�����ڳǽ�ũ������Pb��Cd����Ҳ��һ��Ӱ�죬����Pb��Cd��"��-��"������������Pb��Cd�����ߵ�����Pb��Cd�����ߵ�������������Χ����������Pb��Cd����ˮƽ�ϸߣ��ҿռ����̶Ƚ�С��������������������õؽϽ���ũ����Pb��Cd��Ⱦ���շ��ص��ص������о���Ϊ�����������������ؽ��������Ŀռ�ṹ��Ӱ�������ṩ�ο���Ϊ��ɳ�ǽ�ũ�������ؽ�����Ⱦ�ķ����ṩ�ο��� . Ϊ�˶������������ؽ���������Ӱ�����أ��Գ�ɳ�ǽ�ũ������Pb��CdΪ�������ô�ͳ�ع�ģ�ͣ�ordinary least squares, OLS���͵�����Ȩ�ع�ģ�ͣ�geographically weighted regression, GWR�������Ƚ�������Pb��Cd������Ӱ�����ؼ����ع�ϵ�������������ɳ�ǽ�ũ������Pb��Cd�������ڿռ�������ԣ�Pb��Cd��GWRģ����϶Ƚ�OLSģ�ߣ��в���ڿռ�����أ�GWRģ���ܸ��õؽ�������Pb��Cd��Ӱ�����ر����Ŀռ������ԡ�����Pb��Cd�����ʼ���������أ�����pHֵ���л��ʡ���������Ӱ������Pb��Cd��������Ҫ���أ�����������������õصľ�����ڳǽ�ũ������Pb��Cd����Ҳ��һ��Ӱ�죬����Pb��Cd��"��-��"������������Pb��Cd�����ߵ�����Pb��Cd�����ߵ�������������Χ����������Pb��Cd����ˮƽ�ϸߣ��ҿռ����̶Ƚ�С��������������������õؽϽ���ũ����Pb��Cd��Ⱦ���շ��ص��ص������о���Ϊ�����������������ؽ��������Ŀռ�ṹ��Ӱ�������ṩ�ο���Ϊ��ɳ�ǽ�ũ�������ؽ�����Ⱦ�ķ����ṩ�ο��� |
| [26] | . �����ؽ�����������̬����������ʱ��Ϳռ��Ͼ����������Ժͱ����ԣ���Ŀǰ���о�������������ʱ��ά�ı��졣Ϊ����Ԥ��ʱʹ�ö�ʱ�ڲ������ݣ��������ʹ��ʱ�տ�����������ؽ�������ʱ�ս�ģ��Ԥ�⣬���ؽ����˾���뷽��ֵ�ļ��㡢���۱���ģ�͵���ʽ��������ϡ�ʱ�տ�����ֵ�㷨����ֵ����;������ڽ��������ı仯��ʱ�տ������ͼ�����人����ɽ�������ؽ���Ϊ��������ʱ�տ����ģ��Ԥ������̡����������ʱ�տ�����ܹ��ܺõ����������ؽ����ڿռ䡢ʱ���ʱ����3�����ֵı����������ܹ���������ʱ�ڵ����ݶ�Ԥ��ʱ�������Խ��в�ֵ������ʱ�ڵ����Կռ�ֲ�ͼ�ܹ��ܺõط�ӳ�����ؽ����ķֲ��仯���ɡ����о���Ϊ��Դ������̬ʱ�ս�ģ��Ԥ���о��ṩ�ο��� . �����ؽ�����������̬����������ʱ��Ϳռ��Ͼ����������Ժͱ����ԣ���Ŀǰ���о�������������ʱ��ά�ı��졣Ϊ����Ԥ��ʱʹ�ö�ʱ�ڲ������ݣ��������ʹ��ʱ�տ�����������ؽ�������ʱ�ս�ģ��Ԥ�⣬���ؽ����˾���뷽��ֵ�ļ��㡢���۱���ģ�͵���ʽ��������ϡ�ʱ�տ�����ֵ�㷨����ֵ����;������ڽ��������ı仯��ʱ�տ������ͼ�����人����ɽ�������ؽ���Ϊ��������ʱ�տ����ģ��Ԥ������̡����������ʱ�տ�����ܹ��ܺõ����������ؽ����ڿռ䡢ʱ���ʱ����3�����ֵı����������ܹ���������ʱ�ڵ����ݶ�Ԥ��ʱ�������Խ��в�ֵ������ʱ�ڵ����Կռ�ֲ�ͼ�ܹ��ܺõط�ӳ�����ؽ����ķֲ��仯���ɡ����о���Ϊ��Դ������̬ʱ�ս�ģ��Ԥ���о��ṩ�ο��� |
| [27] | . Soil contamination is an ever-growing concern and demands efficient methods for diagnosis of areas under suspected contamination. Spectroscopy reflectance vis-NIR has been shown to be a reliable and environmentally friendly method for the rapid detection and monitoring of soil properties. Despite the use of vis-NIR it is necessary to test the effectiveness of other wavelengths (mid-IR 4000-400 cm(-1)). We aim with this study to (1) evaluate the contamination of Cr applied by tannery sludge and CrCl3 center dot 6H(2)O in tropical soils through sequential extraction procedures and spectroscopy techniques; (2) identify parameters of soil spectral variation (vis-NIR-mid) associated with Cr and explore their viability in the evaluation of contaminated soils; and (3) investigate the feasibility of using soil spectral data and chemometrics methods to predict Cr in soils. Results indicate that metal adsorption to soil constituents caused expressive changes in soil spectral curves, showing differentiation between highly contaminated soils and those that are relatively contaminant-free. Cr content can be predicted by spectroscopy reflectance in vis-NIR-mid data. The mid-IR models of Cr outperformed vis-NIR. Organic matter played a more important role in determining soil spectral signatures than the mineralogical characteristics of soils, especially in those with high organic carbon content. |
| [28] | . This study explored the spatial pattern of heavy metals in Beijing agricultural soils using Moran's I statistic of spatial autocorrelation. The global Moran's I result showed that the spatial dependence of Cr, Ni, Zn, and Hg changed with different spatial weight matrixes, and they had significant and positive global spatial correlations based on distance weight. The spatial dependence of the four metals was scale-dependent on distance, but these scale effects existed within a threshold distance of 13 km, 32 km, 50 km, and 29 km, respectively for Cr, Ni, Zn, and Hg. The maximal spatial positive correlation range was 57 km, 70 km, 57 km, and 55 km for Cr, Ni, Zn, and Hg, respectively and these were not affected by sampling density. Local spatial autocorrelation analysis detected the locations of spatial clusters and spatial outliers and revealed that the pollution of these four metals occurred in significant High-high spatial clusters, Low-high, or even High-low spatial outliers. Thus, three major areas were identified and should be receiving more attention: the first was the northeast region of Beijing, where Cr, Zn, Ni, and Hg had significant increases. The second was the southeast region of Beijing where wastewater irrigation had strongly changed the content of metals, particularly of Cr and Zn, in soils. The third area was the urban fringe around city, where Hg showed a significant increase. |
| [29] | . Heavy metal contamination in crops is a worldwide problem that requires accurate and timely monitoring. This study is aimed at improving the accuracy of monitoring heavy metal stress levels in rice utilizing remote sensing data. An assimilation framework based on remote sensing and improved crop growth model was developed to continuously monitor heavy metal stress levels over the entire period of crop growth based on the growth law of crops and the stress mechanism. Compared with other physiological indices, dry weight of rice roots (WRT) was selected as the best indicator to estimate heavy metal stress levels. The World Food Study (WOFOST) model, widely used for the description of crop growth, was improved by incorporating stress factors with overall consideration for the changes in physiological status under heavy metal stress. Three scenarios were put forward based on the stress factors f DTGA and f CVF , which, respectively, correspond to the daily total gross assimilation of CO 2 and carbohydrate-to-dry matter conversion coefficient, and were analyzed for their efficiency of simulating WRT. A method of assimilating the leaf area index (LAI) retrieved from remotely sensed data into the improved WOFOST model was applied to optimize f DTGA and f CVF . The results suggested that the scenario using both factors can simulate WRT under heavy metal stress more accurately, with a relative percent error (RPE) lower than 14%. Based on the RS-WOFOST assimilation framework, continuous spatial-temporal evaluation of heavy metal stress levels based on WRT can be accomplished. |
| [30] | . <h2 class="secHeading" id="section_abstract">Abstract</h2><p id="">Open-focused microwave-assisted extraction and ICP-OES determination of As, Cd, Cr, Cu, Fe, Mn, Ni, Pb and Zn from surface sediments of the estuary of Bilbao (Basque Country, North of Spain) was carried out. All the samples were collected at three different tributaries of the estuary (Asua, Galindo and Nerbioi-Ibaizabal) every two months during 1999. The digestion procedure was proposed from the conclusions of a fractionated factorial design, and the precision and accuracy of the method was verified using a certified reference sediment (RTC008-050). The results of the analysis were statistically treated by means of principal component analysis and correlation analysis. The principal component analysis of sediment data (32 samples × 9 metals) indicated different patterns of contamination regarding the tributary and sampling station. The two main patterns observed were a steady increment of the metal concentration along all the campaigns in the samples collected in the Galindo River and a seasonal variation in the Nerbioi-Ibaizabal River, with higher metallic content during summertime and lower content during wintertime.</p> |
| [31] | . Abstract included in text. |
| [32] | . This study aimed at comparing the effectiveness of the global aspatial multiple linear regression (MLR) using ordinary least squares (OLS) and local spatial geographically weighted regression (GWR) for producing a map showing the spatial variations in soil organic carbon (SOC) in Amman-Zarqa Basin (about 3,583km 2 )��a typical semi-arid watershed in Jordan��using Landsat Thematic Mapper (TM) data. After normalizing the SOC data (the dependent variable) using Box-Cox power transformation and removing the multicollinearity of TM bands 1 to 5 and 7 (the independent variables) by applying principal component analysis, both regression techniques developed maximum likelihood best linear unbiased estimators in which the residuals had close-to-normal and random independent distributions with almost common variances and close-to-zero means. However, the GWR model had smaller Akaike��s information criterion (corrected) (AIC c ) (2,534.0 versus 2,560.5), larger adjusted multiple coefficient of determination \( \left({\overline{\mathbf{\mathcal{R}}}}^2\right) \) (0.31 versus 0.22), and larger Pearson��s product moment correlation coefficient ( r ) between measured and observed values (0.63 versus 0.51). Thus, applying map algebra using the developed GWR model generated a raster map with 3065��6530m 2 cell size. The map showed that SOC composition to 20cm depth varied from 3.5 to 85.0 metric tons per hectare (ton/ha) with a mean and standard deviation of about 23.9 and 9.3ton/ha, respectively. The spatial pattern of surface SOC reflected partly the spatial variability of land cover and agricultural management practices in the basin. The results demonstrate the potential and superiority of GWR over MLR as a practical tool for conducting further spatial and temporal analyses of SOC stocks and implementing best land management practices in semi-arid environments using TM data. |
| [33] | . ABSTRACT Accurately mapping the spatial distribution of soil total nitrogen is important to precision agriculture and environmental management. Geostatistical methods have been frequently used for predictive mapping of soil properties. Recently, a local regression method, geographically weighted regression (GWR), got the attention of environmentalists as an alternative in spatial modeling of environmental attributes, due to its capability of incorporating various auxiliary variables with spatially varied correlation coefficients. The objective of this study is to compare GWR and ordinary cokriging (OCK) in predictive mapping of soil total nitrogen (TN) using multiple environmental variables. 353 soil Samples within the surface horizon of 0-20 cm in a study area were collected, and their TN contents were measured for calibrating and validating the GWR and OCK interpolations. The environmental variables finally chosen as auxiliary data include elevation, land use types, and soil types. Results indicate that, although OCK is slightly better than GWR in global accuracy of soil TN prediction (the adjusted R2 for GWR and OCK are 0.5746 and 0.6858, respectively), the soil TN map interpolated by GWR shows many details reflecting the spatial variations of major auxiliary variables while OCK smoothes out almost all local details. Geographically weighted regression could account for both the spatial trend and local variations, whilst OCK had difficulties to capture local variations. It is concluded that GWR is a more promising spatial interpolation method compared to OCK in predicting soil TN and potentially other soil properties, if a suitable set of auxiliary variables are available and selected. |
| [34] | . The spatial information of soil organic matter (SOM) is crucial for precision agriculture and environmental modeling. It is, however, difficult to obtain the regional details of SOM by dense sampling due to the high cost. Although a variety of interpolation methods are available for mapping SOM at regional scales, accurate prediction usually needs densely distributed samples and requires the interpolated variable to meet some constraints such as spatial stationarity. This paper introduces the Geographically Weighted Regression (GWR) technique as an alternative approach for SOM mapping. We interpolated the spatial distribution of SOM based on a limited number of samples with the incorporation of multiple independent variables. We also compared GWR with the ordinary least squares regression approach in mapping SOM. Results indicated that GWR could capture more local details and improve the prediction accuracy. However, more attention should be paid to the selection of independent variables. |
| [35] | . �߹���ң�м����ѳ�Ϊ��ǰң�������ǰ�ؼ���������߷ֱ��ʵ��� �㣬�����õ��ﷴ����������������ݵ����������ѧ���ʡ�Ŀǰ�������������������ܵ���ע�������ؽ�����������������������ȫ������أ����������߹���ң �м����о���ע���������л��ɷ�������̼���Ĺ�����ģ�ͣ��������ؽ��������ĸ߹������о��ձ���١������ؽ�����Ⱦ�Ѿ���ΪӰ������������ȫ�Ĺؼ��� �أ��������ؽ�����������ȾԪ���ղ��ǵ���֮������ͳ�����ؽ����IJ��Է���Ҫ�������ϸߣ��������ڽϳ�����ͼ���������߹�����������Ԫ�أ�ICP-MS�� ��������֮��Ķ���Ԥ��ģ�ͣ���ʵ��������Ԫ�صĿ���ȷԤ�⡣�ɼ�������������Ʒ135������������Ʒ��350��2500 nm�Ĺ������ʽ��е������������ֵ����ֱ任��ɸѡ���������ܸ��������еĹ��ײ��Σ�����ø���������Ԫ�ظ߹������Ż�ģ�͡��о�������������� �������ܸ������й��ײ���Ϊ���ɼ���520��530 nm�ͽ�����1440��1450��2010��2020��2230��2240 nm�����ȴ����������ܸ�-�߹����ݵ��Ż�ģ��Ϊ��y��120��768e-7��037x�����ϵ��RΪ0��568�����������Ϊ0��619��g��g- 1���������ϵ��RΪ0��484�����������Ϊ1��426��g��g-1������ģ�Ϳ������ڸ��ݵ�������ȫ���Ĺ����ټ�⡣ . �߹���ң�м����ѳ�Ϊ��ǰң�������ǰ�ؼ���������߷ֱ��ʵ��� �㣬�����õ��ﷴ����������������ݵ����������ѧ���ʡ�Ŀǰ�������������������ܵ���ע�������ؽ�����������������������ȫ������أ����������߹���ң �м����о���ע���������л��ɷ�������̼���Ĺ�����ģ�ͣ��������ؽ��������ĸ߹������о��ձ���١������ؽ�����Ⱦ�Ѿ���ΪӰ������������ȫ�Ĺؼ��� �أ��������ؽ�����������ȾԪ���ղ��ǵ���֮������ͳ�����ؽ����IJ��Է���Ҫ�������ϸߣ��������ڽϳ�����ͼ���������߹�����������Ԫ�أ�ICP-MS�� ��������֮��Ķ���Ԥ��ģ�ͣ���ʵ��������Ԫ�صĿ���ȷԤ�⡣�ɼ�������������Ʒ135������������Ʒ��350��2500 nm�Ĺ������ʽ��е������������ֵ����ֱ任��ɸѡ���������ܸ��������еĹ��ײ��Σ�����ø���������Ԫ�ظ߹������Ż�ģ�͡��о�������������� �������ܸ������й��ײ���Ϊ���ɼ���520��530 nm�ͽ�����1440��1450��2010��2020��2230��2240 nm�����ȴ����������ܸ�-�߹����ݵ��Ż�ģ��Ϊ��y��120��768e-7��037x�����ϵ��RΪ0��568�����������Ϊ0��619��g��g- 1���������ϵ��RΪ0��484�����������Ϊ1��426��g��g-1������ģ�Ϳ������ڸ��ݵ�������ȫ���Ĺ����ټ�⡣ |
| [36] | ���Ͳ��ط�չΪ�����ӱ��ϻ��ء��ȴ�ˮ������ɫ��ҩ�������أ�����ũ�������¸���ʵ���ڹ������ε������°���Դ ��������ȴ��ִ�ũҵ����: ���Ϲ������ε����跢չ�滮��Ҫ���֮ʮ��[N]. �����ձ�. �л�������Ŀ���������ѧ���鱨�溣�ϵ�[R]. ����: ����ʡ���ʵ���Ժ ���Ͳ��ط�չΪ�����ӱ��ϻ��ء��ȴ�ˮ������ɫ��ҩ�������أ�����ũ�������¸���ʵ���ڹ������ε������°���Դ ��������ȴ��ִ�ũҵ����: ���Ϲ������ε����跢չ�滮��Ҫ���֮ʮ��[N]. �����ձ�. �л�������Ŀ���������ѧ���鱨�溣�ϵ�[R]. ����: ����ʡ���ʵ���Ժ |
| [37] | . ȷ�˽������л��ʵĿռ�ֲ��Ǻ���ʩ�ʵ���Ҫǰ�ᣬҲ��ˮ����ʧ���Ƽ�������������Ҫ�� ��������113�������л����������ݣ��Ժ��θ߶ȡ�������ʴǿ�ȡ��������á���ֲֵ��ָ����������������ŷ�Ͼ��롢��������ָ�����¶�Ϊ�ο����ӣ������� ����GWR��Geographically Weighted Regression��ģ��̽���������������µ������л��ʿռ�ֲ�����ͨ������ͨ���Իع飨ordinary least squares��OLS����Ƚϣ����˽�GWRģ�͵ľ��ȣ����������������л��ʵĿռ���ͼ����������ͼЧ�����������ۡ������������OLSģ���� �ȣ�GWRԤ��ģ��������������AIC��Akaike Information Criterion��ֵ���ϴ�̶ȵ����ģ�͵ľ���ϵ��������Ч�ؼ���ģ�͵Ļع�в�ֵ������ͼ������Ч������GWRģ�͵�Ԥ������ʵ��ֵ���Ǻϳ̶�Ҫ ����OLSģ�͡����»�������GWRģ�ͽ��лع�ʱ����������������ɸѡ�����Ӷ������ȷ����������Ӧ�����ۡ� . ȷ�˽������л��ʵĿռ�ֲ��Ǻ���ʩ�ʵ���Ҫǰ�ᣬҲ��ˮ����ʧ���Ƽ�������������Ҫ�� ��������113�������л����������ݣ��Ժ��θ߶ȡ�������ʴǿ�ȡ��������á���ֲֵ��ָ����������������ŷ�Ͼ��롢��������ָ�����¶�Ϊ�ο����ӣ������� ����GWR��Geographically Weighted Regression��ģ��̽���������������µ������л��ʿռ�ֲ�����ͨ������ͨ���Իع飨ordinary least squares��OLS����Ƚϣ����˽�GWRģ�͵ľ��ȣ����������������л��ʵĿռ���ͼ����������ͼЧ�����������ۡ������������OLSģ���� �ȣ�GWRԤ��ģ��������������AIC��Akaike Information Criterion��ֵ���ϴ�̶ȵ����ģ�͵ľ���ϵ��������Ч�ؼ���ģ�͵Ļع�в�ֵ������ͼ������Ч������GWRģ�͵�Ԥ������ʵ��ֵ���Ǻϳ̶�Ҫ ����OLSģ�͡����»�������GWRģ�ͽ��лع�ʱ����������������ɸѡ�����Ӷ������ȷ����������Ӧ�����ۡ� |
