 , 仲舒颖
, 仲舒颖Spatiotemporal variations in flowering duration of woody plants in China from 1963 to 2012
TAOZexing, ZHONGShuying通讯作者:
收稿日期:2016-07-29
修回日期:2016-11-8
网络出版日期:2017-01-20
版权声明:2017《地理学报》编辑部本文是开放获取期刊文献,在以下情况下可以自由使用:学术研究、学术交流、科研教学等,但不允许用于商业目的.
基金资助:
作者简介:
-->
展开
摘要
关键词:
Abstract
Keywords:
-->0
PDF (2180KB)元数据多维度评价相关文章收藏文章
本文引用格式导出EndNoteRisBibtex收藏本文-->
1 引言
植物达到一定年龄和体积时就获得了开花能力,进而可通过自主途径或适宜的环境条件诱导而开花[1]。植物的始花期、盛花期、末花期和花期长度的年际变化及影响因素是花期物候研究的主要内容[2]。花期变化影响植物的繁殖和进化,进而影响植物群落中的种间竞争和共生关系以及生态系统稳定性[3-4]。此外,花期物候研究对人类生活和健康有重要意义。很多植物的花在发育过程中,具有较高的观赏特性,因此近几十年来以赏花为主题的旅游活动在世界各地日益增多[5]。花期物候研究可为相应旅游活动的开展提供理论基础[6]。在园林布景方面,研究植物花的物候相变化可实现不同植物景观配置优化,提升园林的美学和观赏价值[7]。对产生致敏花粉的树木开展花期预报,能够有效的预防和控制花粉过敏症[8]。迄今为止,大量研究揭示了全球各地植物始花期的变化趋势。在加拿大,19种植物中有18种的始花期在2001-2012年呈提前态势,只有一种植物微弱推迟[9]。在美国东北部地区的72个站点中,有89%的站点丁香(Syringa chinensis)始花期在1965-2001年呈提前趋势[10]。欧洲地区,78%的展叶始期和始花期序列在1971-2000年间提前[11]。在中国也发现了相似的结果[12-13]。这些研究表明,虽然近几十年来植物始花期在各地区间的变化趋势不同,但变早仍是北半球始花期变化的主要特征。相对而言,关于花期长度变化趋势的研究仍较少,只有少量研究在个别区域开展了工作。例如,Dunne等[14]通过实验方法发现,美国科罗拉多州的亚高山草甸受融雪提前和增温的影响,早花植物的花期长度显著延长;?repin?ek等[15]发现,在斯洛文尼亚东北部地区,1994-2007年期间大多数品种的榛树(Corylus avellana)花期长度比气候相对较冷的1969-1979年期间更短;在中国的西双版纳地区,Zhao等[16]研究了多种热带植物的花期长度变化,发现在1973-1999年间不同植物的花期长度变化存在显著的差异。除此之外,大尺度的花期长度变化尚未见报道。
基于“中国物候观测网”观测数据,本文系统研究了1963-2012年中国42个站点23种木本植物的花期长度变化趋势,分析了花期长度变化的时空格局、种间差异及主要形式。研究结果可为理解气候变化背景下的花期长度变化提供依据,同时可为植物观赏旅游活动的开展和园林景观布置等提供理论基础。
2 数据与方法
2.1 物候与气象数据
本文选用的物候数据来源于“中国物候观测网”(China Phenological Observation Network, http://www.cpon.ac.cn/),时间段为1963-2012年。该网络的观测在1969-1972年和1997-2002年两个时段有所中断,以致各站点所记录的物候数据存在不同程度的缺失[17]。因此,在分析物候变化趋势前,首先需对物候数据进行筛选,以获得时间序列最为完整的资料。筛选标准如下:(1)所选的植物种应尽可能分布在更多的站点,以便于分析花期变化的时空格局。因此,本文将分布站点数量少于8个的物种剔除;
(2)计算物候变化的趋势要求物候期序列有一定的时间长度,否则计算出的趋势不具有代表性。在以往物候变化研究中,通常以15年作为标准[11, 18]。因此,本文将观测年数少于15年的开花始期和开花末期时间序列剔除。
经过以上筛选过程,最终满足条件的有23个物种(表1),分布在42个站点(图4),其中含17种乔木、5种灌木、1种藤本植物。因藤本植物只有1种,只在总体趋势中进行分析,而不进行生活型间的对比。综合所有站点和物种,开花始期和开花末期时间序列分别各有259条。在这些序列中,67.57%的序列起始年分布在1963-1970年之间,序列的结束年主要分布在1995-1996年和2010-2012年,分别占所有序列的30.89%和48.65%(图1a)。序列长度的变化范围为15~47年,平均长度为24.43年(图1b)。
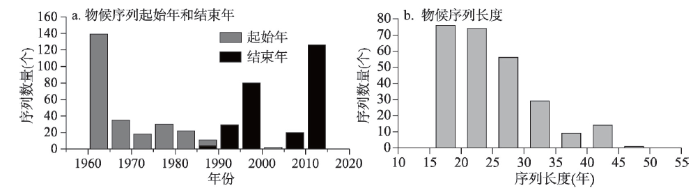 显示原图|下载原图ZIP|生成PPT
图1中国物候序列起始年和结束年及长度的频率分布
-->Fig. 1Frequency distribution of the start and end years as well as length of the phenological series
-->
Tab. 1
表1
表1研究采用的物种概况
Tab. 1Summary of plant species investigated in this study
| 编号 | 物种名 | 拉丁名 | 生活型 | 分布站点数 | 平均开花始期 |
|---|---|---|---|---|---|
| 1 | 玉兰 | Magnolia denudata | 乔木 | 10 | 72 |
| 2 | 桃 | Amygdalus persica | 乔木 | 15 | 84 |
| 3 | 榆树 | Ulmus pumila | 乔木 | 15 | 84 |
| 4 | 垂柳 | Salix babylonica | 乔木 | 15 | 86 |
| 5 | 加拿大杨 | Populus canadensis | 乔木 | 9 | 90 |
| 6 | 泡桐 | Paulownia fortunei | 乔木 | 11 | 96 |
| 7 | 构树 | Broussonetia papyifera | 乔木 | 11 | 99 |
| 8 | 杏 | Armeniaca vulgaris | 乔木 | 10 | 105 |
| 9 | 旱柳 | Salix matsudana | 乔木 | 8 | 111 |
| 10 | 二球悬铃木 | Platanus acerifolia | 乔木 | 8 | 112 |
| 11 | 楝 | Melia azedarach | 乔木 | 15 | 116 |
| 12 | 刺槐 | Robinia pseudoacacia | 乔木 | 18 | 121 |
| 13 | 合欢 | Albizia julibrissin | 乔木 | 10 | 154 |
| 14 | 女贞 | Ligustrum lucidum | 乔木 | 10 | 161 |
| 15 | 梧桐 | Firmiana simples | 乔木 | 11 | 166 |
| 16 | 枣 | Ziziphus jujuba | 乔木 | 10 | 177 |
| 17 | 槐树 | Sophora japonica | 乔木 | 8 | 196 |
| 18 | 紫荆 | Cercis chinensis | 灌木 | 13 | 106 |
| 19 | 桑 | Morus alba | 灌木 | 9 | 109 |
| 20 | 紫丁香 | Syringa oblata | 灌木 | 13 | 112 |
| 21 | 紫薇 | Lagerstroemia indica | 灌木 | 11 | 180 |
| 22 | 木槿 | Hibiscus syriacus | 灌木 | 9 | 183 |
| 23 | 紫藤 | Wisteria sinensis | 藤本 | 10 | 103 |
新窗口打开
2.2 研究方法
植物的花期长度是指一株植物从第一朵花开放到最后一朵花开毕延续的时间[19],即植物从开花始期到开花末期所经过的时间。用公式表示为:式中:FD、FFD和EFD分别表示花期长度、开花始期和开花末期。
首先利用式(1)计算各站点所有植物逐年的花期长度;其次,以年份为自变量,花期长度为因变量进行线性回归分析,所得回归系数即为花期长度的变化趋势(d/a)。
为分析花期长度变化的整体分布情况,统计全部站点所有物种花期长度变化趋势的频率分布,并按照乔木和灌木分别统计。为分析花期长度变化的空间格局,按照变化的方向和强弱将各站点的物种分为4类进行讨论(>0.15、0~0.15、-0.15~0、<0.15 d/a),并利用ArcMap软件绘制变化趋势的空间分布图。其次,以2°为步长,统计不同纬度和经度带上花期长度变化趋势的均值、最大值和最小值,研究花期长度变化沿经纬度的分异规律。
为探讨不同时段间花期长度变化的特征及种间差异,分别计算各物种在所有站点逐年花期长度距平的均值,其中距平由花期时间序列减去多年均值计算。以上分析均采用MATLAB R2010b软件编程实现。
花期长度延长或缩短由开花始期和开花末期的提前或推迟共同决定。花期长度延长的可能形式有3种(图2):① 开花始期和开花末期都提前,但开花始期的提前趋势更大;② 开花始期提前,开花末期推迟;③ 开花始期和开花末期都推迟,但开花末期的推迟趋势更大。相应地,花期长度缩短的可能形式也有3种(图2)。据此,本文识别了每条花期长度序列的变化形式。为研究生活型与花期变化形式的关系,分乔木和灌木分别进行统计。考虑到年内开花较早的植物和开花较晚的植物控制花期变化的因素可能存在差别,进而导致两类植物花期长度的变化形式有所差别。因此,本文分早花植物与晚花植物比较了花期长度的变化形式差异。因物候季节的早晚受各地气候条件影响,所以早花与晚花植物的划分没有固定的标准,通常以年内开花时间的相对早晚划分[20-21]。根据这一原则,以所有物种平均开花始期的中值(5月1日)为分界点,早于分界点的划分为早花植物,晚于分界点的划分为晚花植物。
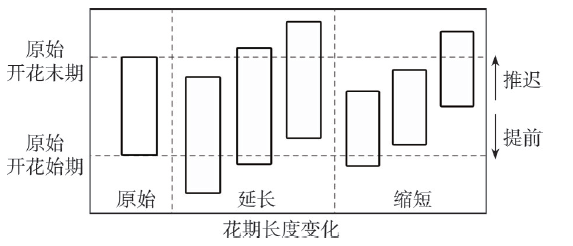 显示原图|下载原图ZIP|生成PPT
图2花期长度变化的可能形式
-->Fig. 2The probable forms of changes in flowering duration
-->
3 结果与分析
3.1 花期长度整体变化趋势
从花期长度序列变化趋势的总体分布来看,花期长度延长的序列明显多于缩短的序列。259条花期长度变化序列中,38.61%的序列呈缩短趋势,其中显著缩短的占9.65%(表2,图3)(P<0.05);61.39%的花期长度序列延长,其中显著延长的占21.24%(P<0.05)。乔木和灌木相比,花期长度显著缩短的比例相差不大,但是乔木花期长度显著延长的比例只有16.29%,低于灌木的30.91%,这表明灌木花期的延长趋势比乔木更加显著(表2)。Tab. 2
表2
表2花期长度变化趋势总体分布
Tab. 2Summary of trends in flowering duration
| 花期长度变化 | 全部植物 | 乔木 | 灌木 | |||||
|---|---|---|---|---|---|---|---|---|
| 序列数(个) | 百分比(%) | 序列数(个) | 百分比(%) | 序列数(个) | 百分比(%) | |||
| 缩短(总计) | 100 | 38.61 | 81 | 41.54 | 19 | 38.18 | ||
| 缩短(显著) | 25 | 9.65 | 20 | 10.26 | 6 | 10.91 | ||
| 缩短(不显著) | 75 | 28.96 | 61 | 31.28 | 15 | 27.27 | ||
| 延长(总计) | 159 | 61.39 | 114 | 58.46 | 34 | 61.82 | ||
| 延长(显著) | 55 | 21.24 | 33 | 16.92 | 17 | 30.91 | ||
| 延长(不显著) | 104 | 40.15 | 81 | 41.54 | 17 | 30.91 | ||
新窗口打开
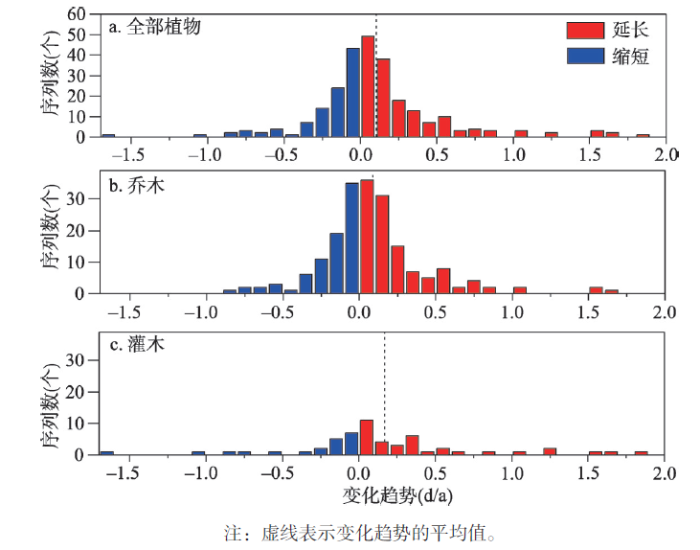 显示原图|下载原图ZIP|生成PPT
图3中国主要木本植物花期长度变化趋势的频率分布
-->Fig. 3Frequency distributions of trends in flowering duration of main woody plants in China
-->
从变化幅度上来看,花期长度的变化趋势在-1.61 d/a(南昌的紫薇)到1.89 d/a(勐腊的紫薇)之间,其中59.46%的序列花期长度变化趋势绝对值小于0.10 d/a,88.03%的序列变化趋势绝对值小于0.50 d/a(图3)。所有序列花期长度变化趋势均值为0.10 d/a,表明平均每年花期长度延长0.10 d。乔木的花期长度平均变化趋势为0.09 d/a,低于灌木(0.17 d/a)。
3.2 花期长度变化的空间格局
从花期长度变化的空间格局看(图4a),全部42个站点中仅有9个站点(21.43%)花期长度缩短的物种数量占到一半以上,主要包括东北地区的哈尔滨、嫩江,华中地区的长沙和华东地区的合肥、赣县、南昌、扬州等。有一半及以上物种花期长度延长的站点共计33个(78.57%),其中,有16个站点全部物种的花期长度均呈延长趋势,这些站点主要分布在东北地区北部、华北地区、西南和华南地区南部。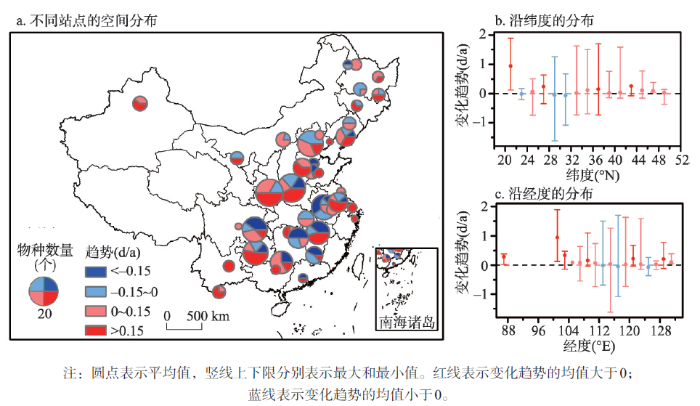 显示原图|下载原图ZIP|生成PPT
图4中国花期长度变化趋势的空间格局
-->Fig. 4The spatial patterns of trends in flowering duration in China
-->
就纬向变化而言(图4b),中高纬度地区(32°N~50°N)花期长度主要呈延长趋势,变化范围为0.02~0.26 d/a;低纬度地区(23°N和30°N附近)花期长度缩短,但趋势较弱,仅为-0.07~-0.02 d/a;在20°N左右,花期长度变化趋势最大,平均每年延长0.94 d。
就经向变化而言(图4c),西部地区(87°E-112°E)各经度区间的花期长度变化趋势(0.07~0.94 d/a,平均0.28 d/a)要高于东部地区(-0.07~0.22 d/a,平均0.05 d/a)。在 113°E、117°E和125°E附近花期长度缩短,但是平均变化趋势较弱(-0.07~-0.01 d/a)。
3.3 花期长度的年际变化
花期长度变化可分为3个明显的阶段(图5)。1963-1980年,花期长度距平为负值的年份较多,平均值为-1.49 d;1981-1997年,花期长度距平在整个时段内都较小,平均值仅为-0.01 d;2001-2012年,花期长度距平均值为2.48 d,表明花期长度延长主要发生在这一阶段。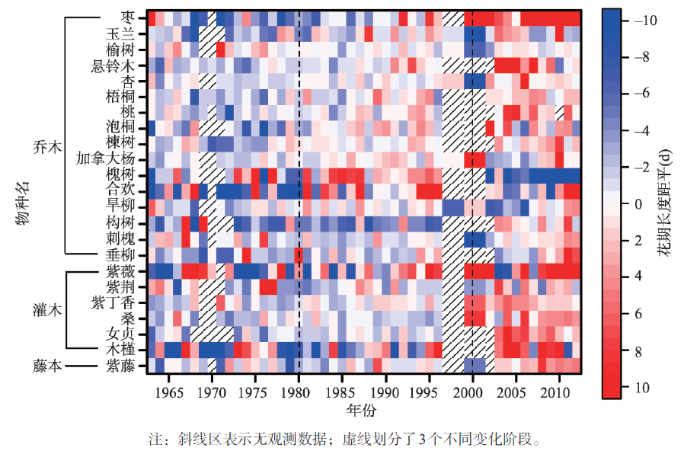 显示原图|下载原图ZIP|生成PPT
图51963-2012年中国各植物花期长度距平序列
-->Fig. 5The anomalies of flowering duration for different plant species from 1963 to 2012
-->
花期长度距平变化也存在一定的种间差异(图5)。例如,合欢、构树、紫薇和木槿在前两个阶段1963-1980年、1981-1997年的平均花期长度距平分别为-5.10 d、-0.20 d,变化幅度大于其他物种的均值(分别为-1.02 d和0.03 d)。值得注意的是,槐树的花期长度距平变化与其他物种有明显差别。在上述3个阶段,槐树的花期长度距平分别为1.30 d、3.90 d和-11.20 d。这表明槐树花期长度在前两个时段较长,在近十几年缩短,且变幅远大于其他物种。
3.4 花期长度变化的形式
在花期长度延长的序列中,开花始期提前程度大于开花末期提前程度的有69个(表3),占所有序列的26.64%,占花期延长序列的43.39%。此外,开花始期提前、开花末期推迟的序列占所有序列的19.31%,占花期延长序列的31.45%。这两类形式共占所有序列约一半的比例(45.95%)。在花期长度缩短的序列中,开花始期提前程度小于开花末期提前程度的有62个,占所有序列的23.94%,占花期缩短序列的62.00%。相比之下,开花始期缩短的其余两种形式占缩短序列的比例较小,分别仅为21.00%和17.00%。Tab. 3
表3
表3不同生活型植物花期长度变化形式
Tab. 3The forms of change in flowering duration for different life forms
| 花期变化 类型 | 变化形式 | 全部植物 | 乔木 | 灌木 | |||||
|---|---|---|---|---|---|---|---|---|---|
| 序列数(个) | 百分比(%) | 序列数(个) | 百分比(%) | 序列数(个) | 百分比(%) | ||||
| 延长 | FFD提前>EFD提前 | 69 | 26.64 | 49 | 25.13 | 16 | 29.09 | ||
| FFD提前,EFD推迟 | 50 | 19.31 | 34 | 17.44 | 15 | 27.27 | |||
| FFD推迟<EFD推迟 | 40 | 15.44 | 33 | 16.92 | 5 | 9.09 | |||
| 缩短 | FFD提前<EFD提前 | 62 | 23.94 | 49 | 25.13 | 12 | 21.82 | ||
| FFD推迟,EFD提前 | 21 | 8.11 | 16 | 8.21 | 4 | 7.27 | |||
| FFD推迟>EFD推迟 | 17 | 6.56 | 14 | 7.18 | 3 | 5.45 | |||
新窗口打开
就乔木而言,25.13%的序列开花始期提前程度大于开花末期(表3),是花期长度延长的最主要形式。其次,开花始期推迟程度小于开花末期是花期长度延长的次要形式(17.44%)。灌木中50.91%的序列开花始期和开花末期都呈现提前的趋势。开花始期提前程度大于和小于开花末期提前程度的植物分别占29.09%和21.82%。同时,灌木中有27.27%的序列花期延长的形式是开花始期提前,开花末期推迟,这一比例明显高于乔木(19.31%)。
早花和晚花植物花期长度变化的主要形式也存在一定的差别(表4)。早花植物花期长度延长的主要形式是开花始期提前程度大于开花末期提前程度,这一类占所有序列总数的29.38%;而晚花植物花期长度延长的主要形式(33.85%)是开花始期提前,开花末期推迟。但早花和晚花植物花期长度缩短的主要形式均为开花始期的提前程度小于开花末期的提前程度。
Tab. 4
表4
表4早花与晚花植物的花期长度变化形式
Tab. 4The forms of change in flowering duration for early and late flowering species
| 花期变化类型 | 变化形式 | 早花 | 晚花 | |||
|---|---|---|---|---|---|---|
| 序列数(个) | 百分比(%) | 序列数(个) | 百分比(%) | |||
| 延长 | FFD提前>EFD提前 | 57 | 29.38 | 12 | 18.46 | |
| FFD提前,EFD推迟 | 28 | 14.43 | 22 | 33.85 | ||
| FFD推迟<EFD推迟 | 36 | 18.56 | 5 | 6.15 | ||
| 缩短 | FFD提前<EFD提前 | 44 | 22.68 | 18 | 27.69 | |
| FFD推迟,EFD提前 | 15 | 7.73 | 6 | 9.23 | ||
| FFD推迟>EFD推迟 | 14 | 7.22 | 3 | 4.62 | ||
新窗口打开
4 讨论
本文系统分析了1963-2012年中国42个站点259条木本植物花期长度序列的变化趋势。其中,61.39%的花期长度序列呈延长趋势,38.61%的花期长度序列呈缩短趋势。和本文的结果相一致,Ziello等[22]也发现,1971-2000年欧洲地区29种植物的花期长度总体上呈现延长的趋势。但也有研究得到相反的结论,例如Bock等[20]发现英吉利海峡的根西岛(Guernsey Island)85%的物种花期长度在1985-2011年呈缩短态势,并且缩短平均趋势达-1.0 d/a,这与中国花期长度的平均变化趋势(0.10 d/a)有较大差异。这种差异一方面是因研究时段的不同导致的,另一方面可能与研究的植物种不同有关。本文研究的物种主要是中国常见的园林木本植物,而Bock等[20]研究的物种既包括木本植物,还包括草本、地下芽植物等。不同植物对环境变化的响应机制必然存在差异,从而导致花期变化趋势的不同。另外,不同研究区的气候类型也存在明显差别。中国大部分地区属大陆性季风气候,而根西岛属海洋性气候。在不同气候类型下,植物物候对气候的适应策略可能有所差异。在海洋性气候或地中海气候下,某些植物可能会随气候变暖加快花器官发育的进程,从而使花期缩短,降低植物在雨季中对花的维持成本[23]。在其他气候类型下,植物可能随气候变暖延长其花期,这虽然会牺牲掉一部分自身资源,但有利于提高生殖的成功率[24]。总之,植物会根据自身的遗传特性和所处的气候类型,在降低花期资源消耗和提高生殖成功率两者间权衡,从而使得花期长度变化具有多样性。总体而言,影响花期长度变化的因素包括非生物因素和生物因素两类。在众多非生物因素中,温度对花期长度影响最大,温度增加可能会导致花期延长。例如,Miller-Rushing等[25]发现温暖年份的樱花花期长度更长,平均温度升高1 °C,花期长度延长0.5 d。还有研究发现实验条件下的增温可延长一年蓬(Erigeron annuus)花期的持续时间[26]。这是因为在大多数情况下,更早的物候期(例如始花期)比晚的物候期(例如末花期)对温度变化的响应更加敏感[27-30]。换言之,在同样升温情景下,始花期会比末花期提前更多,从而造成花期长度延长。近50年来,中国大部分地区气温呈增加趋势[31],这在一定程度上解释了花期长度总体延长的特征。除温度外,有研究表明某些植物花期长度的变化还与降水和湿度显著相关[16, 24]。降水增多可能会加大植物维持花朵开放的成本,从而使植物减少花寿命或花期持续时间[32]。除温度、降水外,光周期、日照强度、霜冻灾害等[33-34]也是导致花期长度变化的可能因子。
虽然本文发现中国植物花期长度总体上呈延长趋势,但仍有9.65%的花期长度序列呈显著缩短的态势。这表明仅用温度等非生物因素来解释中国过去50年的花期长度变化仍有较大的局限性。生物因素,包括传粉者和种间竞争关系[35]等对花期长度的影响同样重要。本文选择的23种植物中除垂柳、旱柳、加拿大杨、二球悬铃木和榆树外,其余18种植物都是虫媒植物。这类植物花期的变化既受昆虫数量的影响,也受花期和昆虫活动对应时间的影响[35]。因不同植物间存在对传粉者这种有限资源的竞争关系,为吸引更多的传粉者以及提高传粉效率,植物在长期适应过程中可能改变其开花时间或延长其花期长度[36]。由于缺乏对传粉者的观测数据,尚无法对生物因素进行定量化的评估,有待于未来进一步研究。总之,生物和非生物因素对物候变化的相对主导作用随区域和物种不同而变化[37]。因此,如何定量化评估各因素对花期长度的影响是未来物候学研究的一个重要方向。
5 结论
本文定量研究了中国主要木本植物过去50年花期长度的变化趋势,重点分析了花期长度变化的空间格局、时间和种间差异,探讨了花期长度变化的主要形式。主要结论有:(1)在所有花期长度序列中,大多数序列(61.39%)呈延长趋势,其中显著延长的占21.24%(P<0.05)。灌木花期的延长趋势比乔木更加显著。
(2)花期长度变化存在明显的区域差异。在东北南部、华中和华东等地区花期长度缩短的物种数量更多;在东北地区北部、华北地区、西南地区和华南地区南部,大多数物种的花期长度呈延长趋势。大多数纬度带上,花期长度平均变化趋势呈延长态势,其中在20°N左右最大(0.94 d/a);经度地带方面,西部(112°E以西)各经度区间内的花期长度变化趋势高于东部。
(3)花期长度的年际变化可分成明显的3个阶段:1963-1980年较短,1981-1997年与多年平均值接近,2001-2012年显著延长。但个别物种花期长度变化的阶段与其他物种存在明显差异。
(4)花期长度延长的主要形式是开花始期提前程度大于开花末期提前程度,这类序列占所有花期长度延长序列的43.39%。花期长度缩短的主要形式是开花始期提前程度小于开花末期提前程度,占所有花期缩短序列的62.00%。
The authors have declared that no competing interests exist.
参考文献 原文顺序
文献年度倒序
文中引用次数倒序
被引期刊影响因子
| [1] | |
| [2] | 为优化南京市园林植物配置以及 增强园林开花植物观赏性提供理论依据,对1980-2012年南京市78种常见观赏树种的花期物候资料进行分析。结果表明,南京市常见观赏植物花期主要集 中在3—5月,多数植物开花持续时间在10~20d,因受气候波动等自然因素影响,每年各种植物花期变动较大。结论:南京市植物资源相对丰富,但冬季开花 植物种类较少,部分植物开花持续时间过短,在园林规划中,需考虑植物花期的季节分布以及开花持续时间长短对城市园林景观的影响,优化植物配置,合理有效延 长植物观赏花期。 . 为优化南京市园林植物配置以及 增强园林开花植物观赏性提供理论依据,对1980-2012年南京市78种常见观赏树种的花期物候资料进行分析。结果表明,南京市常见观赏植物花期主要集 中在3—5月,多数植物开花持续时间在10~20d,因受气候波动等自然因素影响,每年各种植物花期变动较大。结论:南京市植物资源相对丰富,但冬季开花 植物种类较少,部分植物开花持续时间过短,在园林规划中,需考虑植物花期的季节分布以及开花持续时间长短对城市园林景观的影响,优化植物配置,合理有效延 长植物观赏花期。 |
| [3] | |
| [4] | . 由于人类活动引起大气温室气体增加造成气候变暖,温度的变化改变了大气水热时空分布格局,这不但引起植物花期物候变化,而且会改变植物花期与虫媒昆虫和病虫害之间关系变化。该过程涉及到植物有性繁殖体种子的产量。花期的变化会对农业粮食安全产生影响,同时植物的繁殖影响到自然生态系统植物群落组成的变化,进而影响到生产力。因此,该研究综述了近年来国内外植物花期对气候变化的影响,并在此基础上对未来的研究方向进行了探讨和展望。 . 由于人类活动引起大气温室气体增加造成气候变暖,温度的变化改变了大气水热时空分布格局,这不但引起植物花期物候变化,而且会改变植物花期与虫媒昆虫和病虫害之间关系变化。该过程涉及到植物有性繁殖体种子的产量。花期的变化会对农业粮食安全产生影响,同时植物的繁殖影响到自然生态系统植物群落组成的变化,进而影响到生产力。因此,该研究综述了近年来国内外植物花期对气候变化的影响,并在此基础上对未来的研究方向进行了探讨和展望。 |
| [5] | 北京植物园桃花节是赏花专题时令旅游的典型代表,以近20年植物园桃花节的起讫时间、持续时间及相关气温、物候期等数据为依据,探讨了气候变暖对时令旅游的影响。结果表明:1994年前后桃花节开始日期存在着显著的均值差异,后一时段比前一时段约提前6天,植物园桃花节的开始日期在总体上响应了以山桃始花为代表的北京春季物候提前的变化趋势。同时,桃花节开始日期与上年山桃始花日期、上年年均温度存在显著相关性,反映人们对桃花节的决策是参照上一年的物候现象做出的,相对于气候年际波动存在1年的滞后。桃花节结束日期受人为因素影响较大,但总的来说气候变暖有利于桃花节持续日数的延长。此外,桃花节响应气候变化的滞后性,使得气候 . 北京植物园桃花节是赏花专题时令旅游的典型代表,以近20年植物园桃花节的起讫时间、持续时间及相关气温、物候期等数据为依据,探讨了气候变暖对时令旅游的影响。结果表明:1994年前后桃花节开始日期存在着显著的均值差异,后一时段比前一时段约提前6天,植物园桃花节的开始日期在总体上响应了以山桃始花为代表的北京春季物候提前的变化趋势。同时,桃花节开始日期与上年山桃始花日期、上年年均温度存在显著相关性,反映人们对桃花节的决策是参照上一年的物候现象做出的,相对于气候年际波动存在1年的滞后。桃花节结束日期受人为因素影响较大,但总的来说气候变暖有利于桃花节持续日数的延长。此外,桃花节响应气候变化的滞后性,使得气候 |
| [6] | 利用中国物候观测网12个站点多种木本植物的展叶始期、开花盛期和叶全变色期观测数据,通过统计物候期的频率分布划分了上述3种物候期的观赏季节,分析了过去50年最佳观赏日的变化趋势,为旅游管理部门及游客的游憩活动安排提供理论依据。研究得出以下主要结论①最佳观赏日在不同站点间存在较大差异。展叶最佳观赏日范围为3月16日(桂林)到5月5日(哈尔滨);开花最佳观赏日从4月3日(昆明)到5月24日(牡丹江);叶变色最佳观赏日从10月1日(牡丹江)到11月30日(上海)。展叶、开花最佳观赏日和纬度显著正相关,叶变色最佳观赏日和纬度显著负相关;②部分站点过去50年最佳观赏日发生了明显变化。尤其是北京和西安,展叶和开花最佳观赏日都以超过1.6天/10年的趋势显著提前,而叶变色最佳观赏日显著推迟(北京1.6天/10年;西安2.1天/10年)。③观赏季起止时间和最佳日期受站点气温控制。展叶、开花最佳观赏日与站点春季(3-5月)气温显著负相关。站点春季气温每升高1°C,展叶和开花最佳观赏日分别提前4.02和4.04天。叶变色最佳观赏日与站点秋季(9-11月)气温显著正相关,在空间上对气温响应的敏感性为2.98天/°C。 . 利用中国物候观测网12个站点多种木本植物的展叶始期、开花盛期和叶全变色期观测数据,通过统计物候期的频率分布划分了上述3种物候期的观赏季节,分析了过去50年最佳观赏日的变化趋势,为旅游管理部门及游客的游憩活动安排提供理论依据。研究得出以下主要结论①最佳观赏日在不同站点间存在较大差异。展叶最佳观赏日范围为3月16日(桂林)到5月5日(哈尔滨);开花最佳观赏日从4月3日(昆明)到5月24日(牡丹江);叶变色最佳观赏日从10月1日(牡丹江)到11月30日(上海)。展叶、开花最佳观赏日和纬度显著正相关,叶变色最佳观赏日和纬度显著负相关;②部分站点过去50年最佳观赏日发生了明显变化。尤其是北京和西安,展叶和开花最佳观赏日都以超过1.6天/10年的趋势显著提前,而叶变色最佳观赏日显著推迟(北京1.6天/10年;西安2.1天/10年)。③观赏季起止时间和最佳日期受站点气温控制。展叶、开花最佳观赏日与站点春季(3-5月)气温显著负相关。站点春季气温每升高1°C,展叶和开花最佳观赏日分别提前4.02和4.04天。叶变色最佳观赏日与站点秋季(9-11月)气温显著正相关,在空间上对气温响应的敏感性为2.98天/°C。 |
| [7] | 在对西安园林植物进行23a的观赏物候期及5a的观赏物候相特征观察的基础上,通过对资料的统计分析和整理,绘制了西安地区30种主要季色叶植物的观赏物候期图谱,并描述了它们各观赏物候相特征。通过图谱这种直观的形式并结合特征描述,较为全面地介绍了这30种季色叶植物在西安的观赏物候发生时期及其性状特征,以及各种植物观赏相出现时期之间的重叠、相随及匹配关系。观察结果同时显示,西安地区季色叶植物资源丰富,约有100种,但园林中广泛应用的种类不及1/2;在表现最为突出的30种季色叶植物中,60%为春季兼秋季色叶型,40%为单秋季色叶型。 . 在对西安园林植物进行23a的观赏物候期及5a的观赏物候相特征观察的基础上,通过对资料的统计分析和整理,绘制了西安地区30种主要季色叶植物的观赏物候期图谱,并描述了它们各观赏物候相特征。通过图谱这种直观的形式并结合特征描述,较为全面地介绍了这30种季色叶植物在西安的观赏物候发生时期及其性状特征,以及各种植物观赏相出现时期之间的重叠、相随及匹配关系。观察结果同时显示,西安地区季色叶植物资源丰富,约有100种,但园林中广泛应用的种类不及1/2;在表现最为突出的30种季色叶植物中,60%为春季兼秋季色叶型,40%为单秋季色叶型。 |
| [8] | 气传致敏花粉可引起花粉过敏症,据统计,我国花粉过敏症发病率为0.5%~1%以上,高发区达5%。在北京地区,约有1/4~1/3呼吸道患者与花粉过敏有关。花粉过敏症的发病与致敏植物的花期有着密切关系。3~6月是花粉过敏症多发期,此时正是树木开花最为集中的时期,致敏花粉以树木花粉为主。有关研究表明,在北京地区,约有90%左右的常见树木在3~6月开花嘲,其中包括圆柏、侧柏、油松、银杏、榆树、毛白杨、旱柳、垂柳、加拿大杨、白蜡、臭椿、构树、桑、胡桃、枫杨等产生致敏花粉的树木,它们多是北京的乡土树种和主要园林绿化树种,具有分布范围广,种植数量多的特点。 . 气传致敏花粉可引起花粉过敏症,据统计,我国花粉过敏症发病率为0.5%~1%以上,高发区达5%。在北京地区,约有1/4~1/3呼吸道患者与花粉过敏有关。花粉过敏症的发病与致敏植物的花期有着密切关系。3~6月是花粉过敏症多发期,此时正是树木开花最为集中的时期,致敏花粉以树木花粉为主。有关研究表明,在北京地区,约有90%左右的常见树木在3~6月开花嘲,其中包括圆柏、侧柏、油松、银杏、榆树、毛白杨、旱柳、垂柳、加拿大杨、白蜡、臭椿、构树、桑、胡桃、枫杨等产生致敏花粉的树木,它们多是北京的乡土树种和主要园林绿化树种,具有分布范围广,种植数量多的特点。 |
| [9] | Abstract The timing of crucial events in plant life cycles is shifting in response to climate change. We use phenology records from PlantWatch Canada ‘Citizen Science’ networks to study recent rapid shifts of flowering phenology and its relationship with climate. The average first flower bloom day of 19 Canadian plant species has advanced by about 9 days during 2001–2012. 73% of the rapid and unprecedented first bloom day advances are explained by changes in mean annual national temperature, allowing the reconstruction of historic flower phenology records starting from 1948. The overall trends show that plant flowering in Canada is advancing by about 9 days per6C. This analysis reveals the strongest biological signal yet of climate warming in Canada. This finding has broad implications for niche differentiation among coexisting species, competitive interactions between species, and the asynchrony between plants and the organisms they interact with. |
| [10] | ABSTRACT We evaluated spring phenology changes from 1965 to 2001 in northeastern USA utilizing a unique data set from 72 locations with genetically identical lilac plants (Syringa chinensis, clone "Red Rothomagensis"). We also utilized a previously validated lilac-honeysuckle "spring index" model to reconstruct a more complete record of first leaf date (FLD) and first flower date (FFD) for the region from historical weather data. In addition, we examined mid-bloom dates for apple (Malus domestica) and grape (Vitis vinifera) collected at several sites in the region during approximately the same time period. Almost all lilac sites with significant linear trends for FLD or FFD versus year had negative slopes (advanced development). Regression analysis of pooled data for the 72 sites indicated an advance of -0.092 day/year for FFD (P=0.003). The slope for FLD was also negative (-0.048 day/year), but not significant (P=0.234). The simulated data from the "spring index" model, which relies on local daily temperature records, indicated highly significant (P<0.001) negative slopes of -0.210 and -0.123 day/year for FLD and FFD, respectively. Data collected for apple and grape also indicated advance spring development, with slopes for mid-bloom date versus year of -0.20 day/year (P=0.01) and -0.146 (P=0.14), respectively. Collectively, these results indicate an advance in spring phenology ranging from 2 to 8 days for these woody perennials in northeastern USA for the period 1965 to 2001, qualitatively consistent with a warming trend, and consistent with phenology shifts reported for other mid- and high-latitude regions. |
| [11] | Global climate change impacts can already be tracked in many physical and biological systems; in particular, terrestrial ecosystems provide a consistent picture of observed changes. One of the preferred indicators is phenology, the science of natural recurring events, as their recorded dates provide a high-temporal resolution of ongoing changes. Thus, numerous analyses have demonstrated an earlier onset of spring events for mid and higher latitudes and a lengthening of the growing season. However, published single-site or single-species studies are particularly open to suspicion of being biased towards predominantly reporting climate change-induced impacts. No comprehensive study or meta-analysis has so far examined the possible lack of evidence for changes or shifts at sites where no temperature change is observed. We used an enormous systematic phenological network data set of more than 125 000 observational series of 542 plant and 19 animal species in 21 European countries (1971-2000). Our results showed that 78% of all leafing, flowering and fruiting records advanced (30% significantly) and only 3% were significantly delayed, whereas the signal of leaf colouring/fall is ambiguous. We conclude that previously published results of phenological changes were not biased by reporting or publication predisposition: the average advance of spring/summer was 2.5 days decade63641; in Europe. Our analysis of 254 mean national time series undoubtedly demonstrates that species' phenology is responsive to temperature of the preceding months (mean advance of spring/summer by 2.5 days°C63641;, delay of leaf colouring and fall by 1.0 day°C63641;). The pattern of observed change in spring efficiently matches measured national warming across 19 European countries (correlation coefficient r=-0.69, P<0.001). |
| [12] | The change in the phenology of plants or animals reflects the response of living systems to climate change. Numerous studies have reported a consistent earlier spring phenophases in many parts of middle and high latitudes reflecting increasing temperatures with the exception of China. A systematic analysis of Chinese phenological response could complement the assessment of climate change impact for the whole Northern Hemisphere. Here, we analyze 1263 phenological time series (1960-2011, with 20+ years data) of 112 species extracted from 48 studies across 145 sites in China. Taxonomic groups include trees, shrubs, herbs, birds, amphibians and insects. Results demonstrate that 90.8% of the spring/summer phenophases time series show earlier trends and 69.0% of the autumn phenophases records show later trends. For spring/summer phenophases, the mean advance across all the taxonomic groups was 2.75 days decade(-1) ranging between 2.11 and 6.11 days decade(-1) for insects and amphibians, respectively. Herbs and amphibians show significantly stronger advancement than trees, shrubs and insect. The response of phenophases of different taxonomic groups in autumn is more complex: trees, shrubs, herbs and insects show a delay between 1.93 and 4.84 days decade(-1), while other groups reveal an advancement ranging from 1.10 to 2.11 days decade(-1) . For woody plants (including trees and shrubs), the stronger shifts toward earlier spring/summer were detected from the data series starting from more recent decades (1980s-2000s). The geographic factors (latitude, longitude and altitude) could only explain 9% and 3% of the overall variance in spring/summer and autumn phenological trends, respectively. The rate of change in spring/summer phenophase of woody plants (1960s-2000s) generally matches measured local warming across 49 sites in China (R=-0.33, P<0.05). |
| [13] | 中国温带季风区是我国重要的农业区,春季霜冻常对该地区的植物造 成严重的损害.本文利用“中国物候观测网”12个站点的物候观测数据和对应站点气象资料,应用物候模型方法,对1963-2009年各站点的霜冻频次和多 种木本植物的始花期进行了分析,并对植物在花期的霜冻风险进行了评估.结果表明,1963-2009年,研究区内东北地区和华北地区的始花期分别以 -1.52天/10a(P<0.01)和-2.22天/10a(P<0.01)的速度提前.在同一时段,研究区春季霜冻日数显著减少,终霜冻日显著提前. 综合考虑花期和霜冻频次的变化,霜冻风险指数,即木本植物花期受到霜冻的物种数占调查总数的百分比,在东北地区以-0.37%/10a的速度降低(不显 著);而在华北地区,霜冻风险指数则以-1.80%/10a的速度显著下降(P< 0.01).这表明过去半个世纪研究区植物花期霜冻风险在降低,且存在显著的区域差异.该结论可为农业和森林管理者制订应对春季霜冻害的决策提供参考. . 中国温带季风区是我国重要的农业区,春季霜冻常对该地区的植物造 成严重的损害.本文利用“中国物候观测网”12个站点的物候观测数据和对应站点气象资料,应用物候模型方法,对1963-2009年各站点的霜冻频次和多 种木本植物的始花期进行了分析,并对植物在花期的霜冻风险进行了评估.结果表明,1963-2009年,研究区内东北地区和华北地区的始花期分别以 -1.52天/10a(P<0.01)和-2.22天/10a(P<0.01)的速度提前.在同一时段,研究区春季霜冻日数显著减少,终霜冻日显著提前. 综合考虑花期和霜冻频次的变化,霜冻风险指数,即木本植物花期受到霜冻的物种数占调查总数的百分比,在东北地区以-0.37%/10a的速度降低(不显 著);而在华北地区,霜冻风险指数则以-1.80%/10a的速度显著下降(P< 0.01).这表明过去半个世纪研究区植物花期霜冻风险在降低,且存在显著的区域差异.该结论可为农业和森林管理者制订应对春季霜冻害的决策提供参考. |
| [14] | |
| [15] | Knowledge of plant–weather relationships can improve crop management, resulting in higher quality and more stable crop yields. The annual timing of spring phenophases in mid-latitudes is largely a response to temperature, and reflects the thermal conditions of previous months. The effect of air temperature on the variability of hazelnut ( Corylus avellana L.) phenophases (leafing, flowering) was investigated. Meteorological and phenological data for five cultivars were analysed over the periods 1969–1979 (P1) and 1994–2007 (P2) in Maribor, Slovenia. Phenological data series were correlated strongly to the temperature of the preceding months ( R 2 : 0.64–0.98) and better correlated to daily maximum and mean temperatures than to daily minimum temperatures. About 75% of phenophases displayed a tendency towards earlier appearance and a shorter flowering duration during P2, which could be explained by the significant temperature changes (+0.3°C/decade) from December to April between 1969 and 2007. An increase in air temperature of 1°C caused an acceleration in leafing by 2.5–3.902days, with flowering showing higher sensitivity since a 1°C increase promoted male flowering by 7.0–8.802days and female flowering by 6.3–8.902days. The average rate of phenological change per degree of warming (days earlier per +1°C) did not differ significantly between P1 and P2. An estimation of chilling accumulation under field conditions during 1993–2009, between 1 November and 28 February, showed that all four of these months contributed approximately similar amounts of accumulated chilling units. The growing degree days (GDD) to flowering were calculated by an estimated base temperature of 2°C and 1 January as a starting date, given the most accurate calculations. In general, thermal requirements were greater in P2 than in P1, although this difference was not significant. Longer-time series data extended to other agricultural and wild plants would be helpful in tracking possible future changes in phenological responses to local climate. |
| [16] | ABSTRACT The phenology of temperate plants is vulnerable to climate change. Yet, the phenological responses of tropical plants to climate change are still unclear. In this study, temporal trends (1973–1999) of four phenological events (budburst, growing season, flowering and flowering duration) were studied among 21 plant species in Xishuangbanna Tropical Botanical Garden (south-western China). Fourteen species (67%) showed significant phenological trends during the study period. Seven species (33%) presented delaying trends in budburst (average 1.4 d y611) and such trend was more likely to be presented in those that started budburst earlier in the dry season. Four species (19%) showed trends of extension in growing season (average of 3.5 d y611). These vegetative events appeared to be mainly influenced by increasing temperature. Rainfall showed little effects directly, however, the effects of temperature seemed to largely depend on the moisture condition. Flowering duration of five species (24%) was shortened by average 2.1 d y611 which was most likely to be the result of the decline in sunshine duration during the rainy season. Our results suggest that the phenology of tropical plants has changed significantly in response to the regional climate change but these reactions are somewhat different from those of temperate plants. |
| [17] | Extending phenological records into the past is essential for the understanding of past ecological change and evaluating the effects of climate change on ecosystems. A growing body of historical phenological information is now available for Europe, North America, and Asia. In East Asia, long-term phenological series are still relatively scarce. This study extracted plant phenological observations from old diaries in the period 1834-1962. A spring phenology index (SPI) for the modern period (1963-2009) was defined as the mean flowering time of three shrubs (first flowering of Amygdalus davidiana and Cercis chinensis, 50% of full flowering of Paeonia suffruticosa) according to the data availability. Applying calibrated transfer functions from the modern period to the historical data, we reconstructed a continuous SPI time series across eastern China from 1834 to 2009. In the recent 30years, the SPI is 2.1-6.3days earlier than during any other consecutive 30year period before 1970. A moving linear trend analysis shows that the advancing trend of SPI over the past three decades reaches upward of 4.1d/decade, which exceeds all previously observed trends in the past 30year period. In addition, the SPI series correlates significantly with spring (February to April) temperatures in the study area, with an increase in spring temperature of 1 degrees C inducing an earlier SPI by 3.1days. These shifts of SPI provide important information regarding regional vegetation-climate relationships, and they are helpful to assess long term of climate change impacts on biophysical systems and biodiversity. Key Points <list list-type="bulleted" id="jgrg20176-list-0001"> <list-item id="jgrg20176-li-0001">Reconstructed 170-year spring phenology index for eastern China <list-item id="jgrg20176-li-0002">Significant trend of SPI of -4.1 days/decade in the most recent 30-year period <list-item id="jgrg20176-li-0003">SPI series correlates significantly with spring temperatures in the study area |
| [18] | Advance in spring plant phenology over the last several decades has been found in all continents of the Northern Hemisphere. Compared to the studies detecting phenological trends, the studies investigating the geographical pattern of phenological variability (including mean date and magnitude of variability) are rather limited. In this study, we analyzed spatial pattern of mean date and standard deviation (SD) of first bloom date (FBD) time series (≥1502years) for black locust ( Robinia pseudoacacia ) at 22 stations in China, common lilac ( Syringa vulgaris ) at 79 stations in the Western US and Chinese lilac ( Syringa chinensis ) at 45 stations in the Eastern US. Subsequently, the impact of geographical factors (latitude, longitude, and altitude) on the mean date and SD was quantified by using the multiple regression analysis method. Meanwhile, the relationship between FBD variability and temperature sensitivity of FBD was examined. Results showed that the mean FBD highly depended on geographical factors for all the three species. Compared to the mean date, the dependence of SD of FBD time series on geographical factors was weaker. The geographical factors could only explain 13 to 3102% of spatial variance in SD of FBD. The negative regression coefficients of latitude ( P 65<650.05 except black locust) indicated that FBD is more variable at lower latitude. At most of stations, significant and negative correlations between FBD and preseason temperature on interannual scale were found, but the temperature sensitivity varied among different stations. The magnitude of temperature sensitivity decreased with increasing latitude. In general, the locations at lower latitude had earlier and more variable spring phenophase and showed stronger phenological response to climate change than the locations at higher latitude. |
| [19] | |
| [20] | Climate change has affected plant phenology; increasing temperatures are associated with advancing first flowering dates. The impact on flowering duration, however, has rarely been studied. In this study, we analysed first flowering dates and flowering durations from a 27 year dataset of weekly flower observations on 232 plant species from the island of Guernsey in the English Channel. The aim of this study was to explore variation in trends and relationships between first flowering dates, flowering duration and temperature. We specifically looked for evidence that traits, such as life forms and phylogenetic groups, explained variation in sensitivity of first flowering and flowering duration among species. Overall trends revealed significantly earlier flowering over time, by an average of 5.2 days decade(-1) since 1985. A highly significant shortening of flowering duration was observed by an average of 10 days decade(-1) . Correlations between first flowering, flowering duration and year varied between different species, traits and flowering periods. Significant differences among traits were observed for first flowering and to a lesser degree for flowering duration. Overall, in comparison to first flowering, more species had significant trends in flowering duration. Temperature relationships revealed large differences in strength and direction of response. 55% of the species revealed a significant negative relationship of first flowering dates and temperature. In contrast, only 19% of flowering durations had a significant negative temperature relationship. The advance in first flowering date together with a shortening of flowering duration suggests potentially serious impacts on pollinators, which might pose a major threat to biodiversity, agriculture and horticulture. health, in terms of , however, might benefit from a shortening of specific plant pollen seasons. |
| [21] | In the present study, long-term changes in the first bloom date of shrub and tree species in Seoul (126.56 E, 37.34 N), Korea were examined using historical observational data for the period 1922-2004 (83 years). The study focused on two shrub species, golden-bell (Forsythia koreana) and azalea (Rhododendron mucronulatum), and three tree species, cherry (Prunus yedoensis), peach (Prunus persica), and American locust (Robinia pseudoacacia). The annual-mean temperature has increased by about 2 C in Seoul over the 83 years analyzed. The temperature increase is significant during the winter and early spring and becomes less significant during late spring. As a result of this regional warming, all five species showed an advance in the first bloom date over this time period. The advanced date is particularly apparent in early-spring flowering species like golden-bell (-2.4 days 10-year-1), azalea (-2.4 days 10-year-1), cherry (-1.4 days 10-year-1), and peach (-1.4 days 10-year-1) as compared to late-spring flowering species like American locust (-0.5 days 10-year).The present results have demonstrated that the major factor for the determination of flower blooming is heat accumulation, i.e. a certain threshold of growing degree-days (GDD) index. In particular, early spring flowers were sensitive to the accumulation of warm temperature than late-spring flowers. |
| [22] | Increasing risk of pollinosis (hay fever) is one of the most anticipated consequences of climate change on human health. Wind‐pollinated plants are representative of allergenic species because they include species with the highest capability of causing allergy‐related diseases in humans. Therefore, changes in wind‐pollinated species may reflect impacts of climate change on allergenic plants. In particular, flowering is one of the developmental stages most affected by climate change. This report specifically addresses changes in flowering dates that have occurred during the three decades 1971–2000 as a function of pollination mode and woodiness. The assessment is made using a phenological data set comprising trends of flowering dates of 29 species in 983 locations in Europe. Linear mixed models assessing the statistical significance of trends while adjusting for spatial correlation are used. The main results indicate for the first time that the onset of flowering of wind‐pollinated plants advanced more than for insect‐pollinated plants, while full flowering phases tended to advance less. These novel findings are contrary to the results of Fitter and Fitter (2002) for Oxfordshire, who reported larger advances of insect‐pollinated plants. Onset of flowering and full flowering of insect‐pollinated species are more likely to advance for seasons early in the year; instead, wind‐pollinated plants showed no dependence of trends on the season (first flowering) or a decreased advance of phases that are early in the year (full flowering). The effect of woodiness could not be unambiguously defined, but seems to be of minor importance. The presented findings suggest a lengthening of the flowering period in general, which might lead to an increasing time of exposure to airborne pollen of allergic subjects, with consequent likely increment in severity and incidence of allergic symptoms. |
| [23] | |
| [24] | Extended flower longevity has been widely defended to occur as a consequence of low pollination activity. To test this hypothesis in Neotropical rainforests, we selected three species of that flower during rainy conditions and commonly exhibit low levels of insect visits. Experimental studies carried out in 15 populations distributed along a wide spatial gradient detected the presence of pollinator limitation in all populations. Pollinia removal without pollen deposition increased longevity, and thus extended longevity could apparently be considered as an ecological advantage for these orchids. Nevertheless, flower longevity was severely shortened by abiotic factors like precipitation and humidity. Comparison with other tropical orchids showed that flower longevity was higher even in species that flower during periods of more pollinator activity than the ones studied here, which is contrary to the hypothesis that pollinators are the only driving force for long ived flowers in . Thus, although long floral longevities are apparently favorable for the reproductive success of these species, the high maintenance costs experienced during rainy conditions are also an important factor constraining the selection of long ived flowers in . |
| [25] | Climate change is affecting plant phenology worldwide. Phenological responses vary among species, but it is not clear how responses differ among closely related species. We examined a 25-yr record (1981-2005) of flowering times for 97 trees, representing 17 species and hybrids of cherry (Cerasus sp. or sp.) grown at Mt. Takao, in Tokyo, Japan. The cherry trees flowered earlier over time, by an average of 5.5 d over the 25-yr study. Earlier flowering was explained largely by a 1.8 C increase in February-March mean monthly temperatures. Most species and hybrids flowered 3-5 d earlier for each 1 C increase in temperature, but early-flowering taxa flowered as much as 9 d earlier for each 1 C increase in temperature. Flowering durations and differences in flowering times among species were greater in warm years than in cold years. Species and individual trees also flowered longer in warm years. These results show that the flowering times of closely related species may change similarly in response to climate change, but that early-flowering species may diverge from the overall trend in a predictable way. Such changes in flowering may affect gene flow and as the length of the flowering season increases. |
| [26] | 全球气候变暖和生物入侵是影响生物多样性和生态系统功能的2个重要因素.本文以我国入侵较早、分布范围广、危害较严重的杂草植物一年蓬Erigeron annuus为研究对象,采用开顶式增温生长室模拟增温方法,研究了温度升高对入侵植物一年蓬开花物候和生物量累积及分配的影响.结果表明:一年蓬开花时间为5月初至9月中旬,短期增温处理后,一年蓬个体的开花振幅曲线呈单峰曲线,开花振幅到达高峰之前,增温处理的开花比例比对照的开花比例极显著高(p0.01),具有较高的开花振幅.增温对一年蓬的开花物候有显著影响.极显著提前其始花日和开花高峰日(p0.01),且增加高峰日的开花数(p0.01),延长了花期持续时间(p0.05),同时增加了其种子大小及质量(p0.05).在增温条件下,显著降低了一年蓬的叶生物量和叶质量比,但显著增加了根叶比(p0.05).在增温条件下,一年蓬通过提前开花、开大量的花、延长花期持续时间、增加其种子大小和质量,从而增加了繁殖投资,并通过生物量分配投资优化配置来适应气温升高,提高了一年蓬的适应性和入侵性. . 全球气候变暖和生物入侵是影响生物多样性和生态系统功能的2个重要因素.本文以我国入侵较早、分布范围广、危害较严重的杂草植物一年蓬Erigeron annuus为研究对象,采用开顶式增温生长室模拟增温方法,研究了温度升高对入侵植物一年蓬开花物候和生物量累积及分配的影响.结果表明:一年蓬开花时间为5月初至9月中旬,短期增温处理后,一年蓬个体的开花振幅曲线呈单峰曲线,开花振幅到达高峰之前,增温处理的开花比例比对照的开花比例极显著高(p0.01),具有较高的开花振幅.增温对一年蓬的开花物候有显著影响.极显著提前其始花日和开花高峰日(p0.01),且增加高峰日的开花数(p0.01),延长了花期持续时间(p0.05),同时增加了其种子大小及质量(p0.05).在增温条件下,显著降低了一年蓬的叶生物量和叶质量比,但显著增加了根叶比(p0.05).在增温条件下,一年蓬通过提前开花、开大量的花、延长花期持续时间、增加其种子大小和质量,从而增加了繁殖投资,并通过生物量分配投资优化配置来适应气温升高,提高了一年蓬的适应性和入侵性. |
| [27] | Abstract The average first flowering date of 385 British plant species has advanced by 4.5 days during the past decade compared with the previous four decades: 16% of species flowered significantly earlier in the 1990s than previously, with an average advancement of 15 days in a decade. Ten species (3%) flowered significantly later in the 1990s than previously. These data reveal the strongest biological signal yet of climatic change. Flowering is especially sensitive to the temperature in the previous month, and spring-flowering species are most responsive. However, large interspecific differences in this response will affect both the structure of plant communities and gene flow between species as climate warms. Annuals are more likely to flower early than congeneric perennials, and insect-pollinated species more than wind-pollinated ones. |
| [28] | |
| [29] | Phenological data on the First Flowering Date(FFD) of woody plants in Beijing from 1963-2007 are analyzed.The correlation between each species' yearly FFD and the mean monthly temperatures for every year over a 45-year period is used to identify the month in which temperature has the most effect on FFD. Through further analysis,the FFDs of 48 woody plant species are shown to have advanced an average of 5.4 days from 1990-2007 compared to 1963-1989.The results indicate that 70.8%of species flowered significantly earlier(7 days on average) during the period 1990-2007,while only one species(2.1%) flowered significantly later.Moreover,the responses of FFD to climate change are shown to be different in two climatic stages, defined by an abrupt climate change point.Thirty-three species which first flower in March and April are sensitive to temperature are examined.The correlation coefficients between FFD and temperature for 20 species during the latter period(1990-2007) are shown to be larger than during the former period(1963- 1989),with a difference of around -0.87 days per 1℃on average.The paper concludes that with the warming of climate,the linear trend of FFD variation,as well as its responsiveness to temperature,became more prominent during 1990-2007 than 1963-1989.The data analyzed in this study present a strong biological indicator of climate change in Beijing,and provide further confirmation of previous results from regional and local studies across the Northern Hemisphere.Phenophase variations indicate that the climate is changing rapidly. |
| [30] | Abstract 1. First flowering dates are occurring earlier than they did in the past in many locations around the world. It is sometimes assumed, implicitly or explicitly, that the changes in first flowering dates describe the phenological behaviour of entire populations. However, first flowering dates represent one extreme of the flowering distribution and may be susceptible to undesirable confounding effects. 2. We used observations of flowering in Colorado and Massachusetts to test whether changes in population size and sampling frequency affect observations of first flowering dates. 3. We found that the effect of population size on first flowering dates depended on location. Changes in population size were strongly related to the dates on which first flowering was observed in Massachusetts but not in Colorado. The lack of a significant effect in Colorado may reflect the rapid onset of spring after snowmelt and fixed developmental schedules of the plants at this sub-alpine site, or the scale of the plots sampled during the study. 4. We also found that changes in sampling frequency can influence observed changes in first flowering dates and other aspects of the flowering distribution. Similar to the effect of declines in population size, lower sampling frequency caused later observations of first flowering. However, lower sampling frequency, if maintained consistently throughout a study, did not significantly affect estimates of changes in flowering dates over time or in response to climate. 5. Synthesis. Researchers should consider the effects of changes in population size and sampling frequency when interpreting changes in first flowering dates. In some cases, past results may need to be reinterpreted. When possible, researchers should observe the entire flowering distribution or consider tracking peak or mean flowering dates to avoid the confounding effects of population size and sampling frequency. |
| [31] | |
| [32] | 花寿命; 进化; 传粉; 花展示; 繁殖成功 . 花寿命; 进化; 传粉; 花展示; 繁殖成功 |
| [33] | |
| [34] | Abstract Earlier spring leaf unfolding is a frequently observed response of plants to climate warming. Many deciduous tree species require chilling for dormancy release, and warming-related reductions in chilling may counteract the advance of leaf unfolding in response to warming. Empirical evidence for this, however, is limited to saplings or twigs in climate-controlled chambers. Using long-term in situ observations of leaf unfolding for seven dominant European tree species at 1,245 sites, here we show that the apparent response of leaf unfolding to climate warming (ST, expressed in days advance of leaf unfolding per °C warming) has significantly decreased from 1980 to 2013 in all monitored tree species. Averaged across all species and sites, ST decreased by 40% from 4.0 ± 1.8 days °C(-1) during 1980-1994 to 2.3 ± 1.6 days °C(-1) during 1999-2013. The declining ST was also simulated by chilling-based phenology models, albeit with a weaker decline (24-30%) than observed in situ. The reduction in ST is likely to be partly attributable to reduced chilling. Nonetheless, other mechanisms may also have a role, such as 'photoperiod limitation' mechanisms that may become ultimately limiting when leaf unfolding dates occur too early in the season. Our results provide empirical evidence for a declining ST, but also suggest that the predicted strong winter warming in the future may further reduce ST and therefore result in a slowdown in the advance of tree spring phenology. |
| [35] | ABSTRACT Forecasting how species and ecosystems will respond to climate change has been a major aim of ecology in recent years. Much of this research has focused on phenology the timing of life-history events. Phenology has well-demonstrated links to climate, from genetic to landscape scales; yet our ability to explain and predict variation in phenology across species, habitats and time remains poor. Here, we outline how merging approaches from ecology, climate science and evolutionary biology can advance research on phenological responses to climate variability. Using insight into seasonal and interannual climate variability combined with niche theory and community phylogenetics, we develop a predictive approach for species reponses to changing climate. Our approach predicts that species occupying higher latitudes or the early growing season should be most sensitive to climate and have the most phylogenetically conserved phenologies. We further predict that temperate species will respond to climate change by shifting in time, while tropical species will respond by shifting space, or by evolving. Although we focus here on plant phenology, our approach is broadly applicable to ecological research of plant responses to climate variability. |
| [36] | |
| [37] | Climate change has brought renewed interest in the study of plant phenology - the timing of life history events. Data on shifting phenologies with warming have accumulated rapidly, yet research has been comparatively slow to explain the diversity of phenological responses observed across latitudes, growing seasons and species. Here, we outline recent efforts to synthesize perspectives on plant phenology across the fields of ecology, climate science and evolution. We highlight three major axes that vary among these disciplines: relative focus on abiotic versus biotic drivers of phenology, on plastic versus genetic drivers of intraspecific variation, and on cross-species versus autecological approaches. Recent interdisciplinary efforts, building on data covering diverse species and climate space, have found a greater role of temperature in controlling phenology at higher latitudes and for early-flowering species in temperate systems. These efforts have also made progress in understanding the tremendous diversity of responses across species by incorporating evolutionary relatedness, and linking phenological flexibility to invasions and plant performance. Future research with a focus on data collection in areas outside the temperate mid-latitudes and across species' ranges, alongside better integration of how risk and investment shape plant phenology, offers promise for further progress. |
