 , 杜会石, 刘美萍
Aeolian dynamical process of blowout on the fixed dune
SUNYu, DUHuishi, LIUMeiping通讯作者:
收稿日期:2016-04-21
修回日期:2016-06-22
网络出版日期:2016-11-25
版权声明:2016《地理学报》编辑部本文是开放获取期刊文献,在以下情况下可以自由使用:学术研究、学术交流、科研教学等,但不允许用于商业目的.
基金资助:
作者简介:
-->
展开
摘要
关键词:
Abstract
Keywords:
-->0
PDF (3830KB)元数据多维度评价相关文章收藏文章
本文引用格式导出EndNoteRisBibtex收藏本文-->
1 引言
自20世纪70年代以来,随着实验手段的提高和微气象学有关理论与方法在沙丘地貌研究中的广泛应用,有关沙丘表面气流与输沙的研究,解释了不同形态的沙丘与近地面层气流相互作用及其导致的沙丘发育和移动。大量的野外观测[1-7]、风洞实验[8-10]和数值模拟[11]等已对主要类型沙丘的形态发育和动力过程[13]有了相当的了解。然而,相对于风积沙丘,目前对风蚀负地貌的研究程度仍然较低。沙丘风蚀坑是由侵蚀坑和坑后积沙区(或沙丘)两个地貌单元组成的风沙地貌形态,广泛分布于沙质海岸、湖岸、干旱和半干旱沙质草原及固定半固定沙丘的迎风坡,是固定沙地或沙丘活化的明显标志[14]。地形与气流之间的相互作用,以及由输沙过程导致的蚀积格局控制着风蚀坑的演变。20世纪末,对于风蚀坑气流动力学的研究主要集中于海岸沙丘风蚀坑。由于观测仪器条件的限制,风速风向未能达到同步观测。进入21世纪,在美国、加拿大、爱尔兰和中国呼伦贝尔沙质草原等地,对风蚀坑气流[15-24]、形态[25]及演化过程[26-27]开展了一系列较为详细的观测。虽然解释了侵蚀坑形态与气流之间的相互作用,但只有少数研究[28-29]关注了气流与输沙之间的关系。本文在浑善达克沙地南缘,对发育在固定沙丘迎风坡的风蚀坑进行了气流及输沙观测,目的在于探讨风沙坑内的气流变化与输沙之间的关系,以及输沙变化对于风蚀坑形态发育的影响。
2 研究区概况
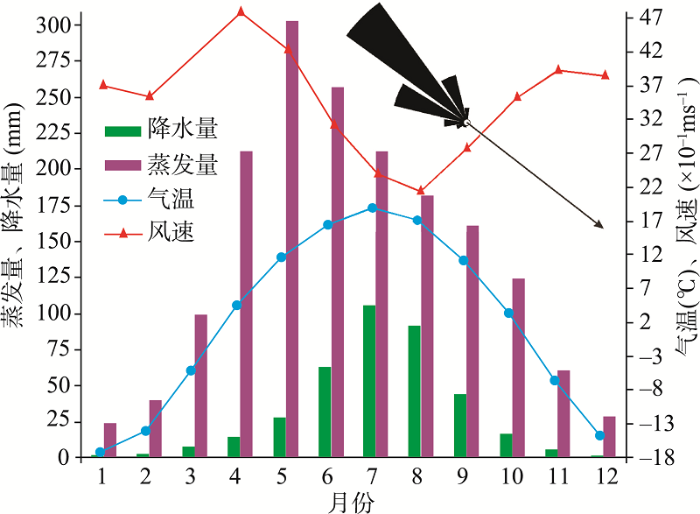
研究区位于内蒙古锡林郭勒盟南部,坐标为116°00′20″E~116°00′58″E,42°12′13″N~42°12′36″N(图1),是燕山北缘的低山丘陵与大兴安岭南缘低山丘陵交汇地带,平均海拔高度1300 m。该区属中温带半干旱大陆性季风气候,冬季寒冷漫长;春季多风少雨;夏季温热,降水集中;秋季短促,降水锐减,气温下降,风速加大。年平均气温2.1 °C,最低温度-17.6 °C,最高温度18.6 °C;全年降水量为387.4 mm,6-9月降水量占全年降水的67.5%;全年蒸发量为1714.3 mm,是全年降水量的4~5倍。该区主要以西北风为主,年平均风速为3.5 m s-1(图2)。地带性土壤主要为黑钙土、暗栗钙土;非地带性土壤主要为风沙土,其次为沼泽土及草甸土;主要植被为羊草(Aneurolepidium chinense)、贝加尔针茅(Stipa baicalensis)、冷蒿(Artemisia frigida)、冰草(Agropgron cristatum)等。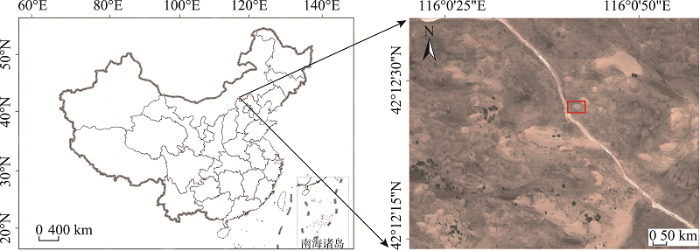 显示原图|下载原图ZIP|生成PPT
图1研究区位置图
-->Fig. 1Location of the study site
-->
 显示原图|下载原图ZIP|生成PPT
图2研究区气候特征
-->Fig. 2Climate characteristics of the study area
-->
沙丘主要分布在该区南部及东南部,风蚀坑普遍发育在沙丘的西坡及西南坡。由于发育部位地形条件的差异,风蚀坑规模及走向各异。其中侵蚀坑长度介于20~40 m的约占56%;侵蚀坑长轴为W-E走向的约占27%,其次为WNW-ESE走向,占20%。积沙区走向基本与侵蚀坑走向一致,分布于侵蚀坑下风向或延伸至沙丘背风坡。
3 方法
观测风蚀坑位于正蓝旗东南部(坐标为116°0′41.64″E,42°12′27.43″N),平面形态大致呈椭圆形,长轴走向为WNW-ESE(282°~102°),侵蚀坑长30.73 m,宽20.74 m,深2.37 m;积沙区长25.44 m,宽23.84 m,高1.44 m,走向与侵蚀坑一致。侵蚀坑西缘较窄,为气流的入风段,坡度比较平缓(约0.5°),南、北两侧壁均为上陡下缓的凹形坡面,北侧壁较陡,坡度分别为11°~21°(南侧壁)和20°~30°(北侧壁),侵蚀坑东坡发育陡坎,坡度较陡(约35°),坡长7.2 m。坑后积沙区发育较小规模沙丘,迎风坡短而陡,背风坡长而缓,北部要略高于南部,丘顶浑圆。积沙区被密集植被覆盖,平均植被盖度约为40%,以赖草(Leymus Hochs)为主。3.1 气流观测
观测仪器为已校准的EC 9-1型三杯风速仪,与Campell公司生产的CR 1000数据采集仪相连,该系统可每5s自动采集及储存观测数据。共布设18个点位观测风蚀坑的近地表流场(图3a,L1~L18),其中侵蚀坑12个,积沙区6个。在各观测点距地面0.3 m处架设风杯,并在同一高度设置飘带,根据飘带指示的方向,用罗盘测定气流的风向。由于在丘顶(L16)架设了风向标,所以在0.3 m处系飘带的同时,将风向标高度调整到0.5 m。另外,在风蚀坑西缘5 m处设立参考站,以观测距地面0.2 m、0.3 m、0.6 m、1.0 m、1.2 m、1.5 m、2.0 m、3.0 m、4.0 m处的风速和距地面4.0 m处的风向。本文将测得的风速数据按照1 min间隔取平均值后进行分析。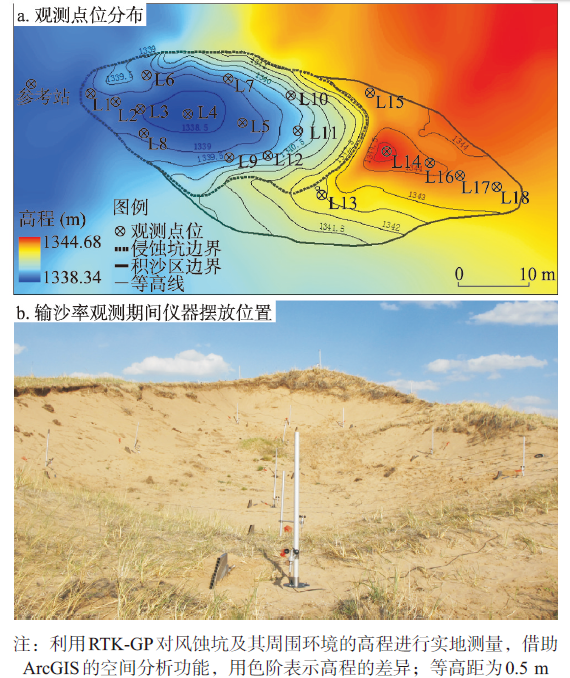 显示原图|下载原图ZIP|生成PPT
图3观测点位分布图
-->Fig. 3Configuration of the measurement sites
-->
相对加速率能够度量风速在风蚀坑内各部位的变化情况,是评价气流变化的重要指标,本文采用Jackson等[30]定义的公式:
式中:
3.2 输沙率观测
用阶梯式集沙仪观测风蚀坑距地表0.2 m高度内的输沙量。共布设14个观测点(图3a,L1~L12、L14、L17),其中侵蚀坑12个,积沙区2个。输沙量观测与水平流场测量同步进行。根据风向风速稳定性和地面起沙等情况,以5~10 min为间隔共进行3次集沙,采集的沙粒样品经风干处理后用千分之一电子天平(精度0.001 g)称重记录,并以观测高度(0~0.2 m)内单位时间单位宽度的总输沙量表示输沙率(mg min-1 cm-1)。4 结果与分析
气流观测期间,参考站距地面4 m高处的风向风速变化(图4)。观测期间,风况较为稳定,风速均大于6 m s-1,多数集中于8~10 m s-1;风向变化于W-WNW(265°~305°)之间,且绝大多数来自WNW(281.25°~303.75°)。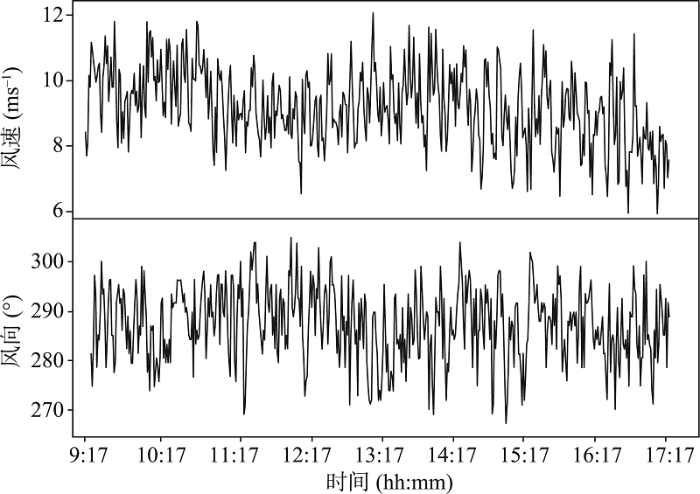 显示原图|下载原图ZIP|生成PPT
图4气流观测期间参考站(4.0 m)风况
-->Fig. 4Wind conditions during airflow observations measured at the top of the reference tower (z = 4.0 m)
-->
4.1 水平流场
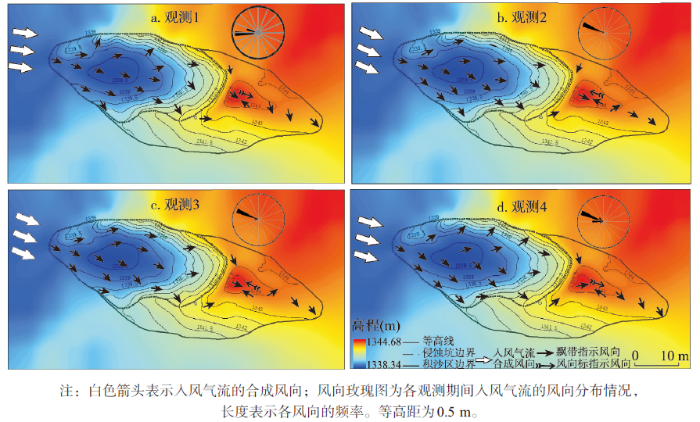
4.1.1 风向变化 将各点所测风向结果绘制成图(图4),4次观测中气流进入风蚀坑的合成风向分别为279°、294°、292°、286°,与侵蚀坑纵轴夹角分别为3°、12°、10°、4°。气流从入风口进入侵蚀坑,在侵蚀坑背风坡坡脚处(L3、L4)发生了水平方向上分离,气流沿着两个侧壁及侵蚀坑底部向下风向扩散。其中,沿中轴流动的气流以基本平行于轴线的方向流向积沙区;沿南侧壁流动的气流分别在南侧壁中部及侵蚀坑东南侧缺口溢出。沿北侧壁流动的气流出现两种情况:在观测1和观测4期间,气流越过北侧壁向外溢出;在观测2及观测3期间,气流沿北侧壁向东流动,并从东北侧溢出。积沙区中,气流从侵蚀坑东缘溢出后由坑缘向顶部汇聚,越过丘顶的气流在背风坡中上部(L16)发生分离而形成反向气流。而且,由该点风向标(0.5 m)和飘带(0.3 m)所指示的方向(图5),在观测1和观测4中二者相反;在观测2和观测3中一致。背风坡中部的风向在观测1和观测4中为NW,在观测2和观测3中为SW。背风坡下部及坡脚风向均以NW为主。
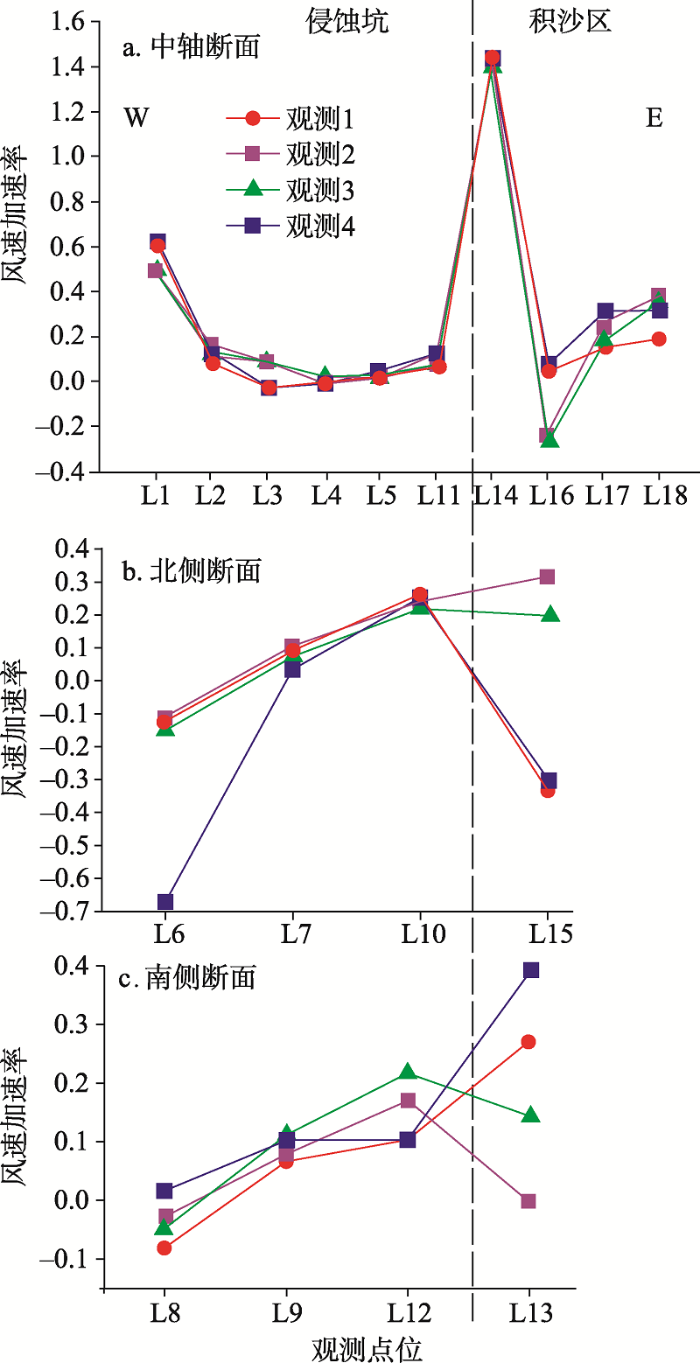
4.1.2 风速变化 图6是风速加速率沿风蚀坑各纵断面的分布。在与风向同步的4次观测中,参考点0.3 m高处风速分别是5.6 m s-1、6.3 m s-1、5.1 m s-1和4.0 m s-1。在纵轴线上(图6a),气流到达侵蚀坑西缘(L1)时风速增加46%~60%,进入风蚀坑后向坑底(L4)减小,之后又向侵蚀坑东缘(L11)逐渐增加;在积沙区,由坑缘至积沙区顶(L14)剧增至最高值,到背风坡上部(L16)锐减,之后逐渐增加。侵蚀坑西缘(L1)及积沙区背风坡上部(L16)的风速加速率,在观测1及观测4中风速高于观测2和观测3;侵蚀坑内的最低风速加速率,在观测1和观测4中出现在西坡坡脚(L3),而在观测2及观测3中出现在侵蚀坑底部(L4)。
 显示原图|下载原图ZIP|生成PPT
图5风蚀坑内气流方向变化
-->Fig. 5Wind directions within the blowout
-->
沿侵蚀坑北、南两侧壁(图6b、6c),风速加速率均由西向东增加,但到积沙区出现两种情况:在观测1和观测4中,北侧(L15)减小,南侧(L13)增加;在观测2和观测3中,北侧(L15)增加,南侧(L13)减小。此外,在侵蚀坑东南角(L12),风速加速率在观测1和观测4的值低于观测2和观测3的值(图6b、6c)。
 显示原图|下载原图ZIP|生成PPT
图6近地表(0.3 m)纵断面风速观测结果
-->Fig. 6Fractional speed-up ratio along the longitudinal profiles (z = 0.3 m)
-->
4.2 输沙率
图7是沿风蚀坑纵轴线和侵蚀坑3个横断面的输沙率及相应风速(集沙期间的平均风速)变化。在3次观测之间,各断面的风速变化模式相对固定,但输沙率变化出现较大的差异。沿纵轴方向(图7a、7e、7i),输沙率变化与风速变化不一致,甚至出现相反情况,如侵蚀坑内的输沙率普遍大于积沙区,输沙率最高值出现在风速最低的坑底(L4),输沙率最低值出现在风速最高的积沙区顶(L14)。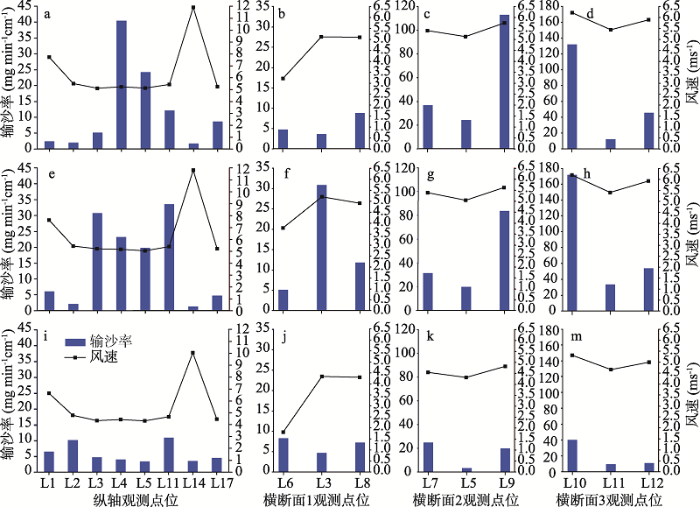 显示原图|下载原图ZIP|生成PPT
图7各断面单宽输沙率与风速对比(a~d 第1次观测;e~h第2次观测;i~m第3次观测)
-->Fig. 7Sand transport rate and simultaneous time-averaged wind speed (a-d for run 1; e-h for run 2; i-m for run 3)
-->
在横断面(图7b~7d、图7f~7g、图7j~7m),输沙率与风速变化趋势基本一致。而且,除断面1的第2次观测(图7f)之外,南、北两侧各点的输沙率均高于对应纵轴线点的输沙率;在断面1和断面2,前两次观测中南侧壁(L8和L9)的输沙率高于对应的北侧壁(L6和L7);在横断面3,三次观测中南侧壁(L10)输沙率低于北侧壁(L11)。
此外,各观测期间横断面的结果(图7b~7d、图7f~7g、图7j~7m)还表明,气流分别沿南北侧壁自西向东加速,这与水平流场观测期间的结论一致。北侧壁的输沙率同样表现出由西向东增加的趋势,而南侧壁的输沙率由西向东表现出先增加再减小的趋势。
5 讨论
观测结果显示,不同方向风与地形之间的相互作用导致风蚀坑气流结构发生明显的变化。风向与风蚀坑轴线之间的夹角,以及侵蚀坑内各坡面相对于风向的性质和坡度等决定着坑内气流性质。沙丘背风测气流实验研究表明[3, 31],风向与沙丘走向小角度斜交时在较陡(> 20°)背风坡发生偏转成为沿走向的次生气流,但在坡度小(< 20°)的背风坡保持原来的方向。由图5,对于偏西风而言,侵蚀坑入风口处的西坡始终是背风坡,但因坡度较缓,进入坑内的气流在西坡成为附着未偏向流,因此侵蚀坑纵轴线上气流始终与走向一致。侵蚀坑内其余地形对不同方向风而言其性质明显不同。在观测1和观测4中,风向与纵轴线几乎平行,此时,侵蚀坑南侧壁西半段(坡向东北)成为背风坡,由于坑缘线与风向之间小角度斜交,进入侵蚀坑的气流偏转为沿南侧壁的次生气流;北侧壁东半段(坡向西南)成为迎风坡,进入侵蚀坑的部分气流在此坡直接向上爬升溢出。在观测2和观测3中,风向与纵轴线走向之间左偏10°左右,与北侧壁走向成小角度斜交,进入侵蚀坑的气流在背风坡偏转为沿北侧壁的次生气流;与侵蚀坑南侧壁走向平行,气流直接沿南侧壁走向运动。气流方向与地形之间的相对关系影响风蚀坑风速分布。研究表明[4, 32],风的入射角和坡面形态决定风的加速或减速。研究风蚀坑发育在固定沙丘西南坡顶部附近,气流达到侵蚀坑西缘时气流加速,而且风速加速率与风的入射角成反比(图6a)。在纵轴线,近地表风速变化曲线与地形变化趋势一致。气流进入侵蚀坑后发生扩散而减速,减速区范围随入风角增加而东移。气流在积沙区迎风坡的爬升过程中,由于地形的迅速抬升,使得气流被压缩而加速,直至积沙区顶部风速达到最大;越过丘顶,受植被的影响[33-35]气流在背风坡发生分离形成水平轴的涡流,导致背风坡上部风速剧降至最低值,之后顺风向逐渐恢复。气流沿侵蚀坑南北侧壁向东加速(图6b、6c),这与Hugenholtz等[25]的观测结果一致。但是,到达积沙区丘顶南北两侧(L13和L15)时,南、北侧壁作为背风坡时气流加速,而作为迎风坡时则减速。
研究风蚀坑发育在内陆固定沙丘,积沙区沉积物主要来自于侵蚀坑内部,因此输沙率对植被、气流及地形等因素的响应更加敏感[28]。由图7,风速变化与输沙率沿中轴的变化趋势一致性较差,其中积沙区顶部植被的影响导致输沙率降低,至于侵蚀坑底部的相对高输沙率,目前还无法解释。在横断面,风速及输沙率变化模式保持一致,且风速加速区(横断面2和横断面3)两侧输沙率高于相应轴向输沙率反映了风蚀坑底部的侵蚀。南北两个侧壁输沙率沿程增加,也反映了偏转气流向东输送沙物质至积沙区。其中,侵蚀坑东北侧壁(L10)的风速及输沙率均高于东南侧壁(L12),说明与南坡相比,北坡向积沙区提供了更多的沉积物。这可能是造成积沙区北部略高于南部的原因,也将导致侵蚀坑两侧壁的不等速扩张。
6 结论
(1)气流进入风蚀坑后,向坑底扩散减速,向积沙区顶辐合加速,在积沙区背风坡分离减速,以及向下风向逐渐恢复。(2)区域风向的微小变化导致风蚀坑气流模式发生较大的变化。入风方向与轴向一致(< 10°)时,减速区西移,气流沿南侧壁向东加速,在北侧壁向外溢出,积沙区北侧风速小于南侧;入风方向与轴向斜交(≥ 10°)时,减速区东移,气流沿南、北侧壁向东加速,积沙区北侧风速大于南侧。
(3)气流方向、地形和植被影响风蚀坑输沙率,进而控制风蚀坑蚀积格局。积沙区沙物质全部来自侵蚀坑,植被对风沙流的拦截作用使积沙区顶加积增高。纵向气流加深侵蚀坑,斜交气流清理两侧壁松散沙物质,进而使风蚀坑加深和纵向延伸并伴随侧向扩展。
The authors have declared that no competing interests exist.
参考文献 原文顺序
文献年度倒序
文中引用次数倒序
被引期刊影响因子
| [1] | |
| [2] | 对简单横向沙丘的形态特征、气流、表面以及被输移的沙物质组成的观测和分析表明 ,沙丘形态特征和表面物质组成的分异是导致沙物质在迎风坡坡脚不能沉积并向下风向输送的主要原因。对沙丘背风坡气流观测表明 ,在沙丘背风坡贴近地面的一定高度气流仍能保持一定的强度 ,其输沙方向与沙丘走向近似于垂直 ,并有相当强的输沙能力 ,但其作用被限制在背风坡范围内 ,这对保持沙丘形态有重要的作用。在野外风沙观测中气流的湍流和波动被忽略 ,平均风速并不能完全反映野外气流的性质。在低 -中强度风沙活动过程中 ,被输送的沙物质的粒度组成与下垫面物质有明显的差异 ,被输送沙物质的平均粒径小于下垫面沙平均粒径 ,输沙过程是一典型的随机过程。特定区域内 ,一定粒径范围内的沙物质不断被堆积而形成沙丘 ,经过一系列的动力学过程 ,最终形成处于动态平衡的区域沙丘地貌分布格局 . 对简单横向沙丘的形态特征、气流、表面以及被输移的沙物质组成的观测和分析表明 ,沙丘形态特征和表面物质组成的分异是导致沙物质在迎风坡坡脚不能沉积并向下风向输送的主要原因。对沙丘背风坡气流观测表明 ,在沙丘背风坡贴近地面的一定高度气流仍能保持一定的强度 ,其输沙方向与沙丘走向近似于垂直 ,并有相当强的输沙能力 ,但其作用被限制在背风坡范围内 ,这对保持沙丘形态有重要的作用。在野外风沙观测中气流的湍流和波动被忽略 ,平均风速并不能完全反映野外气流的性质。在低 -中强度风沙活动过程中 ,被输送的沙物质的粒度组成与下垫面物质有明显的差异 ,被输送沙物质的平均粒径小于下垫面沙平均粒径 ,输沙过程是一典型的随机过程。特定区域内 ,一定粒径范围内的沙物质不断被堆积而形成沙丘 ,经过一系列的动力学过程 ,最终形成处于动态平衡的区域沙丘地貌分布格局 |
| [3] | 对腾格里沙漠东南缘格沙丘主、副梁和新月形形沙丘表面气流的野外发现分离流、附着未偏向流和附着偏向流等3种背风坡次生气流。前者以弱的反向流为特征,多发生在横向气流条件下,坡度较陡的背风坡上;后二者具有相对高的风速,多发生在坡度缓和的背风坡上,其方向在横向气流条件下保持原来的方向,在斜向气流作用下发生偏转,且其强度为原始风入射角的余统函数,根据3种次生气流强度,方向等特征,阐述了其相应的风成沉积过程和可能产生的层理类型,并对利用风成交错层理恢复古气流环境中的有关问题作了初步探讨。 . 对腾格里沙漠东南缘格沙丘主、副梁和新月形形沙丘表面气流的野外发现分离流、附着未偏向流和附着偏向流等3种背风坡次生气流。前者以弱的反向流为特征,多发生在横向气流条件下,坡度较陡的背风坡上;后二者具有相对高的风速,多发生在坡度缓和的背风坡上,其方向在横向气流条件下保持原来的方向,在斜向气流作用下发生偏转,且其强度为原始风入射角的余统函数,根据3种次生气流强度,方向等特征,阐述了其相应的风成沉积过程和可能产生的层理类型,并对利用风成交错层理恢复古气流环境中的有关问题作了初步探讨。 |
| [4] | 对腾格里沙漠东南缘格状沙丘主、副梁和新月形沙丘断面风速的野外观测结果表明,迎风坡风速放大率、背风坡气流的方向和强度随区域气流、坡面形态而不同。迎风坡风速放大率对沙丘形态的作用在于增加丘顶区域的输沙率和活动性;背风坡气流不仅影响沙丘形态而且控制沙丘动力学过程。在横向气流条件下,风速放大率使沙丘迎风坡随区域气流强度的增加变长变缓,背风坡受分离流控制使沙丘迁移;在双向-斜向气流条件下,沙丘丘顶处于侵蚀亚环境而两坡变陡变短,背风坡受附着偏向流控制使沙丘纵向延伸。 . 对腾格里沙漠东南缘格状沙丘主、副梁和新月形沙丘断面风速的野外观测结果表明,迎风坡风速放大率、背风坡气流的方向和强度随区域气流、坡面形态而不同。迎风坡风速放大率对沙丘形态的作用在于增加丘顶区域的输沙率和活动性;背风坡气流不仅影响沙丘形态而且控制沙丘动力学过程。在横向气流条件下,风速放大率使沙丘迎风坡随区域气流强度的增加变长变缓,背风坡受分离流控制使沙丘迁移;在双向-斜向气流条件下,沙丘丘顶处于侵蚀亚环境而两坡变陡变短,背风坡受附着偏向流控制使沙丘纵向延伸。 |
| [5] | 对新月形沙丘和沙丘链丘表流场风向、风速和蚀积量进行测定。迎风坡均表现风蚀,背风坡和兽角处表现堆积,蚀积特征、速度与流场中风速、风向相吻合。 . 对新月形沙丘和沙丘链丘表流场风向、风速和蚀积量进行测定。迎风坡均表现风蚀,背风坡和兽角处表现堆积,蚀积特征、速度与流场中风速、风向相吻合。 |
| [6] | Abstract Vertical profiles of the streamwise mass flux of blown sand in the near-bed (610·3061m s 611 . A separate near-bed region of more intense transport below 1961mm is identified which carries 80 per cent of the total mass flux. This region is evident in some previous field and wind tunnel data but not in profiles simulated by numerical models. Ventilated passive sand traps underestimate mass flux in this region by 37 per cent. At slow or moderate wind speeds a third significant region below 261mm is observed. These regions are likely to be related to grain populations in successive saltation, low-energy ejections and intermittent bed contact, respectively. Optical measurements reveal locally high grain concentrations at some elevations below 561mm; these heights scale with transport rate, mass flux gradient and wind speed. Copyright 08 1999 John Wiley & Sons, Ltd. |
| [7] | Not Available |
| [8] | Abstract Longitudinal dune fields characterized by nearly uniform interdune spacing are distinguished from longitudinal dune fields characterized by fairly variable interdune spacing and high frequencies of dune coalescence. The empirical and theoretical evidence indicating that the former may be due to helical air currents aligned with the dunes is reviewed. Hypotheses arguing that the latter may arise indirectly from horizontal pressure gradients or bidirectional wind regimes are discussed. Evenly spaced linear sand banks aligned with tidal currents may be shown mathematically to result from energy optimalization within two-dimensional, sand-transporting flow regimes, and a similar simple or non-rotational flow model is considered for the problem of desert longitudinal dunes. An initial complex or rotational flow analysis is undertaken to discern the likely significance of roll vortices in desert sediment transport. An 鈥榚volutionary timescale鈥 is estimated for the formation of desert longitudinal dune fields. A simple analysis is performed for the effect of regional sand mass change on longitudinal dune field ordering. Recommendations are made for future empirical and theoretical research. |
| [9] | <FONT face=Verdana>二次流在沙丘形成和形态维持过程中扮演着重要角色。沙丘迎风坡气流加速和背风侧气流分离是最常见的二次流形式。沙丘背风侧的二次流,尤其是气流分离形成的分离涡和气流重附对沙丘背风坡的塑造、沙丘间距和排列模式都具有重要的控制作用。因此,设计了一系列具有不同迎风坡坡度的横向沙丘模型,采用粒子图像测速技术,通过风洞实验模拟了沙丘背风侧的气流分离和重新附着。实验结果表明,当来流风速垂直于沙丘脊线时,沙丘背风侧的气流重附距离介于4\^8 H~10\^8 H之间(H为沙丘高度),最大重附距离出现在迎风坡坡度为15°的沙丘背风侧;沙丘迎风坡坡度是控制背风侧气流重附距离的主要因素,而自由风速对气流重附距离的控制作用较小。根据实验结果,还讨论了气流分离与重附对沙粒运移和沙丘形态维持的沉积学意义。</FONT> . <FONT face=Verdana>二次流在沙丘形成和形态维持过程中扮演着重要角色。沙丘迎风坡气流加速和背风侧气流分离是最常见的二次流形式。沙丘背风侧的二次流,尤其是气流分离形成的分离涡和气流重附对沙丘背风坡的塑造、沙丘间距和排列模式都具有重要的控制作用。因此,设计了一系列具有不同迎风坡坡度的横向沙丘模型,采用粒子图像测速技术,通过风洞实验模拟了沙丘背风侧的气流分离和重新附着。实验结果表明,当来流风速垂直于沙丘脊线时,沙丘背风侧的气流重附距离介于4\^8 H~10\^8 H之间(H为沙丘高度),最大重附距离出现在迎风坡坡度为15°的沙丘背风侧;沙丘迎风坡坡度是控制背风侧气流重附距离的主要因素,而自由风速对气流重附距离的控制作用较小。根据实验结果,还讨论了气流分离与重附对沙粒运移和沙丘形态维持的沉积学意义。</FONT> |
| [10] | 在沙丘动力系统中,存在沙丘形态、气流、沙粒运移三者之间复杂的相互作用。通过风洞实验的方法,针对不同形态的6组横向沙丘模型,采用粒子图像测速系统,测量了模型沙丘周围气流水平速度和垂直速度的变化规律。实验结果表明,横向沙丘迎风坡水平气流存在1.28~1.89之间的加速率,垂直气流存在上扬趋势,这二者均有随沙丘迎风坡坡度增大而增大的趋势。在横向沙丘背风坡,由于气流的分离,水平气流速度减小并出现反向,其大小约为自由风速的17%;垂直气流速度存在下沉趋势,其最大沉速出现在气流重附点附近;背风坡气流速度的变化受沙丘迎风坡坡度影响较小,受自由风速的影响较大。沙丘对气流速度的改变在近地层较为显著,随着高度的增加地形影响逐渐减小。 . 在沙丘动力系统中,存在沙丘形态、气流、沙粒运移三者之间复杂的相互作用。通过风洞实验的方法,针对不同形态的6组横向沙丘模型,采用粒子图像测速系统,测量了模型沙丘周围气流水平速度和垂直速度的变化规律。实验结果表明,横向沙丘迎风坡水平气流存在1.28~1.89之间的加速率,垂直气流存在上扬趋势,这二者均有随沙丘迎风坡坡度增大而增大的趋势。在横向沙丘背风坡,由于气流的分离,水平气流速度减小并出现反向,其大小约为自由风速的17%;垂直气流速度存在下沉趋势,其最大沉速出现在气流重附点附近;背风坡气流速度的变化受沙丘迎风坡坡度影响较小,受自由风速的影响较大。沙丘对气流速度的改变在近地层较为显著,随着高度的增加地形影响逐渐减小。 |
| [11] | The interaction between dunes and the primary wind results in a complex pattern of secondary airflow on the lee side of dunes. From 15 dunes studied during transverse flow conditions at Padre Island in Texas, White Sands in New Mexico, and the Algodones in California, distinct flow regions can generally be recognized, with the overall flow structure comparing favourably to that proposed for subaqueous bedforms. Downwind of dunes with flow separation is a back‐flow eddy that extends about four dune‐brink heights downwind from the brink of the dune. Beyond the separation cell, the velocity profiles can be divided into regions based upon segments separated by ‘kinks’ in the velocity profiles. The is an area above the dunes of relative high wind speed but low velocity gradient. Beneath the interior is the , which consists of two layers. The exhibits an uppermost portion where the flow decelerates while the remainder exhibits accelerating flow, so that the overall velocity gradient decreases downwind. The exhibits low velocity gradients and wind speeds that accelerate downwind at all heights, but primarily near the top of the layer, thereby causing the velocity gradient to increase downwind. At about eight dune heights downwind, the upper and lower wakes equilibrate to a single profile with the kink between them no longer apparent. The lowest recognizable region is the . It is recognized by a relatively steep velocity gradient below the wake, and never exceeds a few tens of centimetres in height for our data set. Because of acceleration and increasing shear stress within this layer, interdune flats are at least potentially erosional. Overall, the wake and internal boundary layer show a downward transfer of momentum from upper regions so that the flow recovers. Where flow separation does not occur, simple flow expansion down the lee‐face causes flow deceleration. |
| [12] | Not Available |
| [13] | |
| [14] | |
| [15] | <FONT face=Verdana>呼伦贝尔沙质草原风蚀坑发育于宽单峰中能风况环境,是该区主要风沙地貌类型。对碟形坑表面气流的观测结果显示,气流进入风蚀坑后,在入风口扩散,风速开始降低至坑底达到最低;在坑后缘出风口汇集形成急流,风速剧增至坑后积沙顶部风速达到最高值。风蚀坑后缘在风沙流的磨蚀作用下后退,风蚀坑顺风向扩展,同时此处较大的剪切风速和输沙率使大量来自坑内的沙物质沉积到坑后草地上呈扇状蔓延。呼伦贝尔沙质草原风蚀坑在来自西北、西和西南方向风的交替作用下,向东南、东和东北方向扩展而生成。随着风蚀坑深度和水平尺度的增加,最终可能沿强风能方向或合成输沙方向扩展成为大型的槽形坑。<BR></FONT> . <FONT face=Verdana>呼伦贝尔沙质草原风蚀坑发育于宽单峰中能风况环境,是该区主要风沙地貌类型。对碟形坑表面气流的观测结果显示,气流进入风蚀坑后,在入风口扩散,风速开始降低至坑底达到最低;在坑后缘出风口汇集形成急流,风速剧增至坑后积沙顶部风速达到最高值。风蚀坑后缘在风沙流的磨蚀作用下后退,风蚀坑顺风向扩展,同时此处较大的剪切风速和输沙率使大量来自坑内的沙物质沉积到坑后草地上呈扇状蔓延。呼伦贝尔沙质草原风蚀坑在来自西北、西和西南方向风的交替作用下,向东南、东和东北方向扩展而生成。随着风蚀坑深度和水平尺度的增加,最终可能沿强风能方向或合成输沙方向扩展成为大型的槽形坑。<BR></FONT> |
| [16] | 根据野外对呼伦贝尔沙质草原槽形风蚀坑表面二次流的观测结果,利用相对风速(<i>v</i>/<i>v</i><sub>R400</sub>)比较不同部位之间气流在水平方向上的变异情况。发现:槽形风蚀坑内气流结构紊乱,坑内前部位置出现风速随高度降低的现象,形成反向回流;风蚀坑内在斜向气流的情况下有螺旋环流产生,由于气流聚集,在坑后部形成的高速气流容易将大量沙物质搬运到坑后;在坑口积沙区坡脚遇阻减速后气流辐散溢出。认为槽形风蚀坑是在碟形坑的基础上,沿强风能方向延伸扩展,3个出风口最终合并而形成的大型风蚀地貌形态。 . 根据野外对呼伦贝尔沙质草原槽形风蚀坑表面二次流的观测结果,利用相对风速(<i>v</i>/<i>v</i><sub>R400</sub>)比较不同部位之间气流在水平方向上的变异情况。发现:槽形风蚀坑内气流结构紊乱,坑内前部位置出现风速随高度降低的现象,形成反向回流;风蚀坑内在斜向气流的情况下有螺旋环流产生,由于气流聚集,在坑后部形成的高速气流容易将大量沙物质搬运到坑后;在坑口积沙区坡脚遇阻减速后气流辐散溢出。认为槽形风蚀坑是在碟形坑的基础上,沿强风能方向延伸扩展,3个出风口最终合并而形成的大型风蚀地貌形态。 |
| [17] | 呼伦贝尔沙质草地碟形风蚀坑长轴走向呈WNW-ESE。野外观测结果表明,风向与碟形风蚀坑长轴走向关系决定了风蚀坑内部的气流模式,右斜交与垂直气流促使风蚀坑横向扩展与深挖,平行与左斜交气流有利于侵蚀区内部沙物质的向外输送并导致风蚀坑沿长轴向延伸。右斜交及垂向气流在碟形坑南缘产生顺时针向的垂直轴涡流,而平行与左斜交向气流在西北缘产生逆时针向的垂直轴涡流。沿长轴向,气流进入风蚀坑边缘发生分离减速,在风蚀坑底部重新附着,沿出风段坡面开始加速上升至坑后沙丘顶部,在坑后沙丘背风坡气流发生扩散减速。在横断面或弧形断面气流以单增或单减的形式存在。观测期间风蚀坑总体上以堆积作用为主,区域风能大小决定了蚀积作用强弱,而输沙方向与风蚀坑长轴向夹角决定蚀积空间分布格局。 . 呼伦贝尔沙质草地碟形风蚀坑长轴走向呈WNW-ESE。野外观测结果表明,风向与碟形风蚀坑长轴走向关系决定了风蚀坑内部的气流模式,右斜交与垂直气流促使风蚀坑横向扩展与深挖,平行与左斜交气流有利于侵蚀区内部沙物质的向外输送并导致风蚀坑沿长轴向延伸。右斜交及垂向气流在碟形坑南缘产生顺时针向的垂直轴涡流,而平行与左斜交向气流在西北缘产生逆时针向的垂直轴涡流。沿长轴向,气流进入风蚀坑边缘发生分离减速,在风蚀坑底部重新附着,沿出风段坡面开始加速上升至坑后沙丘顶部,在坑后沙丘背风坡气流发生扩散减速。在横断面或弧形断面气流以单增或单减的形式存在。观测期间风蚀坑总体上以堆积作用为主,区域风能大小决定了蚀积作用强弱,而输沙方向与风蚀坑长轴向夹角决定蚀积空间分布格局。 |
| [18] | . Blowouts are common landforms found within coastal dunes. Their dynamics are primarily driven by aeolian transport caused by surface wind stress, though patterns of deflation and deposition within blowouts are poorly understood as near surface wind flow is complex. Three-dimensional wind flows around blowouts have yet to be properly quantified, especially within zones of separation, re-attachment and acceleration. This has been largely due to inadequate measurement of airflow and a lack of suitable airflow models. With this in mind, we present results from a study that has quantified alongshore and oblique onshore wind flow dynamics over a bowl blowout on the Belmullet Peninsula, Ireland. Using ultrasonic three-dimensional anemometry (measuring at 50 Hz) and three-dimensional computational fluid dynamic (CFD) modelling, we measure and model for the first time in 3D a detailed picture of the heterogeneity of wind flow over this type of terrain. |
| [19] | This paper examines the aeolian dynamics of a deep bowl blowout within the foredune of the Greenwich Dunes, on the northeastern shore or Prince Edward Island, Canada. Masts of cup anemometers and sonic anemometers were utilized to measure flow velocities and directions during a strong regional ESE (offshore) wind event. The flow across the blowout immediately separated at the upwind rim crest, and within the blowout was strongly reversed. High, negative vertical flows occurred down the downwind (but seaward) vertical scarp which projected into the separation envelope and topographically forced flow back into the blowout. A pronounced, accelerated jet flow existed near the surface across the blowout basin, and the flow exhibited a complex, anti-clockwise structure with the near-surface flow following the contours around the blowout basin and lower slopes. Significant aeolian sediment transport occurred across the whole bowl basin and sediment was delivered by saltation and suspension out the blowout to the east. This study demonstrates that strong offshore winds produce pronounced topographically forced flow steering, separation, reversal, and more complex three-dimensional motions within a bowl blowout, and that such winds within a bowl blowout play a notable role in transporting sediment within and beyond deep topographic hollows in the foredune. (C) 2011 Elsevier B.V. All rights reserved. |
| [20] | This paper demonstrates that wind flow behaviour within blowouts throughout this range of wind speeds is governed by topography and is relative to, but does not change structurally with incident wind speed. As a result the extent of streamline compression, expansion, steering and reversal remain constant. |
| [21] | SMYTH, TAG., JACKSON, D.W.T., COOPER, JAG., 2011,. Computational Fluid Dynamic modeling of Three-Dimensional airflow over dune blowouts. Journal of Coastal Research, SI 57 (Proceedings of the 11th International Coastal Symposium), 314 - 318. Szczecin, Poland, ISBN Blowout enlargement is primarily driven by aeolian transport, where high velocity winds entrain and remove sediment from the landform. However patterns of deflation in blowouts are poorly understood as near surface airflow in a blowout is complex. In this study three-dimensional airflow during a light (3.93 m/s) and moderate (8.98 m/s) onshore wind event was calculated using the two-equation Renormalized Group k-epilson airflow turbulence model, by the Computational Fluid Dynamics software OpenFOAM. The saucer blowout located on the coastal foredune in the Belmullet Peninsula, Western Ireland, measures 100 metres long, 60 metres wide and 13 metres deep. Results show that during both wind events flow separates and reverses as it enters the blowout over the foredune crest, as it reattaches it is steered, diverging from the centre of the blowout and before topographically accelerating over the rim crest. Flow which enters the throat of the blowout accelerates and remains directionally unchanged before accelerating up the deposition lobe slope, where flow at the crest was simulated as being 100% faster at the crest than velocity simulated on the beach. In lee of the blowout at the depositional lobe airflow decelerated and a large zone of flow separation and reversal was created. Whilst relative change of velocity and direction at I metre above the surface of the blowout displayed similar behaviour during both wind events, flow in the lee during the light wind event did not appear to fully reattach and recover to velocity levels on the beach. |
| [22] | ABSTRACT This study examines the spatial distribution of wind speed across a coastal dune system located at Jockey's Ridge State Park, North Carolina. The study area consists of a trough blowout through a foredune ridge, and the landforms that have developed behind the foredune. Wind speed and direction were measured simultaneously with single sensors placed at a fixed height in 13 locations across the blowout/dune complex. Fractional wind speed-up is computed for sampling stations using data from a mast located on the beach as the reference. Results show that wind speeds were generally accelerated across the study site. The highest speeds were recorded on the foredune ridges adjacent to the blowout. Wind was accelerated through the center of the blowout throat and along the downwind lateral wall. Further into the blowout, at the base of the ramp to the depositional lobe, higher wind speeds shifted to the upwind lateral wall and continued to accelerate up the ramp as air exited to the rear. Significant variations in the wind speed-up pattern were associated with different wind approach angles, with greater speed-up occurring when the winds were aligned normal to the dune system. The speed-up decreased as the angle of approach became increasingly oblique to the ridge. The patterns of wind speed-up across the site point to the influence of topography on airflow. To quantify the relationship, measures of several topographic variables were obtained along sample transects running upwind from each sample station along flow lines representing different wind approach angles. Examination of correlation coefficients between wind speed-up and topographic variables suggests that for groups of stations with similar topographic characteristics, 30鈥50% of the variations in speed-up may be explained by the upwind topographic variability. Copyright 漏 2014 John Wiley & Sons, Ltd. |
| [23] | The spatial variability of air flow through complex topography is an important, but not fully understood, component of dune development and dynamics. This study examines the spatial variability of the wind field in a linear blowout in coastal dunes at Jockey's Ridge State Park, on the Outer Banks of North Carolina. A spatial array of single-height anemometers and wind vanes were placed within the blowout. Topography exerted a significant steering effect when onshore winds approached from directions within 50 degrees of the blowout axis. Under those conditions wind flow in the blowout aligned to the axis regardless of approach angle, maximizing the potential for erosion and transport in the trough. In other locations aspect variations caused deflection both proportional and disproportional to changes in the approaching wind. When prevailing winds approached from directions more oblique than 50 degrees to the blowout axis, topographic steering through the blowout trough was reduced and secondary flow generated by flow separation over the trough became more prominent. During those approach angles, wind directions and speeds within the upper blowout trough became erratic as vortices and turbulence dominated the flow, minimizing transport potential. The changing characteristics of airflow in the blowout relative to differing approach angles has implications on dune development and variations in transport potential under changing conditions. Copyright (c) 2013 John Wiley & Sons, Ltd. |
| [24] | Airflow patterns through a saucer blowout are examined from wind speed and direction measurements made during a chinook wind event. The blowout long-axis is oriented east-west with a broad depositional apron on the east side. Wind directions during the event rotated from south-westerly to westerly, permitting an assessment of oblique and axis-parallel flows. Results show that airflow passing ov... |
| [25] | Abstract Blowouts are the most regionally pervasive active aeolian landform on the northern Great Plains of North America. This study reports a long-term investigation into the morphological development of two adjacent blowouts in a continental dune field. The blowouts were monitored for a decade in the Bigstick Sand Hills of southwestern Saskatchewan, Canada. Topographic changes were determined from dense arrays of erosion pins in each blowout (1 per 4 m 2 , n = 171; and 1 per 16 m 2 , n = 150). Pin measurements were made 16 times between May 1994 and May 2004. Over the decade both blowouts expanded and more than doubled in volume. Differences in form–flow interactions have caused the larger of the two blowouts to deposit more than a metre of sediment within the deflation basin, and the smaller blowout to erode by more than a metre. A negative feedback effect was triggered when the larger blowout reached a critical size around 1994 (60 m × 36 m × 8·1 m, length × width × height) when sediment was no longer eroded from the deflation basin. A positive feedback in the smaller blowout continues to facilitate erosion from the deflation basin. Monthly observations since 2002 indicate that aspect plays an important role in the development of these blowouts by creating a spatial asymmetry in sediment availability. Sediment is more readily available throughout the year on south-facing slopes, which receive greater insolation than north-facing slopes and are often drier and more frequently thawed in this cold-climate environment. Comparisons between climate data from a remote meteorological station 45 km to the southwest and sediment transport indices developed from the erosion pin data produced very few correlations significant at the 95 per cent confidence level. Nevertheless, the signs of the correlation coefficients indicate that sediment erosion and deposition in both blowouts respond similarly to the following climate variables recorded at the remote station: (i) the amount of precipitation, (ii) the transport capacity of the wind and (iii) transporting winds from a directional wedge between 180 and 330°. Taken altogether, the results from this study highlight the importance of climate and feedback effects in blowout development that may be extended to other blowouts in continental and coastal settings. Copyright 08 2006 John Wiley & Sons, Ltd. |
| [26] | This paper explores historical evolution of blowouts at Cape Cod National Seashore (CCNS), USA — a site that hosts one of the world's highest densities of active and stabilized blowouts. The Spatial–Temporal Analysis of Moving Polygons (STAMP) method is applied to a multi-decadal dataset of aerial photography and LiDAR to extract patterns of two-dimensional movement and morphometric changes in erosional deflation basins and depositional lobes. Blowout development in CCNS is characterized by several geometric (overlap) and movement (proximity) responses, including: i) generation and disappearance, ii) extension and contraction, iii) union or division, iv) clustering and v) divergence by stabilization. Other possible movement events include migration, amalgamation and proximal stabilization, but they were not observed in this study. Generation events were more frequent than disappearance events; the former were highest between 1985 and 1994, while the latter were highest between 2000 and 2005. High rates of areal change in erosional basins occurred between 1998 and 2000 (+02393202m 2 02a 611 ), the lowest rate (+0233302m 2 02a 611 ) between 2005 and 2009, and the maximum rate (+02458902m 2 02a 611 ) between 2009 and 2011. Union events occurred mostly in recent years (2000–2012), while only one division was observed earlier (1985–1994). Net areal changes of lobes showed gradual growth from a period of contraction (6102111902m 2 02a 611 ) between 1998 and 2000 to rapid extension (+02203002m 2 02a 611 ) by 2010, which is roughly concurrent with rapid growth of erosional basins between 2005 and 2009. Blowouts extended radially in this multi-modal wind regime and, despite odd shapes initially, they became simpler in form (more circular) and larger over time. Net extension of erosional basins was toward ESE (109°) while depositional lobes extended SSE (147°). Lobes were aligned with the strongest (winter) sand drift vector although their magnitude of areal extension was only 33% that of the basins. These differences in extension responses likely result from more complex and evolving flow-form interactions inside erosional basins. Historical photographs and CCNS documents suggest that blowout evolution may be influenced by land-use changes, such as revegetation campaigns in 1985 that were followed by high blowout generation. High magnitude regional storm events (e.g., hurricanes) also play a role. The analytical framework presented provides a systematic means for two-dimensional geomorphic change detection and pattern analysis that can be applied to other landscapes. |
| [27] | Aeolian dune fields mantle the Earth in both vegetated (stable) and unvegetated (active) states. Changes in state are poorly understood; in particular, little is known about reactivation (devegetation) from a vegetated state. Available evidence indicates that dune reactivation can be driven by changes in aridity, increased wind speed, fire, biogenic disturbance, human disturbance, or a combination of the previous. How these controls fit together and define the reactivation potential of dune fields is presently unknown. Here we develop a framework to describe reactivation potential for a specific case: presently vegetated, supply-limited dune fields that develop blowouts under a unidirectional wind. We first define a conceptual model of blowout expansion, and then split the functions of vegetation in a stable dune field into: (i) maintenance of a protective skin, and (ii) blowout suppression. We model reactivation as disturbance breaking through the protective skin, which forms a blowout that is either (i) suppressed by colonizer species, or (ii) capable of advancing downwind and reactivating part of the dune field. The capacity for disturbance to break through the protective skin is a function of disturbance magnitude, area, and resistance of the skin. The blowout suppression capacity of a dune field is a function of sediment flux, blowout depth (related to geomorphology), and colonizer species vitality. By plotting a given dune field with two variables (protective skin breach rate and blowout suppression capacity) we define four states: (i) stable, (ii) blowout dominated, (iii) reactivating, or (iv) stable but disturbance susceptible. We reinforce the conceptual model with qualitative examples and discussion of experiments on grassland-stabilized dunes in Canada. Overall, our framework provides a starting point for quantifying the reactivation potential of vegetated dune fields. (C) 2013 Elsevier B.V. All rights reserved. |
| [28] | Evidence from a field study on wind flow and sediment transport across a beachdune system under onshore and offshore conditions (including oblique approach angles) indicates that sediment transport response on the back-beach and stoss slope of the foredune can be exceedingly complex. The upper-air flow measured by a sonic anemometer at the top of a 3.5?m tower located on the dune crest is similar to regional wind records obtained from a nearby meteorological station, but quite different from the near-surface flow field measured locally across the beachdune profile by sonic anemometers positioned 20?cm above the sand surface. Flowform interaction at macro and micro scales leads to strong modulation of the near-surface wind vectors, including wind speed reductions (due to surface roughness drag and adverse pressure effects induced by the dune) and wind speed increases (due to flow compression toward the top of the dune) as well as pronounced topographic steering during oblique wind approach angles.<br/>A conceptual model is proposed, building on the ideas of Sweet and Kocurek (Sedimentology 37: 1023-1038, 1990), Walker and Nickling (Earth Surface Processes and Landforms 28: 111-1124, 2002), and Lynch et al. (Earth Surface Processes and Landforms 33: 991-1005, 2008, Geomorphology 105: 139-146, 2010), which shows how near-surface wind vectors are altered for four regional wind conditions: (a) onshore, detached; (b) onshore-oblique, attached and deflected; (c) offshore, detached; and (d) offshore-oblique, attached and deflected. High-frequency measurements of sediment transport intensity during these different events demonstrate that predictions of sediment flux using standard equations driven by regional wind statistics would by unreliable and misleading. It is recommended that field studies routinely implement experimental designs that treat the near-surface wind field as comprising true vector quantities (with speed and direction) in order that a more robust linkage between the regional (upper air) wind field and the sediment transport response across the beachdune profile be established. Copyright (C) 2012 John Wiley & Sons, Ltd. |
| [29] | Blowouts are depressions that occur on coastal dunes, deserts and grasslands. The absence of vegetation in blowouts permits high speed winds to entrain and remove sediment. Whereas much research has examined patterns of wind flow and sediment transport on the stoss slopes and lee of sand dunes, no study has yet investigated the connections between secondary air-flow structures and sediment transport in a blowout where zones of streamline compression, expansion and steering are less clearly delineated. In this study we investigated the variability of sediment flux and its relation to near-surface wind speed and turbulence within a trough blowout during wind flow that was oblique to the axis of the blowout. Wind flow was measured using six, three-dimensional (3D) ultrasonic anemometers while sediment flux by eight sand traps, all operating at 25 Hz. Results demonstrated that sediment flux rates were highly variable throughout the blowout deflation basin, even over short distances (< 0.5 m). Where flow was steadiest, flux was greatest. Consequently the highest rates of sediment transport were recorded on the erosional wall crest where flow was compressed and accelerated. The strength of correlation between sediment flux and wind parameter improved with an increase in averaging interval, from 10 seconds to 1 minute. At an interval of 10 seconds, however, wind speed correlated best with flux at seven of eight traps, whereas at an interval of one minute Turbulent Kinetic Energy (TKE) provided the best correlation with flux at six of the eight traps. Correlation between sediment flux and wind parameters was best in the centre of the blowout and poorest on the erosional wall crest. The evidence from this paper suggests, for the first time, that TKE may be a better predictor of sediment transport at minute scale averaging intervals, particularly over landforms where wind flow is highly turbulent. Copyright (c) 2014 John Wiley & Sons, Ltd. |
| [30] | |
| [31] | ABSTRACT Airflow data, gathered over dunes ranging from 60-m tall complex-crescentic dunes to 2-m tall simplecrescentic dunes, were used to develop an empirical model of dune lee-face airflow for straight-crested dunes. The nature of lee-face flow varies and was found to be controlled by the interaction of at least three factors (dune shape, the incidence angle between the primary wind direction and the dune brinkline and atmospheric thermal stability). Three types of lee-face flow (separated, attached and deflected along slope, or attached and undeflected) were found to occur. Separated flows, characterized by a zone of low-speed (0–3O% of crestal speed) back-eddy flow, typically occur leeward of steep-sided dunes in transverse flow conditions. Unstable atmospheric thermal stability also favours flow separation. Attached flows, characterized by higher flow speeds (up to 84% of crestal speed) that are a cosine function of the incidence angle, typically occur leeward of dunes that have a lower average lee slope and are subject to oblique flow conditions. Depending on the slope of the lee face, attached flow may be either deflected along slope (lee slopes greater than about 20掳), or have the same direction as the primary flow (lee slopes less than about 20掳). Neutral atmospheric thermal stability also favours flow attachment. As each of the three types of lee-face flow is defined by a range of wind speeds and directions, the nature of lee-face flow is intimately tied to the type of aeolian depositional process (i.e. wind ripple or superimposed dune migration, grainflow, or grainfall) that occurs on the lee slope and the resulting pattern of dune deposits. Therefore, the model presented in this paper can be used to enhance the interpretation of palaeowind regime and dune type from aeolian cross-strata. |
| [32] | |
| [33] | Coastal dunes are stabilized in three stages: (1) The initial stage uses sand-stilling grasses established vegetatively. For this purpose, European beachgrass, Ammophila arenaria (L.) Link., is most used, followed by American beachgrass, A. breviligulata Fern., or American dunegrass, Elymus mollis Trin. Large solid plantings must be made with the spacing and number of plants per hill adjusted to the site conditions. Plantings, using Nitrogen fertilizer, are made during the dormant season. (2) Secondary permanent grasses and legumes are seeded 2 years later when sand movement slows and the initial grasses begin to lose their vigor. Most used are seaside lupine, Lupinus littoralis Dougl., purple beachpea, Lathyrus japonicus Willd., seashore bluegrass, Poa macrantha Vasey., and native red fescue, Festuca rubra L. (3) Final control is with woody plants that are well adapted to rough areas. Scotch broom, Cytisus scoparius (L.) Link. Hooker willow, Salix hookeriana Barratt, Nootka rose, Rosa nutkana Prese., and shore pine Pinus contorta Dougl., have been extensively used. |
| [34] | Blowouts are the main features of aeolian activity in many dune areas. To assess the impact of future climatic change on the geomorphological processes prevailing in a dune landscape it is essential to understand blowout formation and identify the meteorological parameters which are important. The development, that is, local erosion and accumulation, of six blowouts in a dune terrain along the Dutch coast has been related to wind velocity and wind direction, as measured at a nearby standard meteorological station. Blowout changes correlate best with wind velocities between 6.25 and 12.5 m/s (measured at 10 m height) which are the critical wind velocities for moving particles in the 0.15 to 0.42 mm range. These winds mostly blow from the southwest. Consequently, the blowouts are elongated in the same direction. Extreme aeolian events such as northwestern storms have little effect on blowout development compared to events which have a lower magnitude but occur with a higher frequency. An eventual shift towards higher effective wind velocities would probably result not in larger blowouts but in a break-down of the whole system, especially if this shift were accompanied by a change in wind direction. The accumulation of sand in blowouts during storms should be seen as a first step of adaptation to a higher energy level. |
| [35] | The formation and development of three foredune blowouts at Island Beach State Park, New Jersey during the period 1981 to 1991 demonstrate the cyclic evolution of these landforms. The evolution is documented with: 1) a long-term study of topographic changes in blowout form documented with systematic surveys carried out at three- to five-year intervals; and 2) a four-week field study involving the collection of wind-speed profiles and wind direction at several locations in two of the blowouts and the measurement of elevation changes resulting from significant wind events. Results show that blowouts on leeward coasts favor onshore sand movement from the beach despite the dominance of offshore winds because vegetation on the landward side of the blowouts traps sand moved onshore and stabilizes the surface against deflation by offshore winds. Feedback between dune morphology, wind flow, and vegetation produces a sequence of landform changes that are conceptualized in a model of foredune blowout development. The model has four distinct stages. In Stage 1, erosional notches are initiated in a foredune by dominant offshore winds that accelerate near the dune crest. In Stage 2, these notches develop into incipient blowouts through deflation in the throat. During Stage 3, the blowout throat deflates to backbeach elevation, and erosion on the lateral walls widens the blowout. In Stage 4, downward deflation ceases and widening slows as the lateral walls develop gentler slopes; this results in a deceleration of air flow in the blowout, sediment deposition, and eventual closure. The progression from blowout formation to closure takes about 20 years. |
