 , ��־Ƽ
The coupling interaction mechanism of regional water-land-energy-carbon system
ZHAORongqin, LIZhiping�ո�����:2016-02-4
������:2016-05-5
�����������:2016-11-25
��Ȩ����:2016������ѧ�����༭�������ǿ��Ż�ȡ�ڿ����ף�����������¿�������ʹ�ã�ѧ���о���ѧ�����������н�ѧ�ȣ���������������ҵĿ��.
��������:
�����:
-->
չ��
ժҪ
�ؼ��ʣ�
Abstract
Keywords��
-->0
PDF (1779KB)Ԫ������ά��������������ղ�����
�������ø�ʽ����EndNoteRisBibtex�ղر���-->
1 ����
ˮ�������ܡ�̼�ǵ������ϵͳ��������������صĹؼ�Ҫ��,����ЩҪ�ؼ�����Ϲ�ϵ��չ�о�����Դ��������ĺ����о�����֮һ����������,��������Ե�һҪ�ص��о��϶�,��ȻҲ����Զ�������Ҫ�صĹ�ϵ�о�,��ˮ����Դ���[1]����Դ����̼�ŷ�[2]���������á���Դ���Ѻ�̼�ŷŵĹ�ϵ[3]��,���ڴ˻����Ͽ�չ����Դ������̼�ŷ�ЧӦ�о�,Ϊ�˽���Դ��Դ������̼�ŷŵĹ�ϵ�ṩ������IJο�����Ŀǰ����,����������桰ˮ�������ܡ�̼���Ķ�Ҫ��ϵͳ����о�����Խ��١�������,����ȫ������̬���������ͻ��������仯���ƶ�,һЩ****������仯[4]����̬ϵͳ����[5]����ʳ����[6]�ȽǶȿ�չ���������ϵͳ��ˮ�������ܡ��Ķ�Ҫ�ع�ϵ�о�,���Դ�Ҫ�����ϵͳ�����ĽǶȷ��������Ի�����ѹ���Լ��ԡ���Ȼ�����á���ᡱ����ϵͳ���ܵ�Ӱ�졣��ˮ�������ܡ�̼������Ϲ�ϵ��������Ȼ����ᡪ���á�ϵͳ�ĺ���,����ˮ�������ܵ���Դ��������Ͽ�����,�κ�һ�������ҵ�,����Ҫˮ���ܵ�Ͷ��,����Ҫ���صĿ�����ռ�á����Բ�ͬ����ͬ������ʽ����,������Դ�������ģ����Ϸ�ʽ������ǿ�ȼ�����Ч�ʲ�ͬ,����˸���������̼�ŷ�ǿ�Ⱦ������ԵIJ��졣��ǰ�ڹ���̼�ŷŵ��о�������ǹ�ע̼�ŷű������������,�����ٹ�ע����̼�ŷŵ����������и�����Դ��Դ��Ͷ�������ʹ��Ч��,�Լ���Դ��Ϲ�ϵ��̼�ŷ�Ч�ʵ�Ӱ�졣���,ǰ���о�ȱ������Դ������Դͷ̽Ѱ������������������仯��Ӱ�졣���,����ˮ�������ܡ�̼������о�������̽����,��������û����о�����Ҫ��һ����ǿ����չ��ˮ�������ܡ�̼��������û����о�������Ҫ�����ۺ�ʵ����ֵ���������϶���,��չ����ˮ�������ܡ�̼�����ϵͳ�о�,�����ڽ�ʾ������Դ��Ͽ������̶�̼�ŷŵ�Ӱ�����,̽�������ۺϿ��������������еĸ�����Դ����Դ��ϸ�ֺ�����Ч����̼�ŷ�Ч�ʵĹ�ϵ,����������ͨ����Դ��ϻ��Ƶ��о���һ������������Ȼ����ᡪ���á�ϵͳ������״̬��Ч��,Ϊ����ϵͳ��Դ��ϼ��价��ЧӦ�о��ṩ�µ������ӽǡ���ʵ���Ƕ�����,�����ҹ��������Ŀ��ٷ�չ,��ԴԼ����������������ռ�ò��ϼӾ硢��Դ���ij������ࡢ����ѹ����һ���Ӵ�,ͬʱ,����������̼�ŷ���Ҳʹ�й��ڹ�������仯̸�������ٽϴ������ѹ�������ġ�ʮ�˴������Ҫ��ȫ��ٽ���Դ��Լ,���������Դ��ˮ����������ǿ��,�������Ч�ʺ�Ч�桱;���ҡ�ʮ���塱�滮��Ҫ���Ҫʵ�֡���Դ��Դ��������Ч�ʴ�����,��Դ��ˮ��Դ���ġ������õء�̼�ŷ������õ���Ч���ơ���ͬʱ,����Ҳ�����̼�ŷ�ǿ���½���Լ��ָ��,��������2030������̼�ŷŴﵽ��ֵ����Щ��Ϊδ����Դ��Դ��Լ�͵�̼ת��ָ���˵�·�����,̽��ˮ�������ܵ���Դ������ü�����̼�ŷŵĹ�ϵ,Ѱ���̼��Ч��ˮ���������ۺ�����ģʽ,���ǵ�ǰ�����һ��ʱ��Ҫ��Ե���Ҫ��ѧ���⡣��̼�ŷ������ĽǶȿ�չ����ˮ�������ܡ���ϻ����о�,���Խ�һ��������������е���Դ����Ч�ʼ�����Ϲ�ϵ,Ϊ���ྭ������е���Դ��Լ�ṩ��ѧ��ʵ��ָ��,����һ����������չЧ�ʺͿɳ���ˮƽ,�ƶ�������ʽ��ת��;������ĵ�̼ת�͡����,��չ��ˮ�������ܡ�̼��������û����о����������ڴ�����Դͷ����Դ��Ͽ����ĽǶ��ۺ�������������Ӧ������仯��̼����DZ��,���Ҷ����ƶ���Դ��Լ���������Ч�ʡ�����ˮ������������ǿ�ȡ�̽����ˮ���ڵء����ܵĵ�̼������ʽ��̽�������̼���ɳ�����չģʽ��Ҳ������Ҫ��ʵ�����塣
���ڴ�,�����ڽ���������������о����������Ļ�����,�����۽Ƕ���,������ ��ˮ�������ܡ�̼�����ϵͳ��WLEC system������Ҫ�ع�ϵ���н���,������Ҫ��ϵͳ������õĻ��ƺ�Ӱ������,��������ˮ�������ܡ�̼��������õ��о���ܡ�
2 ����ˮ�������ܡ�̼�����ϵͳ����Ҫ�ؽ���
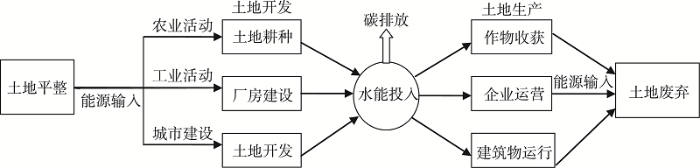
ˮ�������ܡ�̼�����ǵ������ϵͳ�Ĺؼ�Ҫ��,Ҳ����Ȼ����ᾭ���������Ҫ��Դ��������ˮ�����������������ʺͽ���,Ҳ�Ǵֲ�ҵ�������̵�ԭ��;�������Ǹ��������Ļ����ͳ���,Ҳ��ֲ��������������Դ;���ܡ���������뾭��������еĶ���Դ;��̼���������������Ҫ��Դ�����ʻ���,Ҳ�����������ᾭ�û���ŷźʹ�л���ˮ��������������Դ�Ŀ����������ϵ�������,�������˴���̼�ŷš���������ϵͳʮ�ָ���,���нϴ�Ŀռ�������,�������ͬ��Ȼ��������ͬ��ҵ���в�ͬ��ˮ�������ܵ���Ϲ�ϵ��̼�ŷ�ǿ�ȡ�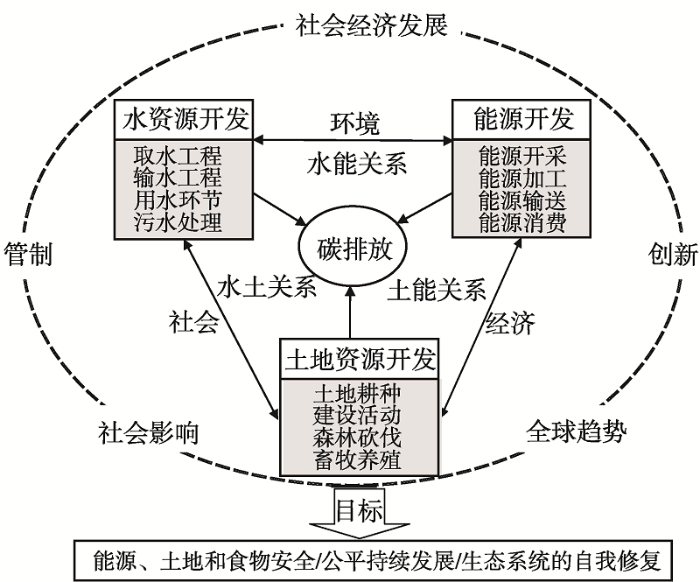 ��ʾԭͼ|����ԭͼZIP|����PPT
ͼ1����ˮ�������ܡ�̼���������ϵͳ[
-->Fig. 1Regional water-land-energy-carbon coupling interaction system
-->
ˮ�������ܡ�̼�Ĵ�Ҫ�غ���������������ԭ�ϡ�������������Ӱ�죨ͼ1��,����ˮѭ�����������û����ҵ���������ᾭ�û����������ͨ��̼ѭ������ʽ������������ᾭ��ϵͳ����Ҫ����,������ˮ�������ܡ�̼�����ϵͳ����ϵͳ�������˵ر��Ĵ�Ȧ�㣨ˮȦ����ʯȦ������Ȧ�ʹ���Ȧ���������,Ҳ�ǡ���Ȼ�����á���ᡱ��ϵͳ���ܺ��̵ļ��б��֡�����,��ˮ�������ܡ���������Դϵͳ�ĺ���,��������Դ����֧����̬ϵͳ���������ྭ����ᷢչ�Ļ���,����ͨ��������ᾭ�û����Ȼ��̬ϵͳ֮��ġ�����������ϵ�����ϡ����ϵ;����֮�������ô����Ÿ��ӵķ����Ժͷ�����ϵ,����Ҫȡ���ڸ�Ҫ�ص�λ�á������������������������ʱ�ո�֡���ϵͳ������Ȼ�͡���ᡪ���á�ϵͳ,���Ҫ��֮��������Ҳ�������Եġ���Ԫ��������ͬʱ,��ˮ�������ܡ�ϵͳҲ�������Եĵ����������,�ڲ�ͬ״̬����Դ����������������,�Լ���ͬ������ǿ��Ӱ����,��Ҫ�����û��ơ�ǿ�Ⱥ������Բ�ͬ,���һ��Ӱ����ϵͳ�Ĺ��ܼ���̼�ŷ�����[4]����ˮ�������ܡ�ϵͳ������ ����ᡪ���á���������ϵͳ�Ļ���Ҫ��,ˮ����ϵ�����ܹ�ϵ��ˮ�ܹ�ϵ�ֱ�����ᡢ���úͻ���ϵͳ�����塣��̼�ŷű�ʾ�������Ի�����Ӱ�졣���,����ˮ�������ܡ�̼����������ò�����ӳ�����������Դƥ���ϵ�Ϳ�������Ч��,�����������������Ի�����Ӱ��̶ȡ���ϵͳ�Ĺ��ܡ����̺�Ч�����������ơ���ᾭ�÷�չ��ȫ�ͼ������µ����ص�Ӱ��,��������ᾭ�õķ�չ�����ݻ�����ˮ�������ܡ�̼��ϵͳ��֡����ܺ��̵ĸı�������������Դ���桢���������ʽ����ҵ�ṹ�������ĸı䡣�о�������Ŀ����ͨ��������ˮ�������ܡ�̼�����ϵͳ�ĵ���,ʵ����Դ�����غ�ʳ�ﰲȫ���������Ĺ�ƽ������չ����̬ϵͳ��������,�Ӷ�ʵ������ˮ������Դ��Ч���á�̼���ź���������Ż���Ŀ�ꡣ
3 ����ˮ�������ܡ�̼����������о���չ
������,�������ˮ�������ܵ���Դ������̼�ŷŵĹ�ϵ�о�,��Ҫ�����·��棺3.1 ����ˮ��̼������о���չ
����ˮ��̼������о���Ҫ�����������棺һ��½����̬ϵͳ��̼ˮ����о���½����̬ϵͳ̼ˮѭ���ǵ���½�ر���ϵͳ����ѭ�������������Ļ��������������̡�������,�����ⲻ��****�����ж���ؼ�����½����̬ϵͳͨ���۲ⷽ����ȫ�������߶���̬ϵͳ��̼ˮͨ���������о�[8-11],�����ɭ��[11-12]��ũ��[13]��ɽ��[14]�Լ��˹���[15]����̬ϵͳ̼ˮ��ϵİ����о���½����̬ϵͳ̼ˮͨ���仯��������̬ϵͳ̼ˮѭ���Ĺؼ�,������˽�ֲ������������ˮ������Ч�ʾ�����Ҫ������;������½ˮ��̼�ŷ�ͨ������仯��������������****����ˮ��������ݻ�����о��IJ�����ȫ����½ˮ���̼�����������壩�ŷŽ����˺������[16],�ص��������½ˮ����о�[17],�������,ˮ������Ҫ�����������ŷ�Դ֮һ,����ˮ�����������ŷ�ռȫ����½ˮ��̼�ŷŵ�4%[18]������****Ҳ��չ�˶�ˮ��[19-20]�����к���[21]��ˮ��̼�ŷ�ͨ�������ڱ仯�����ļ���о����������,���ڲ��漰��Ϊ����Դ��Ҫ�صIJ���,����ˮ��̼�������Ҫ����Ȼ���̵���̬ϵͳ̼ˮͨ����ˮ��̼�ŷ��о�Ϊ��,�۳߶ȶ������Ȼ��ѧ��ͨ����⼰ʵ������ķ���;����۳߶���Ҫ��ͨ���������ݻ����ģ������չ�о���3.2 ����ˮ���ܡ�̼������о���չ
������,����Դ��Ҫ�ر����뵽��ˮ��̼������о�[22]��,�ر��������˶�ˮ��Դ�������ù�������Դ����̼�ŷŵĹ�ע����Ҫ�����������棺�� ������Դ���ѵ�����ˮϵͳ��̼�ŷ��о����ӡ�ˮ���ܡ�̼����ϵĽǶ�,������****��չ�˹���[23]�ͳ��г߶�[1, 24]ˮϵͳ̼�ŷŵĺ����о�,�������,��ˮ�ij�ȡ�����䡢ʹ�õ���ˮ�����ȸ������ڶ������̼�ŷ�,����,����ʹ�á���ˮ�������ڵ�̼�ŷŽ϶ࡣ����,��ˮ���ܡ�̼�����Ҳ��Ӧ��������ˮ��Դ��������[25]��̼ˮ��Դ�滮����[26]��ʵ����,�����Կ�չ����̬ϵͳ���������ۼ���̼ˮ��Դ�Ż����÷�����Ӧ���о����� ������ҵ�����ţ�ˮ��Դ�������õ�̼�ŷ��о�������,������****���ڶ������ġ���ȵȹ��̵���Դ����,���й���ͬʡ��[27]������ʡ������[28]�ȵ���ũҵˮ��Դ�������ù��̵�̼�ŷŽ����˺���,����̽����ˮ��Դ�������öԻ�����Ӱ�켰��Ӧ����仯�ĶԲ�,�о�����ũҵ���������ŷ�ռ�й�̼�ŷ�������17%~20%[27],���е���ˮ�����������ŷ�ռũҵˮ��Դ̼�ŷŵ�65%~88%[28]������****Ҳ��չ�˶�����ҵˮ���ܡ�̼�㼣����̬Ч��[29]��ˮ�����̵�̼�㼣[30]���о�,�������,����ˮ����Դ����ԴͶ���̼�ŷ�ǿ�ȵIJ�ͬ,��ͬ��ҵ����̬Ч�ʾ��нϴ�IJ���[29];�����Ǹ���ˮ�������������������ŷŵ���Ҫ��Դ[30]���� ũ����ˮ��̼����ͨ��������о�������Ȼֲ����ͬ,ũҵ������Ҫ�������˹������ܵ�Ͷ��,��Ϊ�о���Ȼ����ύ��ġ�ˮ���ܡ�̼������Ϲ�ϵ�ṩ����Ҫ������Kothavala��[31]�Լ��ô����ر���ƻ���Canadian Land Surface Scheme, CLASS��Ϊ���ж���ͨ�������Դ��ˮ������̼ͨ��������ģ��;Zhang��[32]�Ի���ƽԭ�������ˮ��̼ͨ���������ۺ��о�,�������,ũ����̼ͨ��ǿ���ںܴ�̶�����ˮ��ͨ����Ӱ�졣�����۳߶���Ϊũҵ����������ˮ���ܡ�̼Ч���о��ṩ����Ҫ�ķ����ο���3.3 ��������̼������о���չ
��������̼������о��ǽ���������ѧ����̬ѧ����Ҫ�о�����֮һ���������ò����ı�������̼ͨ��,����Ӱ������½����̬ϵͳ��̼��֧״������ �������ñ仯������̼ͨ���о����������ò����ı�ر�����,����ͨ��Ӱ�������������ʺ�������Ըı�������̼ͨ��[33]��������,����������˴��������������������̼ͨ���Ĺ�ϵ�о�,�������,�ݵ�ת��Ϊũ��һ�����������̼ͨ��[34],ʪ��ת��Ϊ����������������Ҳ������������̼ͨ��[35];��ɭ��ת��Ϊũ����ܻ��������̼ͨ��������[36]�����[37],���ֲ�����Ҫ�����������������ũ�������ʩ�й�[38]������,����Ȼֲ��ת��Ϊũ�ﲻͬ,���ػָ�Ϊ�ֵػ�ݵ�����������̼ͨ��,�˸����ֻ���ʹ����̼�����ֱ�����18%��19%,ũ��ת��Ϊ������ʹ����̼��������53%[39]������,��ͬ�Ĺ�����ʩ������������ñ仯������̼ͨ������ĸ���ԭ��[35]���� �������ö�������Ȼ��̬ϵͳ̼ƽ���Ӱ�졣�������û����л����̡�ɭ�ֿ�����ũҵ���������ط����ȶ�����½����̬ϵͳ̼��֧������ҪӰ��[40-41]���������,��������/�����仯���µľ�̼�ŷ�ռ1990-2010��ȫ������̼�ŷŵ�12.5%[42]������ͬ�������÷�ʽ������̼��֧��Ӱ��������ԵIJ��졣����,���л�[43-44]��ɭ�ֿ���[45]���������̼�ŷŵ���Ҫ����;�����������ع�����ʩ����ũ�ֻ�������������̬ϵͳ��̼���[46]������,19����80���,�������ع�����������̼�������������ʯȼ��̼�ŷŵ�10%~30%[40];20����70�������,�й��������û���ر��˹����֣������½����̬ϵͳ̼���մ�ԼΪ0.45 Pg C[47]��3.4 ���������ܡ�̼������о���չ
���������ܡ�̼���������Ŀǰ�������о���һ���ȵ���������������ȫ������仯��̼ѭ������ҪӰ������[45],�������ñ仯�����ı���Ȼ̼ѭ������,����ͨ���ı���Ϊ��Դ����ǿ��Ӱ������̼ѭ��������[48]���������ܡ�̼�������Ҫ�������Ƕȿ�չ��һ���������á���Դ������̼��֧�Ĺ�ϵ�о�,�ص����ڽ����������ú���Դ��������,������ͬ�������÷�ʽ��̼�ŷ�ЧӦ������,����****�����������ýǶ�,ͨ���Թ���[40, 45, 49]������[50-51]�����[3, 52]�ȳ߶Ȳ�ͬ�������÷�ʽ����Ȼ̼��֧��������Դ����̼�ŷŵĺ���,̽���������������û������̼��֧��Ӱ�졣�о�����,����㼰�����õغͽ�ͨ�õص���չ��������Դ���ѵ����������̼�ŷŴ����������Ҫԭ���ǻ��ڵ�̼Ŀ������������Ż������о����������õ�̼��������һ���̶ȸı��������õ�̼Դ/����[53],ʵ������ͨ�������������ýṹ����ʽ����ģ��ǿ��,�����ı䲻ͬ�������÷�ʽ����Դ����ǿ����ʵ�ֵ�[54]��������,����****�ӹ��ҡ�ʡ�����С�����Ȳ�ͬ�߶Ȳ��濪չ���������õĵ�̼�Ż��͵����о�,Ϊ����������������滮�ṩ��ʵ��ָ�������ȫ��[49, 55]������ʡ[56-57]���Ͼ���[58]��̩����[59]��ͨ����[60]����������������[61]�ȿ�չ���������ýṹ�ĵ�̼�Ż��о�,��������������Ż�����,ָ���������̼�������ù滮ʵ��,���ƶ������������ܡ�̼������о��Ľ�һ�����3.5 �����ܡ�̼������о���չ
������,��������ڡ��ܡ�̼����ϵ��о��϶ࡣ�������������Ҫ��,���ܡ�̼������о���Ҫ�Dz������������������������о�,�ص�����������棺�� ��Դ����̼�ŷŵĺ����о���������Թ��һ����̼�ŷ��嵥����[2, 62]���Լ�����[63]�����Ͳ�ҵ[64-65]����������[66]����ͨ[67-68]�ȵ���Դ����̼�ŷŵ��о��϶�,����չ����Դ����̼�ŷŵ�������[69]��Ӱ�����[70-71]������Ԥ��[72]���龰ģ��[73]�ȵ��о�,�о�����,���ڲ�ͬ���ù�ģ��ˮƽ����Դ����Ч����ǿ�ȡ���ҵ�ṹ�Ȳ�������,��Դ���ѵ�̼�ŷ�ǿ�ȼ��乹�ɾ��нϴ��������졣������˽ⲻͬ����̼�ŷŵĽṹ����ֺ�δ�������ṩ�˻���,��Ϊ�����̼ģʽѡ���ṩ����Ҫ�ο�;�� ��Դ��ͨ��ת����̼�ŷŵĹ�ϵ�о�����ʡ��[74-75]������[76-77]�ͳ���֮��[78]��̼��ͨ��ת�Ƶ��о�����,����֮�����Դ��ͨ��ó�������̼ת�Ƶ���Ҫԭ��,��Դ��ͨ��ǿ�Ⱦ���������̼ת�ƵĹ�ģ��Ч��;�����ڲ�������֮�����Դ��ͨ���ӹ�ת������ʧ�ȹ�������ɳ����ڲ�̼��ͨ����Ҫԭ���������,���ܡ�̼������д����İ����о�,���ﲻ��һһ�о١���������Ҫ�صĽ�ϲ���һ��������Դ�ۺϿ�����̼�ŷ�Ч���ǽ���о������ơ�3.6 ����ˮ�������ܡ�̼����Ϲ�ϵ��̽���о�
������,������Ҳ����̬ϵͳ�����ܡ���ʳ��ȫ������仯�ȽǶȿ�չ������ˮ�������ܡ�̼����Ϲ�ϵ��̽���о�������,Fang��[79]�ۺϷ�������̬�㼣����Դ�㼣��̼�㼣��ˮ�㼣����ϵ������,��������㼣�����塱�����о�������;Watanabe��[5]�Ի�����ֵ�����������������ñ仯�����ȴ�ϡ���ԭ��̼ˮ��̬ϵͳ�����Ӱ������˷���,�������,�����������Ŷ�,��ͳ������ʽ�µ�̼ˮ��̬ϵͳ����������͵�;Ringler��[6]�������Դ����Ч�ʵ��ӽ�����ˡ�ˮ���ܡ�����ʳ���WELF�������о���˼·;������Դ��[4]��չ�ˡ�ˮ�������ܡ�ϵͳ������仯�Ĺ�ϵ�о�,��Ϊ��ˮ�������ܡ�ϵͳ����о��ܹ���������˽�����仯�Ļ���,��������Ϊ��������ˮ����ϵͳ�������������Ӧ�е�����;Felzer��[80]��������Ƕ�,��չ��������Ϧ��������̼������ˮѭ�������������������ñ仯����Ӧ�о�;Ababaei��[81]��չ����Ӧ����仯��ˮ����Դ�������۹滮֧��ϵͳ�Ŀ�����Ӧ���о�������,��ˮ�������ܡ�̼�����Ҳ���۲�����о�,��Rajan��[82]�����ж���ط�,���������ϲ�����ֲ��Ϊ��,������ȼ��������������ñ仯��ˮ���ܡ�̼����������ƽ���Ӱ��������о�,����Ϊ�����������ɢ��������ɲ�ͬ������Դͨ����̼���ղ������Ҫ���ء������ⲻͬҪ��������õİ����о�˵������1��,�ر�Ҫ��֮���������û����Լ�������Ӱ���ܵ���ѧ��Ĺ�ע,������ϵͳ������ù��ɵ��о������һ�����
Tab. 1
��1
��1����ˮ�������ܡ�̼����ϵĵ��Ͱ����о�
Tab. 1Typical case studies of regional water-land-energy-carbon nexus
| ���� | ��������� | ���� | ���� | ��� | ���� |
|---|---|---|---|---|---|
| ��ˮ��̼����� | ½����̬ϵͳ��̼ˮ��� | ͨ���۲��ģ�� | ����ǧ���� | 2012 | ��С����[15] |
| ˮ���̼�ͷ� | ��������ģ�� | ȫ�� | 2013 | Raymond��[16] | |
| ��ˮ���ܡ�̼����� | ����ˮϵͳ��̼�ŷ� | ���������������ڷ��� | �����4������ | 2014 | Venkatesh��[1] |
| ũҵˮ��Դ�������õ�̼�ŷ� | ���������㷽�� | �й� | 2012 | Wang��[27] | |
| ũ���ˮ��̼���ܡ�ͨ�� | �ж���ط� | ���ô� | 2005 | Kothavala��[31] | |
| ������̼����� | ��������������̼ͨ�� | ̼ͨ���۲� | �������������� | 2006 | Carlisle��[37] |
| ������������̬ϵͳ̼��֧ | �������㷨 | ���� | 1999 | Houghton��[40] | |
| �������ܡ�̼����� | �������á���Դ������̼�ŷ� | ���������嵥 | �ͻ�˹̹ | 2012 | Ali��[3] |
| �����̼���������õ��� | ���Թ滮 | �й� | 2011 | ������[49] | |
| ���ܡ�̼����� | ��Դ����̼�ŷŵĺ��� | ���������嵥 | ȫ�� | 2010 | Kennedy��[2] |
| ��Դ��ͨ������̼ת�� | ����̼���� | �Ͼ��� | 2014 | Zhao��[78] | |
| ��ˮ�������ܡ�̼����� | ��ˮ�������ܡ�̼��ϵͳ����̬ϵͳ���� | ��ֵ�������� | ���� | 2014 | Watanabe��[5] |
| ��ˮ�������ܡ�̼��������仯��ϵ | ϵͳ�������� | ���� | 2012 | Skaggs��[4] |
�´��ڴ�
4 ����ˮ�������ܡ�̼��������÷���
���IJ����ڶԺ�۳߶�����ر���Ҫ��֮������û��Ƶ�̽��,�ݲ��漰ֲ���������̵�ˮ��̼������̬���̻�ˮ������ġ�ˮ��̼��������ù�ϵ��4.1 ����ˮ�������ܡ�̼��������û��Ʒ���
��ˮ����������Դ����õĽǶ�,���Խ������Ϊ�������ϵ������õ���ϵͳ��ˮϵͳ������ϵͳ����Դϵͳ��ˮϵͳ��Ҫ������ˮ����ˮ����ˮ����ˮ����ˮ����ˮ�����Ȳ�ͬ�Ļ���;����ϵͳ��������������������,�������õء������õغ���̬�õأ���������������Ȼ���ظ���������������ʽϸ�֣�;��Դϵͳ������Դ���ɡ���Դ�ӹ�����Դ���ͺ���Դ���ѵȻ��ڡ�������ϵͳͨ��������ᾭ�û�����ϵ����Ϊ��Դ,��ͬ����������ˮ�������ܡ���Դϵͳ��ˮϵͳΪ����ϵͳ��Ӧ�������������̬��ˮ,Ϊ��Դϵͳ�ṩ��ȴ���ӹ�����ˮ;��ԴϵͳΪˮϵͳ����ˮ����ˮ��ˮ���������ṩ��Դ,Ϊ����ϵͳ��������ᾭ�û�ṩ������Դ����;����ϵͳΪˮϵͳ����Դϵͳ�Ĵ��桢�ӹ������͵Ȼ����ṩ���������ͳ��������,��ϵͳ���������á���Դ���������ѡ�ˮ��Դ�����Ȳ�ͬ���ڶ������̼�ŷţ�ͼ2����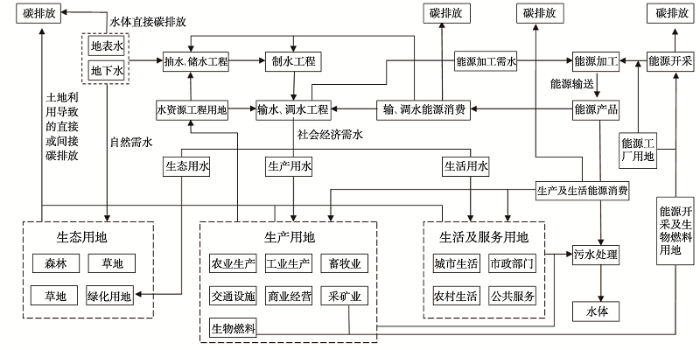 ��ʾԭͼ|����ԭͼZIP|����PPT
ͼ2��ˮ�������ܡ�̼��������û��Ʒ���
-->Fig. 2The mechanism of water-land-energy-carbon coupling interaction
-->
Tab. 2
��2
��2��ˮ�������ܡ�������ü�����̼�ŷŵĹ�ϵ
Tab. 2Water-land-energy coupling interaction and its relationship with carbon emissions
| ��Ϲ�ϵ | �������� | ��Ҫ����[4] | ̼�ŷ� |
|---|---|---|---|
| ˮ����ϵ | ˮ��Դ���������ص����� | ����ˮ/��ˮ���̡��ر��������̡���̬ϵͳ�����뽨�衣 | ˮ�����̼���̬�������̵�ֱ�Ӻͼ�ӵ�̼�ŷš� |
| ���ؿ�����ˮ������ | ��̬ϵͳ������ũ��������������ҵ���ɿ�ҵ����ҵ����������ҵ��������ˮ�� | ��ͬ�������÷�ʽ�µ�ˮ��Դ������̼�ŷ�;���ؿ������µ�ֱ��̼�ŷš� | |
| ���ܹ�ϵ | ���ؿ�������Դ������ | ���ؿ�������ͨ���衢���������Դ���������á� | ���ؿ�����������Դ���ѵ�̼�ŷ�;���ؿ������µ�ֱ��̼�ŷ�;��Դ������������Դ���ѵ�̼�ŷ�;����û��Դ���ѵ�̼�ŷš� |
| ��Դ���������ص����� | ��Դ������ʩ���衢ˮ�����̡���ɽ���ɡ��糧��̫���ܺͷ��ܹ����������·���衢���ܵ�����·��������/���ͳ���������Դ������ȼ��������̼�������桢��Դ������ | ��Դ���ؼ���Դ������ʩ�����е�̼�ŷ�;��Դ���ɺ���������е�̼й¶;�������÷�ʽ�仯��ֱ��̼�ŷš� | |
| ˮ�ܹ�ϵ | ˮ��Դ��������Դ������ | ��ˮ����ˮ��ˮ��Դ���ڼ���ˮ������ | ˮ��Դ������������Դ���ѵ�̼�ŷ�;��ˮ�������̵�̼�ŷš� |
| ��Դ������ˮ������ | ��Դ��������ȡ����ȴ���ӹ���̼��������ȹ��̡� | ��Դ������ˮ��������Դ���ĵ�̼�ŷš� |
�´��ڴ�
����ˮ�������ܡ�ϵͳ��̼�ŷ�ǿ����Ҫȡ������ϵͳ֮�����������͡���ҵ���ʽ�Լ���Դ���ͺͽṹ�����ء��� ������ϵͳ֮�����������ͺ�ǿ��������ͬ,��Ӧ��̼�ŷ�ǿ��Ҳ����������2�������磺�������ú�ˮ��Դ��������Դ������ϴ�,���Ҳ���нϸߵ�̼�ŷ�ǿ��;�� ˮ��Դ����������ռ�ú���ԴͶ�����Ϲ�ϵ�ڲ�ͬ��ҵҲ���нϴ�IJ��졣����,��һ��ҵһ��ˮ��Դ��������Դ��������,����ԴͶ����Խ���;�ڶ���ҵ��Դ��ˮ��Դ��������,����������Դ��������Խ��١�������Դ������������ڲ�ͬ��ҵ֮��IJ���,���²�ͬ��ҵ�õص�ֱ�Ӻͼ��̼�ŷ�ǿ�����Բ�ͬ,�����������̼�ŷż���Ч�ʵIJ�ҵ����;�� ˮ����Դ��ͬ���û�����ԴͶ������ͺ�ǿ�Ȳ�ͬ������ܡ�ú̿��ʯ�ͺ���Ȼ���ȵIJ�ͬ��ϣ�,�ںܴ�̶���Ӱ��������������̼�ŷ�ǿ�ȡ�
4.2 ���ڲ�ͬ�ӽǵ�����ˮ�������ܡ�̼����Ϲ�ϵ����
����ˮ�������ܡ�̼��������ÿ��ԴӲ�ͬ�ĽǶ�������,������Ҫ���۽Ƕȡ���ҵ����������õȲ�ͬ�ӽ���������������û��ơ�4.2.1 ���ӽ� ���ӽ���Ҫ��ָũҵ���������С�ˮ�������ܡ�̼������ϡ�ũҵ��������ˮ��Դ�������������ü��˹���ԴͶ��Ȳ�ͬ�Ĺ���,����Ҫ�������£��� ˮ��Դ���������ù��̡�ũҵ����ˮ��Դ�Ŀ������ã�����ˮ����ˮ����ˮ����ȵȣ����̼���Ҫռ��������Դ,����Ҫ���ศ���ܵ�Ͷ��,����˴���һ����̼�ŷ�;�� ���ؿ��������á����ؿ�������������ȡ����ݡ��ջ�Ȳ�ͬ����,��Ҫˮ������Դ��Ͷ��,��������Ӧ��̼�ŷ�;�� ��Դ������Ͷ�롣ũҵ��ԴͶ�����̫���ܺ��˹���Դ����,������̫����Ϊ��,�˹���Դ��Ͷ����Ҫ������ˮ��Դ���á����ؿ�������֡����������Ȼ���;�� ũ�������������е�̼����������Ϊ���̴�����̼�ŷ�����,���������û����һ����̼����,ͬʱ,ũ����������֮��Ҳ������̼����������4�����ڹ�ͬ������ũҵ�����С�ˮ�������ܡ�̼��������ù��̣�ͼ3����
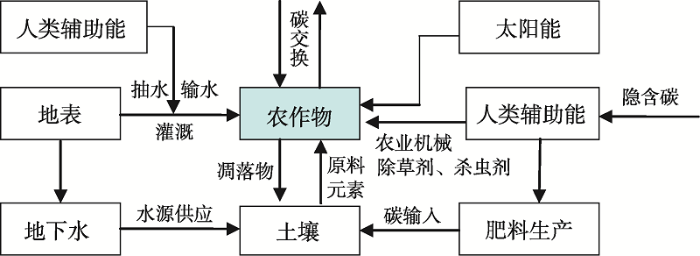 ��ʾԭͼ|����ԭͼZIP|����PPT
ͼ3���ӽǵġ�ˮ�������ܡ�̼�����������
-->Fig. 3Regional water-land-energy-carbon coupling interaction from a microscopic view
-->
4.2.2 ��ҵ��ӽ� ���ڲ�ҵ�������ڵĽǶ�,��ԭ�Ͽ��ɡ����䡢�ִ����ӹ�����Ʒ���������ۺͷ����ﴦ���Ȳ�ͬ�Ļ��ڶ���ҪͶ���������Դ��ˮ��Դ,��ռ��һ�������ؿռ�;�����ҵ�����Ӷ���,��ͬ��ҵ���ˮ��������������÷�ʽ��ǿ�Ȳ�ͬ�����ؾ��������ͳ��ص�˫�ع���,��Ϊ�������ܵIJ�ҵ�����ũҵ����ҵ�����ȣ�,һ����нϴ����ˮ��;����Ϊ���ع��ܵIJ�ҵ�������ҵ����������ȣ�,һ����нϴ����Դ�������,��ҵ�������Դ���ѵ�ֱ��̼�ŷ�,Ҳ�����ؿ�����ռ�ú�ˮ���������е�����̼�ŷţ����̼�ŷţ�,ֻ�Dz�ͬ��ҵ���͵�̼�ŷ�ǿ�ȼ������������졣���,�Ӳ�ҵ���濪չ��ˮ�������ܡ�̼������ϻ��Ʒ���,Ҫע�����¼������ڣ��� ��ҵȫ�������ڹ�������Դ���ѵ�ֱ��̼�ŷ�;�� ���ҵ���ˮ��Դ�������������ˮ��Դ��������Ӧ�ʹ����ȹ����е���Դ���ѵ�̼�ŷ�;�� ��ҵ�����������ռ�úͿ�����������Դ���ѵ�̼�ŷ�;�� �������ñ仯������ֱ��̼�ŷ�;�� ��ҵ�������Դ��Ӧ��ˮ����Դ�����ļ�ǿ�ȣ�ͼ4����
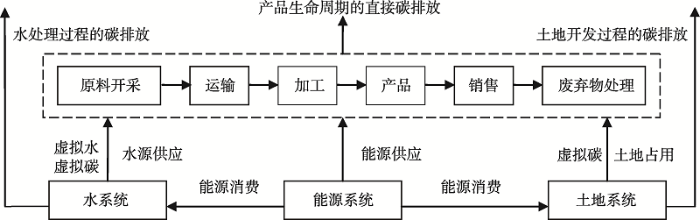 ��ʾԭͼ|����ԭͼZIP|����PPT
ͼ4��ҵ��������ڹ����С�ˮ�������ܡ�̼��������û���
-->Fig. 4Water-land-energy-carbon coupling interaction of regional industrial activities
-->
4.2.3 ���������ӽ� ������Ҫ����ᾭ�û������������������ء����,���κ�һ��������ʽ����,������ƽ�������������������ͷ����Ȳ�ͬ�Ļ��ڶ���һ����ˮ������Դ�����ģ�ͼ5���������������ӽǷ�����ˮ�������ܡ�̼������Ϲ�ϵ,Ҫע�����㣺һ��Ҫ���ֲ�ͬ��������������,��������ͬ�������÷�ʽ����������ȫ�������ڹ����е�ˮ��Ͷ�뼰����Ϲ�ϵ�����磺��ũҵ�����,��ԴͶ����Ҫ������ƽ�������֡���ȡ��ջ�ȹ��̵�ũҵ��е�ܼ����ܵ�ʹ��,ˮ��Դ��Ͷ����Ҫ�ǹ����ˮ;�Թ�ҵ�����,��ԴͶ����Ҫ�����������衢ԭ�ϼ���Ʒ���䡢��ҵ��������Ӫ�ȹ����е���Դ����,ˮ��Դ��Ͷ����Ҫ�ǹ�ҵ������ˮ����ȴ��ˮ;�Գ��н�������,ˮ��Ͷ����Ҫ�����ؿ��������н���ͽ��������еȹ����е�ˮ������Դ������;���ǿ�չ��ͬ�������÷�ʽ�µ�ˮ������Ч�ʺ�̼�ŷ�Ч�ʵĹ�ϵ�о�,�Ӷ��Բ�ͬ�������û����Դ����Ч�ʺͻ���Ӱ������ۺ�����,�Ա�ȷ����ͬ���ྭ�û�µ��ʶȵ��������ü���Դ����ǿ�ȡ�
 ��ʾԭͼ|����ԭͼZIP|����PPT
ͼ5�������ù��̵ġ�ˮ�������ܡ�̼��������û���
-->Fig. 5Water-land-energy-carbon coupling interaction of regional land use processes
-->
4.3 ����ˮ�������ܡ�̼��������õ�Ӱ����Ʒ���
����ˮ�������ܡ�̼���������ϵͳ��Ҫ����Ȼ���ء��������ء�������غ�ѹ�����صȵ�Ӱ�죨ͼ6����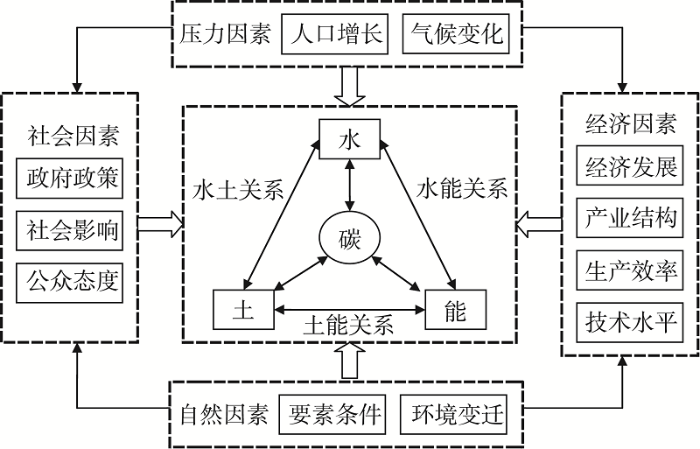 ��ʾԭͼ|����ԭͼZIP|����PPT
ͼ6����ˮ�������ܡ�̼��������õ�Ӱ�����
-->Fig. 6Impacting mechanism of regional water-land-energy-carbon coupling interaction
-->
��1����Ȼ���أ�Ҫ�������ͻ�����Ǩ����ȻҪ����������������ˮ�������ܵȸ�����Դ�ĸ��������ͷֲ����,Ҫ�������ĸı��Ӱ��������Դ�Ĺ���������Ϲ�ϵ;������Ǩ���ܻ�ı�����ĵر�ˮ�͵���ˮ��Դ�ֲ���֡����������Ի���̬ϵͳ��ֵĸı�,�ⶼ���������ˮ�������ܡ�̼��������ù�ϵ�ĸı䡣
��2���������أ����÷�չ����ҵ�ṹ������Ч�ʺͼ���ˮƽ����������������ˮ�������ܡ�̼��������õľ��������ء��������,���÷�չˮƽ����������ˮ����������Դ���ĵ�ǿ�Ⱥ�̼�ŷ�ǿ��;��ҵ�ṹ�����ˡ�ˮ�������ܡ�̼��������õĻ����ռ��ֺ�Ҫ����Ϲ�ϵ;������Ч�ʺͼ���ˮƽ�������������Դ�������Ч�ʺ�̼�ŷ�Ч�ʡ�
��3��������أ��������ߡ����Ӱ�����̬�ȡ�����ͨ�������ҵ���֡�ˮ����Դ������滮����������Դ���������á������������ߡ���̬����ȶԡ�ˮ�������ܡ�̼���������ϵͳ����Ӱ��;���Ӱ�����̬����Ҫ��ͨ����ᡢ��ҵ���˵Ļ�����ʶ���ﵽ��Դ��Լ��Ŀ��,����һ���̶��Ͻ��͡�ˮ�������ܡ�̼���������ϵͳ��������Ȼ������Ӱ�졣
��4��ѹ�����أ���Ҫ��ָ����仯���˿�����[83]���˿������ᵼ��ˮ����������Դ���������,����һ���Ӵ�������Ȼ������ѹ��;����,����仯Ҳ��ı�����ˮ�������ܡ�̼��ϵͳ�Ľṹ����,��������仯ͨ���ı�ˮѭ��Ӱ��ˮ�����硢���м���ũҵ������ˮ;����仯�����ĸɺ����ᵼ��ũҵ������ˮ��Դ��ȱ,�Ӷ���Ҫ�������Դ����֤ˮԴ�Ĺ�Ӧ;���������¼����ƻ�ˮ���ܻ�����ʩ,Ӱ������ˮ������Դ��������Ӧ[4]����Щ�����ڳ�ʱ����Ӱ������ˮ�������ܡ�̼��ϵͳ�Ľṹ�ͳ���������
5 �������о�չ��
5.1 ����
��1������ˮ�������ܡ�̼���������ϵͳ���������˵ر�ϵͳ�Ĵ�Ȧ�������,����ˮѭ�����������á�������ͨ��̼ѭ������ʽ������������Ȼ�����á���ᡱ�ĺ�������,��ϵͳ������ӳ������ͬ��Դ���͵�ƥ���ϵ�Ϳ�������Ч��,Ҳ�������������Ի�����Ӱ��̶�;��2����ϵͳ���Է�Ϊ�������ϵ������õ���ϵͳ��ˮϵͳ������ϵͳ����Դϵͳ,����֮��ͨ����ͬ;�����ϵ����Ϊ��Դ,��ͬ������������ᾭ�÷�չ����Դ����,������̼�ŷ�ǿ������Ҫȡ����ˮ�������ܵ�Ҫ��֮�����������͡���ҵ���ʽ����Դ������ṹ��;
��3������ˮ�������ܡ�̼��������û��ƿ��Դ��۽Ƕȡ���ҵ����������õȲ�ͬ�ӽ�������;
��4������ˮ�������ܡ�̼���������ϵͳ��Ҫ����Ȼ�����á�����ѹ�������ص�Ӱ��,���о�������,�ر��Ǿ��÷�չˮƽ������Ч�ʺͼ���ˮƽ��ϵͳ���ܺ�Ч�ʵľ�����Ҫ�ء�
5.2 ������о�����ϵ������
�� ����ˮ�������ܡ�̼������о��봫ͳ�ġ����ʡ�������ѭ���о�������𡣽�����,���ʡ�����ѭ�������������ֵ���������������о�Ҳ�϶�,����Щ�о�һ������Ҫ�Ե�һ��Դ����Դ��ѭ����ͨΪ�о�����,��һ��������漰̼�ŷŹ���,����ˮ�������ܡ�̼���о�����ǿ��������Դ֮�����ϻ���,Ҳ��̼�ŷ�Ϊ�����ֶ�ͻ������Դ��Ͽ����Ļ���ЧӦ�����,�롰���ʡ�������ѭ�����,��ˮ�������ܡ�̼������о������ۺϡ�����,Ҳ���������뿪չ��ͬ������ҵ���������÷�ʽ֮����Դ��Դ����Ч�ʵĶԱ��о�;�� ����ˮ�������ܡ�̼���롰��̬��������Դ��������������̬�㼣���о���ͬ������ˮ�������ܡ�̼����ϸ�ǿ��������Դ��Ͽ�����Ч�ʺ������Ļ���Ӱ��;����̬�����롰��Դ���������о�����,�ص�����������Ȼ��������Դ�����ྭ����ᷢչ��֧������;����̬�㼣����ͨ����̬ռ��ָ����������������̬����Ӱ��ij̶ȡ����,����ˮ�������ܡ�̼�����ʵ���ϴ���������ͬ������Դ����̬��Ӧ����Դ��Ͽ���Ч�ʼ��俪�����̵���̬�㼣�ļ����о�;�� ����ˮ�������ܡ�̼������о������ۺϼ��ɵ��о��ص�,�ܹ����õ�Ӧ���ڵ�ǰ����̬�������衢���н��輰����滮ʵ���С����磺�ɽ������ˮ����������Դ�ĸ��������ص�,��չ��ͬ����ˮ�������ܡ�̼�����ϵͳ������Ч�ʼ������ԣ������ԣ�����,�ݴ˽���������̬���ߡ�����ʪ�غ��ߡ���ˮ��Դ���������ߡ��Ļ���,����Ϊ��չ���幦�����滮������չս���ƶ�������;�Գ��й滮�뽨�����,Ӧ�ڶ�Ҫ�����ۺͷ����Ļ�����,�����ָܻ�������ˮ�������ܡ�̼��ϵͳ����Ȼ���̺���,������Ϊ���ڶ�ϵͳ�ĸ���,��Ҳ�ǵ�ǰ���衰������С���Ҫ��,�������ܷ�����ȻҪ�ص����ú���;ͬ��,Ҳ���Դӡ�ˮ�������ܡ�̼���Ĺ�ϵ����,��չ��ͬ����ҵ���������÷�ʽ����Դ����Ч�ʵĶ�������,Ϊ�����������ù滮����ҵ�滮�е���Դ��Լ������Ӱ�����ۺ�̼�����ṩʵ��ָ�������,����ˮ�������ܡ�̼����ϼ������˵ر���Ҫ�ص����ϵ,Ҳ�ǡ���Ȼ����ᡪ���á���ϵͳ���ܺ��̵ļ��б���;������ǰ�ڵġ����ʡ�����ѭ����������̬�㼣��������Դ��������������̬�����о����ۺϼ���,Ҳ��ʵ���Ƕ��к���������Դ�ۺϳ�������Ӧ������仯�������ɳ�����չˮƽ�������о����ơ�
5.3 �о�չ��
δ��������ˮ�������ܡ�̼������о�Ӧ�����·����һ����ǿ����1������ˮ�������ܡ�̼�����ϵͳģ���о�����ϵͳ�ڲ���ͬҪ�ص�������û�������,��������ͬ��ҵ����ͬ�������ü����ྭ�û��ʽ�µġ�ˮ�������ܡ�̼���Ĺ����������ϵ,����Ȼ�͡���ᡪ���á�ϵͳ����õĽǶȽ�������ˮ�������ܡ�̼��ϵͳ���ģ��ģ��,����������Ƕ�̽��ϵͳ������õĹ��ɺͻ���,�Լ���Ҫ�ص�ʱ�ո�֡�������������û���,����һ�������ԱȲ�ͬ���� ��ˮ�������ܡ�̼�����ϵͳ��Ч�ʼ�����졣
��2������ˮ�������ܡ�̼���������������仯����ʳ��ȫ�Ĺ�ϵ������仯�����������Ӧ�ǵ�ǰ��ѧ���о����ȵ�֮һ,����ˮ�������ܡ�̼��ϵͳ������ӳ�����������Դƥ���ϵ�Ϳ�������Ч��,�����������������Ի�����Ӱ��̶ȡ����,��չ��ˮ�������ܡ�̼��������仯��Ӱ���뷴������,��������������ʳ�����밲ȫ�о��������,���ڽ�������������ˮ������Դ����ģʽ������Ҫ��ʵ����ֵ��
��3������ˮ�������ܡ���Դ��Ͽ�����̼�ŷ�Ч���о�����̼�������������������̵Ĺؼ�Ҫ��֮һ,�������Դ����Դ�Ŀ�������������ء���ͬ������ʽ�µ�ˮ����������Դ��Ͷ����ϺͿ�������ǿ�Ⱦ������ԵIJ��졣���,Ӧ��̼�ŷŵĽǶȷ�������ˮ�������ܡ���Դ����Ͽ���Ч��,�����ڴ�������Դͷ����Դ��Ͽ����ĽǶ��ۺ�������������Ӧ������仯��̼����DZ��,������ƶ���Դ��Լ���������Ч�ʾ�����Ҫ���塣
��4������ˮ�������ܡ�̼��ϵͳ���ۺ�����������о�����ˮ����������Դ��Ͽ�����̼�ŷ�Ч���о��Ļ�����,����������Ƕȳ���,��չ����ˮ�������ܡ�̼��ϵͳ���������ۺ�����,̽������ͬ��ҵ����ͬ�������÷�ʽ�ġ�ˮ�������ܡ�̼���ۺϿ���Ч�ʺͳ�������;����������̼�ŷ�Լ��������ˮ�������ܡ���Դ�ۺϿ������Ż����ط�����
The authors have declared that no competing interests exist.
�ο����� ԭ��˳��
������ȵ���
������������
�����ڿ�Ӱ������
| [1] | Although it is not at once evident, water supply and sanitation services provided by urban water and wastewater utilities consume a considerable amount of energy. Energy is an operational sine qua non in water treatment and distribution, wastewater collection, and treatment prior to disposal. How does the urban environment influence the water-energy-carbon nexus? The authors have tried to answer this question by referring to four case studies - based on the cities of Nantes (France), Oslo (Norway), Turin (Italy) and Toronto (Canada). Climate, technology and geography, inter alia, play important roles in shaping the water-energy-carbon nexus in different parts of the world. On the basis of an understanding of these differences and their influences, the authors have attempted to provide directions for process, program and policy interventions. For instance, Nantes needs to make an effort to restrict the use of herbicides and pesticides in order to improve the quality of water in the river Loire and thereby reduce the energy demand for treating raw water. Turin is a part, would do well to invest in more efficient wastewater treatment facilities, thus reducing the energy burden significantly on the upstream, while incurring a higher demand on the downstream. (C) 2014 Elsevier Ltd. All rights reserved. |
| [2] | <h2 class="secHeading" id="section_abstract">Abstract</h2><p id="">This paper describes the methodology and data used to determine greenhouse gas (GHG) emissions attributable to ten cities or city-regions: Los Angeles County, Denver City and County, Greater Toronto, New York City, Greater London, Geneva Canton, Greater Prague, Barcelona, Cape Town and Bangkok. Equations for determining emissions are developed for contributions from: electricity; heating and industrial fuels; ground transportation fuels; air and marine fuels; industrial processes; and waste. Gasoline consumption is estimated using three approaches: from local fuel sales; by scaling from regional fuel sales; and from counts of vehicle kilometres travelled. A simplified version of an intergovernmental panel on climate change (IPCC) method for estimating the GHG emissions from landfill waste is applied. Three measures of overall emissions are suggested: (i) actual emissions within the boundary of the city; (ii) single process emissions (from a life-cycle perspective) associated with the city's metabolism; and (iii) life-cycle emissions associated with the city's metabolism. The results and analysis of the study will be published in a second paper.</p> |
| [3] | Population of two cities in Pakistan has already crossed the 10-million figure and for the rest of the areas in the country populations are also increasing rapidly. Urbanization has boosted the use of energy in the cities and so is greenhouse gas (GHG) emissions but the ground situation as to the extent, vulnerability, past trends and future scenarios are not unveiled for the cities of Pakistan. Dearth of data in Pakistan is a huge hindrance to the investigation of energy use and actual GHG emissions. We dared to take steps in addressing this case and put preliminary efforts in compiling baseline sectoral breakdown of energy use, carbon emission and land cover/land use. Furthermore, the relationship of CO 2 source and sink is also explored. This study mainly tries to achieve three objectives. The results illustrate that industrial and residential sectors are vibrant consumers of energy and CO 2 emitters among all other sectors of the city. Sparse trees in the city and reduced agriculture areas by more than one-half in 2009 compared with those in 1975 are the main reasons for increased energy use and reduced CO 2 emissions from agriculture sector as well. However, all the other sectors have increased their CO 2 emissions in an escalating trend. The forecast analysis portrays the same trend too. Therefore, there is a need to make policy makers recognize such vulnerable situation of energy use and GHG emissions for them to take proper and timely actions to cope with the threats of climate change which can occur anytime in the very near future. |
| [4] | This report provides a framework to characterize and understand the important elements of climate and energy-water-land (EWL) system interactions. It identifies many of the important issues, discusses our understanding of those issues, and presents a long-term research program research needs to address the priority scientific challenges and gaps in our understanding. Much of the discussion is organized around two discrete case studies with the broad themes of (1) extreme events and (2) regional intercomparisons. These case studies help demonstrate unique ways in which energy-water-land interactions can occur and be influenced by climate. |
| [5] | Expansion of agriculture over ecosystem areas is widely recognized as one of the most significant human alterations to the global environment over the last century. Although food and fiber production are essential ecosystem services (ES) to humankind, the clearing of forests for agricultural use is associated with changes in land cover which affect a wide range of ES at local, regional and global scales. Considering the importance of climate change, freshwater scarcity, soil erosion and other environmental issues, this paper aims to simulate the impact of land-use change on the ecosystem services related to water and carbon biogeochemical processes. The system under study is the Taquarizinho river basin, located in the eastern region of Mato Grosso do Sul State, Brazil, inserted in the upland borders of one of the largest wetland systems of the world, the Pantanal. Formerly occupied by Brazilian savannah (Cerrado), more than half of Taquarizinho watershed was converted both to agriculture and pasture lands since the 1960s. In order to quantify the impact of land-use change on ES provided by Taquarizinho over the years, this paper introduces the hydro-carbon model, which dynamically represents ecosystem services related to water and carbon cycles, such as canal discharge, groundwater recharge, evapotranspiration, biomass carbon sequestration, litter carbon sequestration, and soil carbon sequestration. The hydro-carbon model uses emergy for estimating the monetary value of ecosystem services provided by the river basin under different land-use scenarios. In this paper, extreme scenarios represent typical land-use types in Taquarizinho basin: native savanna (NS), agroforestry systems (AF), conventional tillage agriculture (CT), no-tillage multiple cropping agriculture (NT), degraded pastures (DP), and pastures under improved management (IP). Results in this paper reveal a hierarchy related to water and carbon ES provision, in descending order: native savanna (247 EM$ ha(-1) y(-1)), agroforestry system (204 EM$ ha(-1) y(-1)), pastures under improved management (180 EM$ ha(-1) y(-1)), no-tillage multiple cropping agriculture (160 EM$ ha(-1) y(-1)), degraded pastures (104 EM$ ha(-1) y(-1)) and conventional tillage agriculture (75 EM$ ha(-1) y(-1)). (C) 2013 Elsevier B.V. All rights reserved. |
| [6] | Water, land and energy resources are all crucial contributors to food security. As a result of growing natural resource scarcity, the inter-connectedness of these sectors has become more apparent, as evidenced by growing tradeoffs and the incipient search for cross-sector efficiencies. Proactive engagement by the water, energy, land and food (WELF) sectors with important roles for national governments and international bodies is required to holistically assess and promote investment options that co-balance benefits across different sectors. Nexus assessments need to consider both human well-being and environmental outcomes, that is, the environment has to have 'a seat at the table' for nexus analyses. Outcomes must also be evaluated for the poor, whose well-being is tightly interrelated but often in conflict with maintaining environmental integrity. The Sustainable Development Goals (SDGs) represent a globally significant test for the implementation of nexus thinking. |
| [7] | |
| [8] | Agroecosystem models are strongly dependent on information on land management patterns for regional applications. Land management practices play a major role in determining global yield variability, and add an anthropogenic signal to the observed seasonality of atmospheric CO2 concentrations. However, there is still little knowledge on spatial and temporal variability of important farmland activities such as crop sowing dates, and thus these remain rather crudely approximated within carbon cycle studies.<br/>In this study, we present a framework allowing for spatiotemporally resolved simulation of cropland carbon fluxes under observational constraints on land management and canopy greenness. We apply data assimilation methodology in order to explicitly account for information on sowing dates and model leaf area index. MODIS 250m vegetation index data were assimilated both in batch-calibration for sowing date estimation and sequentially for improved model state estimation, using the ensemble Kalman filter (EnKF), into a crop carbon mass balance model (SPAc). In doing so, we are able to quantify the multiannual (2000-2006) regional carbon flux and biometry seasonality of maize-soybean crop rotations surrounding the Bondville Ameriflux eddy covariance site, averaged over 104 pixel locations within the wider area.<br/>(1) Validation at the Bondville site shows that growing season C cycling is simulated accurately with MODIS-derived sowing dates, and we expect that this framework allows for accurate simulations of C cycling at locations for which ground-truth data are not available. Thus, this framework enables modellers to simulate current (i.e. last 10 yr) carbon cycling of major agricultural regions. Averaged over the 104 field patches analysed, relative spatial variability for biometry and net ecosystem exchange ranges from similar to 7% to similar to 18 %. The annual sign of net biome productivity is not significantly different from carbon neutrality. (2) Moreover, observing carbon cycling at one single field with its individual sowing pattern is not sufficient to constrain large-scale agroecosystem carbon flux seasonality. Study area average growing season length is 20 days longer than observed at Bondville, primarily because of an earlier estimated start of season. (3) For carbon budgeting, additional information on cropland soil management and belowground carbon cycling has to be considered, as such constraints are not provided by MODIS. |
| [9] | |
| [10] | ½����̬ϵͳ̼ѭ������ѭ����ˮѭ����ȫ��仯��ѧ�о�����������,��½����̬ϵͳ̼��ˮ���ѭ�����̼���������ػ�������ȫ��仯��̬ѧ�о���ǰ���Կ�ѧ���⡣Ŀǰ,��½����̬ϵͳ̼��ˮ���ѭ�����̼�����ػ�����ʶ�IJ�������Լ����½������/����Ч��,Ԥ�����ȫ��仯����̬ϵͳ��������̼����Ӱ���ƿ�������⡣�������ۺϷ���½����̬ϵͳ̼��ˮѭ������Ϲ��̻�����,��������Լ��̬ϵͳ̼��ˮѭ���ռ���������ϵ���������ѧ����,��Լ������̬ϵͳ̼��ˮѭ����Ϲ�ϵ������������̬ѧ����,�Լ�������̬ϵͳ̼��ˮ���ѭ���Ĺؼ��������������ﻯѧ���̡��ص���������̬ϵͳ̼��ˮ���ѭ������Ҫ���̼���������ػ����о���չ,��������1��ֲ��ҶƬ�ڲ�����ѧ���̺�ϵ�ڲ�����ѧ���̼������̬ϵͳ̼��ˮ���ѭ�����ƻ���,�Լ�����֮��Ĺ����뻥����ϵ;��2���������﹦��Ⱥ���缰���̼��ѭ�����̵�Ӱ��;��3����̬ϵͳ̼��ˮ����ͨ����ʱ�ձ仯����,�Լ���̬ϵͳ����̬��ѧ����ѧ������ʵ�����������Ҫ�����˹��һ���ί�ش��о���Ŀ��ɭ����̬ϵͳ̼��ˮ���ѭ����������ƻ��ƣ����о�˼·������Ҫ�о����ݡ������ܹ�ͨ����Щ̽�ֶ��ƶ��ҹ����о�����Ļ������۽�����¼�����չ�������ס� . ½����̬ϵͳ̼ѭ������ѭ����ˮѭ����ȫ��仯��ѧ�о�����������,��½����̬ϵͳ̼��ˮ���ѭ�����̼���������ػ�������ȫ��仯��̬ѧ�о���ǰ���Կ�ѧ���⡣Ŀǰ,��½����̬ϵͳ̼��ˮ���ѭ�����̼�����ػ�����ʶ�IJ�������Լ����½������/����Ч��,Ԥ�����ȫ��仯����̬ϵͳ��������̼����Ӱ���ƿ�������⡣�������ۺϷ���½����̬ϵͳ̼��ˮѭ������Ϲ��̻�����,��������Լ��̬ϵͳ̼��ˮѭ���ռ���������ϵ���������ѧ����,��Լ������̬ϵͳ̼��ˮѭ����Ϲ�ϵ������������̬ѧ����,�Լ�������̬ϵͳ̼��ˮ���ѭ���Ĺؼ��������������ﻯѧ���̡��ص���������̬ϵͳ̼��ˮ���ѭ������Ҫ���̼���������ػ����о���չ,��������1��ֲ��ҶƬ�ڲ�����ѧ���̺�ϵ�ڲ�����ѧ���̼������̬ϵͳ̼��ˮ���ѭ�����ƻ���,�Լ�����֮��Ĺ����뻥����ϵ;��2���������﹦��Ⱥ���缰���̼��ѭ�����̵�Ӱ��;��3����̬ϵͳ̼��ˮ����ͨ����ʱ�ձ仯����,�Լ���̬ϵͳ����̬��ѧ����ѧ������ʵ�����������Ҫ�����˹��һ���ί�ش��о���Ŀ��ɭ����̬ϵͳ̼��ˮ���ѭ����������ƻ��ƣ����о�˼·������Ҫ�о����ݡ������ܹ�ͨ����Щ̽�ֶ��ƶ��ҹ����о�����Ļ������۽�����¼�����չ�������ס� |
| [11] | ����Leuning��������ϵĹ�����á������Ⱥ�����ƽ�ⷽ��,�Խ��ڲ�ֳɶ��ķ�ʽ,����Gaussian�����ַ������ڲ�ƽ����Ϊ���ķ���,�������´��콻�ֵ�̼ˮͨ��,����ۼ����ڲ�߶�,��ģ��CO<sub>2</sub>��H<sub>2</sub>Oͨ������ģ���Գ�������۲�������Ϊ��������,������ڲ������֮���̼ˮ����,���ж����ϵͳ��ͨ���۲����ݽ��бȽ�,�����˲�ͬ�Ĺڲ�ֲ㷽ʽ�Զ��ģ��ģ������Ӱ�졣��3���´��콻��ͨ��վ�ж����ϵͳ������ƽ��պ϶�����,�й�����ɽվCBS������GDK���ձ�MMFվ�������ƽ�����(EBR)�ֱ�Ϊ0.76��0.66��1.07,���ڹ���ͬ��۲ⷶΧ(0.34-1.2)������ˮƽ,���,�ж����ϵͳ�Ĺ۲����ݽ�Ϊ�ɿ�����̼ˮͨ�����ձ仯����,��Gaussian�����ַ����ڲ��Ϊ����ģ���ܽϺõ�ģ��̼ˮͨ����"������"�ձ仯���ơ�ҹ��<em>Fc</em>Ϊ��ֵ�ұ仯���ƽ�Ϊƽ��,������̬ϵͳ���к��������ͷ�CO<sub>2</sub>,���ճ���ʼ<em>Fc</em>��Ϊ��ֵ,������̬ϵͳ���й����������CO<sub>2</sub>,<em>Fc</em>������ʱ�ִﵽ���ֵ,����<em>Fc</em>��С,����֮���ֻظ���ҹ��ĸ�ֵ��H<sub>2</sub>Oͨ�����ձ仯������CO<sub>2</sub>ͨ������,��ģ��ֵ���ж����ʵ��ֵ���нϺõ�һ���ԡ��ڶ��ģ����,�Թڲ���ò�ͬ�ķֲ㷽��,��̼ˮͨ��ģ������һ����Ӱ�졣��Gaussian�����ַ����ڲ��Ϊ���ķ�����Ϊ����,�ֱڲ�ƽ����Ϊ2��5��10��20��ķ����õ���̼ˮͨ��������бȽϡ���ƽ��ֵ����,�ֲ�Խ��,H<sub>2</sub>Oͨ��ģ��ֵԽ��,��CO<sub>2</sub>ͨ��ģ��ֵԽ�ߡ���ͬ�ķֲ㷽�������IJ���,��Ҫ�����ڲ�ͬ��ķ������ա���ʪ�ȡ����ٵȻ���Ҫ�صĴ�ֱ���߲���,��ҶƬ������öԹ����Ӧ�Ƿ����Եġ� . ����Leuning��������ϵĹ�����á������Ⱥ�����ƽ�ⷽ��,�Խ��ڲ�ֳɶ��ķ�ʽ,����Gaussian�����ַ������ڲ�ƽ����Ϊ���ķ���,�������´��콻�ֵ�̼ˮͨ��,����ۼ����ڲ�߶�,��ģ��CO<sub>2</sub>��H<sub>2</sub>Oͨ������ģ���Գ�������۲�������Ϊ��������,������ڲ������֮���̼ˮ����,���ж����ϵͳ��ͨ���۲����ݽ��бȽ�,�����˲�ͬ�Ĺڲ�ֲ㷽ʽ�Զ��ģ��ģ������Ӱ�졣��3���´��콻��ͨ��վ�ж����ϵͳ������ƽ��պ϶�����,�й�����ɽվCBS������GDK���ձ�MMFվ�������ƽ�����(EBR)�ֱ�Ϊ0.76��0.66��1.07,���ڹ���ͬ��۲ⷶΧ(0.34-1.2)������ˮƽ,���,�ж����ϵͳ�Ĺ۲����ݽ�Ϊ�ɿ�����̼ˮͨ�����ձ仯����,��Gaussian�����ַ����ڲ��Ϊ����ģ���ܽϺõ�ģ��̼ˮͨ����"������"�ձ仯���ơ�ҹ��<em>Fc</em>Ϊ��ֵ�ұ仯���ƽ�Ϊƽ��,������̬ϵͳ���к��������ͷ�CO<sub>2</sub>,���ճ���ʼ<em>Fc</em>��Ϊ��ֵ,������̬ϵͳ���й����������CO<sub>2</sub>,<em>Fc</em>������ʱ�ִﵽ���ֵ,����<em>Fc</em>��С,����֮���ֻظ���ҹ��ĸ�ֵ��H<sub>2</sub>Oͨ�����ձ仯������CO<sub>2</sub>ͨ������,��ģ��ֵ���ж����ʵ��ֵ���нϺõ�һ���ԡ��ڶ��ģ����,�Թڲ���ò�ͬ�ķֲ㷽��,��̼ˮͨ��ģ������һ����Ӱ�졣��Gaussian�����ַ����ڲ��Ϊ���ķ�����Ϊ����,�ֱڲ�ƽ����Ϊ2��5��10��20��ķ����õ���̼ˮͨ��������бȽϡ���ƽ��ֵ����,�ֲ�Խ��,H<sub>2</sub>Oͨ��ģ��ֵԽ��,��CO<sub>2</sub>ͨ��ģ��ֵԽ�ߡ���ͬ�ķֲ㷽�������IJ���,��Ҫ�����ڲ�ͬ��ķ������ա���ʪ�ȡ����ٵȻ���Ҫ�صĴ�ֱ���߲���,��ҶƬ������öԹ����Ӧ�Ƿ����Եġ� |
| [12] | <p>ɭ����̬ϵͳ��̼ˮ��ϵ��½����̬ϵͳ̼ѭ����ˮѭ�����ϵ����ù���,���о�ɭ��̼�㡢ɭ����̬ˮ�Ĺ��̺�ȫ��仯��Ӧ����Ҫ����.��ȫ��仯������,ɭ����̬ϵͳ̼ˮ��ϵ�ѳ�Ϊ��̬ˮ��ѧ�����е�һ���ȵ��ѧ����.�������ܽ������ɭ��̼���о��Ļ�����,������ɭ��̼ˮ��ϵ�Ĺ��̻���,����ɭ��ˮ������Ч�ʡ���ͬ�߶��ϵ�̼ˮ��ϵ���߶������̼ˮ��ϵ��ģ���о�����Ľ�չ;�ܽ���Ӱ��ɭ��̼ˮ��ϵ�����Ӻ��о���չ,����ˮ��������CO<sub>2</sub>��Ũ�����ߡ����¡�������������Ũ�ȱ仯���������Ӻͺ����ݶ����Ӷ�ɭ��̼ˮ��ϵ��Ӱ��;���������о����ڵ���������˳�������,����δ���о����ݺͷ��������չ��.</p> . <p>ɭ����̬ϵͳ��̼ˮ��ϵ��½����̬ϵͳ̼ѭ����ˮѭ�����ϵ����ù���,���о�ɭ��̼�㡢ɭ����̬ˮ�Ĺ��̺�ȫ��仯��Ӧ����Ҫ����.��ȫ��仯������,ɭ����̬ϵͳ̼ˮ��ϵ�ѳ�Ϊ��̬ˮ��ѧ�����е�һ���ȵ��ѧ����.�������ܽ������ɭ��̼���о��Ļ�����,������ɭ��̼ˮ��ϵ�Ĺ��̻���,����ɭ��ˮ������Ч�ʡ���ͬ�߶��ϵ�̼ˮ��ϵ���߶������̼ˮ��ϵ��ģ���о�����Ľ�չ;�ܽ���Ӱ��ɭ��̼ˮ��ϵ�����Ӻ��о���չ,����ˮ��������CO<sub>2</sub>��Ũ�����ߡ����¡�������������Ũ�ȱ仯���������Ӻͺ����ݶ����Ӷ�ɭ��̼ˮ��ϵ��Ӱ��;���������о����ڵ���������˳�������,����δ���о����ݺͷ��������չ��.</p> |
| [13] | . We assessed the effects of rising atmospheric CO(2), changing climate, and farmers' practice on the carbon and water balance of European croplands during the past century (1901-2000). The coupled vegetation-crop model ORCHIDEE-STICS is applied over western Europe for C3 crops (winter wheat) and for maize, with prescribed historical agricultural practice changes. Not surprisingly, the enormous crop yield increase observed in all European regions, 300-400% between 1950 and 2000, is found to be dominantly explained by improved practice and varieties selection, rather than by rising CO(2) (explaining a similar to 11% uniform increase in yield) and changing climate (no further change in yield on average, but causing a decrease of similar to 19% in the southern Iberian Peninsula). Agricultural soil carbon stocks in Europe are modeled to have decreased between 1950 and 1970, and since then to have increased again. Thus, the current stocks only differ by 1 +/- 6 tC ha(-1) from their 1900 value. Compensating effects of increasing yields on the one hand (increasing stocks) and of higher harvest index values and ploughing on the other hand (decreasing stocks) occur. Each of these processes taken individually has the potential to strongly alter the croplands soil carbon balance in the model. Consequently, large uncertainties are associated to the estimated change in carbon stocks between 1901 and 2001, roughly +/- 6 tC ha(-1) a(-1). In our most realistic simulation, the current cropland carbon balance is a net sink of 0.16 +/- 0.15 tC ha(-1) a(-1). The annual water balance of cropland soils is influenced by increasing crop water use efficiency, one third of which is caused by rising CO(2). However, increasing water use efficiency occurred mainly in spring and winter, when water is not limiting for plant growth, whereas no strong savings of soil water are achieved in summer through elevated CO(2). Overall, trends in cultivation practices have caused a 3 times larger increase of water use efficiency than rising CO(2). |
| [14] | Carbon (C) and water cycles of terrestrial ecosystems are two coupled ecological processes controlled partly by stomatal behavior. Water-use efficiency (WUE) reflects the coupling relationship to some extent. At stand and ecosystem levels, the variability of WUE results from the trade-off between water loss and C gain in the process of plant photosynthetic C assimilation. Continuous observations of C, water, and energy fluxes were made at three selected forest sites of ChinaFLUX with eddy covariance systems from 2003 to 2005. WUE at different temporal scales were defined and calculated with different C and water flux components. Variations in WUE were found among three sites. Average annual WUE was 9.43 mg CO(2) g(-1) H(2)O at Changbaishan temperate broad-leaved Korean pine mixed forest, 9.27 mg CO(2) g(-1) H(2)O at Qianyanzhou subtropical coniferous plantation, and 6.90 mg CO(2) g(-1) H(2)O at Dinghushan subtropical evergreen broad-leaved forest. It was also found that temperate and subtropical forest ecosystems had different relationships between gross primary productivity (GPP) and evapotranspiration (ET). Variations in WUE indicated the difference in the coupling between C and water cycles. The asynchronous response of GPP and ET to climatic variables determined the coupling and decoupling between C and water cycles for the two regional forest ecosystems. |
| [15] | �˹�����̬ϵͳ���ҹ�ɭ����̬ϵͳ����Ҫ��ɲ���,��ȫ��̼ƽ���е�����Խ��Խ�ܵ����ӡ�����ǧ�������ȴ��˹���Ҷ��ͨ���۲�վ��̼ˮͨ��������۲�����,ͨ��ģ�������ںϷ�����̼ˮѭ������ģ�͡���SIPNETģ�ؼ��������з���,ģ����2004-2009��ǧ�����˹�����̬ϵͳ��̼ˮͨ�����������:����̼ͨ���۲������Ż�ģ�Ͳ���ʱ,����̬ϵͳ̼������(NEE)ģ��Ч���Ϻ�(<em>R</em><sup>2</sup>=0.934),����̬ϵͳ��ɢ(ET)ģ��Ч���ϲ�(<em>R</em><sup>2</sup>=0.188);ͬʱ��̼ˮͨ���۲������Ż�ʱ,NEEģ��Ч���Բ�(<em>R</em><sup>2</sup>=0.929),��ETģ��Ч����������(<em>R</em><sup>2</sup>=0.824),˵������̼ˮͨ���۲�����ͬʱ�Ż�,SIPNETģ�Ͳ��ܽϺõ�ģ������վ��̼ˮͨ�����ڴ˻�����,��չ���˹�����̬ϵͳ̼ͨ���Խ�ˮ�仯��Ӧ�������Է���,���ֽ�ˮ�����ٶԹ�����õ�Ӱ��ȶԺ������õ�Ӱ���Ϊǿ��,��̼ˮͨ��ͬʱ�����Ż�ʱģ�Ͳ��ܽϺõ�ģ��̼ͨ���潵ˮ���ٶ����ٽ��͵�����,�����������ͬʱ����̼ˮͨ�����в����Ż�,ģ������ȷ��ʾ��̬ϵͳ̼ѭ���Խ�ˮ�������Ӧ�� . �˹�����̬ϵͳ���ҹ�ɭ����̬ϵͳ����Ҫ��ɲ���,��ȫ��̼ƽ���е�����Խ��Խ�ܵ����ӡ�����ǧ�������ȴ��˹���Ҷ��ͨ���۲�վ��̼ˮͨ��������۲�����,ͨ��ģ�������ںϷ�����̼ˮѭ������ģ�͡���SIPNETģ�ؼ��������з���,ģ����2004-2009��ǧ�����˹�����̬ϵͳ��̼ˮͨ�����������:����̼ͨ���۲������Ż�ģ�Ͳ���ʱ,����̬ϵͳ̼������(NEE)ģ��Ч���Ϻ�(<em>R</em><sup>2</sup>=0.934),����̬ϵͳ��ɢ(ET)ģ��Ч���ϲ�(<em>R</em><sup>2</sup>=0.188);ͬʱ��̼ˮͨ���۲������Ż�ʱ,NEEģ��Ч���Բ�(<em>R</em><sup>2</sup>=0.929),��ETģ��Ч����������(<em>R</em><sup>2</sup>=0.824),˵������̼ˮͨ���۲�����ͬʱ�Ż�,SIPNETģ�Ͳ��ܽϺõ�ģ������վ��̼ˮͨ�����ڴ˻�����,��չ���˹�����̬ϵͳ̼ͨ���Խ�ˮ�仯��Ӧ�������Է���,���ֽ�ˮ�����ٶԹ�����õ�Ӱ��ȶԺ������õ�Ӱ���Ϊǿ��,��̼ˮͨ��ͬʱ�����Ż�ʱģ�Ͳ��ܽϺõ�ģ��̼ͨ���潵ˮ���ٶ����ٽ��͵�����,�����������ͬʱ����̼ˮͨ�����в����Ż�,ģ������ȷ��ʾ��̬ϵͳ̼ѭ���Խ�ˮ�������Ӧ�� |
| [16] | Carbon dioxide (CO2) transfer from inland waters to the atmosphere, known as CO2 evasion, is a component of the global carbon cycle. Global estimates of CO2 evasion have been hampered, however, by the lack of a framework for estimating the inland water surface area and gas transfer velocity and by the absence of a global CO2 database. Here we report regional variations in global inland water surface area, dissolved CO2 and gas transfer velocity. We obtain global CO2 evasion rates of 1.8(-0.25)(+0.25) petagrams of carbon (Pg C) per year from streams and rivers and 0.32(-0.26)(+0.52) Pg C yr(-1) from lakes and reservoirs, where the upper and lower limits are respectively the 5th and 95th confidence interval percentiles. The resulting global evasion rate of 2.1 Pg C yr(-1) is higher than previous estimates owing to a larger stream and river evasion rate. Our analysis predicts global hotspots in stream and river evasion, with about 70 per cent of the flux occurring over just 20 per cent of the land surface. The source of inland water CO2 is still not known with certainty and new studies are needed to research the mechanisms controlling CO2 evasion globally. |
| [17] | . The emissions of carbon dioxide (CO) and methane (CH) from the Petit Saut hydroelectric reservoir (Sinnamary River, French Guiana) to the atmosphere were quantified for 10 years since impounding in 1994. Diffusive emissions from the reservoir surface were computed from direct flux measurements in 1994, 1995, and 2003 and from surface concentrations monitoring. Bubbling emissions, which occur only at water depths lower than 10 m, were interpolated from funnel measurements in 1994, 1997, and 2003. Degassing at the outlet of the dam downstream of the turbines was calculated from the difference in gas concentrations upstream and downstream of the dam and the turbined discharge. Diffusive emissions from the Sinnamary tidal river and estuary were quantified from direct flux measurements in 2003 and concentrations monitoring. Total carbon emissions were 0.37 ± 0.01 Mt yrC (COemissions, 0.30 ± 0.02; CHemissions, 0.07 ± 0.01) the first 3 years after impounding (1994-1996) and then decreased to 0.12 ± 0.01 Mt yrC (CO, 0.10 ± 0.01; CH, 0.016 ± 0.006) since 2000. On average over the 10 years, 61% of the COemissions occurred by diffusion from the reservoir surface, 31% from the estuary, 7% by degassing at the outlet of the dam, and a negligible fraction by bubbling. CHdiffusion and bubbling from the reservoir surface were predominant (40% and 44%, respectively) only the first year after impounding. Since 1995, degassing at an aerating weir downstream of the turbines has become the major pathway for CHemissions, reaching 70% of the total CHflux. In 2003, river carbon inputs were balanced by carbon outputs to the ocean and were about 3 times lower than the atmospheric flux, which suggests that 10 years after impounding, the flooded terrestrial carbon is still the predominant contributor to the gaseous emissions. In 10 years, about 22% of the 10 Mt C flooded was lost to the atmosphere. Our results confirm the significance of greenhouse gas emissions from tropical reservoir but stress the importance of: (1) considering all the gas pathways upstream and downstream of the dams and (2) taking into account the reservoir age when upscaling emissions rates at the global scale. |
| [18] | ABSTRACT Cited By (since 1996): 19, Export Date: 15 February 2013, Source: Scopus |
| [19] | ˮ���Ǿ�����������Ч������ ��Դ��ʽ,��ˮ��DZ�ڵ���������ЧӦ���������ܹ���,��һ���̶���Ӱ�������Ƕ�ˮ�������Դ���Ե���ʶ.���о��ֱ���2010��8��ˮ���ˮλ�����ڼ� 12�¸�ˮλ������,����Ͽ��������֧��������Ϫ��������Ȫ������˫��6���س̶������ˮ���IJɼ�����������ͨ���ļ���о�.�������,�ں���������,�� ��ˮ��ˮ�¡�pH���س�����,��CO2��ѹ(pCO2)�ͼ��(TA)�����෴����.�ڵ�ˮλ��8��,�������¶���CO2ͨ��Ϊ��,�Ҹ���ֲ������ǿ� ��ˮ��CO2ͨ����Ӫ���εĹؼ�����֮һ.��Ϫ�ӻ�ˮ��CO2ͨ�������Ȼ�ӵ���������(��Ȫ)ƽ��������3.26 mmol.(m2.h)-1,��CH4ͨ��ȴ�����������.�ڸ�ˮλ���е�12��,��Ϫ�Ӹ������ΪCO2�ͷ�ͨ��,CH4ͨ����ȵ�ˮλ�����Խ���.�� �Ƚ���Ȼ�ӵ�����Ȫ����,��Ϫ�ӻ�ˮ���ڸ�ˮλ����״̬��CO2��CH4ͨ���ֱ�������4.16mmol.(m2.h)-1��0.007 mmol.(m2.h)-1.�����ľ�ͨ����������,��ˮ��ϼ��ô�ʵ��ˮ��ľ�ͨ��������. . ˮ���Ǿ�����������Ч������ ��Դ��ʽ,��ˮ��DZ�ڵ���������ЧӦ���������ܹ���,��һ���̶���Ӱ�������Ƕ�ˮ�������Դ���Ե���ʶ.���о��ֱ���2010��8��ˮ���ˮλ�����ڼ� 12�¸�ˮλ������,����Ͽ��������֧��������Ϫ��������Ȫ������˫��6���س̶������ˮ���IJɼ�����������ͨ���ļ���о�.�������,�ں���������,�� ��ˮ��ˮ�¡�pH���س�����,��CO2��ѹ(pCO2)�ͼ��(TA)�����෴����.�ڵ�ˮλ��8��,�������¶���CO2ͨ��Ϊ��,�Ҹ���ֲ������ǿ� ��ˮ��CO2ͨ����Ӫ���εĹؼ�����֮һ.��Ϫ�ӻ�ˮ��CO2ͨ�������Ȼ�ӵ���������(��Ȫ)ƽ��������3.26 mmol.(m2.h)-1,��CH4ͨ��ȴ�����������.�ڸ�ˮλ���е�12��,��Ϫ�Ӹ������ΪCO2�ͷ�ͨ��,CH4ͨ����ȵ�ˮλ�����Խ���.�� �Ƚ���Ȼ�ӵ�����Ȫ����,��Ϫ�ӻ�ˮ���ڸ�ˮλ����״̬��CO2��CH4ͨ���ֱ�������4.16mmol.(m2.h)-1��0.007 mmol.(m2.h)-1.�����ľ�ͨ����������,��ˮ��ϼ��ô�ʵ��ˮ��ľ�ͨ��������. |
| [20] | Ϊ���о�ˮ����������Դ��仯��ѡ���彭����ˮ����ˮ����Ϊ�о��������� 2010 �� 5 �º� 10 �¿�չ��2��ԭλ�۲����飬��ȡ��ˮ����ˮ��ˮ�����������̼�ͼ��齻��ͨ����ˮ���Ͽմ�����������Ũ�ȴ�ֱ�仯���ɼ�ˮ�������ӡ����������ˮ����ˮ�� 2010 �� 5 �·�ˮ���Ͽմ���������̼Ũ���� 0.5 m �߶�������ߣ����б���ˮ�¶�ˮ��ˮ�������̼Դ���λ������Ҫ��Ӱ�죻 2010�� 10 �·�ˮ����ˮ��ˮ�����������̼�ͼ��齻��ͨ�����ŷ�״̬��ƽ��ͨ���ֱ�Ϊ3 740.92 ±1 872.56mg·m -2·d -1��1.22±0.57mg·m -2·d -1�����������´����ȴ���Ҫˮ��Ҫ�͵ö࣬�ӽ����й�̫���Ͷ�������Ȼˮ���ŷ�ˮƽ��������̼ͨ���Ŀռ�ֲ������ε���ǰ�������ߵ����ƣ�������Ŀռ�ֲ�����������෴�����ơ��о���Ϊ�ҹ�ˮ�����������ѧ�о��ṩ�˱����ʾ��������Ϊ��չˮ�������Դ�����ṩ��ѧ֧�š� . Ϊ���о�ˮ����������Դ��仯��ѡ���彭����ˮ����ˮ����Ϊ�о��������� 2010 �� 5 �º� 10 �¿�չ��2��ԭλ�۲����飬��ȡ��ˮ����ˮ��ˮ�����������̼�ͼ��齻��ͨ����ˮ���Ͽմ�����������Ũ�ȴ�ֱ�仯���ɼ�ˮ�������ӡ����������ˮ����ˮ�� 2010 �� 5 �·�ˮ���Ͽմ���������̼Ũ���� 0.5 m �߶�������ߣ����б���ˮ�¶�ˮ��ˮ�������̼Դ���λ������Ҫ��Ӱ�죻 2010�� 10 �·�ˮ����ˮ��ˮ�����������̼�ͼ��齻��ͨ�����ŷ�״̬��ƽ��ͨ���ֱ�Ϊ3 740.92 ±1 872.56mg·m -2·d -1��1.22±0.57mg·m -2·d -1�����������´����ȴ���Ҫˮ��Ҫ�͵ö࣬�ӽ����й�̫���Ͷ�������Ȼˮ���ŷ�ˮƽ��������̼ͨ���Ŀռ�ֲ������ε���ǰ�������ߵ����ƣ�������Ŀռ�ֲ�����������෴�����ơ��о���Ϊ�ҹ�ˮ�����������ѧ�о��ṩ�˱����ʾ��������Ϊ��չˮ�������Դ�����ṩ��ѧ֧�š� |
| [21] | ���þ�̬��-����ɫ�����Ͼ�4������(���ػ��ӡ����ػ��ӡ��ӡ��Ž��)��1��ˮ��(����ˮ��)�Ĵ���ˮ-������CO2��CH4��N2O 3����������ͨ�����а�����ҹ�仯�ij����۲�,����仯���Ƽ�Ӱ�����ؼ��Է���.�������,�����Ž��CO2��CH4���ŷ������,�ֱ�Ϊ1023.34,89.45mg/(m2��h),�����������ŷ�����֮,�ڡ����ػ���CO2�ŷ����൱,�����ػ�CH4���ŷ��������ػ�С1������.����ˮ���2�����������ŷ�����С.��N2O���ŷ������,Ϊ151.31��g/(m2��h),�Ž��N2O�ŷ�����֮[111.74��g/(m2��h)],����2�������Ͷ���ˮ��N2O���ŷ�������һ��������(101).ˮ-����������������ŷ����¶ȡ�ѹ�������ٵȻ�������Ӱ��.�����������ҹ�仯�����������,���˽�N2O���ŷ�����Ϊ����ŷš�ҹ��������,�������������ˮ���Ϊ����������ŷ�Դ.���ػ��Ͷ���ˮ����ŷ���������Ϊ����Ӱ��ϴ�,���ػ��ӵ��ŷ�������Ҫ��ˮλ�ĸߵͱ仯Ӱ��,�Ž�ӵ��ŷ����ܷ��ٺ��¶ȵĹ�ͬӰ��.����Ҫ���������Ӱ��3����������������Ե���ҹ�仯.5��ˮ���ڴ����Ǵ���3�������������Ҫ�ŷ�Դ. . ���þ�̬��-����ɫ�����Ͼ�4������(���ػ��ӡ����ػ��ӡ��ӡ��Ž��)��1��ˮ��(����ˮ��)�Ĵ���ˮ-������CO2��CH4��N2O 3����������ͨ�����а�����ҹ�仯�ij����۲�,����仯���Ƽ�Ӱ�����ؼ��Է���.�������,�����Ž��CO2��CH4���ŷ������,�ֱ�Ϊ1023.34,89.45mg/(m2��h),�����������ŷ�����֮,�ڡ����ػ���CO2�ŷ����൱,�����ػ�CH4���ŷ��������ػ�С1������.����ˮ���2�����������ŷ�����С.��N2O���ŷ������,Ϊ151.31��g/(m2��h),�Ž��N2O�ŷ�����֮[111.74��g/(m2��h)],����2�������Ͷ���ˮ��N2O���ŷ�������һ��������(101).ˮ-����������������ŷ����¶ȡ�ѹ�������ٵȻ�������Ӱ��.�����������ҹ�仯�����������,���˽�N2O���ŷ�����Ϊ����ŷš�ҹ��������,�������������ˮ���Ϊ����������ŷ�Դ.���ػ��Ͷ���ˮ����ŷ���������Ϊ����Ӱ��ϴ�,���ػ��ӵ��ŷ�������Ҫ��ˮλ�ĸߵͱ仯Ӱ��,�Ž�ӵ��ŷ����ܷ��ٺ��¶ȵĹ�ͬӰ��.����Ҫ���������Ӱ��3����������������Ե���ҹ�仯.5��ˮ���ڴ����Ǵ���3�������������Ҫ�ŷ�Դ. |
| [22] | |
| [23] | . |
| [24] | ������������������ˮϵͳ��̼�ŷ�ΪĿ�ģ���������ˮϵͳ��̼�ŷŵĻ���ԭ����̽�ֹ�ˮϵͳ����ˮ����ϵͳ������ˮϵͳ�����ϵͳ̼�ŷŵĹ��ɺ����������������ܳ���ˮϵͳ̼���ŵ�;���� ������������������ˮϵͳ��̼�ŷ�ΪĿ�ģ���������ˮϵͳ��̼�ŷŵĻ���ԭ����̽�ֹ�ˮϵͳ����ˮ����ϵͳ������ˮϵͳ�����ϵͳ̼�ŷŵĹ��ɺ����������������ܳ���ˮϵͳ̼���ŵ�;���� |
| [25] | ������ʶ��ˮѭ����̼ƽ��������û��ƻ�����,ϵͳ����ˮ�翪����ˮ��Դ��������̬��������ͺ��ˣ�ˮ�ˣ�����ˮ��Դ����Դ���������е�̼�������ͷ�����,������ڵ�̼��չģʽ��ˮ��Դ�����ں�����������������,����������̼ˮ���ģ���ˮ��Դ����Ϊ��Ҫ֧�ŵļ������,����̽���˻��ڵ�̼ģʽ��ˮ��Դ���á�ģ���������������á�������ѡ���̡��Բ����ϴ�ʩ�ƶ��ȹؼ��������⡣ . ������ʶ��ˮѭ����̼ƽ��������û��ƻ�����,ϵͳ����ˮ�翪����ˮ��Դ��������̬��������ͺ��ˣ�ˮ�ˣ�����ˮ��Դ����Դ���������е�̼�������ͷ�����,������ڵ�̼��չģʽ��ˮ��Դ�����ں�����������������,����������̼ˮ���ģ���ˮ��Դ����Ϊ��Ҫ֧�ŵļ������,����̽���˻��ڵ�̼ģʽ��ˮ��Դ���á�ģ���������������á�������ѡ���̡��Բ����ϴ�ʩ�ƶ��ȹؼ��������⡣ |
| [26] | The modelling and mapping of ecosystem services (ES) are important components of any programme of land management planning, as they help evaluate the potential benefits that ecosystems provide to society. The objective of this paper is to evaluate ES for setting priorities and planning carbon and water resource management in Colombia. By using information related to provision and regulation services for water, carbon storage and protection services against extreme events such as landslides, we have evaluated the spatial distribution of ES and identified geographical hotspots. The results are presented for two levels of analyses: (1) natural regions and (2) watersheds. We found differences in the distribution and range of values for ES and observed that each region and watershed tends to maximise one or two services, with the exception of the Caribbean region, which presents low values for most services. The services of water resources provision, regulation of water flow and carbon storage in the above-ground biomass presented high correlations among them, with the Pacific and Amazonian regions presenting the highest average values for these ES. The Andean region was important for the prevention of landslides and the amount of carbon in the soil. At the watershed level, the Amazon watershed and those associated with transition areas (piedmont) between the Andes and the lowlands of the Amazonian, Orinoquia and Pacific regions were the areas where the greatest number of hotspots was concentrated. These results provide valuable information on how better use official institutional information to quickly define and prioritise ES, to guide management actions within the country's recent policies on integrated water resources management and on biodiversity and ES. |
| [27] | |
| [28] | |
| [29] | In this paper, two-step hierarchical methodology is utilized to quantify the transportation related carbon, energy and water footprint (FP) of nation’s manufacturing sectors and evaluate the environmental vs. economic performance based on eco-efficiency scores. The methodology consists of an integrated application of the economic input output life cycle assessment (EIO-LCA) and Data Envelopment Analysis (DEA) approaches. In the first phase, EIO-LCA is employed to quantify the environmental impacts associated with the activities between 276 manufacturing sectors and the transportation industry and the second phase compares the overall environmental impact vs. economic benefit tradeoff by determining the eco-efficiency value of each sector. Results of EIO-LCA indicated that food manufacturing is found to be as the major driver of carbon, energy and water FP categories with an approximate share of 22% of the total impact on freight transportation activities in the transportation industry. Additionally, based on DEA-based sustainability performance assessment results, vast majority of U.S. manufacturing sectors were found to be inefficient (eco-efficiency <1). Only tobacco manufacturing was found to be eco-efficient among 53 major manufacturing sectors and the U.S. average was obtained as 0.5. Results indicated that inefficient U.S. manufacturing sectors need to reach an average reduction of 50% on the carbon, energy and water FP impacts to reach the 100% eco-efficiency frontier. Additionally, the weight of the transported goods was incorporated into the economic output as $/ton-km carriage, which yielded highly correlated results with the initial assessment based on total economic output only. |
| [30] | Water reclamation has the potential to reduce water supply demands from aquifers and more energy-intensive water production methods (e.g., seawater desalination). However, water reclamation via biological nitrification�Cdenitrification is also associated with the direct emission of the greenhouse gases (GHGs) CO 2 , N 2 O, and CH 4 . We quantified these direct emissions from the nitrification�Cdenitrification reactors of a water reclamation plant in Southern California, and measured the 14 C content of the CO 2 to distinguish between short- and long-lived carbon. The total emissions were 1.5 (��0.2) g-fossil CO 2 m 613 of wastewater treated, 0.5 (��0.1) g-CO 2 -eq of CH 4 m 613 , and 1.8 (��0.5) g-CO 2 -eq of N 2 O m 613 , for a total of 3.9 (��0.5) g-CO 2 -eqm 613 . This demonstrated that water reclamation can be a source of GHGs from long lived carbon, and thus a candidate for GHG reduction credit. From the 14 C measurements, we found that between 11.4% and 15.1% of the CO 2 directly emitted was derived from fossil sources, which challenges past assumptions that the direct CO 2 emissions from water reclamation contain only modern carbon. A comparison of our direct emission measurements with estimates of indirect emissions from several water production methods, however, showed that the direct emissions from water reclamation constitute only a small fraction of the plant's total GHG footprint. |
| [31] | The performance of the Canadian Land Surface Scheme (CLASS) was evaluated against observed eddy covariance flux data from four commonly cultivated crops growing in different climatic conditions. Of the four crops examined, wheat and soybean are C |
| [32] | Pear trees ( Pyrus bretschneideri Rehd ) play an important role in the fruit production in the North China Plain (NCP) where water shortage is a serious problem. The objectives of this research were to explore the characteristics of water balance, energy transfer and carbon exchange of irrigated pear orchards by a combination of multiple measurement methods (eddy covariance system, sap flow method, and the other equipment). Experiments from 08/01/2011 to 10/31/2012 were conducted in a pear orchard located in the NCP. Annual net radiation (Rn) was 249002MJ02m 612 of which latent heat flux accounted for 74.5%, a little higher than the agro-ecosystem with wheat�Cmaize rotation (70%). Annual mean water use efficient ( WUE ) was 1.9802g02CO 2 /kg02H 2 O which was lower than the agro-ecosystem in the same area. Annual evapotranspiration ( ET ) was 75902mm and daily transpiration ( T ) ranged from 0.5 to 4.302mm during May to October while daily T / ET varied from 0.6 to 0.9. Variation of ET can be explained well by the change of LAI. As annual drainage was 8602mm, it will take a long time for the shallow soil water (0�C14002cm) to replenish deep groundwater. Optimal values of daily downward short wave radiation (Rs) (2002MJ02m 612 02d 611 ) and ET (654.802mm02d 611 ) were probably important thresholds for the plant growth. Changing irrigation method and crops planting structure adjusting according to the water balance and trees growth characteristics, were probably useful for keeping high yield with less water depletion while further research should be done in future. |
| [33] | Abstract Nitrous oxide (N 2 O) fluxes from soil under mown grassland were monitored using static chambers over three growing seasons in intensively and extensively managed systems in Central Switzerland. Emissions were largest following the application of mineral (NH 4 NO 3 ) fertilizer, but there were also substantial emissions following cattle slurry application, after grass cuts and during the thawing of frozen soil. Continuous flux sampling, using automatic chambers, showed marked diurnal patterns in N 2 O fluxes during emission peaks, with highest values in the afternoon. Net uptake fluxes of N 2 O and subambient N 2 O concentrations in soil open pore space were frequently measured on both fields. Flux integration over 2.5 years yields a cumulated emission of +4.765kgN 2 O-N65ha 611 for the intensively managed field, equivalent to an average emission factor of 1.1%, and a small net sink activity of 610.465kg65N 2 O-N65ha 611 for the unfertilized system. The data suggest the existence of a consumption mechanism for N 2 O in dry, areated soil conditions, which cannot be explained by conventional anaerobic denitrification. The effect of fertilization on greenhouse gas budgets of grassland at the ecosystem level is discussed. |
| [34] | ������ѡ��̬��/����ɫ��(GC),�״ζ��ҹ����ɹŲ�ԭ���� ����������������N2O��CO2��CH4����ͨ��Ӱ���ʵ��۲�������,ũ������N2Oƽ���ŷ�ͨ����ԭʼ��ԭ�߳�3��,���ı��˲ݵ��ԭΪCO2 �������,ʹ�伾���ŷž�ͨ����C������14.3 mg@(m2@h).�����ǿ�ȵ�����CO2�ŷ�ͨ������������,�����������ԭ��CH4���յĴ������,�����ŷ���ѹ��������,����ֵѸ�ٻ���.ũ���� ����ݵ��ԭ��ȵ�-����CH4�����������仯,����ǿ�ȶ�N2O�ŷ�Ӱ������������.����ʪ�Ⱥ��¶���Ӱ���ԭ�ŷ�N2O��CO2������CH4���ڱ仯 ��ʽ�Ĺؼ�����,��������Ӱ���ŷ�ǿ��.�ŷź���������ʼ����ܴ�,����Ҫ�ܽ�ˮ��Ӱ��.N2O��CO2�ŷ���CH4���շ�ֵ�෴�����ձ����. . ������ѡ��̬��/����ɫ��(GC),�״ζ��ҹ����ɹŲ�ԭ���� ����������������N2O��CO2��CH4����ͨ��Ӱ���ʵ��۲�������,ũ������N2Oƽ���ŷ�ͨ����ԭʼ��ԭ�߳�3��,���ı��˲ݵ��ԭΪCO2 �������,ʹ�伾���ŷž�ͨ����C������14.3 mg@(m2@h).�����ǿ�ȵ�����CO2�ŷ�ͨ������������,�����������ԭ��CH4���յĴ������,�����ŷ���ѹ��������,����ֵѸ�ٻ���.ũ���� ����ݵ��ԭ��ȵ�-����CH4�����������仯,����ǿ�ȶ�N2O�ŷ�Ӱ������������.����ʪ�Ⱥ��¶���Ӱ���ԭ�ŷ�N2O��CO2������CH4���ڱ仯 ��ʽ�Ĺؼ�����,��������Ӱ���ŷ�ǿ��.�ŷź���������ʼ����ܴ�,����Ҫ�ܽ�ˮ��Ӱ��.N2O��CO2�ŷ���CH4���շ�ֵ�෴�����ձ����. |
| [35] | ��������/���DZ仯��ѧ������Ϊ��ע�Ļ����仯����֮һ�����ܹ�Ӱ��½����̬ϵͳ�� <BR>��������ԡ�ˮ��̼������ѭ��������ƽ�⣬�������������ͷ����ӵ������������⡣ <BR>��ͬ���͵���������/���DZ仯����̬ϵͳ̼ѭ�������ò�ͬ���ɸ���������ɭ��ת��Ϊ <BR>���������IJݵء�ũ�����к�����CO2���ͷŵ������С�ȫ����������/���DZ仯 <BR>���к�ǿ�Ŀռ�����ԣ�����̬ϵͳ̼ѭ����Ӱ��ͬ���������ԵĿռ���죺�ȴ����� <BR>���������� /���DZ仯��ɴ�����̼�ͷţ����и�γ�ȵ�����������/���DZ仯�����Ϊ <BR>̼�㡣Ŀǰ����������/���DZ仯�������̬ϵͳ̼ѭ���仯��Ҫ��ͨ��ģ��ģ�������� <BR>�ġ�������������/ ���DZ仯������ع�������̬ϵͳ̼ѭ���Ĺ�ϵ�Ѿ��Ƚ�������� <BR>�ǣ�������������/���DZ仯���̸�����Ӱ��㷺�����������������֮��Ĺ�ϵ������ <BR>�ܶȷ���ԡ�Ŀǰ������������Ҫ�����þ���������ʵ�ֵģ������Բ�ǿ��ʹ�ö��� <BR>������/���DZ仯��ɵ�½����̬ϵͳCO2�ͷ����Ĺ������ܴ��˽�һ����ǿ���� <BR>��λ�о��Ի����������/���DZ仯����̬ϵͳ̼ѭ�����̵Ķ�����ϵ�⣬��������/�� <BR>�DZ仯ģ����ֲ����̬ģ�͡���̬ϵͳ����ģ�͵����Ҳ�ǽ��ģ�ͷ�չ����Ҫ����֮ <BR>һ�����ú����Ĺ�����ʩ�ܹ�����������������/���DZ仯�����е�̼������������̼�� <BR>�����������ģ������Ϲ�����ʩ���о���������/���DZ仯���̶���̬ϵͳ̼ѭ����Ӱ <BR>����δ������Ĺ����ص㡣 . ��������/���DZ仯��ѧ������Ϊ��ע�Ļ����仯����֮һ�����ܹ�Ӱ��½����̬ϵͳ�� <BR>��������ԡ�ˮ��̼������ѭ��������ƽ�⣬�������������ͷ����ӵ������������⡣ <BR>��ͬ���͵���������/���DZ仯����̬ϵͳ̼ѭ�������ò�ͬ���ɸ���������ɭ��ת��Ϊ <BR>���������IJݵء�ũ�����к�����CO2���ͷŵ������С�ȫ����������/���DZ仯 <BR>���к�ǿ�Ŀռ�����ԣ�����̬ϵͳ̼ѭ����Ӱ��ͬ���������ԵĿռ���죺�ȴ����� <BR>���������� /���DZ仯��ɴ�����̼�ͷţ����и�γ�ȵ�����������/���DZ仯�����Ϊ <BR>̼�㡣Ŀǰ����������/���DZ仯�������̬ϵͳ̼ѭ���仯��Ҫ��ͨ��ģ��ģ�������� <BR>�ġ�������������/ ���DZ仯������ع�������̬ϵͳ̼ѭ���Ĺ�ϵ�Ѿ��Ƚ�������� <BR>�ǣ�������������/���DZ仯���̸�����Ӱ��㷺�����������������֮��Ĺ�ϵ������ <BR>�ܶȷ���ԡ�Ŀǰ������������Ҫ�����þ���������ʵ�ֵģ������Բ�ǿ��ʹ�ö��� <BR>������/���DZ仯��ɵ�½����̬ϵͳCO2�ͷ����Ĺ������ܴ��˽�һ����ǿ���� <BR>��λ�о��Ի����������/���DZ仯����̬ϵͳ̼ѭ�����̵Ķ�����ϵ�⣬��������/�� <BR>�DZ仯ģ����ֲ����̬ģ�͡���̬ϵͳ����ģ�͵����Ҳ�ǽ��ģ�ͷ�չ����Ҫ����֮ <BR>һ�����ú����Ĺ�����ʩ�ܹ�����������������/���DZ仯�����е�̼������������̼�� <BR>�����������ģ������Ϲ�����ʩ���о���������/���DZ仯���̶���̬ϵͳ̼ѭ����Ӱ <BR>����δ������Ĺ����ص㡣 |
| [36] | <a name="Abs1"></a>Land-use change is likely to be a major component of global change at high latitudes, potentially causing significant alterations in soil C and N cycling. We addressed the biogeochemical impacts of land-use change in fully replicated black spruce forests and agricultural fields of different ages (following deforestation) and under different management regimes in interior Alaska. Change from forests to cultivated fields increased summer temperatures in surface soil layers by 4–5 °C, and lengthened the season of biological activity by two to three weeks. Decomposition of a common substrate (oat stubble) was enhanced by 25% in fields compared to forests after litter bags were buried for one year. In-situ net N mineralization rates in site-specific soil were similar in forests and fields during summer, but during winter, forests were the only sites where net N immobilization occurred. Field age and management had a significant impact on C and N mineralization. Rates of annual decomposition, soil respiration and summer net N mineralization tended to be lower in young than in old fields and higher in fallow than in planted young fields. To identify the major environmental factors controlling C and N mineralization, soil temperature, moisture and N availability were studied. Decomposition and net N mineralization seemed to be mainly driven by availability of inorganic N. Soil temperature played a role only when comparing forests and fields, but not in field-to-field differences. Results from soil respiration measurements in fields confirmed low sensitivity of heterotrophic respiration, and thus decomposition to temperature. In addition, both soil respiration and net N mineralization were limited by low soil water contents. Our study showed that (1) C and N mineralization are enhanced by forest clearing in subarctic soils, and (2) N availability is more important than soil temperature in controling C and N mineralization following forest clearing. Projecting the biogeochemical impacts of land-use change at high latitudes requires an improved understanding of its interactions with other factors of global change, such as changing climate and N deposition. |
| [37] | We examined constraints on soil respiration in natural oak woodlands, and adjacent vineyards that were converted approximately 30 yr ago from oak woodlands, in the Oakville Region of Valley, California. All sites were located on the same soil type, a Bale (variant) gravelly loam (fine-loamy, mixed, superactive, thermic Cumulic Ultic Haploxeroll) and dominated by C3 vegetation. Seasonal soil efflux was greatest at the oak woodland sites, although during the summer drought the rates of soil efflux measured from oak sites were generally similar to those measured from the vineyards. Soil profile concentrations at the oak woodland sites were lower below 15 cm despite higher efflux rates. Soil gas diffusion coefficients for oak sites were larger than for vineyard sites, and this indicated that the apparent discrepancy in soil profile carbon dioxide concentration () may be caused by a diffusion limitation. Soil profile and delta13C values showed substantial temporal changes over the course of a year. Vineyard soil was more depleted in 13CO2 below 25 cm in the soil profile during the active growing season as indicated by more negative delta13C ratios. This result indicated that different C sources were being oxidized in vineyard soils. Annual C losses were less from vineyard soils (7.02 +/- 0.58 Mg C ha(-1) yr(-1)) as compared to oak soils (15.67 +/- 1.44 Mg C ha(-1) yr(-1)), and both were comparable to losses reported in previous investigations. |
| [38] | <div >�����Ǵ�������Ҫ�������壨��CO<sub>2</sub>��CH<sub>4</sub>��N<sub>2</sub>O����Ҫ��Դ��㣬�������÷�ʽ�ĸı佫�ᵼ����������������������������̷����ı䣬�Ӷ�����Ӱ����������������IJ������ŷš���ȫ��仯���������ô���ȸı�ı����£�����������չ�˹����������ñ仯��������������ͨ�����о��������ڼ�Ҫ�����������ñ仯��������������ͨ���о��Ļ����ϣ��ص�������ũ��ݵغ�ɭ�ֻ�����ʪ����ũ��ת�䡢��ͬ�����������ͣ�ɭ�֡��ݵء�ʪ�غ�ũ��ڲ��仯��3���������������ŷŵ�Ӱ�죬����3������������������Ĺؼ����̼�������ҪӰ�����������Ŀǰ�о��д��ڵIJ��㣬����˽����Ҫ��ǿ���������ڸ��õؽ�ʾ�������ñ仯��������������ͨ����Ӱ�켰���û�����Ϊ������뿪չ����о��ṩ�ο���</div><div ></br> </div> . <div >�����Ǵ�������Ҫ�������壨��CO<sub>2</sub>��CH<sub>4</sub>��N<sub>2</sub>O����Ҫ��Դ��㣬�������÷�ʽ�ĸı佫�ᵼ����������������������������̷����ı䣬�Ӷ�����Ӱ����������������IJ������ŷš���ȫ��仯���������ô���ȸı�ı����£�����������չ�˹����������ñ仯��������������ͨ�����о��������ڼ�Ҫ�����������ñ仯��������������ͨ���о��Ļ����ϣ��ص�������ũ��ݵغ�ɭ�ֻ�����ʪ����ũ��ת�䡢��ͬ�����������ͣ�ɭ�֡��ݵء�ʪ�غ�ũ��ڲ��仯��3���������������ŷŵ�Ӱ�죬����3������������������Ĺؼ����̼�������ҪӰ�����������Ŀǰ�о��д��ڵIJ��㣬����˽����Ҫ��ǿ���������ڸ��õؽ�ʾ�������ñ仯��������������ͨ����Ӱ�켰���û�����Ϊ������뿪չ����о��ṩ�ο���</div><div ></br> </div> |
| [39] | This review explores the role of land use and land use change as a determinant of the soil's ability to sequester and store carbon in the UK. Over 95 percent of the UK land carbon stock is located in soils which are subjected to a range of land uses and global changes. Land use change can result in rapid soil loss of carbon from peatlands, grasslands, plantation forest and native woodland. Soil... |
| [40] | |
| [41] | ���ڡ�Bookkeeping��ģ�ͣ���1975-2005 ���ڼ��½����ر仯������̼ƽ���Ӱ������˷�������Į���ؿ��Ѻ���ת�����½����ر仯��������Ҫ��ʽ��1975-2005 �������ָ��ر仯��ʽʹ�½�̼����������20.6 Tg C���������ؿ���ʹ����̼����������51.8 Tg C��������ת����������ŷ���31.2 Tg C����1975-1985 ���ڼ䣬�½����ش��ģת�ƣ�����̼�����ı仯�����ܸ���ת�Ƶ�Ӱ��ϴ�1985 ������½����ؿ��ѹ�ģ�����ӣ�̼�����仯������Ҫ�����ؿ���Ӱ�졣30 ��䣬�½�̼����������Ҫ���ɲݵؿ���Ϊ�������𣬶�����ת��Ϊ�ݵ����½�̼�������ٵ���Ҫԭ���½��������к�����ˮ�����������������̼�̶����ҳ��ڵĸ�����������һ����ǿ���ص�̼�㹦�ܡ� . ���ڡ�Bookkeeping��ģ�ͣ���1975-2005 ���ڼ��½����ر仯������̼ƽ���Ӱ������˷�������Į���ؿ��Ѻ���ת�����½����ر仯��������Ҫ��ʽ��1975-2005 �������ָ��ر仯��ʽʹ�½�̼����������20.6 Tg C���������ؿ���ʹ����̼����������51.8 Tg C��������ת����������ŷ���31.2 Tg C����1975-1985 ���ڼ䣬�½����ش��ģת�ƣ�����̼�����ı仯�����ܸ���ת�Ƶ�Ӱ��ϴ�1985 ������½����ؿ��ѹ�ģ�����ӣ�̼�����仯������Ҫ�����ؿ���Ӱ�졣30 ��䣬�½�̼����������Ҫ���ɲݵؿ���Ϊ�������𣬶�����ת��Ϊ�ݵ����½�̼�������ٵ���Ҫԭ���½��������к�����ˮ�����������������̼�̶����ҳ��ڵĸ�����������һ����ǿ���ص�̼�㹦�ܡ� |
| [42] | The net flux of carbon from land use and land-cover change (LULCC) is significant in the global carbon budget but uncertain, not only because of uncertainties in rates of deforestation and forestation, but also because of uncertainties in the carbon density of the lands actually undergoing change. Furthermore, there are differences in approaches used to determine the flux that introduce variability into estimates in ways that are difficult to evaluate, and there are forms of management not considered in many of the analyses. Thirteen recent estimates of net carbon emissions from LULCC are summarized here. All analyses consider changes in the area of agricultural lands (croplands and pastures). Some consider, also, forest management (wood harvest, shifting cultivation). None of them includes the emissions from the degradation of tropical peatlands. The net flux of carbon from LULCC is not the same as "emissions from deforestation", although the terms are used interchangeably in the literature. Means and standard deviations for annual emissions are 1.14��0.23 and 1.13��0.23 PgCyr-1 (1 Pg=1015 g carbon) for the 1980s and 1990s, respectively. Four studies also consider the period 2000-2009, and the mean and standard deviations for these four are 1.14��0.39, 1.17��0.32, and 1.10��0.11 PgCyr-1 for the three decades. For the period 1990-2009 the mean global emissions from LULCC are 1.14��0.18 PgCyr-1. The errors are smaller than previously estimated, as they do not represent the range of error around each result, but rather the standard deviation across the mean of the 13 estimates. Errors that result from data uncertainty and an incomplete understanding of all the processes affecting the net flux of carbon from LULCC have not been systematically evaluated but are likely to be on the order of ��0.5 PgCyr-1. |
| [43] | |
| [44] | Using a process-based Dynamic Land Ecosystem Model, we assessed carbon dynamics of urbanized/developed lands in the Southern United States during 1945�C2007. The results indicated that approximately 1.72 (1.69�C1.77) Pg (1P=10 15 ) carbon was stored in urban/developed lands, comparable to the storage of shrubland or cropland in the region. Urbanization resulted in a release of 0.21Pg carbon to the atmosphere during 1945�C2007. Pre-urbanization vegetation type and time since land conversion were two primary factors determining the extent of urbanization impacts on carbon dynamics. After a rapid decline of carbon storage during land conversion, an urban ecosystem gradually accumulates carbon and may compensate for the initial carbon loss in 70�C100years. The carbon sequestration rate of urban ecosystem diminishes with time, nearly disappearing in two centuries after land conversion. This study implied that it is important to take urbanization effect into account for assessing regional carbon balance. |
| [45] | |
| [46] | ��ʷʱ�ڵ��������������ظ����仯��Ӱ��½����̬ϵͳ̼ѭ������Ҫ���ء���ȥ300��䣬�� �����������븲�������˽ϴ�仯���ֵ����Ѹ�ټ�С����ֳ�������ԣ�����½����̬ϵͳ��̼ѭ����������Ҫ��Ӱ�졣����ͨ����һ����ʷ���������ؽ�����ʷ�� �����ݣ������˹�ȥ300���ҹ��������ñ仯����Ҫ�������о����������о�ʱ�Σ���������������ӣ�����ǰ��1661���60.78��10^6hm^2�� �ӵ�20����ĩ��96.09��10^6hm^2��ɭ�������1700���248.13��10^6hm^2����1949��� 109.01��10^6hm^2�������������븲���仯Ӱ�죬ȫ��½����̬ϵͳ��̼����Ҳ��֮�仯�����У�����ֲ���ƻ���I���̼�ŷŴ�ԼΪ3.70Pg C�������л�̼�ŷŽ���0.80-5.84Pg C֮�䣬���ʹ���Ϊ2.48Pg C��ֲ���������仯������̼�ŷ��ܼƴ�4.50-9.54Pg C�����ʹ���Ϊ6.18Pg C����ԶС�ڹ���****�������õ�17.1-33.4Pg C���ŷ�����̼�ŷŵĿռ�������ԣ����ڶ������������ϵ�����ֲ���ƻ���Խϴ�ȥ300������������������������븲���仯Ӱ���̼�ŷ�Ҳ�ϴ����� �ŷ����Ӵ�С����Ϊ���ɹŵ��������������������½�����ظ�ԭ��������Ϊ��ʷ�ϴ�ͳũ���Ļ��������ͻ������������������븲���仯��½����̬ϵͳ̼���� Ӱ����Խ�С�����ǽ����й��о���ʾ��Ŀǰȫ����Ȼֲ�����ǿ���������û���ر���ũ�ֻ����½����̬ϵͳ̼���������Ƚ����ԵĻ������á� . ��ʷʱ�ڵ��������������ظ����仯��Ӱ��½����̬ϵͳ̼ѭ������Ҫ���ء���ȥ300��䣬�� �����������븲�������˽ϴ�仯���ֵ����Ѹ�ټ�С����ֳ�������ԣ�����½����̬ϵͳ��̼ѭ����������Ҫ��Ӱ�졣����ͨ����һ����ʷ���������ؽ�����ʷ�� �����ݣ������˹�ȥ300���ҹ��������ñ仯����Ҫ�������о����������о�ʱ�Σ���������������ӣ�����ǰ��1661���60.78��10^6hm^2�� �ӵ�20����ĩ��96.09��10^6hm^2��ɭ�������1700���248.13��10^6hm^2����1949��� 109.01��10^6hm^2�������������븲���仯Ӱ�죬ȫ��½����̬ϵͳ��̼����Ҳ��֮�仯�����У�����ֲ���ƻ���I���̼�ŷŴ�ԼΪ3.70Pg C�������л�̼�ŷŽ���0.80-5.84Pg C֮�䣬���ʹ���Ϊ2.48Pg C��ֲ���������仯������̼�ŷ��ܼƴ�4.50-9.54Pg C�����ʹ���Ϊ6.18Pg C����ԶС�ڹ���****�������õ�17.1-33.4Pg C���ŷ�����̼�ŷŵĿռ�������ԣ����ڶ������������ϵ�����ֲ���ƻ���Խϴ�ȥ300������������������������븲���仯Ӱ���̼�ŷ�Ҳ�ϴ����� �ŷ����Ӵ�С����Ϊ���ɹŵ��������������������½�����ظ�ԭ��������Ϊ��ʷ�ϴ�ͳũ���Ļ��������ͻ������������������븲���仯��½����̬ϵͳ̼���� Ӱ����Խ�С�����ǽ����й��о���ʾ��Ŀǰȫ����Ȼֲ�����ǿ���������û���ر���ũ�ֻ����½����̬ϵͳ̼���������Ƚ����ԵĻ������á� |
| [47] | The location and mechanisms responsible for the carbon sink in northern mid-latitude are uncertain. Here, we used an improved estimation method of forest biomass and a 50-year national forest resource inventory in China to estimate changes in the storage of living biomass between 1949 and 1998. Our results suggest that Chinese forests released about 0.68 petagram of carbon between 1949 and 1980, for an annual emission rate of 0.022 petagram of carbon. Carbon storage increased significantly after the late 1970s from 4.38 to 4.75 petagram of carbon by 1998, for a mean accumulation rate of 0.021 petagram of carbon per year, mainly due to forest expansion and regrowth. Since the mid-1970s, planted forests (afforestation and reforestation) have sequestered 0.45 petagram of carbon, and their average carbon density increased from 15.3 to 31.1 megagrams per hectare, while natural forests have lost an additional 0.14 petagram of carbon, suggesting that carbon sequestration through forest management practices addressed in the Kyoto Protocol could help offset industrial carbon dioxide emissions. |
| [48] | <p>����2003~2007�꽭��ʡ��Դ���Ѻ��������õ�����,ͨ��������Դ���ѵ�̼�ŷ�ģ��,�Խ���ʡ5������Դ����̼�ŷŽ����˺���,��ͨ�������������ͺ�̼�ŷ���Ŀ�Ķ�Ӧ,�Բ�ͬ�������÷�ʽ��̼�ŷż�̼�㼣�����˶�����������������:(1)����ʡ��Դ����̼�ŷ�������2003���8794.24��t������2007���16329.85��t,�Ƿ���86%������,�ն���Դ����̼�ŷ�ռ53.6%��(2)����ȫʡ���ص�λ���̼�ŷŴ�2003��8.24t/hm<sup>2</sup>������2007��15.53 t/hm<sup>2</sup>,����Ϊ88.5%������,����㼰�����õص�λ���̼�ŷ����,Ϊ95.62 t/hm<sup>2</sup>��(3)����ȫʡ��Դ����̼�㼣�������������ص�ʵ�����,�ɴ���ɵ���̬���ִ�1351.285��hm<sup>2</sup>��(4)��ͬ�����������͵�̼�㼣��С˳��Ϊ:����㼰�����õأ���ͨ�õأ�δ���õؼ������õأ�ũ�õغ�ˮ���õ�,���о���㼰�����õص�̼�㼣�ߴ�10.89 hm<sup>2</sup>/ hm<sup>2</sup>��(5)����ȫʡ��λ���̼�㼣Ҳ�����Ե���������,��2003���0.938 hm<sup>2</sup>/ hm<sup>2</sup>������2007���1.769 hm<sup>2</sup>/ hm<sup>2</sup>��</p> . <p>����2003~2007�꽭��ʡ��Դ���Ѻ��������õ�����,ͨ��������Դ���ѵ�̼�ŷ�ģ��,�Խ���ʡ5������Դ����̼�ŷŽ����˺���,��ͨ�������������ͺ�̼�ŷ���Ŀ�Ķ�Ӧ,�Բ�ͬ�������÷�ʽ��̼�ŷż�̼�㼣�����˶�����������������:(1)����ʡ��Դ����̼�ŷ�������2003���8794.24��t������2007���16329.85��t,�Ƿ���86%������,�ն���Դ����̼�ŷ�ռ53.6%��(2)����ȫʡ���ص�λ���̼�ŷŴ�2003��8.24t/hm<sup>2</sup>������2007��15.53 t/hm<sup>2</sup>,����Ϊ88.5%������,����㼰�����õص�λ���̼�ŷ����,Ϊ95.62 t/hm<sup>2</sup>��(3)����ȫʡ��Դ����̼�㼣�������������ص�ʵ�����,�ɴ���ɵ���̬���ִ�1351.285��hm<sup>2</sup>��(4)��ͬ�����������͵�̼�㼣��С˳��Ϊ:����㼰�����õأ���ͨ�õأ�δ���õؼ������õأ�ũ�õغ�ˮ���õ�,���о���㼰�����õص�̼�㼣�ߴ�10.89 hm<sup>2</sup>/ hm<sup>2</sup>��(5)����ȫʡ��λ���̼�㼣Ҳ�����Ե���������,��2003���0.938 hm<sup>2</sup>/ hm<sup>2</sup>������2007���1.769 hm<sup>2</sup>/ hm<sup>2</sup>��</p> |
| [49] | �����Ŀ������̽�ֽ�20����, �ھ�����ᷢչ�������졢�������ñ仯��ֿ���ת�����������, ��ʾ�й��������ñ仯��Ϊ��ֱ�Ӻͼ��̼�ŷ�ЧӦ, ������й��������÷�����ϵ��ֲ����������, �ƶ��������õĹ���̼�ŷ��嵥�� �����Ŀ������̽�ֽ�20����, �ھ�����ᷢչ�������졢�������ñ仯��ֿ���ת�����������, ��ʾ�й��������ñ仯��Ϊ��ֱ�Ӻͼ��̼�ŷ�ЧӦ, ������й��������÷�����ϵ��ֲ����������, �ƶ��������õĹ���̼�ŷ��嵥�� |
| [50] | Recent research has shown the Phoenix, AZ metropolitan region to be characterized by a CO 2 dome that peaks near the urban center. The CO 2 levels, 50% greater than the surrounding non-urban areas, have been attributed to anthropogenic sources and the physical geography of the area. We quantified sources of CO 2 emissions across the metropolitan region. Anthropogenic CO 2 emission data were obtained from a variety of government and NGO sources. Soil CO 2 efflux from the dominant land-use types was measured over the year. Humans and automobile activity produced more than 80% input of CO 2 into the urban environment. Soil CO 2 efflux from the natural desert ecosystems showed minimal emissions during hot and dry periods, but responded rapidly to moisture. Conversely, human maintained vegetation types (e.g. golf courses, lawns, irrigated agriculture) have greater efflux and are both temperature and soil moisture dependent. Landfills exhibited the most consistent rates, but were temperature and moisture independent. We estimate the annual CO 2 released from the predominant land-use types in the Phoenix region and present a graphical portrayal of soil CO 2 emissions and the total natural and anthropogenic CO 2 emissions in the metropolitan region using a GIS-based approach. The results presented here do not mimic the spatial pattern shown in previous studies. Only, with sophisticated mixing models will we be able to address the total effect of urbanization on CO 2 levels and the contribution to regional patterns. |
| [51] | <h2 class="secHeading" id="section_abstract">Abstract</h2><p id="">The paper presents 5 methodological aspects for the historic land use change accountability to compare 2 databases: the Historical Database on the Global Environment of RIVM, National Institute of Public Health and the Environment, adapted by the IVIG, International Virtual Institute of Global Change of the Federal University of Rio de Janeiro, named HYDE/IVIG and the Brazilian National Institute of Spatial Research database, named INPE database. The 5 aspects here considered are geographic limits; scale; basic methodology; deforestation concept; vegetal classification. It also presents their importance for the results of the calculus of deforested areas in the Brazilian Legal Amazon case. The use of the 2 databases information for carbon emissions calculation showed to be useful in terms of magnitude but not for qualitative analysis. The calculus of deforested areas is approximately similar for the period analyzed. According to HYDE/IVIG, the Brazilian Legal Amazon land use changes representing agriculture and pasture lands, account 422,070 km<sup>2</sup>, between 1750 and 1990 and the natural areas modified were originally classified as 3 types: tropical forest, wooded tropical forest and savanna. According to INPE, the cumulative Brazilian Legal Amazon deforestation until 1990 accounts 415,000 km<sup>2</sup> and the natural areas modified were originally classified as 9 types. It means that different carbon contents by unit of deforestation have to be taken into account for the carbon emissions calculus. These numbers show the compatibility of the databases in terms of magnitude but the quality of the information present huge differences.</p> |
| [52] | Through the matching relationship between land use types and carbon emission items, this paper estimated carbon emissions of different land use types in Nanjing City, China and analyzed the influencing factors of carbon emissions by Logarithmic Mean Divisia Index(LMDI) model. The main conclusions are as follows: 1) Total anthropogenic carbon emission of Nanjing increased from 1.22928 x 10⁷ t in 2000 to 3.06939 x 10⁷ t in 2009, in which the carbon emission of Inhabitation, mining manufacturing land accounted for 93% of the total. 2) The average land use carbon emission intensity of Nanjing in 2009 was 46.63 t/ha, in which carbon emission intensity of Inhabitation, mining manufacturing land was the highest(200.52 t/ha), which was much higher than that of other land use types. 3) The average carbon source intensity in Nanjing was 16 times of the average carbon sink intensity(2.83 t/ha) in 2009, indicating that Nanjing was confronted with serious carbon deficit and huge carbon cycle pressure. 4) Land use area per unit GDP was an inhibitory factor for the increase of carbon emissions, while the other factors were all contributing factors. 5) Carbon emission effect evaluation should be introduced into land use activities to formulate low-carbon land use strategies in regional development. |
| [53] | <p>���������ǵ�̼���ú�̼�ŷ��о�����Ҫ�����, Ҳ�ǽ���̼�ŷŵ��ص���Ҫ����֮һ����չ��������̼�ŷ��о�, �����ڴ��������ù滮����ҵ�ṹ���ؼ��������������ε�����ȫ�������������ĵ�̼��չ��2007 ������, �Ͼ���ѧ�ڹ��ڵ���ѧ����翪չ����������̼�ŷ��о�, �о�������Ҫ����������:����ͬ�߶�̼�ŷź��㼰���������о����������ü���仯��̼�ŷ�ЧӦ���Ż������о��������������������, ������̼�ŷź��㡢���ط���������DZ���о����������ü���仯��̼�ŷ�ЧӦ�о��������������ü���ҵ�ռ��̼�㼣�����������̼Ŀ����������ýṹ�Ż��о�������ϵͳ̼ѭ���������ص����о��ȷ�����Ͼ���ѧ��������̼�ŷŵ���Ҫ�о�����������ܽ������;����Ͼ���ѧѧ�Ʒ�չ����, �������������̼�ŷ��о��ķ�չ����, ��Ҫ����:���Ͳ�ҵ��̼�ŷ��о������и���ͻ��������̼�ŷŵĹ�ϵ�о������й�����̼�ŷ��о�����̼�������ù滮�ı�����Ӧ�á�����̼�ŷŵ����ص��ػ����뷽����ϵ�о��ȡ�</p> . <p>���������ǵ�̼���ú�̼�ŷ��о�����Ҫ�����, Ҳ�ǽ���̼�ŷŵ��ص���Ҫ����֮һ����չ��������̼�ŷ��о�, �����ڴ��������ù滮����ҵ�ṹ���ؼ��������������ε�����ȫ�������������ĵ�̼��չ��2007 ������, �Ͼ���ѧ�ڹ��ڵ���ѧ����翪չ����������̼�ŷ��о�, �о�������Ҫ����������:����ͬ�߶�̼�ŷź��㼰���������о����������ü���仯��̼�ŷ�ЧӦ���Ż������о��������������������, ������̼�ŷź��㡢���ط���������DZ���о����������ü���仯��̼�ŷ�ЧӦ�о��������������ü���ҵ�ռ��̼�㼣�����������̼Ŀ����������ýṹ�Ż��о�������ϵͳ̼ѭ���������ص����о��ȷ�����Ͼ���ѧ��������̼�ŷŵ���Ҫ�о�����������ܽ������;����Ͼ���ѧѧ�Ʒ�չ����, �������������̼�ŷ��о��ķ�չ����, ��Ҫ����:���Ͳ�ҵ��̼�ŷ��о������и���ͻ��������̼�ŷŵĹ�ϵ�о������й�����̼�ŷ��о�����̼�������ù滮�ı�����Ӧ�á�����̼�ŷŵ����ص��ػ����뷽����ϵ�о��ȡ�</p> |
| [54] | �������û������̼ѭ������ҪӰ������,�����������÷�ʽ������ϸ�ֵĸı��Ӱ������̼ѭ���Ĺ�ģ��ǿ�ȡ���չ����ϵͳ̼ѭ�������ص����о�,�����ڴ���������ҵ���������ع滮�����ּ����з�չģʽ�ȷ���ٽ������̼��չ,������ɳ�����չ�ı�ȻҪ�����Ҫ;�������ķ������������ö�����ϵͳ̼ѭ����Ӱ�����,̽�����������û��������Ȼ����Ϊ̼ѭ�����̵�Ӱ��;���������÷�ʽ���ṹ����ģ��ǿ�ȵȷ��������������������̼ѭ�������ص��ػ���,������˴Ӽ۸滮��˰�պ��ؼƻ�����ѡ������ֶΡ�ȷ�����ض���,�Ӷ��ı�����ϵͳ����״��,��ʵ�ֶ�����̼ѭ�����е��ص�����˼·;���ӵ�̼�������ü������滮��ģʽ�����ߵ��ĸ��������������ϵͳ̼ѭ�������ص��ص����߿�ܺ�ʵʩ����:�ٵ�̼�������ü���:������̼�������ù滮���ۼ��������ؽ�Լ��Լ���ü���������ѭ�����ü���;�ڵ�̼�������ù滮:������̼�ͳ����������ù滮�������̵�ϵͳ�滮����̼��ͨ�õ�ϵͳ�滮����̼�������ýṹ���ֹ滮����̼���幦�����滮;�۵�̼��������ģʽ:����������̬����ģʽ�������Ѻ�����������ģʽ�������ͳ���ģʽ���̼��̬��ҵģʽ;�ܵ�̼������������:��������̼�����ƶȡ�������;�����ƶȡ���̼���ؽ����ƶȡ���������̼�����ƶȼ���̼���ص�����ϵ��ͨ����������ϵͳ̼ѭ�������ص���������ϵ,����Ϊ�����������û�ṩָ��,Ҳ����Ϊ�����̼�������õ����ṩ�ο��� . �������û������̼ѭ������ҪӰ������,�����������÷�ʽ������ϸ�ֵĸı��Ӱ������̼ѭ���Ĺ�ģ��ǿ�ȡ���չ����ϵͳ̼ѭ�������ص����о�,�����ڴ���������ҵ���������ع滮�����ּ����з�չģʽ�ȷ���ٽ������̼��չ,������ɳ�����չ�ı�ȻҪ�����Ҫ;�������ķ������������ö�����ϵͳ̼ѭ����Ӱ�����,̽�����������û��������Ȼ����Ϊ̼ѭ�����̵�Ӱ��;���������÷�ʽ���ṹ����ģ��ǿ�ȵȷ��������������������̼ѭ�������ص��ػ���,������˴Ӽ۸滮��˰�պ��ؼƻ�����ѡ������ֶΡ�ȷ�����ض���,�Ӷ��ı�����ϵͳ����״��,��ʵ�ֶ�����̼ѭ�����е��ص�����˼·;���ӵ�̼�������ü������滮��ģʽ�����ߵ��ĸ��������������ϵͳ̼ѭ�������ص��ص����߿�ܺ�ʵʩ����:�ٵ�̼�������ü���:������̼�������ù滮���ۼ��������ؽ�Լ��Լ���ü���������ѭ�����ü���;�ڵ�̼�������ù滮:������̼�ͳ����������ù滮�������̵�ϵͳ�滮����̼��ͨ�õ�ϵͳ�滮����̼�������ýṹ���ֹ滮����̼���幦�����滮;�۵�̼��������ģʽ:����������̬����ģʽ�������Ѻ�����������ģʽ�������ͳ���ģʽ���̼��̬��ҵģʽ;�ܵ�̼������������:��������̼�����ƶȡ�������;�����ƶȡ���̼���ؽ����ƶȡ���������̼�����ƶȼ���̼���ص�����ϵ��ͨ����������ϵͳ̼ѭ�������ص���������ϵ,����Ϊ�����������û�ṩָ��,Ҳ����Ϊ�����̼�������õ����ṩ�ο��� |
| [55] | Land use change is a main driver of carbon storage in terrestrial ecosystems. Based on land use data, research results related to carbon densities in vegetation and soil as well as government policies related to development in different regions of China, this paper optimized land use structure in 2020 for different regions with the goal of increasing terrestrial ecosystem carbon storage. We defined seven types of land use: (1) cultivated land, (2) garden land, (3) woodland, (4) pasture land, (5) other agricultural land, (6) urbanized land, and (7) a mixture of other land which we call mixed land which included open water, swamps, glaciers and other land as defined below. We found: (1) For most eastern regions, woodland has the highest carbon (C) densities while C densities of pasture land and cultivated land did not differ widely. Both have C densities higher than urbanized land while urbanized land has higher carbon densities than the areas placed in the mixed land type. (2) Under an optimized land use structure projected for 2020, the area of cultivated land will decrease compared with 2005 for most regions. The areas of garden land, pasture land and other agricultural land are much smaller compared with the mixed land use type, and the changes there are not obvious and their contributions to increased carbon storage are not significant. The area of woodland will increase the most obviously and it will contribute the most to increased carbon storage. The increasing urbanization of land and the decreasing trend of other land types make it difficult to change carbon storage patterns since the Chinese economy is expanding rapidly. (3) The optimized land use structure presented here will have effects on the entire country though with regional differences. Some inland regions will always have a larger potential to increase carbon storage than other areas because the potentialities in some coastal regions are limited by social and economic development. (C) 2012 Elsevier Ltd. All rights reserved. |
| [56] | |
| [57] | ̼�ŷ�Ч�ʿ����ֲ�̼�ŷ�������ָ���̼�ŷ���Ϊ�ɱ��������������ÿ��Dz�������㡣�о���������������Դ���IJ�����̼�ŷ�Ϊ����,����Ͷ�뵼���CCR��BCCģ�Ͳ�����������̼�ŷŵ���Ч�ʡ�����Ч�ʡ���ģЧ�����ģ���ꡣ�о��������:30��ʡ���н����ɹš��������������ຣ��������̼�ŷ���Ч����Ч;����Ч�����ģЧ�ʵ�Ч��ֵ����ֲ���������������������ϵ,��ģЧ����Ч�����ֲ�ԶС�ڼ�����Ч;��ģЧ����Чʡ�����ģ���겻��ʡ�ݴ��ڲ�һ��,������������̼�ŷŹ�ģЧ����Ҫ���ǵ�����ģ���������Ρ���˶�26��̼�ŷŷ�DEA��Чʡ�ݵ��������ô�Ͷ����������е�̼�Ż�,������Ͷ�����������������ʡ������Ե�̼�Ż����,��ư�������������ԴͶ������Լ�����������Դ���õIJ����Ż����������õ�̼�ŷŶԲ�,��ʵ��̼�ŷ�Ч����Ч�� . ̼�ŷ�Ч�ʿ����ֲ�̼�ŷ�������ָ���̼�ŷ���Ϊ�ɱ��������������ÿ��Dz�������㡣�о���������������Դ���IJ�����̼�ŷ�Ϊ����,����Ͷ�뵼���CCR��BCCģ�Ͳ�����������̼�ŷŵ���Ч�ʡ�����Ч�ʡ���ģЧ�����ģ���ꡣ�о��������:30��ʡ���н����ɹš��������������ຣ��������̼�ŷ���Ч����Ч;����Ч�����ģЧ�ʵ�Ч��ֵ����ֲ���������������������ϵ,��ģЧ����Ч�����ֲ�ԶС�ڼ�����Ч;��ģЧ����Чʡ�����ģ���겻��ʡ�ݴ��ڲ�һ��,������������̼�ŷŹ�ģЧ����Ҫ���ǵ�����ģ���������Ρ���˶�26��̼�ŷŷ�DEA��Чʡ�ݵ��������ô�Ͷ����������е�̼�Ż�,������Ͷ�����������������ʡ������Ե�̼�Ż����,��ư�������������ԴͶ������Լ�����������Դ���õIJ����Ż����������õ�̼�ŷŶԲ�,��ʵ��̼�ŷ�Ч����Ч�� |
| [58] | ������������������̼�ŷŵ���Ҫ���أ��������ýṹ�Ż�����һ���̶ȸı��������õ�̼Դ/���֣��������������ĵ�̼��չ���������Թ滮���������Ľ�����������������̼ЧӦ�ۺ��������Ż����صķ����������Ͼ���Ϊ���������3���������õ�̼�Ż�������������̼����DZ�������˶Աȷ��������ؿ���ģ�⣬�������˵�̼���������Ż������߽��顣������֣�2020���Ͼ���������������滮����ʹ�������̼�����������������Ԥ��̼�ŷ�ԶԶ����̼���������ֵ��ͬʱҲ���ᵼ����̬ϵͳ̼�������Ľ��ͣ���3���Ż������У�����̼�ŷ���С�����������ýṹ�Ż�������2020��滮������̼�ŷż�����73.75��t��̼����DZ��Ϊ8.50%�������÷������˽Ϻõ�Ԥ�ڼ���Ч������ˣ����Ľ��齫����̼�ŷ���С�����������ýṹ�Ż�������Ϊ�Ͼ���δ�����ؽṹ�����Ͳ�ҵ�滮�IJο����÷�������������ʵ��̼���ŵ�Ŀ�꣬���Ҷ��ڿ��ƽ����õصĹ��������������������������������ũ�������;�����õ��������������ù滮�Ϳ������������Ҫ����ʵ���塣 . ������������������̼�ŷŵ���Ҫ���أ��������ýṹ�Ż�����һ���̶ȸı��������õ�̼Դ/���֣��������������ĵ�̼��չ���������Թ滮���������Ľ�����������������̼ЧӦ�ۺ��������Ż����صķ����������Ͼ���Ϊ���������3���������õ�̼�Ż�������������̼����DZ�������˶Աȷ��������ؿ���ģ�⣬�������˵�̼���������Ż������߽��顣������֣�2020���Ͼ���������������滮����ʹ�������̼�����������������Ԥ��̼�ŷ�ԶԶ����̼���������ֵ��ͬʱҲ���ᵼ����̬ϵͳ̼�������Ľ��ͣ���3���Ż������У�����̼�ŷ���С�����������ýṹ�Ż�������2020��滮������̼�ŷż�����73.75��t��̼����DZ��Ϊ8.50%�������÷������˽Ϻõ�Ԥ�ڼ���Ч������ˣ����Ľ��齫����̼�ŷ���С�����������ýṹ�Ż�������Ϊ�Ͼ���δ�����ؽṹ�����Ͳ�ҵ�滮�IJο����÷�������������ʵ��̼���ŵ�Ŀ�꣬���Ҷ��ڿ��ƽ����õصĹ��������������������������������ũ�������;�����õ��������������ù滮�Ϳ������������Ҫ����ʵ���塣 |
| [59] | <p>�Ծ��ÿ��ٷ�չ������������������̬����ϵͳΪ�о���������ϵͳ��ѧ��ط�����������������������õľ��á���̬����Ṧ�ܱ仯���ƣ��ڷ�������δ����ᾭ�ÿ�ѧ��չ��̼�ŷ�Ŀ�����������ýṹ�仯��ϵ�Ļ����ϣ��о����������ýṹ���ص�CO��2����ָ��������Ч��ָ������Ŀ�꺯����ͨ������Markovģ�ͺͽṹ�Ż������������������������ýṹ�ĵ�̼�Ż���̬����ģ�ͣ�LUSCC��������ⷽ��������Խ���̩����Ϊ�������˷�����֤���ۺϿ��Ǹ�����ķ�չս�Ժ�����ʵʩ��������3�ֲ�̼ͬ�ŷ�Ŀ����س̶ȵ����������Ż��ṹ������ط������о������������Ļ���̼�ŷ�Լ���Ķ�̬�Ż�����ģ�ͣ��ܹ�����������Դ����Ч�ʵ������ɳ�������Ҫ��Ϊ̽������δ����̼���������ýṹ���Ż������ṩ�ο���</p> . <p>�Ծ��ÿ��ٷ�չ������������������̬����ϵͳΪ�о���������ϵͳ��ѧ��ط�����������������������õľ��á���̬����Ṧ�ܱ仯���ƣ��ڷ�������δ����ᾭ�ÿ�ѧ��չ��̼�ŷ�Ŀ�����������ýṹ�仯��ϵ�Ļ����ϣ��о����������ýṹ���ص�CO��2����ָ��������Ч��ָ������Ŀ�꺯����ͨ������Markovģ�ͺͽṹ�Ż������������������������ýṹ�ĵ�̼�Ż���̬����ģ�ͣ�LUSCC��������ⷽ��������Խ���̩����Ϊ�������˷�����֤���ۺϿ��Ǹ�����ķ�չս�Ժ�����ʵʩ��������3�ֲ�̼ͬ�ŷ�Ŀ����س̶ȵ����������Ż��ṹ������ط������о������������Ļ���̼�ŷ�Լ���Ķ�̬�Ż�����ģ�ͣ��ܹ�����������Դ����Ч�ʵ������ɳ�������Ҫ��Ϊ̽������δ����̼���������ýṹ���Ż������ṩ�ο���</p> |
| [60] | ��������/�����仯��½����̬ϵͳ̼ѭ����������Ӱ�졣����ʵ�زɼ��������������ݺ�1989�ꡢ2000�ꡢ2004��8�·ݵ�½������TMң��Ӱ�����ݣ�������̬ϵͳ���ͷ��Լ���ʡͨ���غ��ˮ��ֵء��ݵء�ˮ�����õء�ɳ�ء��μ�ء�ʪ�ص�11��½����̬ϵͳ�л�̼���������˹��㣬��������������/�����仯��̼������Ӱ�죻���������Թ滮�����Ż��������ýṹ����ʵ���������ýṹ�仯�µ�½����̬ϵͳ��̼ƽ�⡣������������Բݵ��˻�������ɳ�����μΪ��Ҫ�������������ñ仯�У�1989��~2000���о���½����̬ϵͳ���л�̼��������387.70��10<sup>4</sup>t��2000���Ժ���е��˸����֡��˸����ݵ���̬����ʹ�л�̼��������69.70��10<sup>4</sup>t��Ӧ�����Թ滮ģ�ͻ�õ��������÷������������о����Ը������ص�����Ԥ��2020���л�̼�����ɴﵽ4729.70��10<sup>4</sup>t�� . ��������/�����仯��½����̬ϵͳ̼ѭ����������Ӱ�졣����ʵ�زɼ��������������ݺ�1989�ꡢ2000�ꡢ2004��8�·ݵ�½������TMң��Ӱ�����ݣ�������̬ϵͳ���ͷ��Լ���ʡͨ���غ��ˮ��ֵء��ݵء�ˮ�����õء�ɳ�ء��μ�ء�ʪ�ص�11��½����̬ϵͳ�л�̼���������˹��㣬��������������/�����仯��̼������Ӱ�죻���������Թ滮�����Ż��������ýṹ����ʵ���������ýṹ�仯�µ�½����̬ϵͳ��̼ƽ�⡣������������Բݵ��˻�������ɳ�����μΪ��Ҫ�������������ñ仯�У�1989��~2000���о���½����̬ϵͳ���л�̼��������387.70��10<sup>4</sup>t��2000���Ժ���е��˸����֡��˸����ݵ���̬����ʹ�л�̼��������69.70��10<sup>4</sup>t��Ӧ�����Թ滮ģ�ͻ�õ��������÷������������о����Ը������ص�����Ԥ��2020���л�̼�����ɴﵽ4729.70��10<sup>4</sup>t�� |
| [61] | <P><FONT face=Verdana>���������ı�����Ŀ���������ýṹ����������̬ϵͳ̼ѭ��ƽ�⡣����������ʵʩ</FONT><FONT face=Verdana>�Ĺ������Լ�ʵʩ�Ժ�һ��ʱ�ڣ���Ŀ����̬ϵͳ̼�������Ȼ��ʧ���Ӷ�ʹ��Ŀ��ũҵ��</FONT><FONT face=Verdana>̬ϵͳ��̼������̼Դ���Ժ���ʡ�����ж�������Ժ������������Ŀ��Ϊ������ͨ������</FONT><FONT face=Verdana>̬ϵͳ̼������Ĺ��㣬���������Թ滮�ķ����������������滮��Ƶ�����������ýṹ</FONT><FONT face=Verdana>���Ӷ�ʵ�ֶ������������������̬ϵͳ̼����ʧ���в�����Ŀ�ꡣ���������Ϊ��ʵ����</FONT><FONT face=Verdana>�������ĸ���������Ŀ�꣬ͨ���������Թ滮�ķ������õ����������ýṹ�Ż�������</FONT><FONT face=Verdana>���ܺõ�����滮������漰�ĸ����õص�����Լ���̬ϵͳ��̼��ƽ���Լ������������</FONT><FONT face=Verdana>���������ռ�����������11.94%ʵ�������Ŀ�꣬ͬʱ�����˵�·ϵͳ��ˮ�����ϵͳ</FONT><FONT face=Verdana>�Լ��������õص������˹��ֵص������������3.90 hm<SUP>2</SUP>��Ҳ��ʵ����������ǰ��</FONT><FONT face=Verdana>��̬ϵͳ̼����ƽ�⡣</FONT></P> . <P><FONT face=Verdana>���������ı�����Ŀ���������ýṹ����������̬ϵͳ̼ѭ��ƽ�⡣����������ʵʩ</FONT><FONT face=Verdana>�Ĺ������Լ�ʵʩ�Ժ�һ��ʱ�ڣ���Ŀ����̬ϵͳ̼�������Ȼ��ʧ���Ӷ�ʹ��Ŀ��ũҵ��</FONT><FONT face=Verdana>̬ϵͳ��̼������̼Դ���Ժ���ʡ�����ж�������Ժ������������Ŀ��Ϊ������ͨ������</FONT><FONT face=Verdana>̬ϵͳ̼������Ĺ��㣬���������Թ滮�ķ����������������滮��Ƶ�����������ýṹ</FONT><FONT face=Verdana>���Ӷ�ʵ�ֶ������������������̬ϵͳ̼����ʧ���в�����Ŀ�ꡣ���������Ϊ��ʵ����</FONT><FONT face=Verdana>�������ĸ���������Ŀ�꣬ͨ���������Թ滮�ķ������õ����������ýṹ�Ż�������</FONT><FONT face=Verdana>���ܺõ�����滮������漰�ĸ����õص�����Լ���̬ϵͳ��̼��ƽ���Լ������������</FONT><FONT face=Verdana>���������ռ�����������11.94%ʵ�������Ŀ�꣬ͬʱ�����˵�·ϵͳ��ˮ�����ϵͳ</FONT><FONT face=Verdana>�Լ��������õص������˹��ֵص������������3.90 hm<SUP>2</SUP>��Ҳ��ʵ����������ǰ��</FONT><FONT face=Verdana>��̬ϵͳ̼����ƽ�⡣</FONT></P> |
| [62] | . BACKGROUND 1. At its 17th Session, the Subsidiary Body for Scientific and Technological Advice (SBSTA) of the United Nations Framework Convention on Climate Change (UNFCCC) invited the IPCC to revise the Revised 1996 IPCC Guidelines for National |
| [63] | 2.1. Urbanisation and Role of Cities in Sustainable Development ..................................................................102.2. Determinants of Energy Use in Cities ........................................................................................................112.3. Income-Energy-Environment Conundrum and Role of Innovative Policies in Cities ...........................132.4. Comprehensive Policy Framework for Energy-Environment Management in Asian Cities ................16 |
| [64] | Using energy consumption and land use data of each region of China in 2007, this paper established carbon emission and carbon footprint model based on energy consumption, and estimated the carbon emission amount of fossil energy and rural biomass energy of different regions of China in 2007. Through matching the energy consumption items with industrial spaces, this paper divided industrial spaces into five types: agricultural space, living & industrial-commercial space, transportation industrial space, fishery and water conservancy space, and other industrial space. Then the author analyzed the carbon emission intensity and carbon footprint of each industrial space. Finally, advices of decreasing industrial carbon footprint and optimizing industrial space pattern were put forward. The main conclusions are as following: (1) Total amount of carbon emission from energy consumption of China in 2007 was about 1.65 GtC, in which the proportion of carbon emission from fossil energy was 89%. (2) Carbon emission intensity of industrial space of China in 2007 was 1.98 t/hm<sup>2</sup>, in which, carbon emission intensity of living & industrial-commercial space and of transportation industrial space was 55.16 t/hm<sup>2</sup> and 49.65 t/hm<sup>2</sup> respectively, they were high-carbon-emission industrial spaces among others. (3) Carbon footprint caused by industrial activities of China in 2007 was 522.34��106 hm<sup>2</sup>, which brought about ecological deficit of 28.69��106 hm<sup>2</sup>, which means that the productive lands were not sufficient to compensate for carbon footprint of industrial activities, and the compensating rate was 94.5%. As to the regional carbon footprint, several regions have ecological profit while others have not. In general, the present ecological deficit caused by industrial activities was small in 2007. (4) Per unit area carbon footprint of industrial space in China was about 0.63 hm<sup>2</sup>/hm<sup>2</sup> in 2007, in which that of living & industrial-commercial space was the highest (17.5 hm<sup>2</sup>/hm<sup>2</sup>). The per unit area carbon footprint of different industrial spaces all presented a declining trend from east to west of China. |
| [65] | �������β�ҵ��ģ�IJ���׳������ҵ����������Ӱ������������ʻ����������� �Ĺ�ע������ҵ��Դ���ü�������̼�ŷ������ζԻ���Ӱ�����Ҫ������֮һ����Ϊ��5 ���� ���������о��������ȵ㡣���β�ҵ�ص����������ҵ��Դ���ĺͶ�����̼�ŷ����IJ����� �������Ե����⡣���IJ���“���¶���”����ͨ�������о�������ͳ�Ʒ������״�ϵͳ�����й� ����ҵ��Դ���ĺͶ�����̼�ŷ��������������2008 �꣬�й�����ҵ������Դ428.30 PJ��ռ�й� ��Դ����������0.51%���ŷŶ�����̼51.34 Mt��ռȫ��������̼���ŷ�����0.86%������ҵ�� �ͺ��ܡ����ŷš���̼��ҵ����Ӧ������仯�ͽ��ܼ��ŵ����Ʋ�ҵ��Ӧ�ó�Ϊ��̼���÷�չ�� ��Ҫ���� . �������β�ҵ��ģ�IJ���׳������ҵ����������Ӱ������������ʻ����������� �Ĺ�ע������ҵ��Դ���ü�������̼�ŷ������ζԻ���Ӱ�����Ҫ������֮һ����Ϊ��5 ���� ���������о��������ȵ㡣���β�ҵ�ص����������ҵ��Դ���ĺͶ�����̼�ŷ����IJ����� �������Ե����⡣���IJ���“���¶���”����ͨ�������о�������ͳ�Ʒ������״�ϵͳ�����й� ����ҵ��Դ���ĺͶ�����̼�ŷ��������������2008 �꣬�й�����ҵ������Դ428.30 PJ��ռ�й� ��Դ����������0.51%���ŷŶ�����̼51.34 Mt��ռȫ��������̼���ŷ�����0.86%������ҵ�� �ͺ��ܡ����ŷš���̼��ҵ����Ӧ������仯�ͽ��ܼ��ŵ����Ʋ�ҵ��Ӧ�ó�Ϊ��̼���÷�չ�� ��Ҫ���� |
| [66] | <p>Ϊ��ʾ�������������ͥ����̼�ŷ���״�����, ���ڼ�ͥ����̼�ŷ�������ݵĵ���, �ۺ����á�IPCC�������������嵥ָ��(2006)�������й����������嵥�о�����Ͷ��������������������������۷���, ���������������ͥ����̼�ŷ������������������. �о�����: ���������˾�����̼�ŷ�ֻ��2.05 tCO<sub>2</sub>/(�� ��); ����̼�ŷ���Ҫ��Դ��ú̿��������ʳƷ����, ��ʯȼ��������������ֱ��̼�ŷ�ռ39.29%, �����ȼ�ͥ���ѻ�������ļ��̼�ŷ�ռ60.71%; ����̼�ŷ���Ҫ�ܵ�����������ͥ��ģ���������롢����ṹ������Ӱ��, ��ͬʡ���ͳ����˿�֮����ŷ�������һ�����.</p> . <p>Ϊ��ʾ�������������ͥ����̼�ŷ���״�����, ���ڼ�ͥ����̼�ŷ�������ݵĵ���, �ۺ����á�IPCC�������������嵥ָ��(2006)�������й����������嵥�о�����Ͷ��������������������������۷���, ���������������ͥ����̼�ŷ������������������. �о�����: ���������˾�����̼�ŷ�ֻ��2.05 tCO<sub>2</sub>/(�� ��); ����̼�ŷ���Ҫ��Դ��ú̿��������ʳƷ����, ��ʯȼ��������������ֱ��̼�ŷ�ռ39.29%, �����ȼ�ͥ���ѻ�������ļ��̼�ŷ�ռ60.71%; ����̼�ŷ���Ҫ�ܵ�����������ͥ��ģ���������롢����ṹ������Ӱ��, ��ͬʡ���ͳ����˿�֮����ŷ�������һ�����.</p> |
| [67] | <h2 class="secHeading" id="section_abstract">Abstract</h2><p id="">Greenhouse gas emissions from international transport contribute to anthropogenic global warming, yet these emissions are not liable under the Kyoto Protocol. International attention is being given to quantifying such emissions. This paper presents the results of research into international cruise ship journeys to and from New Zealand. CO<sub>2</sub> emissions from such journeys were calculated using an activity based, or “bottom-up”, model. Emissions factors for individual journeys by cruise ships to or from New Zealand in 2007 ranged between 250 and 2200 g of CO<sub>2</sub> per passenger-kilometre (g CO<sub>2</sub> per p-km), with a weighted mean of 390 g CO<sub>2</sub> per p-km. The weighted mean energy use per passenger night for the “hotel” function of these cruise vessels was estimated as 1600 MJ per visitor night, 12 times larger than the value for a land-based hotel. Using a simple price elasticities calculation, international cruise journeys for transport purposes were found to have a greater relative decrease in demand than plane journeys when the impact of carbon pricing was analysed. The potential to decrease the CO<sub>2</sub> emissions per p-km was examined, and if passenger accommodation was compacted and some luxury amenities dispensed with values similar to those of economy-class air travel were obtained.</p> |
| [68] | ��������̼������Ϊ�ڶ�ѧ�ƹ�ע�Ľ�������,������****�Ӷ���Ƕȶ��俪չһϵ�е�������ʵ֤�о�,�����۲�������̽�ֳ��н�̼ͨ�ŷŵ�Ӱ��������о���Խ�Ϊȱ�������ñ����о�����־�����ȡ�ĵ�һ������,���ھ����ճ�������Ϊ�����۲���ij��н�̼ͨ�ŷ�,�����ýṹ����ģ�������ھ��ס�ռ䡢������Ϊ�Լ���̼ͨ�ŷ�����֮������ڹ�ϵ���������,���о��롢�������и��ʶԽ�̼ͨ�ŷŲ�����������ЧӦ,������Ƶ�ʵ�Ӱ�첢��������ͬʱ,���нṹ��Ӱ��ҪԶԶ���ڳ���������Ӱ�졣����,���пռ�ṹ�Գ��н�̼ͨ�ŷŲ�������Ӱ��,��λ��������ij�����Ϊ�������“��̼”����,Ӧ�ӵ�̼�ӽǶԵ�λ���������������ӡ� . ��������̼������Ϊ�ڶ�ѧ�ƹ�ע�Ľ�������,������****�Ӷ���Ƕȶ��俪չһϵ�е�������ʵ֤�о�,�����۲�������̽�ֳ��н�̼ͨ�ŷŵ�Ӱ��������о���Խ�Ϊȱ�������ñ����о�����־�����ȡ�ĵ�һ������,���ھ����ճ�������Ϊ�����۲���ij��н�̼ͨ�ŷ�,�����ýṹ����ģ�������ھ��ס�ռ䡢������Ϊ�Լ���̼ͨ�ŷ�����֮������ڹ�ϵ���������,���о��롢�������и��ʶԽ�̼ͨ�ŷŲ�����������ЧӦ,������Ƶ�ʵ�Ӱ�첢��������ͬʱ,���нṹ��Ӱ��ҪԶԶ���ڳ���������Ӱ�졣����,���пռ�ṹ�Գ��н�̼ͨ�ŷŲ�������Ӱ��,��λ��������ij�����Ϊ�������“��̼”����,Ӧ�ӵ�̼�ӽǶԵ�λ���������������ӡ� |
| [69] | . |
| [70] | Energy-related carbon emissions from UK manufacturing have fallen, between 1990 and 2007, by approximately 2% per annum. This reduction could be caused by a number of effects that can act to increase or decrease the level of emissions. Decomposition analysis has been used to separate the contributions of changes in output, industrial structure, energy intensity, fuel mix and electricity emission factor to the reduction in carbon emissions. The primary reason for the fall in emissions was found to be a reduction in energy intensity. The manufacturing sector was also split into two subsectors: the energy-intensive (El) subsector, and the non-energy-intensive (NEI) subsector. The NEI subsector, somewhat surprisingly, was found to have made greater relative reductions in its energy-related carbon emissions over the study period. This was principally due to much greater relative improvements in energy intensity. There is evidence that the El subsector had made greater relative improvements in energy intensity in the period preceding 1990, and so this may have limited improvements post 1990. (C) 2011 Elsevier Ltd. All rights reserved. |
| [71] | �����ۺϿ������ò�����ģ���˿ڹ�ģ����ҵ�ṹ����Դ�ṹ����ԴЧ�ʵ����ض�̼�ŷŵ�Ӱ�죬������չ��Kaya���ʽ�������طֽ�ģ�ͣ�Ӧ��LMDI�ֽⷽ������Դ����̼�ŷŽ������طֽ⡣Ӧ�ø�ģ�Ͷ��й�1980�ꡫ2007�����Դ����̼�ŷŽ��зֽ������̽������ҪӰ�����ص����û����������乱���ʡ��о�������������ò���ЧӦ���ҹ��ý���Դ����̼�ŷŵĹ�������ﵽ152.73%��������Ӱ�����ذ������ʾ���ֵ��С�����ǣ���Դǿ��ЧӦΪ-79.93%���˿ڹ�ģЧӦΪ20.20%����ҵ�ṹЧӦΪ7.78%����Դ�ṹЧӦΪ-0.77%���о���Ϊ����ҵ�ṹ����仯�Ըý�̼�ŷ�����δ�ܱ��ֳ���ЧӦ������Ҫԭ���Dz�ҵ��ģռGDP����ĵڶ���ҵ��̼�ŷų��ֳ�������̬�ƣ��乱���ʵ����˵�һ������ҵ��̼�ŷ������ĸ�ЧӦ��Ŀǰ�ҹ����ܼ��ŵ��ص����ڵ�����ҵ�ṹ���Ż���Դ�ṹ�������ԴЧ�ʡ����ʵ֤������������Ӧ�Ľ��ܼ������߽��顣 . �����ۺϿ������ò�����ģ���˿ڹ�ģ����ҵ�ṹ����Դ�ṹ����ԴЧ�ʵ����ض�̼�ŷŵ�Ӱ�죬������չ��Kaya���ʽ�������طֽ�ģ�ͣ�Ӧ��LMDI�ֽⷽ������Դ����̼�ŷŽ������طֽ⡣Ӧ�ø�ģ�Ͷ��й�1980�ꡫ2007�����Դ����̼�ŷŽ��зֽ������̽������ҪӰ�����ص����û����������乱���ʡ��о�������������ò���ЧӦ���ҹ��ý���Դ����̼�ŷŵĹ�������ﵽ152.73%��������Ӱ�����ذ������ʾ���ֵ��С�����ǣ���Դǿ��ЧӦΪ-79.93%���˿ڹ�ģЧӦΪ20.20%����ҵ�ṹЧӦΪ7.78%����Դ�ṹЧӦΪ-0.77%���о���Ϊ����ҵ�ṹ����仯�Ըý�̼�ŷ�����δ�ܱ��ֳ���ЧӦ������Ҫԭ���Dz�ҵ��ģռGDP����ĵڶ���ҵ��̼�ŷų��ֳ�������̬�ƣ��乱���ʵ����˵�һ������ҵ��̼�ŷ������ĸ�ЧӦ��Ŀǰ�ҹ����ܼ��ŵ��ص����ڵ�����ҵ�ṹ���Ż���Դ�ṹ�������ԴЧ�ʡ����ʵ֤������������Ӧ�Ľ��ܼ������߽��顣 |
| [72] | <p>��Դ������������̼�ŷ��Ǿ��÷�չ�����в��ɱ���ĸ���Ʒ,����̼�ŷ��ڴ����еĻ��ۻ�ʹȫ�����ϱ�ů,��˾���������̼�ŷ�֮��Ĺ�ϵһֱ��ѧ�����ע�Ľ��㡣��ͳ�Ļ���EKC���ߵľ��ü���ѧ����һ���ǶԾ������ŷ���ʷ���ݵ���ع�ϵ�о�,���ܺܺõط�ӳ����֮��Ķ���ѧ���ơ�Ϊ�˱�����������������ģ��Moon-Sonn�����Ͻ��иĽ�,���ȴ������ϵõ������ž�������������Դǿ��֮����ڵ�U���߹�ϵ�ı�Ҫ����,����Դ�IJ�������С��0.5;���Ž�Ͷ����������õ��ķ�ӳ���������µ���Դǿ�ȴ���ģ��,���й�δ����������·��������Ԥ��,ͬʱ�õ�����������·���µ���Դ��������,����ͨ������Դ���ѽṹ�Ͳ�ͬ��ԴƷ�ֵ�̼�ŷ�ϵ����Ԥ�����,�Լ��Է�Ʒ����Դ̼�ŷŵĻ��ܼ���õ����й�δ����Դ�������������ܵ�̼�ŷ����ơ������ʾ,�ڵ�ǰ��������������,�ҹ��ֱ���2043���2040��ﵽ��Դ���Ѹ߷��̼�ŷŸ߷塣����,���Ķ���Դǿ�Ȳ�ͬ�½����ʶ���Դ���Ѹ߷��Ӱ�����ģ�ⷢ��,������Ϊ4.5%5%ʱ,��Դ�߷彫������2040��ǰ,��ʱ���˾�GDPΪ10��Ԫ����,��OECD���ҵĸ߷�ʱ����һ��;���ҷ�3���龰ģ���˿�������Դ������߶�̼�ŷŸ߷��Ӱ��,������߿�������Դ�ı��ؿ������Խ���̼�ŷ���,���Ը߷���ݵ�����ʱ��Ӱ������</p> . <p>��Դ������������̼�ŷ��Ǿ��÷�չ�����в��ɱ���ĸ���Ʒ,����̼�ŷ��ڴ����еĻ��ۻ�ʹȫ�����ϱ�ů,��˾���������̼�ŷ�֮��Ĺ�ϵһֱ��ѧ�����ע�Ľ��㡣��ͳ�Ļ���EKC���ߵľ��ü���ѧ����һ���ǶԾ������ŷ���ʷ���ݵ���ع�ϵ�о�,���ܺܺõط�ӳ����֮��Ķ���ѧ���ơ�Ϊ�˱�����������������ģ��Moon-Sonn�����Ͻ��иĽ�,���ȴ������ϵõ������ž�������������Դǿ��֮����ڵ�U���߹�ϵ�ı�Ҫ����,����Դ�IJ�������С��0.5;���Ž�Ͷ����������õ��ķ�ӳ���������µ���Դǿ�ȴ���ģ��,���й�δ����������·��������Ԥ��,ͬʱ�õ�����������·���µ���Դ��������,����ͨ������Դ���ѽṹ�Ͳ�ͬ��ԴƷ�ֵ�̼�ŷ�ϵ����Ԥ�����,�Լ��Է�Ʒ����Դ̼�ŷŵĻ��ܼ���õ����й�δ����Դ�������������ܵ�̼�ŷ����ơ������ʾ,�ڵ�ǰ��������������,�ҹ��ֱ���2043���2040��ﵽ��Դ���Ѹ߷��̼�ŷŸ߷塣����,���Ķ���Դǿ�Ȳ�ͬ�½����ʶ���Դ���Ѹ߷��Ӱ�����ģ�ⷢ��,������Ϊ4.5%5%ʱ,��Դ�߷彫������2040��ǰ,��ʱ���˾�GDPΪ10��Ԫ����,��OECD���ҵĸ߷�ʱ����һ��;���ҷ�3���龰ģ���˿�������Դ������߶�̼�ŷŸ߷��Ӱ��,������߿�������Դ�ı��ؿ������Խ���̼�ŷ���,���Ը߷���ݵ�����ʱ��Ӱ������</p> |
| [73] | ���û�������ģ����"�ѹ�"����,�Խ���δ���г��ڵľ��÷�չ����Դ������CO<sub>2</sub>�ŷŽ������龰����,����ϵ�ǰ�Ļ�������,�������龰����Ҫָ��IJ����ͽ�������������������о�����,��Դ��Լ���뻷���Ѻ������Ĺ���,��̼�龰�ǽ�����Դ-����-����Э����չ����ʡ�Ҳ������ʵ�ķ���;ͨ����ͬ�龰�ıȽ�,��Ϊ��̼�龰��ʵ��һ���̶������Լ�������������ʵ�ֽ��ܼ���Ŀ���;��̼�龰����Դ������CO<sub>2</sub>�ŷ�Ҳ�����Կ�������,��2007�����,2030����Դ��������������1.431��,̼�ŷ��������ﵽ15 655×10<sup>4</sup> t,δ��20 a��Դ��Դ����Ч��Ӧ��������ó�Ϊ��Լ��̼���÷�չ��ƿ�����ء���������ʵ�ֽ��ܼ��š��ٽ���̼���÷�չ����ؽ��顣 . ���û�������ģ����"�ѹ�"����,�Խ���δ���г��ڵľ��÷�չ����Դ������CO<sub>2</sub>�ŷŽ������龰����,����ϵ�ǰ�Ļ�������,�������龰����Ҫָ��IJ����ͽ�������������������о�����,��Դ��Լ���뻷���Ѻ������Ĺ���,��̼�龰�ǽ�����Դ-����-����Э����չ����ʡ�Ҳ������ʵ�ķ���;ͨ����ͬ�龰�ıȽ�,��Ϊ��̼�龰��ʵ��һ���̶������Լ�������������ʵ�ֽ��ܼ���Ŀ���;��̼�龰����Դ������CO<sub>2</sub>�ŷ�Ҳ�����Կ�������,��2007�����,2030����Դ��������������1.431��,̼�ŷ��������ﵽ15 655×10<sup>4</sup> t,δ��20 a��Դ��Դ����Ч��Ӧ��������ó�Ϊ��Լ��̼���÷�չ��ƿ�����ء���������ʵ�ֽ��ܼ��š��ٽ���̼���÷�չ����ؽ��顣 |
| [74] | �������ε�����ֽ���Ҫ��ѧ���۸��������ŷ����Ρ�̼�㼣����ȫ��۵�����Ϊ�������Ѷ����е���������������̼�ŷ�ˮƽ, �����������̵�ֱ��̼�ŷ�, Ҳ�������������������ĵ��м��Ʒ������̼�ŷš�Ӧ��2007 ���ʡ��Ͷ�����ģ�ͺ�2002 ���й�ʡ����Ͷ�����ģ��, ���������˸�ʡ����̼�㼣��ʡ�����̼�ŷ�ת�ơ������ʾ, ��ʡ��֮��̼�㼣���˾�̼�㼣���������IJ��졣̼�㼣�ϴ��ʡ��Ϊ���ô�ʡ, ��Ҫ�ֲ��ڱ�������;�˾�̼�㼣�ϸߵ�ʡ����Ҫ�DZ������Ϻ������ij��к���Դ���������ػ�������;�й������Ŵ���Դ����������ػ������طֲ������÷�������Ͳ�ҵ�ṹ��������Ƿ���������̼�ŷſռ�ת�ơ������������, �˾�̼�㼣�ߵľ��÷���ʡ��Ӧ�е��ϴ�ļ�������, ��Դ����������ػ������طֲ��������൱һ���ֵ�̼�ŷ���Ϊ�غ�����ʡ�ݺͲ�ҵ�ṹ��������Ƿ����ʡ���ṩ������ԭ���ϵȸ�̼��Ʒ����, �������ε�����ֽ���Ҫ����̼�ŷſռ�ת�Ƶ�����, �ʵ�������Դ����������ػ������طֲ�����ļ�������, ��ʹ�غ�����ʡ������Դ����������ػ��������ṩ�ʽ�ͼ����ϵķ���, ������Щ���������Դ����Ч��, ����̼�ŷš� . �������ε�����ֽ���Ҫ��ѧ���۸��������ŷ����Ρ�̼�㼣����ȫ��۵�����Ϊ�������Ѷ����е���������������̼�ŷ�ˮƽ, �����������̵�ֱ��̼�ŷ�, Ҳ�������������������ĵ��м��Ʒ������̼�ŷš�Ӧ��2007 ���ʡ��Ͷ�����ģ�ͺ�2002 ���й�ʡ����Ͷ�����ģ��, ���������˸�ʡ����̼�㼣��ʡ�����̼�ŷ�ת�ơ������ʾ, ��ʡ��֮��̼�㼣���˾�̼�㼣���������IJ��졣̼�㼣�ϴ��ʡ��Ϊ���ô�ʡ, ��Ҫ�ֲ��ڱ�������;�˾�̼�㼣�ϸߵ�ʡ����Ҫ�DZ������Ϻ������ij��к���Դ���������ػ�������;�й������Ŵ���Դ����������ػ������طֲ������÷�������Ͳ�ҵ�ṹ��������Ƿ���������̼�ŷſռ�ת�ơ������������, �˾�̼�㼣�ߵľ��÷���ʡ��Ӧ�е��ϴ�ļ�������, ��Դ����������ػ������طֲ��������൱һ���ֵ�̼�ŷ���Ϊ�غ�����ʡ�ݺͲ�ҵ�ṹ��������Ƿ����ʡ���ṩ������ԭ���ϵȸ�̼��Ʒ����, �������ε�����ֽ���Ҫ����̼�ŷſռ�ת�Ƶ�����, �ʵ�������Դ����������ػ������طֲ�����ļ�������, ��ʹ�غ�����ʡ������Դ����������ػ��������ṩ�ʽ�ͼ����ϵķ���, ������Щ���������Դ����Ч��, ����̼�ŷš� |
| [75] | �ҹ�������Ա����,������ľ��÷�չˮƽ�Ͳ�ҵ�ṹ����ܴ���ȫ���߶���,��չ��̼������Ҫ��ʵ�᳹����ͳ��ԭ��,�����Ҫ���й�������̼�ŷ�ת���������������������о�����EIO-LCA������1997���й������Ͷ��������������й��˴�������Ʒ(����)�Լ�������̼�ŷ�������֮��������ת���������о�����,��������������֧����,���������������ϲ��غ���������������������������������������������н����������������õ�����,�����غ��������غ�������в�����֮�������������̼�ŷ�ת����֧����,�����غ�������в�����̼�ŷ�ת��������ת����,�н�����������ĸ�̼���ɲ�ҵת��,����������������෴������,���о���������Ԫ̼�ŷ�����ʾ����侭��������̼����ϵ��,�����������������õ�̼�����Ѻó̶�,��̼Ч�ʡ�����нӵ��������õ�̼Ч�ʴӴ�С˳����:����,����,�����غ�,�����غ�,����,����,�ϲ��غ�,�в����� . �ҹ�������Ա����,������ľ��÷�չˮƽ�Ͳ�ҵ�ṹ����ܴ���ȫ���߶���,��չ��̼������Ҫ��ʵ�᳹����ͳ��ԭ��,�����Ҫ���й�������̼�ŷ�ת���������������������о�����EIO-LCA������1997���й������Ͷ��������������й��˴�������Ʒ(����)�Լ�������̼�ŷ�������֮��������ת���������о�����,��������������֧����,���������������ϲ��غ���������������������������������������������н����������������õ�����,�����غ��������غ�������в�����֮�������������̼�ŷ�ת����֧����,�����غ�������в�����̼�ŷ�ת��������ת����,�н�����������ĸ�̼���ɲ�ҵת��,����������������෴������,���о���������Ԫ̼�ŷ�����ʾ����侭��������̼����ϵ��,�����������������õ�̼�����Ѻó̶�,��̼Ч�ʡ�����нӵ��������õ�̼Ч�ʴӴ�С˳����:����,����,�����غ�,�����غ�,����,����,�ϲ��غ�,�в����� |
| [76] | �����Ϻ�����Դͳ������,����IPCC(2006)����,�������Ϻ�����ԴCO2�ŷ��嵥,��������2007���Ϻ���̼��ͨͼ.�������,�Ϻ�����Դ��ص�CO2�ŷ�������1995���1.10��t������2007���2.01��t,�ڼ����������Ϊ5.0%.���С���ͨ����Ӧ��CO2�ŷ���������ΪѸ��,��������ʴ�15.1%;�����ȵ糧����CO2�ŷ��������仺,��ԭ��Ϊ�����Ϻ�������������������.2007�ꡰ�ȵ糧��������ҵ�뽨��ҵ��������ͨ��������ҵ��������������롰ũҵ��������CO2�ŷŷֵ��ʷֱ�Ϊ35.4%��34.4%��23.8%��4.0%��2.0%��0.4%.��2007���Ϻ���̼��ͨͼ�ɼ�,15.6%��úֱ̿�����ն�ʹ��,�ⲻ������ԴЧ�ʵ��������Ⱦ��ļ���;��Ʒ�ʹ��ڽ϶�Ľ�����ͨ,���ܹ����ٲ���Ҫ����ͨ,�����ܹ������Ʒ�͵�����,���ܹ���������ת�˹����е�������ʧ. . �����Ϻ�����Դͳ������,����IPCC(2006)����,�������Ϻ�����ԴCO2�ŷ��嵥,��������2007���Ϻ���̼��ͨͼ.�������,�Ϻ�����Դ��ص�CO2�ŷ�������1995���1.10��t������2007���2.01��t,�ڼ����������Ϊ5.0%.���С���ͨ����Ӧ��CO2�ŷ���������ΪѸ��,��������ʴ�15.1%;�����ȵ糧����CO2�ŷ��������仺,��ԭ��Ϊ�����Ϻ�������������������.2007�ꡰ�ȵ糧��������ҵ�뽨��ҵ��������ͨ��������ҵ��������������롰ũҵ��������CO2�ŷŷֵ��ʷֱ�Ϊ35.4%��34.4%��23.8%��4.0%��2.0%��0.4%.��2007���Ϻ���̼��ͨͼ�ɼ�,15.6%��úֱ̿�����ն�ʹ��,�ⲻ������ԴЧ�ʵ��������Ⱦ��ļ���;��Ʒ�ʹ��ڽ϶�Ľ�����ͨ,���ܹ����ٲ���Ҫ����ͨ,�����ܹ������Ʒ�͵�����,���ܹ���������ת�˹����е�������ʧ. |
| [77] | |
| [78] | China is now in the process of rapid urbanization. City׳s operating efficiency was directly determined by the scale and efficiency of energy consumption and flow. The pattern, scale and efficiency of urban carbon flow are not only important indicators that reflect urban efficiency and sustainable development, but also important references in the formulating low-carbon and sustainable energy polices for cities. Through establishing a theoretical framework and calculation method, this paper studied the carbon flows of Nanjing urban system in three different levels. It shows that urban production and transportation system, urban living system, rural production system and rural living systems are the major part of urban system in the carbon flow. The carbon flows between Nanjing and the external system, was much higher than the carbon flows among different internal subsystems. If the embodied carbon is taken into account, carbon flow from the urban to rural system of Nanjing was clearly greater than the flow in the opposite direction. With economic development and the implement of energy-saving and emission reduction policy, the carbon productivity and carbon flow efficiency in Nanjing has improved significantly since 2000. Fossil energy consumption, urbanization, agricultural activities, rural life demands and trade are key factors with major impact on urban carbon flows in Nanjing. Therefore, adjusting industrial structure, urban expansion control, and developing renewable energy are main measures to realize sustainable development of Najing city. Furthermore, the dual urban–rural structure in Nanjing brought large exchanges of products and embodied carbon between urban and rural areas, indicates that urban carbon flow and its efficiency was highly influenced by urban–rural structure, which will further aggravate carbon flow burden of urban systems. |
| [79] | Over the past two decades, a continuously expanding list of footprint-style indicators has been introduced to the scientific community with the aim of raising public awareness of how humanity exerts pressures on the environment. A deeper understanding of the connections and interactions between different footprints is required in an attempt to support policy makers in the measurement and choice of environmental impact mitigation strategies. Combining a selection of footprints that address different aspects of environmental issues into an integrated system is, therefore, a natural step. This paper starts with the idea of developing a footprint family from which most important footprints can be compared and integrated. On the basis of literature review in related fields, the ecological, energy, carbon, and water footprints are employed as selected indicators to define a footprint family. A brief survey is presented to provide background information on each of the footprints with an emphasis on their main characteristics in a comparative sense; that is, the footprints differ in many aspects more than just the impacts they are addressed. This allows the four footprints to be complementarily used in assessing environmental impacts associated with natural resource use and waste discharge. We evaluate the performance of the footprint family in terms of data availability, coverage complementarity, methodological consistency, and policy relevance and propose solutions and suggestions for further improvement. The key conclusions are that the footprint family, which captures a broad spectrum of sustainability issues, is able to offer a more complete picture of environmental complexity for policy makers and, in particular, in national-level studies. The research provides new insights into the distinction between environmental impact assessment and sustainability evaluation, properly serving as a reference for multidisciplinary efforts in estimating planetary boundaries for global sustainability. (C) 2013 Elsevier Ltd. All rights reserved. |
| [80] | Future climate projections indicate that Pennsylvania will get significantly warmer and wetter due to continued increases in atmospheric greenhouse gas (GHG) concentrations. Using the Terrestrial Ecosystem Model version Hydro2 (TEM-Hydro2), this study explores the effect of different climate and land use scenarios on carbon, nitrogen, and water dynamics during the 20th and 21st centuries. TEM-Hydro2 runs are forced by historical 20th century climate data and by 21st century climate projections from the NCAR CCSM3.0 IPCC A2 and B1 scenarios, a relatively high and low GHG emissions scenario, respectively. Regrowing forests are the only ecosystem with positive Net Carbon Exchange (NCE) and sequestered more than 12,000 g C m(-2) during the 20th century. The highest rates of leaching of dissolved inorganic nitrogen (DIN) occurred in fertilized croplands in the 20th century. Twenty first century runoff increases by 30% in the A2 scenario and 20% in the B1 scenario, but DIN leaching only increases in the A2 scenario. DIN leaching depends upon both runoff and available inorganic nitrogen, which decreases due to high productivity and enhanced plant nitrogen uptake. The effect of increasing urbanization in the 21st century is to reduce NCE by about 34% in both climate scenarios, while water runoff increases by 5% and DIN leaching decreases by 17%. The reduced leaching is the result of converting agricultural land to suburban areas, which are a combination of turflawn and forests, both of which have lower leaching rates than croplands or pastures. Incorporating realistic forest stand age substantially increases the NCE but has little effect on runoff or DIN leaching. Maize yields decrease in the A2 scenario due to the excessive leaching, but increase in the B1 scenario. These results illustrate why it is important to include scenarios of both GHG emissions and realistic land use changes in model projections of the regional impacts of climate change in the 21st century. (C) 2012 Elsevier B.V All rights reserved. |
| [81] | This study has developed and applied a planning support system (PSS) �C a tool for planners to analyze and choose the best policy instrument in order to adapt to climate change in the Qazvin irrigation and drainage network, located in the central part of Iran that is mainly supplied by the Taleghan reservoir. A comprehensive weather generator was developed that was capable of regenerating statistical characteristics and linear correlation between neighboring stations. After downscaling monthly outputs from General Circulation Models (GCMs) using the Inverse Distance Weighting (IDW) interpolation method, the weather generator was used to generate daily time series for the base case and projected climate change scenarios. This study simulated the Taleghan reservoir daily inflow under projected climate change scenarios using the data fusion method where outputs from the most representative Artificial Neural Networks and Hammerstein�CWiener models were ��fused�� to simulate the reservoir daily inflow. Results showed a decrease in mean daily inflow in almost all months. Biophysical input coefficients were estimated using the Decision Support System for Agrotechnology Transfer (DSSAT) crop models under all climate scenarios. The projected production of all studied crops can vary between 86% and 122% of the potential production under the base-case scenario. In addition, it was revealed that the net irrigation requirement for crops will decrease by 12% on an average. The main goal of the PSS was to maximize the total net income for the region. It can be concluded that reducing bank loan interest rate and setting two different water prices for surface and pressurized irrigation systems can be seen as the best management practices in the region. |
| [82] | . |
| [83] |
