 ,1,2,3,4,*, 刘鹏飞2,4, 李霄阳1,4, 王团徽1,41.
 2.
3.
4.
Spatio-temporal variations of soil organic matter and nutrient losses resulted from wind erosion in northern China from 1980 to 2015
ZHAO Haipeng1,4, SONG Hongquan,1,2,3,4,*, LIU Pengfei2,4, LI Xiaoyang1,4, WANG Tuanhui1,41. 2.
3.
4.
通讯作者:
收稿日期:2018-12-26修回日期:2019-05-25网络出版日期:2019-11-20
| 基金资助: |
Received:2018-12-26Revised:2019-05-25Online:2019-11-20
作者简介 About authors
赵海鹏(1995-),男,河南禹州人,硕士,研究方向为空间分析、地理建模E-mail:

摘要
关键词:
Abstract
Keywords:
PDF (8170KB)元数据多维度评价相关文章导出EndNote|Ris|Bibtex收藏本文
本文引用格式
赵海鹏, 宋宏权, 刘鹏飞, 李霄阳, 王团徽. 1980—2015年风蚀影响下中国北方土壤有机质与养分流失时空特征. 地理研究[J], 2019, 38(11): 2778-2789 doi:10.11821/dlyj020181424
ZHAO Haipeng.
1 引言
风蚀是一个受自然与人文因素共同驱动的复杂时空动态过程[1,2,3],是引起土壤退化、荒漠化、土壤养分与有机质(SOM)变异的重要原因之一[4,5,6]。风蚀具有巨大的起沙、运移与空间再分配能力,可导致SOM与养分的时空再分配,对区域乃至全球的空气质量、气候变化、人体健康、生态系统等具有重要影响[7]。然而,因风蚀造成的土壤有机质与养分动态变化及其在碳循环与养分循环估算中的作用仍然未知[8],是造成碳与养分收支估算不确定性的重要因素之一[3,9]。因此,研究风蚀对SOM与养分流失的影响具有重要的理论与现实意义。近年来,国内外相关****开展了风蚀对土壤有机质与养分流失的影响研究。多个样地实验通过长期观测发现风蚀可造成地表SOM与养分的显著流失[7,10-16]。利用遥感与地面观测数据,相关****研究了风蚀对土壤有机碳含量的影响[17,18,19],概略估算了风蚀影响下中国西北部干旱半干旱农牧区土壤有机碳年均流失量(60~75 Tg)。利用风蚀模型与土壤普查数据,Chappell等粗略估算了澳大利亚每年约5.83 Tg CO2在碳收支计算中被忽略[20]。但目前的研究主要集中在风蚀对土壤有机质流失的影响,且侧重于定性分析与较小空间尺度的样地实验。
鉴于此,本文利用WRF/Chem(Weather Research Forecasting with Chemistry)v3.7.1大气化学传输模型,对1980—2015年间中国北方沙尘排放的时空变化过程进行精细化模拟,结合中国SOM、全氮(TN)与全磷(TP)空间分布数据,估算沙尘排放引起的SOM、TN与TP流失量,并分析其时空变化特征。本研究对于了解中国北方沙尘排放的时空变化规律,研究风蚀作用对沙尘排放源区碳循环及养分流失的影响具有重要参考价值。
2 方法与数据
2.1 基于WRF/Chem的土壤有机质与养分流失估算
WRF/Chem是由美国国家海洋和大气管理局(NOAA)、美国国家大气研究中心(NCAR)等单位联合研发的新一代在线(Online)空气质量模式[21]。WRF/Chem考虑了大气污染物的平流输送、湍流扩散、干湿沉降、辐射传输等主要大气物理过程,以及多相化学、气溶胶演变等大气化学过程。在模拟计算过程中,气象与化学模块采用相同的格点、时间步长、传输方案和物理方案,实现了太阳辐射、大气动力及气溶胶化学等多过程、多物种的在线耦合与反馈[22]。Shao等于2011年提出了一种新的起沙机制模型(Shao11)[23],是对Shao2004年起沙方案(Shao04)的简化[24]。Shao11起沙方案基于风蚀起沙物理学机制,认为粒径为ds的沙粒跃移运动可产生下式所示粒径为di的沙尘通量:
式中:F(di, ds)为ds粒径沙尘跃移产生的di粒径沙尘通量(kg/(m2·s));cy为无量纲比例系数(1×0.10-4)[24];ηf为释放至大气中土壤颗粒的质量比例,计算方法参见文献[25];σp为沙尘颗粒占土壤团聚体的质量比例,具体计算方法参见文献[23];σm为有效轰击率,详见文献[23];g为重力加速度(9.8 m/s2);
式中:cf为覆盖有植被、河流、湖泊、岩石与积雪,以及地表冰冻区域等非可蚀地表所占比例,WRF/Chem采用Ginoux等开发的全球可蚀性地图获取cf值[26];c0是可调节经验比例系数,取值范围在1.8~3.1之间,现有研究表明c0 = 2.6时在中国北方具有较好的模拟效果[27];ρ为空气密度(kg/m3);
式中:uz为z高度的风速(m/s),z一般取值为10 m;z0为空气动力学粗糙长度(m),计算方法参见文献[28]。相关研究已证明Shao11与Shao04具有同等的模拟效果[27,29],且已被广泛应用于东亚地区的沙尘模拟。自2013年起该起沙方案已被集成在WRF/Chem模式,并将沙尘粒径划分为0~2 μm、2~3.6 μm、3.6~6 μm、6~12 μm及12~20 μm等五个等级,用于模拟沙尘的起沙、传输和沉降过程[30]。
基于WRF/Chem模拟计算沙尘排放量,利用土壤有机质与养分含量空间分布,计算风蚀引起的土壤表层有机质与养分流失通量空间分布,公式为:
式中:ONE为土壤有机质或养分流失通量(g/(m2·a));M为沙尘排放通量(g/(m2·a));ON是研究区表层土壤中土壤有机质或养分的含量(g/100 g)。
2.2 研究区与数据来源
本文的研究区为易发生风蚀的中国北方干旱/半干旱区,属于温带大陆性气候。该区域的主要植被类型是草原和沙漠(图1),区域总面积约占全国面积的30%,年均降水量小于400 mm,年均气温在0~13 ℃之间。图1
 新窗口打开|下载原图ZIP|生成PPT
图1研究区植被类型空间分布
注:该图基于国家测绘地理信息局标准地图(审图号为GS(2016)1569号)绘制,底图无修改。
Fig. 1Spatial distribution of vegetation type in the research region
利用美国国家环境预报中心(NCEP)和NCAR联合推出的NCEP/NCAR全球再分析资料作为模式的气象场初始条件,其空间分辨率为2.5°×2.5°,时间分辨率为6h。表层土壤的SOM、TN与TP含量空间分布数据来自中国陆地表面模型土壤数据库(SDCLSM)[31]。SDCLSM数据库是由8979个土壤剖面数据及结合1:100万中国土壤图制作而成,其空间分辨率为0.5°×0.5°。
2.3 参数设置与模拟结果评估
本研究采用3.7.1版本的WRF/Chem大气化学传输模式,模式采用Lambert地图投影,网格空间分辨率设置为36 km,时间分辨率为1 h,中心点经纬度为100°E,41°N,经向网格数为140,纬向网格数为100,垂直为28层。模式采用表1的参数化方案,为提高风速、温度、降雨等关键气象参数的模拟精度,在模拟过程中启用了四维数据同化(Four-Dimensional Data Assimilation, FDDA)技术。将模拟时段设置为1979年12月1日00时—2015年12月31日23时(北京时间),为减少初始条件对模拟结果的影响,1979年12月份的模拟结果不参与本文的分析。Tab. 1
表1
表1模式参数化方案
Tab. 1
| 模型参数 | 参数设置 |
|---|---|
| 长波辐射模型 | RRTM长波辐射 |
| 短波辐射模型 | RRTM短波辐射 |
| 近地面层 | Revised MM5 MO |
| 微物理方案 | Morrison 2-mom |
| 陆面参数 | Noah LSM |
| 积云 | Multi-scale Kain-Fritsch |
| 边界层 | Noah LSM |
新窗口打开|下载CSV
气象参数对沙尘排放模拟具有重要影响,利用NOAA及美国国家气候数据中心(NCDC)469个站点的气象数据,对本文WRF/Chem模拟的气象参数进行了评估(表2)。气象观测数据为距离地面2 m高度的气温(T2)、降水(PCP)、距离地面10 m高度的风速(WSP10)及风向(WDR10),时间分辨率为3h。本文采用的统计指标包括平均偏差(MB)、标准化平均偏差(NMB)、标准化平均误差(NME)、均方根误差(RMSE)和相关系数(R)(表2),其计算方法详见文献[32]。总体而言,地表气温观测值与模拟值的相关系数可达0.9以上,表明模式能够较准确地模拟各季节的地表气温。风速在一定程度上被高估,其相关系数在春季、夏季与秋季达到了0.5以上。虽然风向的模拟结果稍差,但是本研究未涉及沙尘的传输与沉降过程,利用此参数设置可满足对沙尘排放模拟的需求。
Tab. 2
表2
表2WRF/Chem气象参数模拟结果评估
Tab. 2
| 气象参数(单位) | 季节 | 平均观测值 | 平均模拟值 | MB | NMB(%) | NME(%) | RMSE | R |
|---|---|---|---|---|---|---|---|---|
| T2 (℃) | 冬季 | -0.8 | -1.9 | -1.1 | -0.5 | 2.6 | 3.5 | 0.9 |
| 春季 | 6.1 | 5.2 | -0.9 | -15.1 | 37.9 | 3.4 | 0.9 | |
| 夏季 | 21.9 | 21.7 | -0.2 | -0.1 | 8.9 | 3.3 | 0.9 | |
| 秋季 | 18.7 | 17.8 | -0.9 | -4.6 | 9.3 | 3.1 | 0.9 | |
| WSP10 (m/s) | 冬季 | 1.9 | 3.2 | 1.3 | 69.0 | 76.1 | 1.7 | 0.4 |
| 春季 | 2.5 | 3.5 | 1.0 | 43.0 | 51.1 | 1.5 | 0.5 | |
| 夏季 | 2.2 | 3.2 | 1.0 | 42.1 | 49.8 | 1.3 | 0.5 | |
| 秋季 | 1.9 | 2.9 | 1.0 | 49.4 | 56.4 | 1.3 | 0.5 | |
| WDR10(°) | 冬季 | 210.5 | 190.1 | -20.4 | -12.7 | 46.9 | 189.0 | 0.2 |
| 春季 | 206.4 | 185.2 | -21.3 | -13.4 | 47.3 | 165.2 | 0.2 | |
| 夏季 | 201.5 | 167.3 | -34.2 | -15.6 | 47.3 | 194.7 | 0.2 | |
| 秋季 | 211.4 | 172.7 | -38.7 | -16.3 | 48.6 | 192.7 | 0.2 | |
| PCP(mm/d) | 冬季 | 0.9 | 0.7 | -0.2 | -10.6 | 107.3 | 6.4 | 0.5 |
| 春季 | 2.8 | 2.4 | -0.4 | -17.2 | 97.8 | 9.5 | 0.4 | |
| 夏季 | 3.5 | 4.3 | 0.8 | 12.2 | 139.7 | 7.3 | 0.5 | |
| 秋季 | 1.8 | 2.1 | 0.3 | 7.2 | 123.6 | 8.5 | 0.3 |
新窗口打开|下载CSV
3 结果分析
3.1 沙尘排放时空变化
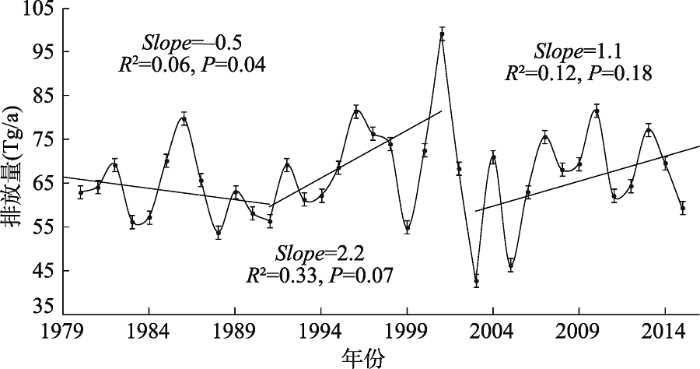
模拟结果显示,1980—2015年间中国北方的沙尘排放呈现较大的年际波动,每年约66.59 Tg沙尘排放至大气,2001年的沙尘排放量最大(99.28 Tg),沙尘排放量最低的年份为2003年(42.79 Tg)(图2)。其中,1986年、1996年、2001年和2010年是沙尘排放量较大的年份,其排放量分别达到了79.83 Tg、81.52 Tg、99.28 Tg和81.65 Tg;1988年、2003年和2005年则是该区域沙尘排放量较小的年份,每年分别向大气排放约53.77 Tg、42.79 Tg和46.32 Tg的沙尘颗粒。图2
 新窗口打开|下载原图ZIP|生成PPT
图21980—2015年中国北方沙尘排放量年际变化
Fig. 2Inter-annual variations of dust emissions in northern China from 1980 to 2015
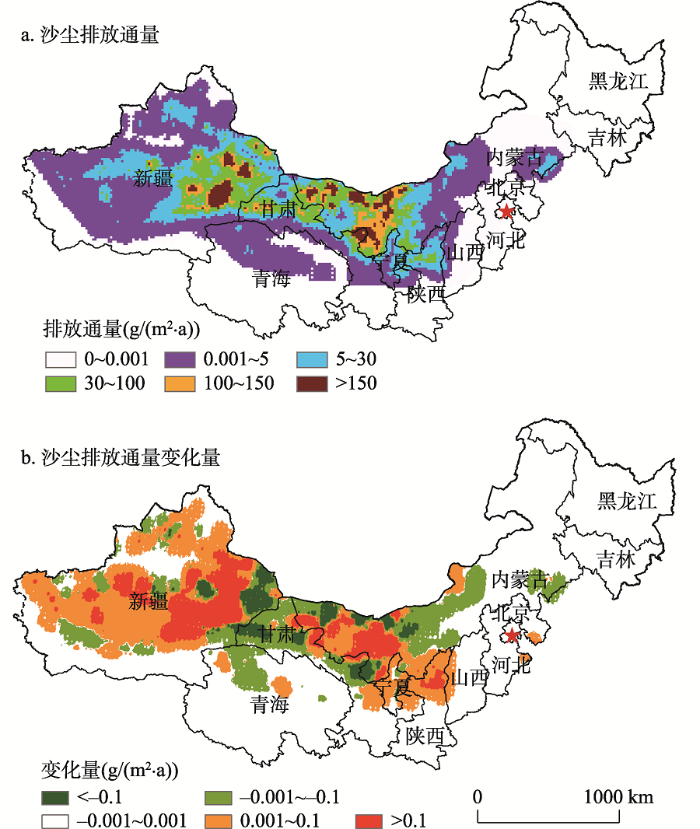
中国北方的沙尘排放具有较大的空间分异特征(图3a),主要集中分布在内蒙古西部、河西走廊、新疆东部、塔克拉玛干沙漠等地区。大部分易发生风蚀的区域年均沙尘排放通量大于30 g/(m2·a),部分区域可达150 g/(m2·a)以上,如塔克拉玛干沙漠东部、巴丹吉林沙漠、腾格里沙漠以及乌兰布和沙漠等地,该区域的植被盖度大都低于20%且年均降水量小于400 mm。1980—2015年间,中国北方沙尘排放的变化趋势存在较大空间差异(图3b)。新疆地区及内蒙古西部的沙尘排放整体呈增加态势,而在甘肃西北部、内蒙古中部、新疆东部戈壁部分地区及青海北部部分地区呈下降趋势。总体来讲,沙尘排放呈增加态势的区域面积大于沙尘排放减少的面积。
图3
 新窗口打开|下载原图ZIP|生成PPT
图3年均沙尘排放通量及其变化趋势空间分布
注:该图基于国家测绘地理信息局标准地图(审图号为GS(2016)1569号)绘制,底图无修改。
Fig. 3Spatial distribution of annual mean dust flux and trends of annual mean dust flux
3.2 土壤有机质流失时空特征
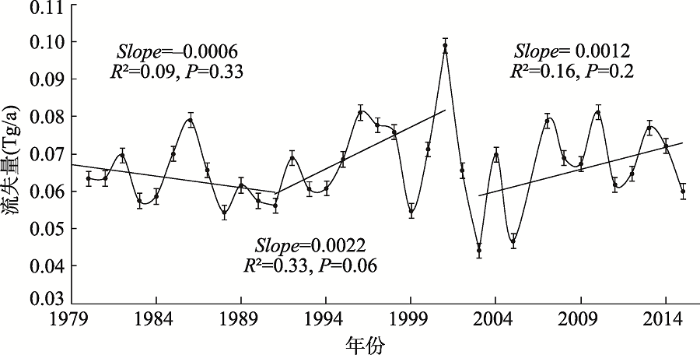
近40年中国北方沙尘排放导致的SOM流失具有较大的年际波动,每年约有0.07 Tg 的SOM排放至大气,其中年最大与最小SOM流失量分别发生在2001年(0.10 Tg)与2003年(0.07 Tg)(图4)。与沙尘排放的变化趋势相似,1986年、1996年、2001年和2010年的SOM流失量较大,分别达0.079 Tg、0.081 Tg、0.099 Tg和0.081 Tg;1999年、2003年和2005年则是SOM流失较少的年份,其流失量分别为0.055 Tg、0.044 Tg以及0.047 Tg。图4
 新窗口打开|下载原图ZIP|生成PPT
图4土壤有机质流失量年际变化
Fig. 4Inter-annual variations of SOM losses
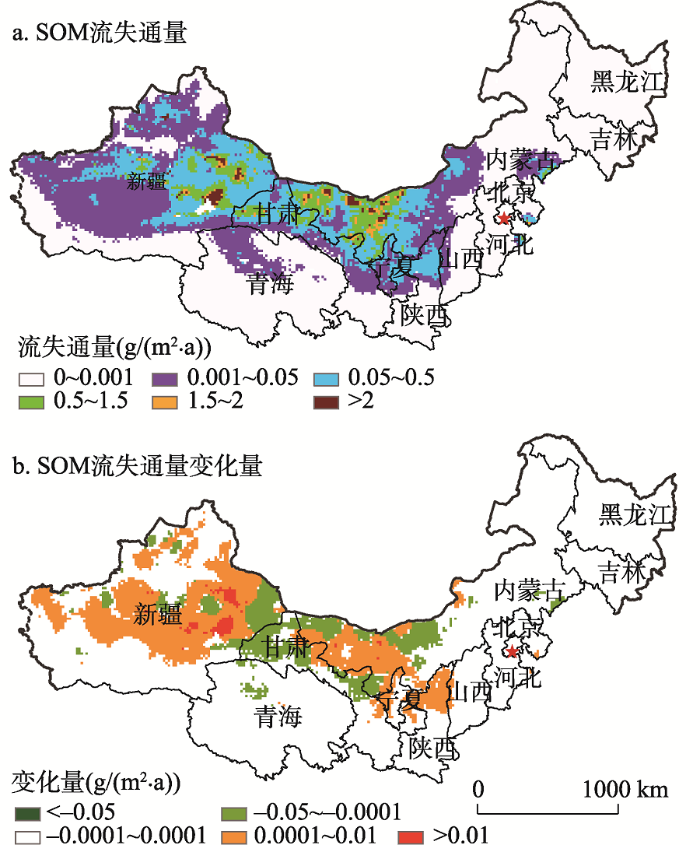
土壤有机质流失较严重的区域主要分布在内蒙古西部、甘肃西北部及新疆东部等地,这些地区土壤有机质的年均流失通量均大于0.5 g /(m2·a) (5 kg /(hm2·a))(图5a)。从1980—2015年间土壤有机质流失通量变化趋势来看(图5b),塔里木盆地北侧与东侧、以及内蒙古西部地区呈增加态势,而在新疆东部与甘肃交界部分地区以及内蒙古西部部分地区呈下降趋势,并且土壤有机质流失通量增加的地区范围较广。
图5
 新窗口打开|下载原图ZIP|生成PPT
图5年均土壤有机质流失通量及其变化趋势空间分布
注:该图基于国家测绘地理信息局标准地图(审图号为GS(2016)1569号)绘制,底图无修改。
Fig. 5Spatial distribution of annual mean SOM loss flux and trends in annual mean SOM loss flux
3.3 土壤氮与磷流失时空特征
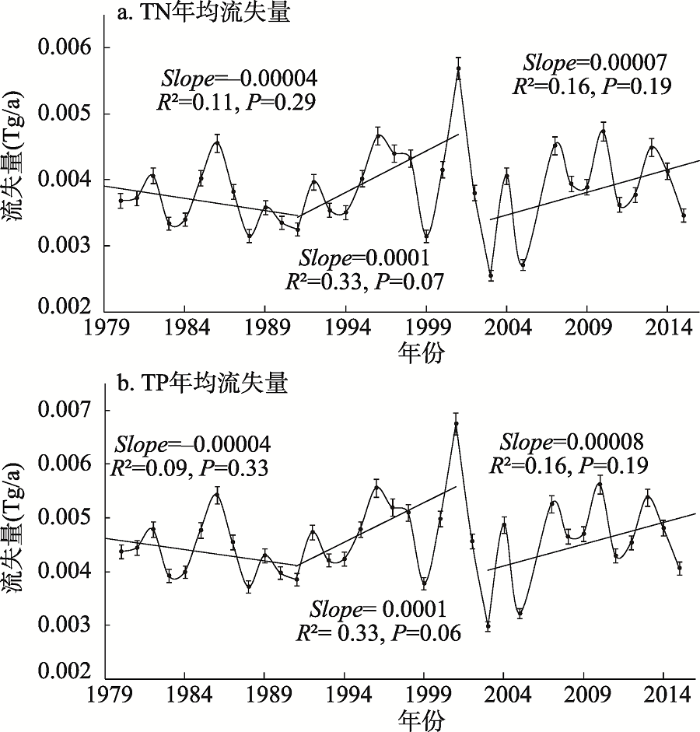
1980—2015年间,中国北方因风蚀影响每年分别有0.004 Tg和0.005 Tg的土壤氮与磷排放至大气。2001年的土壤氮与磷流失量最大,分别为0.006 Tg与0.007 Tg,最小土壤氮与磷流失量发生在2003年,均为0.003 Tg(图6)。土壤氮与磷流失量年际变化特征与沙尘排放及土壤有机质流失相似(图6),1986年、1996年、2001年与2010年是土壤氮和磷流失较为严重的几个年份,流失量均超过年均流失量的17%;1999年、2003年和2005年则是土壤氮与磷流失量相对较少的年份。图6
 新窗口打开|下载原图ZIP|生成PPT
图61980—2015年土壤氮与磷流失量年际变化
Fig. 6Inter-annual variations of losses of soil nitrogen and phosphorus under wind erosion during 1980 to 2015
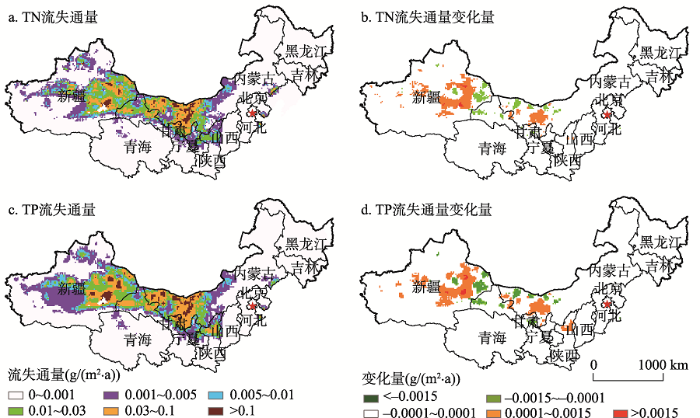
因风蚀作用引起的土壤氮与磷流失主要分布在内蒙古西部、甘肃西北部及新疆东部,且土壤磷的流失比土壤氮更为严重(图7a,图7c,见第2785页),这些区域年均流失通量可达0.1g/(m2·a)以上。近40年来,内蒙古西部部分地区、新疆东部及塔里木盆地部分地区的土壤氮与磷流失通量呈增加趋势,而土壤氮与磷流失量降低的区域较少,零星分布在内蒙古西部部分地区、新疆东部及甘肃西部部分区域(图7b,图7d,见第2785页)。
图7
 新窗口打开|下载原图ZIP|生成PPT
图7年均土壤氮与磷流失通量及其变化趋势空间分布
注:该图基于国家测绘地理信息局标准地图(审图号为GS(2016)1569号)绘制,底图无修改。
Fig. 7Spatial distributions of annual mean TN and TP losses flux and trends in annual mean losses of TN and TP in China
4 讨论
风蚀导致的沙尘排放受气候、土壤、植被、土地利用、社会经济发展等多方面因素的影响,其成因机理较为复杂。本文利用WRF/Chem模拟了沙尘排放时空过程,基于土壤有机质与养分的空间分布数据来估算SOM、TN与TP的流失量。沙尘排放量的模拟精度决定了SOM、TN与TP流失量的估算精确度,因难以获取中国的沙尘排放实际观测数据,实现对本模型沙尘排放模拟结果的精度评估较为困难。已有大量研究利用多种起沙机制模型对中国部分地区的沙尘排放量进行了估算[33,34,35,36,37],相关研究及敏感性实验表明,Shao11起沙机制模型可较好的模拟东亚地区的沙尘排放,且能够很好的对戈壁区域的起沙进行模拟[38,39,40]。本研究模拟得到的沙尘排放时空变化特征与相关研究报道基本吻合[41],春季沙尘排放(0~20 μm)通量约为18 g /(m2·a),与文献[39]对中国干旱半干旱区3月与4月的沙尘排放通量模拟结果相当(4 μg /(m2·s))。在浑善达克沙地及其周边区域模拟得到的沙尘排放量并不明显,这可能是因为浑善达克沙地及其周边表层土壤以黏土和细沙为主,土壤颗粒占比最大的粒径范围在50~250 μm之间[42],而本文所模拟的沙尘排放粒径在20 μm以下。本研究发现塔克拉玛干沙漠和内蒙古西部大戈壁是中国北方两大沙尘源区,这与前人的研究结果相符[43]。近40年来中国北方沙尘排放具有较强的年际波动,与沙尘暴事件发生的时间变化特征具有较好的一致性[37]。2001年的沙尘排放量最大,主要原因是2000年中国北方大部分区域的降水量与往年相比偏少,同时大部分地区在夏季出现了持续性的极端高温天气,直接影响了植被生长并导致植被盖度偏低[44],从而造成2001年的沙尘排放量偏大。而2003年与2005年中国北方春季的降水偏多,土壤湿度较大,促进植被生长,植被覆盖度较大,同时大风天气日数较少[45,46],进而造成了这两年的沙尘排放量较少。本文估算的表层SOM与TN年流失通量分别为(1~204)kg / hm2和(0.1~8.8)kg / hm2,稍低于已有研究报道的沙尘暴事件引起的土壤表层碳((53~1044)kg / hm2)与氮((5~90)kg / hm2)年流失量估算值[47],可能是由于已有研究主要关注于碳氮含量较高的农田表土流失[15]。同时,对于土壤流失量的估算大都根据遥感等方法提取的风蚀强度或模数来完成的[48],未对土壤流失量进行精细化的模拟估算,导致了对表层土壤流失量的高估。另外,本研究仅考虑土壤粒径在20 μm以下易于释放至大气的土壤颗粒,也是本文土壤碳与氮流失量低于其他估算结果[18]的原因之一。
本文利用WRF/Chem对中国北方风蚀作用下的土壤有机质与养分流失量进行了估算,可为顾及风蚀过程的生态系统模型研发提供支持。沙尘携带的SOM与养分通过传输与沉降导致其在空间上进行再分配,可影响沙尘源区及其下游的各类生态系统,急需进一步研究沙尘过程引起的SOM与养分的源汇效应、沙尘过程对生态系统结构和功能的影响等。
5 结论
通过以上分析,可以得出以下结论:(1)1980—2015年间,中国沙尘排放最严重的地区出现在新疆东部、内蒙古西部、巴丹吉林沙漠与腾格里沙漠地区,这些区域的年均沙尘排放通量大于150 g /m2。平均每年约有66.59 Tg的沙尘排放至大气,2001年沙尘排放量是近40年最多的年份(99.3 Tg),沙尘排放最少的年份出现在2003年(42.8 Tg)。
(2)1980—2015年间中国沙尘排放增加的面积大于沙尘排放减少的面积。其中沙尘排放通量年增加量大于0.1 g/m2的区域主要集中在新疆东部大部分区域、新疆中部部分区域、内蒙古中西部及陕西北部部分区域。
(3)1980—2015年中国北方因风蚀每年引起的SOM、TN与TP流失量分别为0.07 Tg、0.004 Tg和0.005 Tg,SOM、TN及TP的最高年(2001年)流失量可达0.1 Tg、0.006 Tg和0.007 Tg。在该段时间中国北方沙尘排放及其引起的土壤有机质与养分流失无明显的趋势性变化,且呈现较大的年际波动。风蚀作用下SOM、TN与TP流失较严重的地区主要分布在内蒙古西部、新疆东部及甘肃西北部,且大部分区域的流失量呈增加态势。
参考文献 原文顺序
文献年度倒序
文中引用次数倒序
被引期刊影响因子
[本文引用: 1]
[本文引用: 1]
[本文引用: 1]
[本文引用: 2]
[本文引用: 1]
[本文引用: 1]
[本文引用: 1]
[本文引用: 2]
[本文引用: 2]
[本文引用: 1]
[本文引用: 1]
DOI:10.1007/s11104-008-9789-8Magsci [本文引用: 1]

<a name="Abs1"></a>A field study was conducted in a semi-arid sand land ecosystem in eastern Inner Mongolia, China, to explore the mechanisms underlying how human-induced environmental degradation in sandy grasslands influences ecosystem plant diversity, productivity, soil erodibility, and soil carbon (C), nitrogen (N) and phosphorus (P) accumulation and storage. We investigated (1) C, N and P accumulation to 20cm soil depth; (2) C, N and P storage in plant litter, above- and below-ground biomass; and (3) the rate of surface wind erosion measured as the amount of aeolian soil accumulating in the traps and C, N and P output from the topsoil removal due to wind erosion during the erosive season in four habitats of differently degraded sandy grasslands. Environmental degradation has resulted in significant and differential reductions in soil C, N and P accumulation within the top 20cm soil layer across habitats. On average, the most severely degraded sandy grassland stored 474%, 198% and 56% less soil C, N and P, while the severely degraded sandy grassland stored 215%, 121% and 27% less soil C, N and P and the moderately degraded sandy grassland stored 111%, 60% and 17% less soil C, N and P than did the lightly degraded sandy grassland. Two key variables associated with reduced soil C, N and P accumulation in sandy grasslands as a result of environmental degradation are reduced plant litter and above- and below-ground biomass production (i.e. less plant C, N and P inputs in the soil) and increased C, N and P output from the removal of nutrient-rich topsoil layers resulted from increased rates of wind erosion. This study suggests a complex mechanism by which environmental degradation influences soil C, N and P accumulation and dynamics via its significant effects on ecosystem plant diversity, productivity and soil erodibility.
Magsci
In the Sahel, determining the effects of wind erosion on soil fertility and soil carbon balance is crucial for achieving sustainable agriculture and for carbon sequestration, respectively. We designed the Aeolian Materials Sampler (AMS) to measure the surface flux of soil nitrogen and carbon, which limit crop production as well as water in the Sahel. The AMS should not be used alone, but with the Big Spring Number Eight (BSNE) sampler, which is a quasi-isokinetic sampler. We examined the performance of the AMS in estimating the surface flux of soil nitrogen and carbon by conducting wind-tunnel and field experiments. In the former experiment, we measured the trapping efficiency of the AMS for nitrogen and carbon content in coarse organic matter (COM) and soil particles. We observed that the AMS allows estimation of the surface flux of soil nitrogen and carbon associated with the movement of COM and soil particles; wind data and empirical equations were used for the estimation. In the field experiment, we assessed the contribution of the inherent error of the AMS to the total measurement error and found that the inherent error was negligible and did not increase the total measurement error in the estimation of the surface flux of soil nitrogen and carbon. Therefore, we concluded that the combination of the AMS and the BSNE sampler could be effectively used to evaluate the effects of wind erosion on soil fertility and soil carbon balance in the Sahel.
[本文引用: 1]
[本文引用: 1]
[本文引用: 1]
[本文引用: 1]
[本文引用: 1]
[本文引用: 2]
[本文引用: 2]
[本文引用: 1]
DOI:10.1111/gcb.12305Magsci [本文引用: 1]
Soil erosion redistributes soil organic carbon (SOC) within terrestrial ecosystems, to the atmosphere and oceans. Dust export is an essential component of the carbon (C) and carbon dioxide (CO2) budget because wind erosion contributes to the C cycle by removing selectively SOC from vast areas and transporting C dust quickly offshore; augmenting the net loss of C from terrestrial systems. However, the contribution of wind erosion to rates of C release and sequestration is poorly understood. Here, we describe how SOC dust emission is omitted from national C accounting, is an underestimated source of CO2 and may accelerate SOC decomposition. Similarly, long dust residence times in the unshielded atmospheric environment may considerably increase CO2 emission. We developed a first approximation to SOC enrichment for a well-established dust emission model and quantified SOC dust emission for Australia (5.83Tg CO2-eyr(-1)) and Australian agricultural soils (0.4Tg CO2-eyr(-1)). These amount to underestimates for CO2 emissions of approximate to 10% from combined C pools in Australia (year=2000), approximate to 5% from Australian Rangelands and approximate to 3% of Australian Agricultural Soils by Kyoto Accounting. Northern hemisphere countries with greater dust emission than Australia are also likely to have much larger SOC dust emission. Therefore, omission of SOC dust emission likely represents a considerable underestimate from those nations' C accounts. We suggest that the omission of SOC dust emission from C cycling and C accounting is a significant global source of uncertainty. Tracing the fate of wind-eroded SOC in the dust cycle is therefore essential to quantify the release of CO2 from SOC dust to the atmosphere and the contribution of SOC deposition to downwind C sinks.
[本文引用: 1]
[本文引用: 1]
[本文引用: 1]
[本文引用: 1]
[本文引用: 3]
[本文引用: 2]
[本文引用: 2]
[本文引用: 1]
[本文引用: 2]
[本文引用: 2]
[本文引用: 1]
[本文引用: 1]
[本文引用: 1]
[本文引用: 1]
[本文引用: 1]
DOI:10.1002/jame.20026Magsci [本文引用: 1]
A comprehensive 30x30 arc-second resolution gridded soil characteristics data set of China has been developed for use in the land surface modeling. It includes physical and chemical attributes of soils derived from 8979 soil profiles and the Soil Map of China (1:1,000,000). We used the polygon linkage method to derive the spatial distribution of soil properties. The profile attribute database and soil map are linked under the framework of the Genetic Soil Classification of China which avoids uncertainty in taxon referencing. Quality control information (i.e., sample size, soil classification level, linkage level, search radius and texture) is included to provide confidence information for the derived soil parameters. The data set includes 28 attributes for 8 vertical layers at the spatial resolution of 30x30 arc-seconds. Based on this data set, the estimated storage of soil organic carbon in the upper 1 m of soil is 72.5 Pg, total N is 6.6 Pg, total P is 4.5 Pg, total K is 169.9 Pg, alkali-hydrolysable N is 0.55 Pg, available P is 0.03 Pg, and available K is 0.61 Pg. These estimates are reasonable compared with previous studies. The distributions of soil properties are consistent with common knowledge of Chinese soil scientists and the spatial variations over large areas are well represented. The data set can be incorporated into land models to better represent the role of soils in hydrological and biogeochemical cycles in China.
DOI:10.1016/j.atmosenv.2005.12.043Magsci [本文引用: 1]
<h2 class="secHeading" id="section_abstract">Abstract</h2><p id="">A comprehensive model evaluation has been conducted for MM5-CMAQ for the period of 1–10 July 1999 of the Southern Oxidants Study episode with a coarse-grid horizontal spacing of 32-km and a nested fine-grid spacing of 8-km. Meteorological and chemical predictions from simulations with both grids are compared with observations from both routine monitoring networks (e.g., CASTNet, IMPROVE, and AIRS-AQS) and special studies (e.g., SOS99/SOS99NASH, SEARCH, and ARIES). In this Part I paper, five simulated meteorological variables (i.e., temperature, relative humidity (RH), wind speed, wind direction, and planetary boundary layer (PBL) height) are evaluated. While MM5 reproduces well the diurnal variations for temperature and RH, and the minimum temperatures at all sites, it tends to overpredict maximum temperatures and underpredict both maximum and minimum RHs on most days at most sites. MM5 predictions agree reasonably well for wind speeds but poorly for wind direction and the maximum mixing depths. The significant overpredictions in the PBL heights can be attributed to the positive biases of the maximum 2-m temperatures and to the Medium Range Forecast (MRF) model PBL scheme and the Oregon State University (OSU)-Land Surface Model used in the MM5 simulations. For wind speed/direction and the <em>U</em>- and <em>V</em>-component of the wind speed, the normalized mean bias (NMB) and the normalized mean bias factor (NMBF) are the most robust statistical measures because of the dominance of the extremely small observed values in the normalization for those variables.</p>
[本文引用: 1]
[本文引用: 1]
[本文引用: 1]
[本文引用: 1]
[本文引用: 1]
[本文引用: 1]
[本文引用: 1]
[本文引用: 1]
[本文引用: 2]
DOI:10.1007/s40333-013-0198-3Magsci [本文引用: 1]
The Ulanbuh Desert borders the upper reach of the Yellow River. Every year, a mass of aeolian sand is blown into the Yellow River by the prevailing wind and the coarse aeolian sand results in serious silting in the Yellow River. To estimate the quantity of aeolian sediments from the Ulanbuh Desert blown into the Yellow River, we simulated the saltation processes of aeolian sediments in the Ulanbuh Desert. Then we used a saltation submodel of the IWEMS (Integrated Wind-Erosion Modeling System) and its accompanying RS (Remote Sensing) and GIS (Geographic Information System) modules to estimate the quantity of saltation sediments blown into the Yellow River from the Ulanbuh Desert. We calibrated the saltation submodel by the synchronous observation to wind velocity and saltation sediments on several points with different vegetation cover. The vegetation cover, frontal area of vegetation, roughness length, and threshold friction velocity in various regions of the Ulanbuh Desert were obtained using NDVI (Normalized Difference Vegetation Index) data, measured sand-particle sizes, and empirical relationships among vegetation cover, sand-particle diameters, and wind velocity. Using these variables along with the observed wind velocities and saltation sediments for the observed points, the saltation model was validated. The model results were shown to be satisfactory (RMSE less than 0.05 and |R-e| less than 17%). In this study, a subdaily wind-velocity program, WINDGEN, was developed using this model to simulate hourly wind velocities around the Ulanbuh Desert. By incorporating simulated hourly wind-velocity and wind-direction data, the quantity of saltation sediments blown into the Yellow River was calculated with the saltation submodel. The annual quantity of aeolian sediments blown into the Yellow River from the Ulanbuh Desert was 5.56x10(6) t from 2001 to 2010, most of which occurred in spring (from March to May); for example, 6.54x10(5) tons of aeolian sand were blown into the Yellow River on 25 April, 2010. However, in summer and winter, the saltation process occasionally occurred. This research has supplied some references to prevent blown sand hazards and silting in the Yellow River.
[本文引用: 2]
DOI:10.1016/j.atmosenv.2010.10.020Magsci [本文引用: 1]
The northeast Asian dust process during the spring seasons in the years 1982-2006 was simulated by the Integrated Wind Erosion Modeling System (IWEMS). The influence of Arctic Oscillation (AO) on dust activities was investigated by analyzing surface observations and model simulations. There is a significant relationship between AO and dust activity; a positive AO phase is associated with decreased (increased) dust storm frequency in Mongolia (Taklimakan Desert) and enhanced anticyclonic (southeastward) dust transport over northwestern China (North China). The AO-dust relation is mainly due to changes in the westerly jet and geopotential height in the middle troposphere; a positive AO phase induces a northward shift of the polar jet, an intensified westerly jet over northern Tibetan Plateau, and a positive geopotential height anomaly over Mongolia. The northern shift of the polar jet reduces the frequency of intense cyclones in Mongolia, thereby causing a decrease in the dust storm frequency. The intensified westerly jet stream over the northern Tibetan Plateau increases the dust storm frequency in the Taklimakan Desert. The positive geopotential height anomaly over Mongolia initiates an anticyclonic dust transport anomaly in the middle troposphere over northwestern China. It also induces a southeastward dust transport anomaly over North China. The reverse situations are true for a negative AO phase. (C) 2010 Elsevier Ltd. All rights reserved.
[本文引用: 1]
[本文引用: 1]
[本文引用: 1]
[本文引用: 1]
[本文引用: 1]
[本文引用: 1]
[本文引用: 1]
[本文引用: 1]
[本文引用: 1]
[本文引用: 1]
[本文引用: 1]
[本文引用: 1]
[本文引用: 1]
[本文引用: 1]
