关键词:蒙特卡洛;大叶模型;Farquhar光合模型;净生态系统交换 Abstract We developed a method, namely Adaptive Population Monte Carlo Approximate Bayesian Computation (APMC), to estimate the parameters of Farquhar photosynthesis model. Treating the canopy as a big leaf, we applied this method to derive the parameters at canopy scale. Validations against observational data showed that parameters estimated based on the APMC optimization are un-biased for predicting the photosynthesis rate. We conclude that APMC has greater advantages in estimating the model parameters than those of the conventional nonlinear regression models.
Keywords:Monte Carlo;big-leaf model;Farquhar photosynthesis model;net ecosystem exchange -->0 PDF (2180KB)元数据多维度评价相关文章收藏文章 本文引用格式导出EndNoteRisBibtex收藏本文--> 曾继业, 谭正洪, 三枝信子. 近似贝叶斯法在光合模型参数估计中的应用. 植物生态学报, 2017, 41(3): 378-385 https://doi.org/10.17521/cjpe.2016.0067 ZENGJi-Ye, TANZheng-Hong, SAIGUSANobuko. Using approximate Bayesian computation to infer photosynthesis model parameters. Chinese Journal of Plant Ecology, 2017, 41(3): 378-385 https://doi.org/10.17521/cjpe.2016.0067 光合作用利用光能进行水的光解, 释放O2, 同化大气中的CO2, 形成有机物, 是生态系统生产力形成的基础, 也是能量流动和物质循环的起点。准确模拟光合作用具有重要的科学意义和应用价值。在20世纪80年代初期, 随着Farquhar光合作用生化过程机理模型的提出, 这项工作有了长足的进展(Farquhar et al., 1980)。现今, Farquhar光合模型有了非常广泛的应用, 已成为叶片尺度光合作用模拟的主流机理模型。驱动模型运行的一些气象因子, 比如辐射、温度和湿度等, 在具体应用中容易获得。模型应用的一个难点是生理参数的确定, 特别是最大羧化速率(Vcmax)和最大电子传输速率(Jmax)的确定。众所周知, 生理参数Vcmax、Jmax在不同物种间差异很大, 同一个物种在不同季节间的变化也很显著(Xu & Baldocchi, 2003), 想要获得这些参数并将其应用到区域或者全球尺度的研究中, 难度很大。模型应用的另一难点在于尺度的扩展, Farquhar光合模型是叶片尺度的模型, 若想将该模型运用到冠层或者更大尺度的研究中, 需要进行合理的尺度转换(Jarvis, 1995), 而这种尺度转换是生态学研究中尚未解决的问题(Amthor, 1994)。以热带森林为例, 测定数以百计的树种的Vcmax和Jmax, 即使不考虑人力物力上的巨大投入, 如何将测定结果组织起来, 以便可以代表整个冠层, 目前还未找到合适的方案(Sprintsin et al., 2012; Cubasch et al., 2013)。因此, 亟需寻找到一种合理的尺度扩展方案, 作为独立的、可靠的验证标准, 冠层尺度的Vcmax和Jmax直接实测值是必不可少的。 涡度相关技术(eddy covariance technique)作为目前直接测定地表-大气间CO2和水热通量的标准方法, 为原位、无破坏监测生态系统的光合作用(实质上植被大气之间的CO2交换)提供了新的选择(de Pury & Farquhar, 1997; Wang & Leuning, 1998; Dai et al., 2004; Groenendijk et al., 2011; Kosugi et al., 2013)。在过去的30余年里, 该方法有了快速的发展, 得到了广泛的应用, 目前已成为国际通量观测网络(FLUXNET)的主要技术手段。据不完全统计, 目前全球安装涡度相关监测系统的研究站已经超过5 000个, 仅中国就超过了300个。考虑到涡度相关法可以提供冠层光合作用的实测值, 而叶片尺度的光合模型也很明确, 笔者认为可以在叶片光合模型的基础上提出一种算法, 直接反演出Vcmax和Jmax这两个重要的生理参数在冠层上的数值。如果这一想法能够实现, 我们就有可能从生理学角度切入, 对大量冠层尺度的监测数据进行更深入的解读和挖掘。作为一个初步的尝试, 为了简化模型的数据和计算, 本文通过将冠层抽象为一片大叶, 提出了一种相对简洁却行之有效的方法来反演冠层的生理参数。下文中, 笔者将对该方法的技术细节进行分解, 希望该方法能引起读者的兴趣, 在读者的批评中获得进一步提高和完善。
基于将冠层视为一片大叶的思维抽象, 叶片尺度的光合模型便得以直接应用于冠层之上, 简称大叶模型。本文采用了Farquhar模型来模拟冠层尺度的光合作用, 同时采用Ball-Berry模型来模拟气孔导度关系(Ball et al., 1987)。具体使用到的关系式见表1; 各缩写和符号代表的含义和参数初值见表2。模型细节请参考Medlyn等(2002a), von Caemmerer等(2009)和Damour等(2010)的文献。
1.3 APMC算法的具体运行
首先我们假设大叶模型的叶面CO2分压(Cs)、 胞内氧分压(Oi)、 叶面相对湿度(hs)可以用环境空气的实测值近似代替(附录I)。之所以做出如此假设, 是因为: 一方面, 我们无法知道哪些叶片的Cs、 Oi、 hs值能代表整个冠层; 另一方面, 从大多数过程模型使用的边界层导度模块来看, 这些参数值在叶片表层与大气之间相差不会太大。但是, 胞间CO2浓度(Ci)是个例外, 它是整个模型运行的一个关键, 不能直接假定其与环境CO2浓度相等。用来估计Ci的方法主要有两种, 一种方法是通过迭代得到, 另一种方法是用Baldocchi (1994)提出的3次方程解。虽然Baldocchi (1994)、Yin和Struik (2009)等都认为3次方程解适用于正向模拟的绝大多数情况, 但我们的实践表明它不适用于逆向参数估计, 因为逆向模拟时,参数值变化范围可能很大, 因此本文最终采用了迭代法。我们在实践中还发现, 大多数情况下只需要低于10次的迭代就可得到稳态的Ci解。 表1中的方程(10)是控制光合速率的关键方程。它实际上是在Arrhenius方程(9)基础上引入了 $$f(S,H)=\frac{1+e^{(298S-H)/(298R)}}{ 1+e^{(TK\times S-H)/(TK\times R)}}$$ 进行温度修正, 使得Vcmax、Jmax在高温下减小。正如图1所示, 修正曲线对某些范围内的参数S和H的变化很敏感。作为实例, 我们仅把von Caemmerer等(2009)温度修正模型中的S值增加约10%, 就使修正曲线系数的变化区间由(0.0, 1.1)扩大到(0.0, 420), 并在0 ℃附近开始急剧下降。这种敏感性对于正向模拟不构成问题, 因为参数调试时可以根据经验, 不断缩小范围逐步进行调整。而在逆向模拟参数反演时, 参数调试依据的是规则而非经验, 这种敏感性会导致非优化解。针对这一问题, Medlyn等(2002b)的处理方法是固定H的值, 通过详细的分析和探索, 我们建立了一个温度修正方程, 可以避免参数反演时数值不稳定性, 同时得到优化的反演参数。这个新的温度修正曲线表达如下: $$f{C_m,T_m}=\frac{1+e^{-C_mT_m}}{1+e^{C_m\times (TC-T_m)}}$$ 事实上, Seller等(1996)也用了类似的方程来修正Rubisco的活化能。新的温度修正曲线与June等(2004)提出的简易温度修正的不同之处是, 新修正曲线可以很好地拟合f(S, H), 且修正系数的变化范围小, 避免了一些数值计算问题(图1)。并且, 我们可以比较直观地选择Cm和Tm的可变范围。实际上, 对任意正的Cm、Tm和TC, f(Cm, Tm)的变化只限于(0, 1)区间。 显示原图|下载原图ZIP|生成PPT 图1温度修正模型比较。实线: von Caemmerer等(2009)的曲线(S = 710, H = 220 000), 点线: 增加S约10%的曲线(S = 790, H = 220 000), 虚线: 本文用的曲线(Cm = 0.3, Tm = 37)。 -->Fig. 1Comparison of the temperature correction models. Solid line is the curve of von Caemmerer et al. (2009) when S = 710 and H = 220 000; dotted line is the curve when S is increased by 10% (S=790, H=220 000); dashed line is the curve calculated according to our new response curve (Cm = 0.3, Tm = 37). -->
我们用了一万个蒙特卡洛粒子做模拟实验, 并设Na = 100, 即每次循环计算都接受10β000粒子中最好的100个。从验证方法的角度出发, 我们不打算讨论这100粒子的参数值的统计分布, 而只比较由最佳粒子的参数值产生的NEE与观测值之间的差距。 拟合得到的方程参数如表3所示。用APMC方法估计的参数值全部落在参数值的上下限范围内, 这表明从植物生理学含义的角度看, 这个模拟结果是可以接受的。需要注意的是, 因为我们用了不同的温度修正方程, 得到的表1中方程(11)的Vopt和Jopt的意义与表1中方程(10)的V25和J25的意义是不一样的。仿效Medlyn等(2002b), 我们把方程(11)叫做速率峰值方程。 Table 1 表1 表1光合作用机理模型的基本方程(含气孔模型) Table 1Algorithms for photosynthesis biochemical model at canopy level
新窗口打开 Table 2 表2 表2模型的变量、参数及其参考值(主要参考Caemmerer等(2009)) Table 2Variables and parameters used in the photosynthesis model and their reference values mainly from Caemmerer et al. (2009)
符号 Symbol
单位 Units
注释 Remark
参考值 Reference value
A
μmol·m-2·s-1
净光合速率 Net photosynthesis rate
Ac
μmol·m-2·s-1
Rubisco酶限制下的光合速率 Rubisco activity limited net photosynthesis rate
Aj
μmol·m-2·s-1
RuBP再生限制的光合速率 Electron transport limited net photosynthesis rate
Rd
μmol·m-2·s-1
呼吸速率 Respiration rate
Ci
μbar
胞内CO2分压 Intercellular CO2 partial pressure
Ca
μbar
大气CO2分压 Air CO2 partial pressure
Cs
μbar
叶面CO2分压 Leaf-surface CO2 partial pressure
Γ*
μbar
CO2补偿点 CO2 compensation point
Vcmax
μmol·m-2·s-1
最大羧化速率 Maximal rubisco carboxylase rate
Jmax
μmol·m-2·s-1
最大电子传输速率 Maximal electronic transport rate
J
μmol·m-2·s-1
电子传输速率 Electronic transport rate
I2
μmol·m-2·s-1
电子传输速率 Electronic transport rate through photosystem II
I0
μmol·m-2·s-1
光照强度 Photon flux density
f
光谱校正常数 Fraction of effective photon flux
0.15
α
转化率 Conversion efficiency
0.15
Oi
mbar
胞内氧分压 Intercellular O2 partial pressure
210
Ko
mbar
氧化酶的动力学常数 Michaelis-Menten constant of Rubisco for O2
Kc
μbar
羧化酶的动力学常数 Michaelis-Menten constant of Rubisco for CO2
gb
mol·m-2·s-1
边界层导度 Boundary-layer conductance
gs
mol·m-2·s-1
气孔导度 Stomatal conductance
g0
mol·m-2·s-1
气孔最小导度 Minimum stomatal conductance
0.01
g1
气孔导度常数 Sensitivity coefficient of stomatal conductance
Abbreviations see Table 2.缩写同表2。 新窗口打开 显示原图|下载原图ZIP|生成PPT 图2净生态系统CO2交换(NEE)模拟结果(实线)与观测值(符号)的比较。图中实线为1:1线。 -->Fig. 2Relationship between modeled and observed net ecosystem exchange (NEE). The solid line indicates that model outputs equal observations. -->
对每一个APMC粒子 For all particles for k = 1 to Nobs do(对所有的观测数据) For all observations 用APMC粒子选定的V25, J25,Rd25, g1, Ea, Cm, Tm Use parameter values selected by AMPC 计算Vcmax, Jmax,Rd, gb Estimate target model parameters 设t = 1 (Ci的迭代计算次数) At initial time 设\(C_i^0=0.7C_a\) Set the intercellular CO2 equal to 70% of air CO2 设\(\Delta C_i >1\) Set the intercellular CO2 not in equilibrant While \(\Delta C_i >1 \) do 计算 Ac, Aj Compute the two rate. 计算\(A=\frac{A_c+A_j-\sqrt{(A_c+A_j)^2-4\times 0.98A_cA_j}}{2\times 0.98} \\ Compute the joint rate 计算\\ C_i^t=C_a-\frac{A}{g_b}-\frac{g_bC_aA-A^2}{g_bg_1h_sA-g_0A+g_0Ag_bg_oC_a}\) Compute the intercellular CO2 \( \Delta C_i=|C_i^t-C_i^{t-1}|\) Check equilibrant state 设t = t + 1 Advance time end while end for 将|A-NEE|的平均值作为APMC粒子的r Calculate the difference between modeled photosynthesis rate and the observed rate
新窗口打开 致谢 感谢日本的苫小牧观测站提供观测数据。 The authors have declared that no competing interests exist.
AmthorJS (1994). Scaling CO2-photosynthesis relationships from the leaf to the canopy. Photosynthesis Research, 39, 321-350. [本文引用: 1]
[2]
AndrieuC, DoucetA, HolensteinR (2010). Particle Markov chain Monte Carlo methods. Journal of the Royal Statistical Society, Series B, 72, 269-342. [本文引用: 1]
[3]
BaldocchiD (1994). An analytical solution for coupled leaf photosynthesis and stomata1 conductance models. Tree Physiology, 14, 1069-1079. [本文引用: 1]
[4]
BallJT, WoodrowJT, BerryJA (1987). A model predicting stomatal conductance and its contribution to the control of photosynthesis under different environmental conditions. In: Biggins J ed. Progress in Photosynthesis Research, Vol. 4. Proceedings of the 7th International Congress on Photosynthesis. Matins Nijhoff, Dordrecht, the Netherlands. 221-224. [本文引用: 1]
[5]
BeaumontMA (2010). Approximate Bayesian computation in evolution and ecology. Annual Review of Ecology, Evolution, and Systematics, 41, 379-406. [本文引用: 1]
[6]
CsilléryK, BlumMGB, GaggiottiOE, FrancoisO (2010). Approximate Bayesian Computation (ABC) in practice. Trends in Ecology and Evolution, 25, 410-418. [本文引用: 1]
[7]
CubaschU, WuebblesD, ChenD, FacchiniMC, FrameD, MahowaldN, WintherJG (2013). Introduction. In: Stocker TF, Qin D, Plattner GK, Tignor M, Allen SK, Boschung J, Nauels A, Xia Y, Bex V, Midgley PM eds. Climate Change 2013: The Physical Science Basis. Cambridge University Press, Cambridge, UK. [本文引用: 1]
[8]
DaiY, DickinsonRE, WangYP (2004). A Two-Big-Leaf Model for canopy temperature, photosynthesis, and stomatal conductance. Journal of Climate, 17, 2281-2299. [本文引用: 1]
[9]
DamourG, SimonneauT, CochardH, UrbanL (2010). An overview of models of stomatal conductance at the leaf level. Plant, Cell & Environment, 33, 1419-1438.
[10]
de PuryDGG, FarquharGD (1997). Simple scaling of photosynthesis from leaves to canopies without the errors of big-leaf models. Plant, Cell & Environment, 20, 537-557. [本文引用: 1]
[11]
FarquharGD, von CaemmererS, BerryJA (1980). A biochemical model of photosynthetic CO2 assimilation in leaves of C3 species. Planta, 149, 78-90. [本文引用: 1]
[12]
GaoM, ZhangH (2012). Sequential Monte Carlo methods for parameter estimation in nonlinear state-space models. Computers and Geosciences, 44, 70-77. [本文引用: 1]
[13]
GroenendijkM, DolmanAJ, AmmannC, ArnethA, CescattiA, DragoniD, GashJHC, GianelleD, GioliB, KielyG, KnohlA, LawBE, LundM, MarcollaB, van der MolenMK, MontagnaniL, MoorsE, RichardsonAD, RoupsardO, VerbeeckH, WohlfahrtG (2011). Seasonal variation of photosynthetic model parameters and leaf area index from global Fluxnet eddy covariance data. Journal of Geoph¬ysical Research, 116, G04027. doi:10.1029/2011JG001742. [本文引用: 1]
[14]
GuL (2010). Reliable estimation of biochemical parameters from C3 leaf photosynthesis-intercellular carbon dioxide response curves. Plant, Cell & Environment, 33, 1852-1874. [本文引用: 1]
HiranoT, HirataR, FujinumaY, SaigusaN, YamamotoS, HarazonoY, TakadaM, InukaiK, InoueG (2003). CO2 and water vapor exchange of a larch forest in northern Japan. Tellus, 55B, 244-257. [本文引用: 1]
JuneT, EvansJR, FarquharGD (2004). A simple new equation for the reversible temperature dependence of photosynthetic electron transport: A study on soybean leaf. Functional Plant Biology, 31, 275-283.
[19]
KosugiY, TakanashiS, UeyamaM, OhkuboS, TanakaH, MatsumotoK, YoshifujiN, AtakaM, SakabeA (2013). Determination of the gas exchange phenology in an evergreen coniferous forest from 7 years of eddy covariance flux data using an extended big-leaf analysis. Ecological Research, 28, 373-385. [本文引用: 1]
MacEachernSN, ClydeM, LiuJ (1999). Sequential importance sampling for nonparametric Bayes models: The next generation. Canadian Journal of Statistics, 27, 251-267. [本文引用: 1]
MedlynBE, DreyerE, EllsworthD, ForstreuterM, HarleyPC, KirschbaumMUF, Le RouxX, MontpiedP, StrassemeyerJ, WalcroftA, WangK, LoustauD (2002a). Temperature response of parameters of a biochemically based model of photosynthesis. II. A review of experimental data. Plant, Cell & Environment, 25, 1167-1179. [本文引用: 1]
[24]
MedlynBE, LoustauD, DelzonS (2002b). Temperature response of parameters of a biochemically based model of photosynthesis. I. Seasonal changes in mature maritime pine (Pinus pinaster Ait.). Plant, Cell & Environment, 25, 1155-1165. [本文引用: 1]
[25]
SaigusaN, YamamotoS, HirataR, OhtaniY, IdeR, AsanumaJ, GamoM, HiranoT, KondoH, KosugiY, LiS-G, NakaiY, TakagiK, TaniM, WangH (2008). Temporal and spatial variations in the seasonal patterns of CO2 flux in boreal, temperate, and tropical forests in East Asia. Agricultural and Forest Meteorology, 148, 700-713.
[26]
SellersPJ, RandallDA, CollatzGJ, BerryJA, FieldCB, DazlichDA, ZhangC, ColleloGD, BounouaL (1996). A revised land surface parameterization (SiB2) for atmospheric GCMs. Part 1: Model formulation. Journal of Climate, 9, 676-705. [本文引用: 1]
[27]
SprintsinM, ChenJM, DesaiA, GoughCM (2012). Evaluation of leaf-to-canopy upscaling methodologies against carbon flux data in North America. Journal of Geophysical Research, 117, G01023. doi:10.1029/2010JG001407. [本文引用: 1]
[28]
ToniT, WelchD, StrelkowaN, IpsenA, StumpfMPH (2009). Approximate Bayesian computation scheme for parameter inference and model selection in dynamical systems. Journal of the Royal Society Interface, 6, 187-202. [本文引用: 1]
[29]
von CaemmererS, FarquharG, BerryJ (2009). Biochemical model of C3 photosynthesis. In: Laisk A, Nedbal L, Govindjee eds. Photosynthesis in Silico: Understanding Complexity from Molecules to Ecosystems. Springer, Dordrecht, the Netherlands. 209-230. [本文引用: 3]
[30]
VrugtJA, SadeghM (2013). Toward diagnostic model calibration and evaluation: Approximate Bayesian computation. Water Resources Research, 49, 4335-4345. [本文引用: 1]
[31]
WangH, SaigusaN, YamamotoS, KondoH, HiranoT, ToriyamaA, FujinumaF (2004). Net ecosystem CO2 exchange over a larch forest in Hokkaido, Japan. Atmospheric Environment, 38, 7021-7032.
[32]
WangYP, LeuningR (1998). A two-leaf model for canopy conductance, photosynthesis and partitioning of available energy I: Model description and comparison with a multi- layered model. Agricultural and Forest Meteorology, 91, 89-111. [本文引用: 1]
[33]
XuL, BaldocchiDD (2003). Seasonal trends in photosynthetic parameters and stomatal conductance of blue oak (Quercus douglasii) under prolonged summer drought and high temperature. Tree Physiology, 23, 865-877. [本文引用: 1]
[34]
YinX, StruikPC (2009). C3 and C4 photosynthesis models: An overview from the perspective of crop modelling. Wageningen Journal of Life Sciences, 57, 27-38.
Scaling CO2-photosynthesis relationships from the leaf to the canopy. 1 1994
A simple new equation for the reversible temperature dependence of photosynthetic electron transport: A study on soybean leaf. 2004
Determination of the gas exchange phenology in an evergreen coniferous forest from 7 years of eddy covariance flux data using an extended big-leaf analysis. 1 2013
... 涡度相关技术(eddy covariance technique)作为目前直接测定地表-大气间CO2和水热通量的标准方法, 为原位、无破坏监测生态系统的光合作用(实质上植被大气之间的CO2交换)提供了新的选择(de Pury & Farquhar, 1997; Wang & Leuning, 1998; Dai et al., 2004; Groenendijk et al., 2011; Kosugi et al., 2013).在过去的30余年里, 该方法有了快速的发展, 得到了广泛的应用, 目前已成为国际通量观测网络(FLUXNET)的主要技术手段.据不完全统计, 目前全球安装涡度相关监测系统的研究站已经超过5 000个, 仅中国就超过了300个.考虑到涡度相关法可以提供冠层光合作用的实测值, 而叶片尺度的光合模型也很明确, 笔者认为可以在叶片光合模型的基础上提出一种算法, 直接反演出Vcmax和Jmax这两个重要的生理参数在冠层上的数值.如果这一想法能够实现, 我们就有可能从生理学角度切入, 对大量冠层尺度的监测数据进行更深入的解读和挖掘.作为一个初步的尝试, 为了简化模型的数据和计算, 本文通过将冠层抽象为一片大叶, 提出了一种相对简洁却行之有效的方法来反演冠层的生理参数.下文中, 笔者将对该方法的技术细节进行分解, 希望该方法能引起读者的兴趣, 在读者的批评中获得进一步提高和完善. ...
Adaptive approximate Bayesian computation for complex models. 2013
Sequential importance sampling for nonparametric Bayes models: The next generation. 1 1999
... 其中, p(y|θ)为似然函数(likelihood function), p(y)为边缘似然函数(marginal likelihood function).当似然函数和边缘似然函数易得, 或可以通过某种近似法, 诸如马尔可夫链蒙特卡洛法(Markov chain Monte Carlo, Andrieu et al., 2010)、重点取样法(importance sampling, MacEachern et al., 1999)以及序贯蒙特卡洛法(sequential Monte Carlo, Gao & Zhang, 2012)等算出时, 这些方法便可用来求解待定参数的后验分布.然而对复杂的非线性多参数模型而言, 似然函数往往不可知, 或者计算边缘似然函数有困难.在此背景下, 近似贝叶斯计算法(Approximate Bayesian Computation)应运而生(Toni et al., 2009; Beaumont, 2010; Marin et al., 2012), 并被广泛应用(Csilléry et al., 2010; Vrugt & Sadegh, 2013; Hartig et al., 2014).在此, 我们介绍如何应用Lenormand等(2013) 提出的自调近似贝叶斯计算法(APMC)来估计植物光合模型的几个重要参数. ...
b). Temperature response of parameters of a biochemically based model of photosynthesis. I. Seasonal changes in mature maritime pine (Pinus pinaster Ait.). Plant, 1 2002
... 温度修正模型比较.实线: von Caemmerer等(2009)的曲线(S = 710, H = 220 000), 点线: 增加S约10%的曲线(S = 790, H = 220 000), 虚线: 本文用的曲线(Cm = 0.3, Tm = 37). ...
... Variables and parameters used in the photosynthesis model and their reference values mainly from Caemmerer et al. (2009) ...
Toward diagnostic model calibration and evaluation: Approximate Bayesian computation. 1 2013
... 其中, p(y|θ)为似然函数(likelihood function), p(y)为边缘似然函数(marginal likelihood function).当似然函数和边缘似然函数易得, 或可以通过某种近似法, 诸如马尔可夫链蒙特卡洛法(Markov chain Monte Carlo, Andrieu et al., 2010)、重点取样法(importance sampling, MacEachern et al., 1999)以及序贯蒙特卡洛法(sequential Monte Carlo, Gao & Zhang, 2012)等算出时, 这些方法便可用来求解待定参数的后验分布.然而对复杂的非线性多参数模型而言, 似然函数往往不可知, 或者计算边缘似然函数有困难.在此背景下, 近似贝叶斯计算法(Approximate Bayesian Computation)应运而生(Toni et al., 2009; Beaumont, 2010; Marin et al., 2012), 并被广泛应用(Csilléry et al., 2010; Vrugt & Sadegh, 2013; Hartig et al., 2014).在此, 我们介绍如何应用Lenormand等(2013) 提出的自调近似贝叶斯计算法(APMC)来估计植物光合模型的几个重要参数. ...
Net ecosystem CO2 exchange over a larch forest in Hokkaido, Japan. 2004
A two-leaf model for canopy conductance, photosynthesis and partitioning of available energy I: Model description and comparison with a multi- layered model. 1 1998
... 涡度相关技术(eddy covariance technique)作为目前直接测定地表-大气间CO2和水热通量的标准方法, 为原位、无破坏监测生态系统的光合作用(实质上植被大气之间的CO2交换)提供了新的选择(de Pury & Farquhar, 1997; Wang & Leuning, 1998; Dai et al., 2004; Groenendijk et al., 2011; Kosugi et al., 2013).在过去的30余年里, 该方法有了快速的发展, 得到了广泛的应用, 目前已成为国际通量观测网络(FLUXNET)的主要技术手段.据不完全统计, 目前全球安装涡度相关监测系统的研究站已经超过5 000个, 仅中国就超过了300个.考虑到涡度相关法可以提供冠层光合作用的实测值, 而叶片尺度的光合模型也很明确, 笔者认为可以在叶片光合模型的基础上提出一种算法, 直接反演出Vcmax和Jmax这两个重要的生理参数在冠层上的数值.如果这一想法能够实现, 我们就有可能从生理学角度切入, 对大量冠层尺度的监测数据进行更深入的解读和挖掘.作为一个初步的尝试, 为了简化模型的数据和计算, 本文通过将冠层抽象为一片大叶, 提出了一种相对简洁却行之有效的方法来反演冠层的生理参数.下文中, 笔者将对该方法的技术细节进行分解, 希望该方法能引起读者的兴趣, 在读者的批评中获得进一步提高和完善. ...
Seasonal trends in photosynthetic parameters and stomatal conductance of blue oak (Quercus douglasii) under prolonged summer drought and high temperature. 1 2003
 , 三枝信子
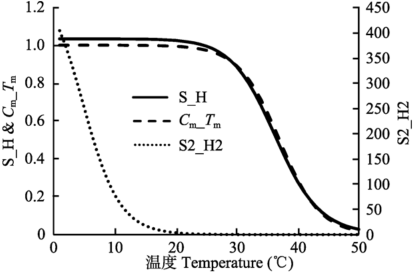 显示原图|下载原图ZIP|生成PPT
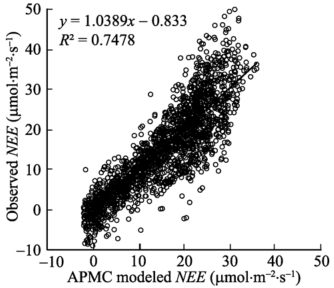 显示原图|下载原图ZIP|生成PPT
