HTML
--> --> -->Interannual meridional displacement of the EAJ shows a close relationship with the summer precipitation over China, Japan, and the Korean Peninsula, and has been demonstrated by many previous studies (Liang and Wang, 1998; Lau et al., 2000; Lu, 2004; Kuang and Zhang, 2006; Xuan et al., 2011; Li and Lu, 2017, 2018). Specifically, an equatorward-shifted EAJ is significantly related to positive rainfall anomalies along the East Asian summer rainband, and vice versa. This relationship can be considered as typical impacts of extratropical circulation anomalies on East Asian rainfall in summer. Therefore, research on this EAJ–rainfall interannual relationship is crucial to understanding the precipitation variability, which closely relates to extreme climate events such as droughts and floods in East Asia. In this study, we focus on the EAJ–rainfall relationship, although the East Asian summer rainfall is also modulated by many other factors, such as the western North Pacific subtropical high (Tao and Chen, 1987; Chang et al., 2000; Wang et al., 2001; Lu et al., 2016) and South Asian high (Zhang et al., 2002; Huang and Qian, 2004; He et al., 2006; Wei et al., 2012, 2014).
The outputs from CMIP5 CGCMs (state-of-the-art global climate models from phase 5 of the Coupled Model Intercomparison Project) have been widely used to investigate the EAJ and East Asian summer rainfall (e.g., Huang et al., 2013; Sperber et al., 2013; Chen and Bordoni, 2014; Feng et al., 2014; Kusunoki and Arakawa, 2015; Ma et al., 2015; Qu, 2017; Ren et al., 2017; Lin et al., 2019). It has been well documented that multimodel ensemble mean (MME) results of CMIP5 models can reasonably simulate the climatological and interannual features of the EAJ and precipitation in East Asia. On the one hand, CMIP5 models show certain capacities to simulate the climatological characteristics of the EAJ, and the MME simulations agree well with observations in terms of the EAJ locations and vertical structures (Dai and Lu, 2013; Ma et al., 2015). On the other hand, despite some intermodel spreads for the individual models, the MME simulation of the CMIP5 models can capture the basic features of the present-day interannual variability of the EAJ. The spatial distribution of the interannual standard deviation of the upper-tropospheric zonal winds is similar to the observations over East Asia (Dai and Lu, 2013; Ren et al., 2017).
The CMIP5 models can also basically reproduce the large-scale spatial pattern of summer precipitation in East Asia. The simulation of precipitation in East Asia by the CMIP5 models has been generally improved in comparison with the CMIP3 models, although the simulated precipitation is still weaker than observations (Sperber et al., 2013; Song and Zhou, 2014; Kusunoki and Arakawa, 2015). On the other hand, the interannual variation intensity in East Asian summer precipitation is close to the observations in CMIP5 models. The CMIP5 models have an improved reproducibility with respect to the intensity of interannual variability in East Asian rainfall (Dai and Lu, 2013; Ren et al., 2017), while the CMIP3 models tend to underestimate the interannual variability in precipitation over East Asia (Lu and Fu, 2010).
There have been some studies on the interannual relationship between the EAJ and East Asian rainfall, which is also the main concern of this study. Based on the output from one climate model, Yan et al. (2014) showed a weak reproducibility for the connection of the EAJ meridional displacement with East Asian precipitation. Compared to observations, the simulation showed weak precipitation anomalies associated with the EAJ meridional displacement, especially to the south of Japan, and also showed improperly simulated EAJ-related large-scale circulation. In contrast, after assessing the simulations of 12 CGCMs from CMIP3, Lu and Fu (2010) revealed that the MME results basically reproduce the interannual relationship of the East Asian summer rainfall with the EAJ meridional displacement, although the simulated precipitation anomalies are relatively weaker in East Asia and the western North Pacific (WNP) in comparison with observations. All the models capture the positive correlation between them, but the interannual correlation coefficients simulated by the individual models are quite divergent, ranging from 0.13 to 0.72. Furthermore, compared to the CMIP3 models, Ren et al. (2017) suggested that the MME simulations of CMIP5 models show similar reproducibility and can reproduce the observed interannual relationship, but also with the correlation coef?cients ranging from 0.27 to 0.76 by using 19 CGCMs, exhibiting significant diversities among the models. These studies indicate that the simulations of the relationship do not achieve consistent performances and still have great uncertainties among the individual models. Therefore, in this study, we focus on the intermodel discrepancies in the EAJ–rainfall relationship and the possible factors allied to such discrepancies.
In this study, we use historical simulations based on 34 CMIP5 CGCMs, and evaluate some important issues, including: (1) the dominant modes of the EAJ interannual variation; (2) the interannual relationship between the EAJ and East Asian precipitation; (3) possible factors affecting the simulated interannual relationship among the models. The remaining part of this article is organized as follows. Section 2 briefly describes the models and data. Section 3 assesses the simulation performance of the interannual meridional displacement of the EAJ. Section 4 analyzes the discrepancy of the simulated interannual relationship between the EAJ meridional displacement and East Asian summer precipitation. Section 5 further discusses the possible connections of the interannual relationship simulation with the modeled discrepancy of climatology and variability in the EAJ and precipitation among the models. Section 6 provides concluding remarks.
| Model | Lat. × Lon. | Host center/country |
| ACCESS1.0 | 145 × 192 | Commonwealth Scientific and Industrial Research Organization (CSIRO) and Bureau of Meteorology (BoM)/Australia |
| ACCESS1.3 | 145 × 192 | Commonwealth Scientific and Industrial Research Organization (CSIRO) and Bureau of Meteorology (BoM)/Australia |
| BCC_CSM1.1(m) | 160 × 320 | Beijing Climate Center/China |
| BCC_CSM1.1 | 64 × 128 | Beijing Climate Center/China |
| BNU-ESM | 64 × 128 | Beijing Normal University/China |
| CanESM2 | 64 × 128 | Canadian Centre for Climate Modelling and Analysis/Canada |
| CCSM4 | 192 × 288 | National Center for Atmospheric Research/USA |
| CESM1(CAM5) | 192 × 288 | National Center for Atmospheric Research/USA |
| CMCC-CMS | 96 × 192 | Centro Euro-Mediterraneo sui Cambiamenti Climatici/Italy |
| CMCC-CM | 240 × 480 | Centro Euro-Mediterraneo sui Cambiamenti Climatici/Italy |
| CNRM-CM5 | 128 × 256 | Centre National de Recherches Météorologiques, Centre Européen de Recherche et de Formation Avancée en Calcul Scientifique/France |
| CSIRO Mk3.6.0 | 96 × 192 | Commonwealth Scientific and Industrial Research Organization/Queensland Climate Change Centre of Excellence/Australia |
| FGOALS-g2 | 60 × 128 | Institute of Atmospheric Physics, Chinese Academy of Sciences/China |
| FGOALS-s2 | 108 × 128 | Institute of Atmospheric Physics, Chinese Academy of Sciences/China |
| FIO-ESM | 64 × 128 | The First Institute of Oceanography, SOA/China |
| GFDL CM3 | 90 × 144 | Geophysical Fluid Dynamics Laboratory/USA |
| GFDL-ESM2G | 90 × 144 | Geophysical Fluid Dynamics Laboratory/USA |
| GFDL-ESM2M | 90 × 144 | Geophysical Fluid Dynamics Laboratory/USA |
| GISS-E2-H | 90 × 144 | NASA/GISS (Goddard Institute for Space Studies)/USA |
| GISS-E2-R | 90 × 144 | NASA/GISS (Goddard Institute for Space Studies)/USA |
| HadGEM2-CC | 145 × 192 | Met Office Hadley Centre/UK |
| HadGEM2-ES | 145 × 192 | Met Office Hadley Centre/UK |
| INM-CM4.0 | 120 × 180 | Russian Academy of Sciences, Institute of Numerical Mathematics/Russia |
| IPSL-CM5A-LR | 96 × 96 | Institut Pierre Simon Laplace/France |
| IPSL-CM5A-MR | 143 × 144 | Institut Pierre Simon Laplace/France |
| IPSL-CM5B-LR | 96 × 96 | Institut Pierre Simon Laplace/France |
| MIROC-ESM-CHEM | 64 × 128 | Atmosphere and Ocean Research Institute, National Institute for Environmental Studies, and Japan Agency for Marine-Earth Science and Technology/Japan |
| MIROC-ESM | 64 × 128 | Atmosphere and Ocean Research Institute, National Institute for Environmental Studies, and Japan Agency for Marine-Earth Science and Technology/Japan |
| MIROC5 | 128 × 256 | Atmosphere and Ocean Research Institute, National Institute for Environmental Studies, and Japan Agency for Marine-Earth Science and Technology/Japan |
| MPI-ESM-LR | 96 × 192 | Max Planck Institute for Meteorology/Germany |
| MPI-ESM-MR | 96 × 192 | Max Planck Institute for Meteorology/Germany |
| MRI-CGCM3 | 160 × 320 | Meteorological Research Institute/Japan |
| NorESM1-ME | 96 × 144 | Bjerknes Centre for Climate Research, Norwegian Meteorological Institute/Norway |
| NorESM1-M | 96 × 144 | Bjerknes Centre for Climate Research, Norwegian Meteorological Institute/Norway |
Table1. Details of the 34 CMIP5 CGCMs used in this study.
We also used observational or reanalysis data. The horizontal wind was obtained from the National Centers for Environmental Prediction–Department of Energy Reanalysis-2 datasets (Kanamitsu et al., 2002). The precipitation came from the Global Precipitation Climatology Project (Adler et al., 2003). The horizontal resolutions were 2.5° in longitude and latitude and the period spanned 38 years from 1979 to 2016. Some other datasets, including the Climate Prediction Center Merged Analysis Precipitation (Xie and Arkin, 1997) and ERA-Interim (Dee et al., 2011), were also examined and showed similar results.
Our analyses focus on boreal summer (June–July–August, JJA), when the East Asian monsoon region has abundant precipitation over the year. Before the calculation of the interannual variation in observations and models, the component of time scale greater than nine years, including the long-term linear trend, was eliminated. Empirical orthogonal function (EOF) decomposition was employed to acquire the dominant modes associated with the interannual variation in the EAJ.
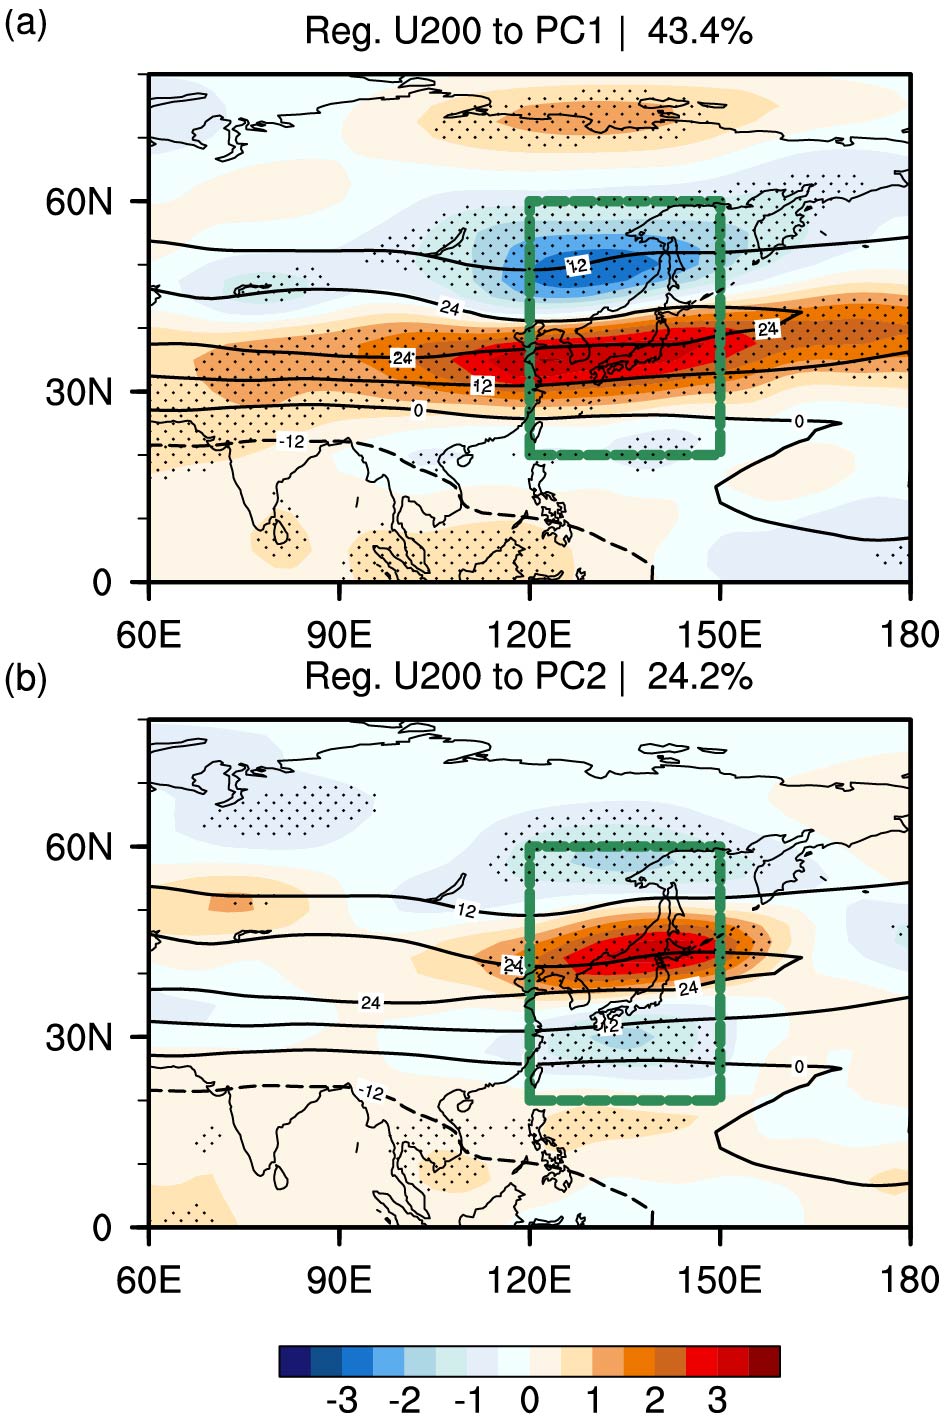 Figure1. Observed 200-hPa zonal wind anomalies in summer (U200, JJA) regressed onto the time series of the (a) first (PC1) and (b) second (PC2) leading modes through the EOF analysis for the 200-hPa zonal wind over East Asia from 1979 to 2016 (shaded; units: m s?1). The domain for EOF analysis is (20°–60°N, 120°–150°E), bound by the green rectangle. The contours represent the climatological zonal wind at 200 hPa (m s?1). Stippling indicates the statistical significance at the 95% confidence level using a two-tailed t-test. The explained variances are 43.4% and 24.2% for EOF1 and EOF2, respectively.
Since the dominant mode of interannual variation in the EAJ is the meridional displacement of the jet, an EAJ meridional displacement index (abbreviated as EAJI) is used to facilitate the analysis of the meridional displacement. Following Lu (2004), we define the EAJI as the difference in the 200-hPa zonal wind anomalies averaged over the specified regions of 25°–40°N and 40°–55°N, all between 120°E and 150°E (box A minus B in Fig. 2a). The anomalous 200-hPa zonal wind associated with the EAJI presents a significant dipole pattern (Fig. 2a), being similar to Fig. 1a (i.e., the meridional displacement mode). The similarity goes far beyond the definition area or the EOF domain. The interannual correlation coefficient between the EAJI and PC1 is 0.88. If we further see the related zonal mean of 200-hPa zonal wind anomalies averaged from 120°E to 150°E (Fig. 2b), the anomalies associated with the EAJI resemble closely those associated with PC1, which both display the EAJ meridional displacement with little change in intensity. It also confirms that, to a large extent, the first EOF mode represents the meridional displacement of the EAJ, and the second mode represents the intensity change.
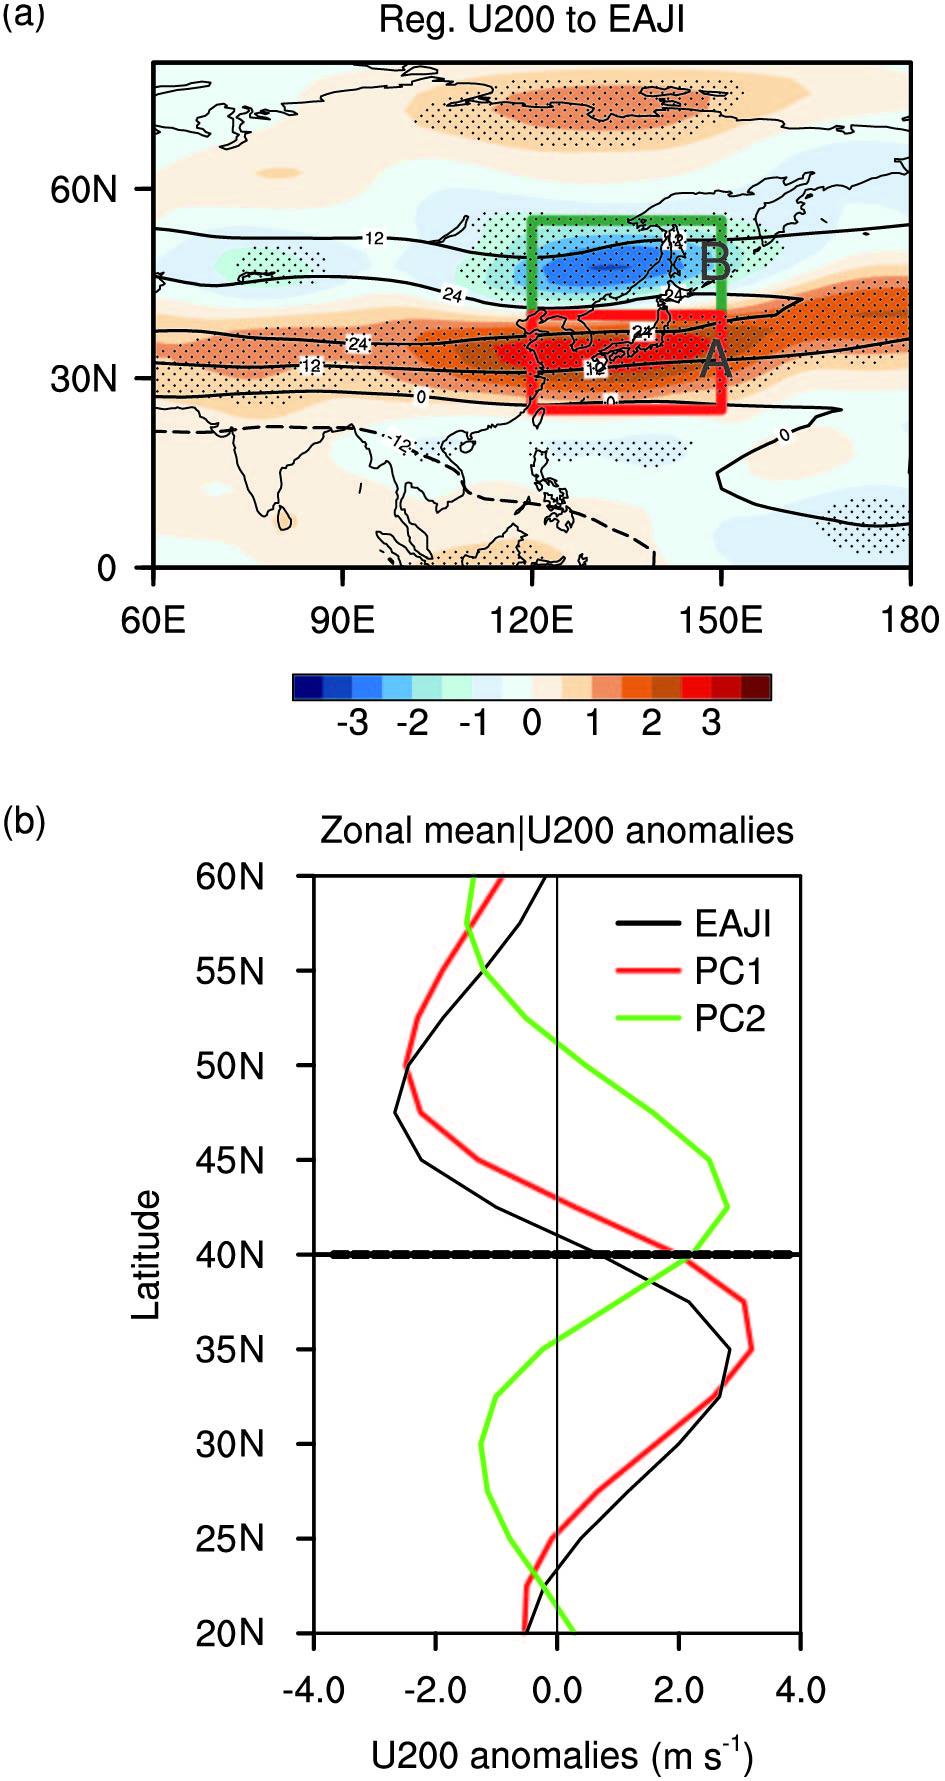 Figure2. (a) 200-hPa zonal wind regressed onto the time series of the EAJ meridional displacement index (EAJI) in observations (units: m s?1). The EAJI is defined as the U200 difference averaged between two ±15° latitude bands along 40°N (120°E to 150°E, box A minus B). Stippling indicates statistical significance at the 95% confidence level using a two-tailed t-test. (b) Zonal mean of 200-hPa zonal wind anomalies related to the EAJI (Fig. 2a, black line), PC1 (Fig. 1a, red line) and PC2 (Fig. 1b, green line) of the EAJ leading modes between 120°E and 150°E.
Figure 3 shows the 200-hPa zonal wind anomalies averaged from 120°E to 150°E for individual models, associated with the EAJI, PC1, and PC2, respectively. For each model, the EOF domain is identical to that for observations, i.e., (20°–60°N, 120°–150°E). All the models successfully reproduce the two dominant modes (Fig. 3), displaying the meridional displacement mode and intensity change mode as in observations (Fig. 2b). In the majority of the models (their names as marked in black at the top of subfigures), the meridional displacement of the EAJ is also manifested as the first leading mode. The 200-hPa zonal wind anomalies associated with PC1 in these models mainly show the meridional displacement mode and those associated with PC2 present the intensity change mode. Furthermore, most of these models can reproduce separable first two leading modes as in observations, while only one of them (CanESM2) captures the meridional displacement mode as the first leading mode, but fails in separating from the second mode.
 Figure3. Zonal mean of 200-hPa zonal wind anomalies from 120°E to 150°E (same as in Fig. 2b, but for individual models; units: m s?1): U200 anomalies associated with the EAJI (black lines), PC1 (red lines) and PC2 (green lines) of the EAJ leading modes. The models in which the EOF1 represents the meridional shift mode are marked by black titles. The remaining models, in which the EOF2 represents the meridional shift mode are highlighted by red titles. Dashed lines represent the jet axes in models. The explained variances for EOF1 and EOF2 and the interannual correlation coefficient between the EAJI and the PC representing the meridional shift mode are shown in turn in the upper-right corner for each model.
By contrast, the first leading mode in a few models [less than a quarter of all models, including ACCESS1.0, ACCESS1.3, CCSM4, CESM1(CAM5), CSIRO Mk3.6.0, IPSL-CM5A-LR, IPSL-CM5A-MR, and MPI-ESM-MR; their names are marked in red at the top of subfigures], is not related to the meridional displacement of the EAJ. In these models, the intensity change mode accounts for a larger explained variance as the first leading mode of 200-hPa zonal wind anomalies, which is different from observation. The meridional displacement of the EAJ displays as the second principal mode, suggesting a relatively weaker variance of the EAJ meridional shift reproduced by these simulations.
Similar to that defined in observations, we also use the EAJI to depict these modeled meridional shift modes. However, in the model simulations apparent biases exist in the position of the jet axis, which varies from 35°N to 45°N. Therefore, fixed regions may not be suitable for the definition of the EAJI in models, so we define the modeled EAJI as the difference in 200-hPa zonal wind anomalies averaged between two ±15° north–south latitude bands along their own jet axis for individual models. For instance, if the jet axis is located at 35°N in a model, the EAJI in this model is defined as the 200-hPa zonal wind anomalies averaged over (20°–35°N, 120°–150°E) minus those averaged over (35°–50°N, 120°–150°E). This model-dependent EAJI results in a more accurate description of the EAJ meridional displacement, by taking the robust jet axis bias into consideration. The corresponding interannual correlation coefficients between the modeled EAJI and the PC representing the meridional shift mode are high and range from 0.76 to 0.998 in these 34 models (the correlation coefficients for the individual models are shown in Fig. 3). The 200-hPa zonal wind anomalies associated with the EAJI also present dipole patterns in all the models. These results indicate that the EAJI can depict well the simulated year-to-year meridional displacement of the EAJ for each model.
 Figure4. Summer precipitation regressed onto the EAJI (units: mm d?1) in the observation. The red box represents the domain to define the EARI [bound by the points (25°N, 100°E), (35°N, 100°E), (30°N, 160°E), and (40°N, 160°E)]. Stippling indicates the relationship exceeds the 95% confidence level using a two-tailed t-test.
To facilitate further analysis of the interannual relationship, we use the precipitation anomalies averaged over subtropical East Asia (the domain is delineated by the red line in Fig. 4) as an East Asian Summer Rainfall Index (EARI), following Lu and Fu (2010). The rainfall anomalies over this region vary closely with the meridional displacement of the EAJ. The correlation coefficient between the EARI and EAJI is 0.68, reaching the 99.9% confidence level.
To assess the simulation of this EAJ–rainfall interannual relationship (hereafter abbreviated as the J-R relationship), we also use the EARI to measure the modeled interannual variation of precipitation. While the models used here generally reproduce the location of the East Asian subtropical rainband well (not shown), the EARI is defined as the average precipitation anomalies within the same domain as observations (as shown in Fig. 4). Figure 5a compares the interannual correlation coefficients of the modeled EAJI and EARI [referred to as CC(J, R)] among all the models. Almost all the models (except NorESM1-ME) depict a weaker interannual J-R relationship than that based on observation, although the relationship in some models is close to observation. The average correlation coefficient across the models is 0.41, which is much smaller than that in the observation (0.68). Some models even show weak negative correlation coefficients, implying that the deficiency of the weaker simulation for the J-R relationship in these models is aggravating, although the meridional displacement mode of the westerly jet is reproduced well (as mentioned in section 3, e.g., IPSL-CM5B-LR).
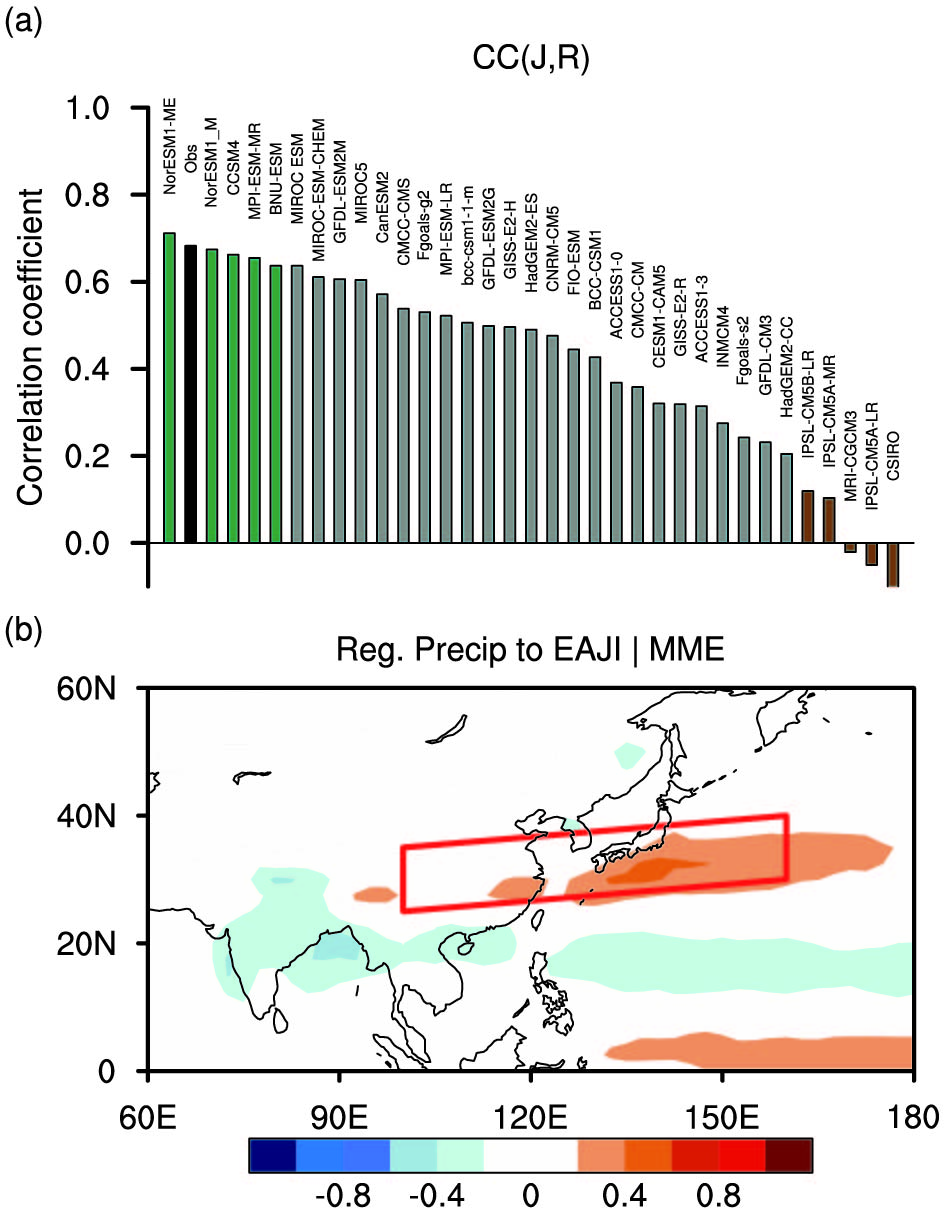 Figure5. (a) Interannual correlation coefficient between the EAJI and EARI for each model [CC(J, R)]. The black bar represents the correlation coefficient in the observation. Green bars represent the five models that simulate the highest correlation coefficients (High_CC), and brown bars represent the five models with the lowest correlation coefficients (Low_CC). (b) Precipitation anomalies regressed onto the EAJI averaged for all the models (units: mm d?1). The red box represents the subtropical East Asian rainband as in Fig. 4.
For the averaged precipitation anomalies associated with the EAJI of all the models (Fig. 5b), the spatial pattern of the rainband is basically reproduced, in comparison with the observed anomalies (Fig. 4). However, the simulated anomalies are weaker than the observations, consistent with the weaker CC(J, R) (Fig. 5a). Over the WNP and East Asia, most of the precipitation anomalies are below 0.4 mm d?1, which is much weaker than the observed anomalies.
Furthermore, we chose five models with the highest correlation coefficients (hereafter called “High_CC”, including NorESM1-ME, NorESM1-M, CCSM4, MPI-ESM-MR, and BNU-ESM) and five models with the lowest correlation coefficients (hereafter called “Low_CC”, including CSIRO Mk3.6.0, IPSL-CM5A-LR, MRI-CGCM3, IPSL-CM5A-MR, and IPSL-CM5B-LR), to assess the differences in the simulations of the J-R relationship. The average correlation coefficient for the High_CC (Low_CC) models is 0.67 (?0.005), which is close to (much lower than) the observation.
Figure 6 shows the spatial distribution of precipitation anomalies regressed against the EAJI for these two sets of models, individually. Significant positive precipitation anomalies associated with the equatorward displacement of the EAJ exist over subtropical East Asia for all five High_CC models, spanning from eastern China to the Pacific Ocean east of Japan. Meanwhile, the negative anomalies over the Philippine region and South China Sea are also reproduced well by these models. This dipole spatial pattern is closely consistent with the observations, indicating that the High_CC models successfully reproduce the interannual relationship between the meridional displacement of the EAJ and East Asian summer rainfall.
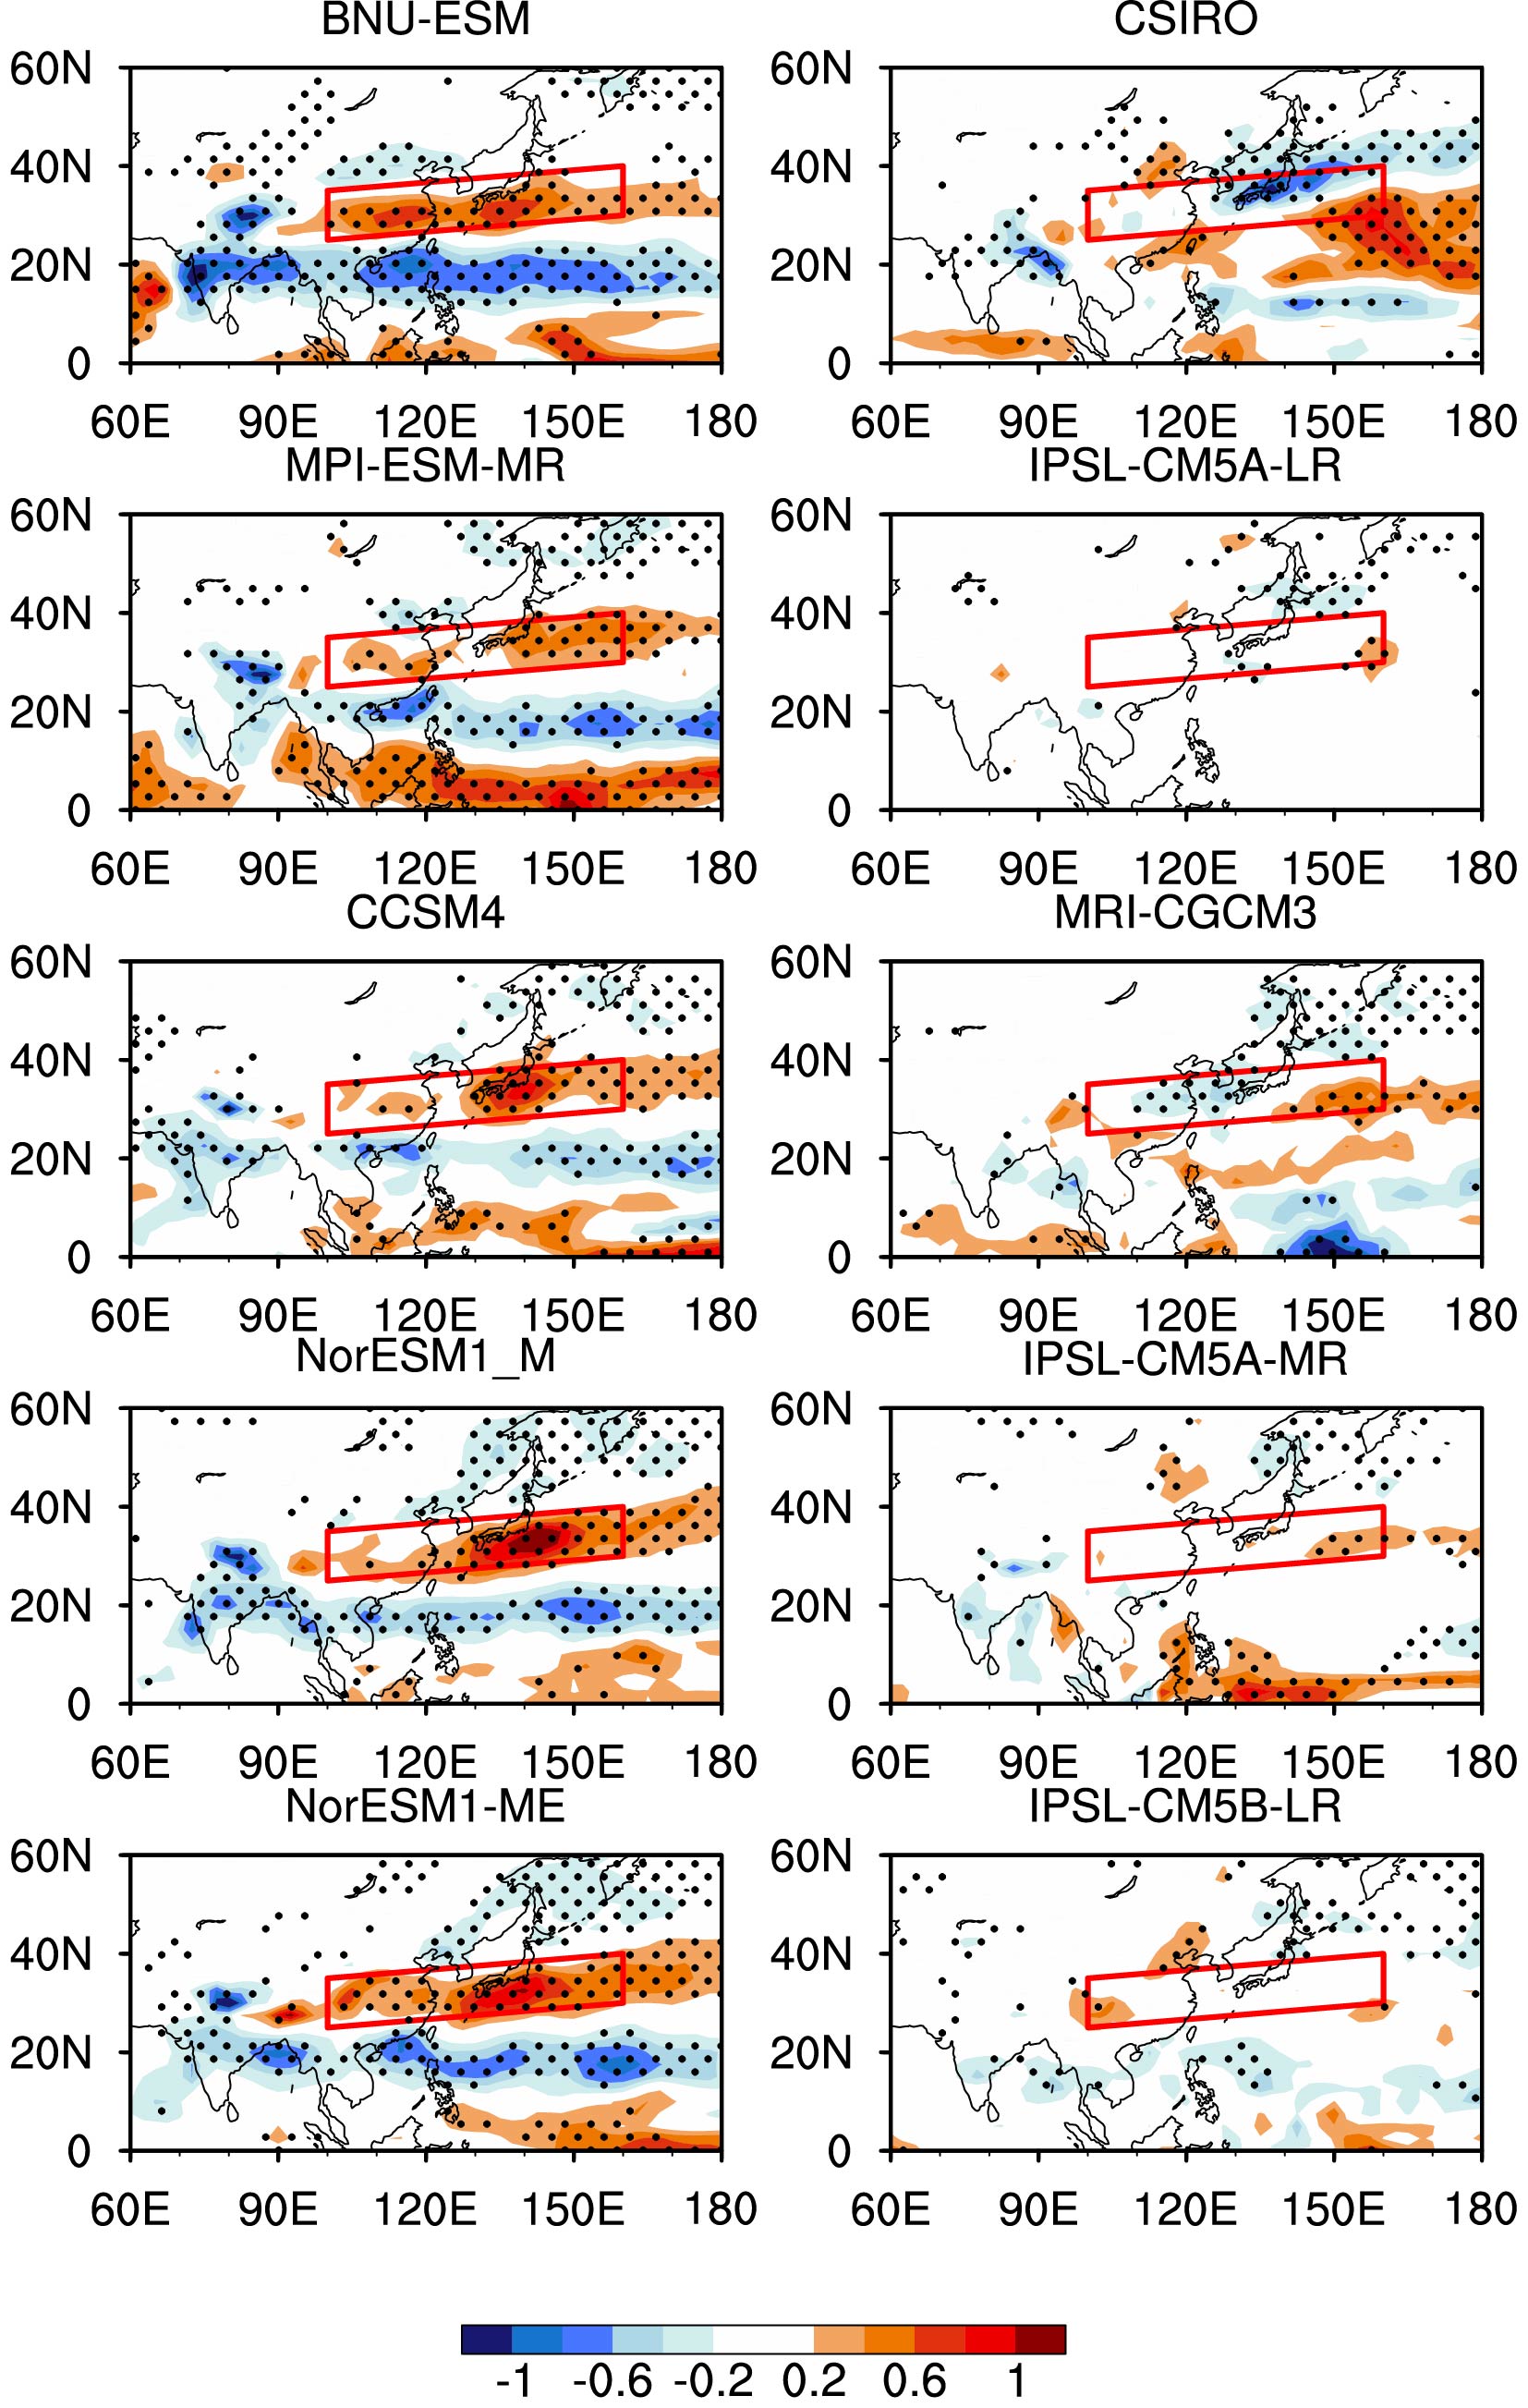 Figure6. Precipitation regressed onto the EAJI (units: mm d?1) for the High_CC (left-hand column) and Low_CC (right-hand column) models, respectively. Stippling indicates the relationship exceeds the 95% confidence level using a two-tailed t-test. The red boxes represent the subtropical East Asian rainband as in Fig. 4.
In contrast, associated with the meridional displacement of the EAJ, the Low_CC models generally show very weak precipitation anomalies over subtropical East Asia. Although some positive precipitation anomalies are shown around the WNP in the models of CSIRO Mk3.6.0 and MRI-CGCM3, these anomalies are too far to the east and not within the subtropical rainband. In general, the correlations between the EAJI and EARI are quite weak for the Low_CC models, showing large contrast to those for the High_CC models. Furthermore, there are also no significant negative precipitation anomalies in the Philippine Sea and South China Sea.
2
5.1. Climatological westerly jet and precipitation
Figure 7a shows the climatological 200-hPa zonal wind anomalies associated with the CC(J, R) index among the models. A positive anomaly indicates that the models with higher CC(J, R) tend to overestimate the westerly or underestimate the easterly. Significant positive and negative anomalies exist along the two sides of the westerly jet, since the jet is located climatologically around 30°N over Africa and 40°N over East Asia. This kind of distribution corresponds to a poleward location of the westerly jet over the whole of North Africa and Eurasia when the CC(J, R) is high, rather than being confined to over East Asia. Furthermore, we define a position index as the difference in climatological 200-hPa zonal wind anomalies averaged between two ±15° north–south latitude bands from 0°E to 180°E along the zero line as shown in Fig. 7a. A positive position index represents a northward shift of the climatological westerly jet. It shows a close connection with the simulation of the J-R relationship (Fig. 7b), with the intermodel correlation coefficient between them being 0.58 among the models, indicating that the models with a northward shift of the climatological westerly jet tend to reproduce a stronger J-R relationship, and vice versa.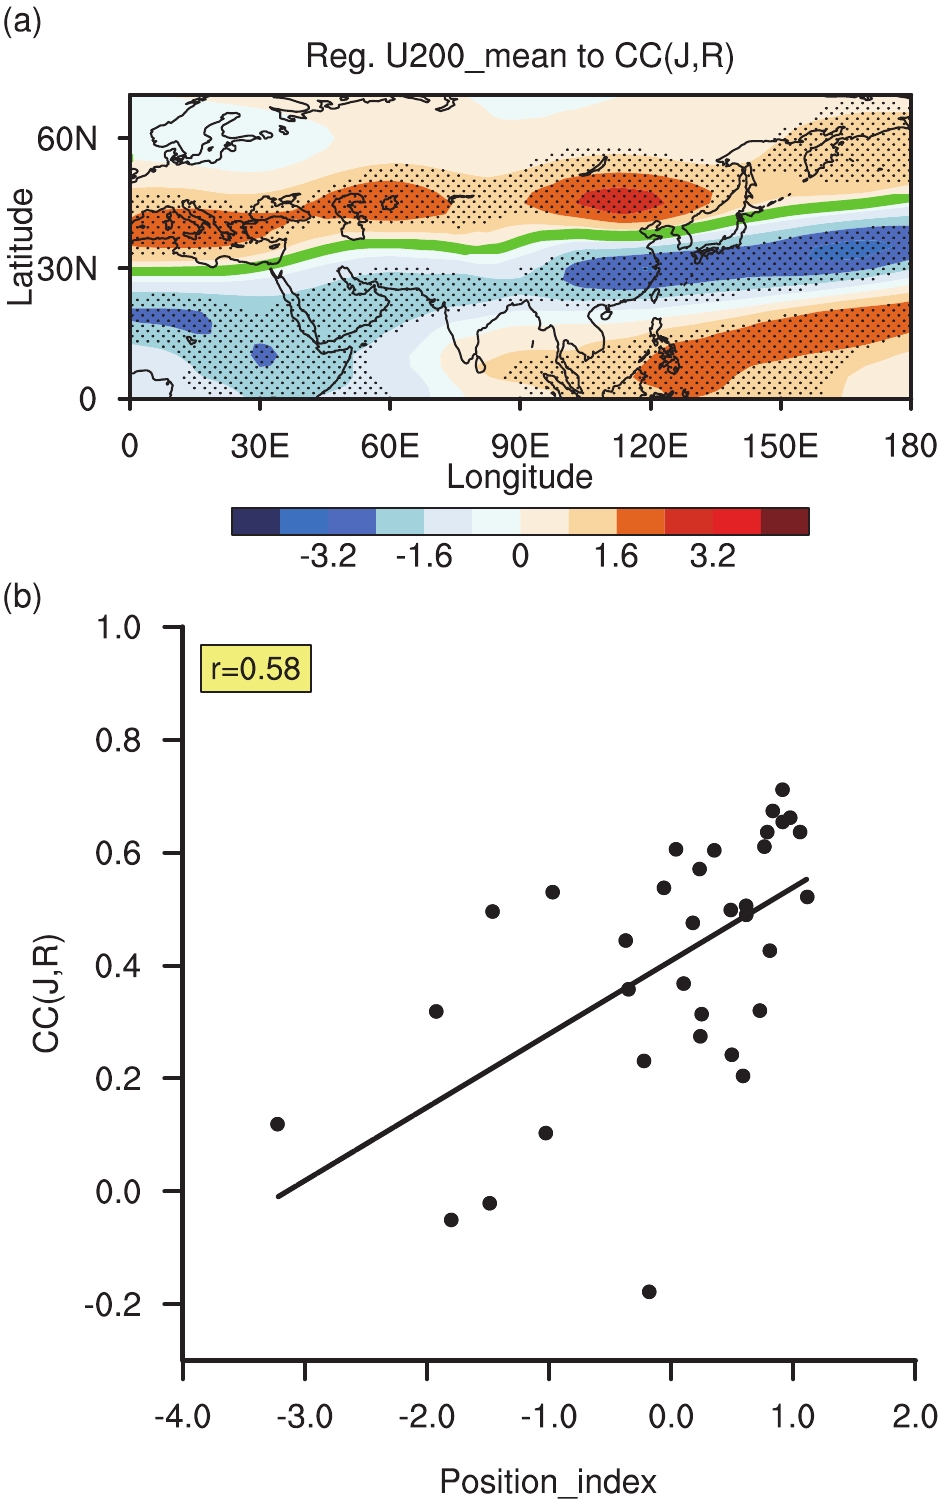 Figure7. (a) Climate mean of 200-hPa zonal wind (units: m s?1) regressed onto the CC(J, R) index (Fig. 5a) among the models. Stippling indicates the relationship exceeds the 95% confidence level using a two tailed t-test. The zero line of U200 anomalies is highlighted by the green curve. (b) Scatterplot of the CC(J, R) versus position index among the models. The position index is defined as the difference in climatological 200-hPa zonal wind anomalies averaged between two ±15° north–south latitude bands from 0°E to 180°E along the zero line [green curve in (a)]. The black markers represent individual models. The solid line represents the linear regression between them, and the number in the upper-left corner is the corresponding correlation coefficient.
For the climate mean of precipitation, there are no significant anomalies associated with the simulations of the J-R relationship among the models locally within the subtropical East Asian rainband, except for the narrow positive anomalies over central China (Fig. 8a). Nevertheless, apparent positive precipitation anomalies in South Asia (SA; 5°–30°N, 60°–90°E) and negative anomalies in the WNP (10°–25°N, 120°–180°E) are shown in connecting with the simulations of the J-R relationship. The correlation coefficient between the CC(J, R) and the SA (WNP) climatological rainfall is 0.71 (?0.44) across the models (Figs. 8b and c). The models with more historical rainfall in SA or less rainfall in the WNP tend to simulate a stronger J-R relationship, and vice versa. The discrepancy in the simulated climatological rainfall over these two tropical regions may lie further with the intrinsic simulation bias among models, such as their different horizontal resolutions (Rodríguez et al., 2017) and convective parameterization schemes (Yan et al., 2019). In addition, Rodríguez et al. (2017) indicated that the robust rainfall biases in SA can affect East Asian monsoon circulation and water budgets.
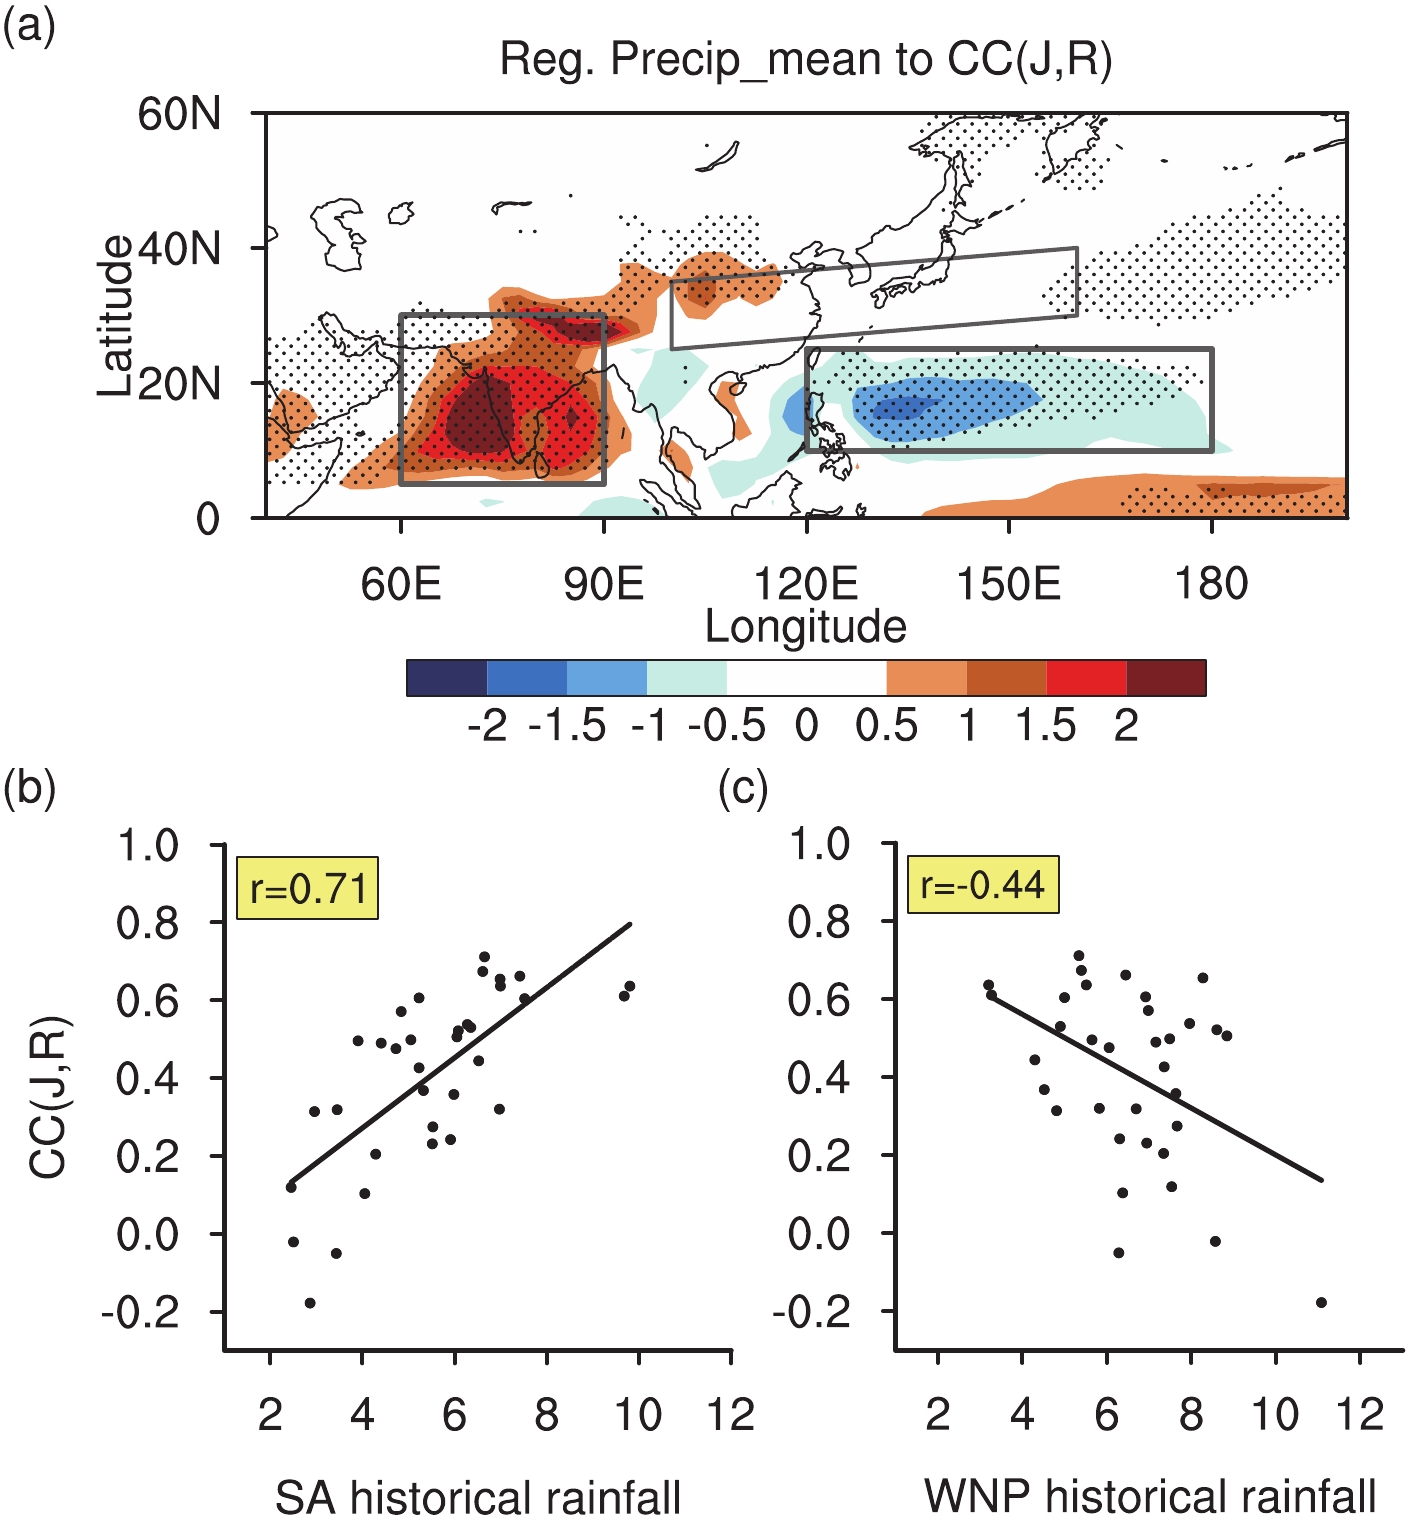 Figure8. (a) As in Fig. 7a, but for the climate mean of precipitation (units: mm d?1). The black boxes represent the key regions of South Asia (SA; 5°–30°N, 60°–90°E), the western North Pacific (WNP; 10°–25°N, 120°–180°E) and subtropical East Asia (same as in Fig. 4). Scatterplots show the CC(J, R) and (b) SA rainfall (units: mm d?1), (c) WNP rainfall among the models. In (b) and (c), the black markers represent individual models. The solid line represents the linear regression between them, and the number in the upper-left corner is the corresponding correlation coefficient.
2
5.2. Interannual variability in the westerly jet and precipitation
Figure 9a shows the interannual standard deviation of 200-hPa zonal wind regressed onto the CC(J, R) among the models. Positive values indicate that the stronger J-R relationship in individual models corresponds to enhanced interannual variability in 200-hPa zonal wind. The significant differences in interannual variability of 200-hPa zonal wind are found around the EAJ variation regions. The intermodel correlation coefficient between the CC(J, R) and the interannual standard deviation of 200-hPa zonal wind averaged over (30°–50°N, 110°–130°E), delineated by the black lines in Fig. 9a, across the models is 0.59, which is above the 99% confidence level. This strong positive correlation between them indicates that the models with the stronger interannual variability in 200-hPa zonal wind around the East Asian jet region tend to reproduce a higher simulated J-R relationship, and vice versa. Moreover, the associated anomalous 200-hPa zonal wind variability is more prominent on each side of the jet axis in the meridional direction, especially in its northern part. These two centers approximately match with the position of the meridional displacement of the EAJ, implying that the models’ simulation performances for the variability in the EAJ meridional displacement may be closely related to the simulated J-R relationship.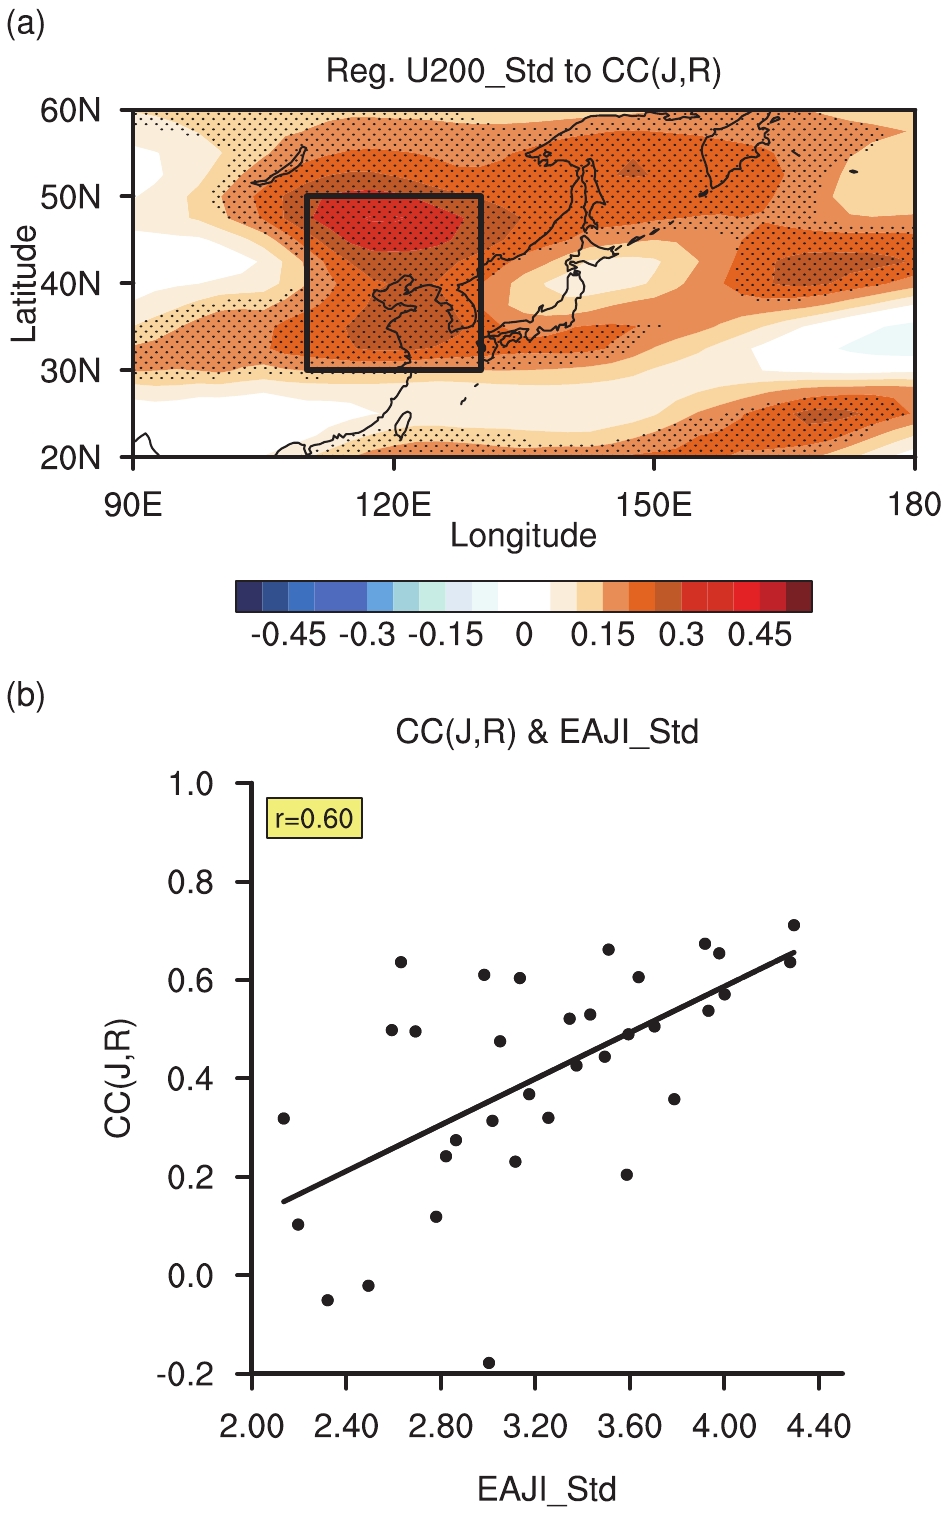 Figure9. As in Fig. 7, but for the interannual standard deviation of 200-hPa zonal wind (units: m s?1) and the stippling indicates the relationship exceeds the 99% confidence level using a two-tailed t-test. The black box in (a) represents the domain bounded by (30°–50°N, 110°–130°E).
To confirm this, we further assess the intermodel connection between the simulated J-R relationship and interannual variability in the EAJ meridional displacement. The interannual standard deviation of the EAJI is used to quantitatively measure the intensity of the variability in the EAJ meridional displacement. Figure 9b is a scatterplot of CC(J, R) versus the standard deviation of the EAJI for individual models. A significant positive correlation exists between them, and the corresponding intermodel correlation coefficient is 0.60, which is statistically significant at the 99% confidence level. This strong intermodel connection means that the models with a stronger intensity of the EAJ meridional displacement tend to reproduce a stronger J-R interannual relationship, and vice versa. To conclude, the modeled interannual variability in the EAJ meridional displacement is intimately connected with the simulation performance of its relationship with the East Asian summer precipitation.
For the East Asian summer precipitation, by contrast, the interannual variability of the rainband has no significant anomalies associated with the simulation of the J-R relationship, especially over eastern China and southern Japan (Fig. 10). The intermodel correlation coefficient between the CC(J, R) and interannual standard deviation of the EARI is 0.43, which is at the 95% confidence level. However, this correlation mainly arises from precipitation over Central China. Note that the confidence level used in this figure is 90%, which is much lower than that (99%) for Fig. 9a. Therefore, we conclude that the simulation performance for the intensity of East Asian precipitation variability has no significant connections with its modeled relationship to the EAJ meridional displacement.
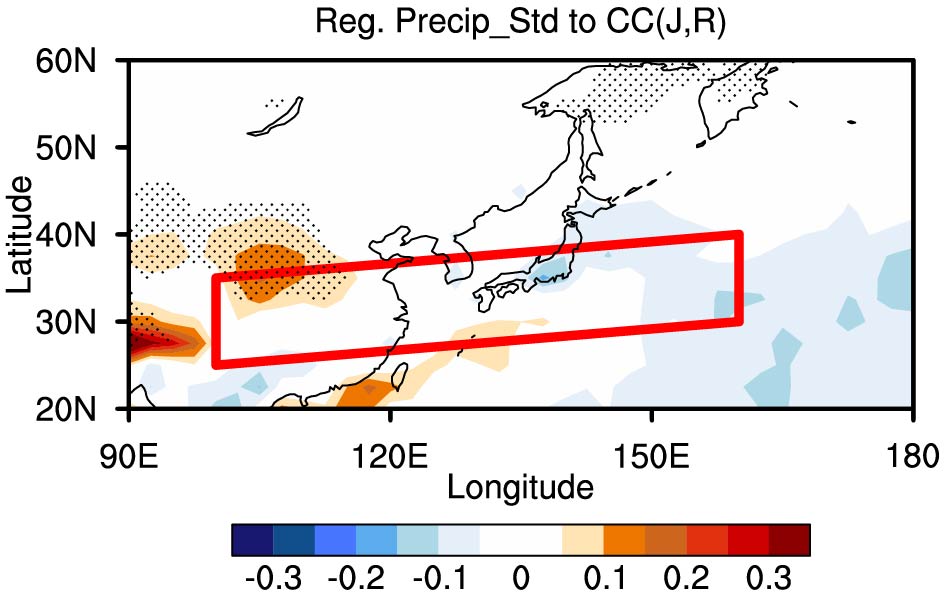 Figure10. As in Fig. 7a, but for the interannual standard deviation of precipitation (units: mm d?1) and the stippling indicates the relationship exceeds the 90% confidence level using a two-tailed t-test. The red box is the same as in Fig. 4.
Furthermore, we assess the simulation of the interannual relationship between the EAJ meridional displacement and East Asian summer rainfall, which is recognized as the main linkage between extratropical circulation anomalies and East Asian summer rainfall in observations. It is revealed that almost all the models depict a weaker interannual relationship between them than in the observation. In addition, the simulations show great diversity among the models, and some models even reproduce a negative correlation. The weak EAJ–rainfall interannual relationship suggests the CMIP5 models show certain deficiencies in reproducing the East Asian meridional teleconnections associated with the extratropical circulation.
Through intercomparing the capacities in simulating the J-R interannual relationship among the models, our analyses further suggest that the deficiencies in the modeled J-R relationship are closely related to their capability in reproducing the basic state of the jet and precipitation. For the climate mean, we find that a modeled northward (southward) shift of the westerly jet over the whole Eurasian continent corresponds to a stronger (weaker) simulated J-R relationship. The corresponding correlation coefficient between them is 0.58. In addition, diversity in the modeled J-R relationship is not related to the simulated climatological rainfall bias locally but connects with that remotely in SA and the WNP. The models with more historical rainfall in SA or less rainfall in the WNP tend to display a stronger J-R relationship, especially for the SA rainfall, with the intermodel correlation coefficient between the CC(J, R) and historical rainfall in SA (the WNP) being 0.71 (?0.44).
For the interannual variability, on the other hand, the simulated J-R relationship is directly related to the intensity of the variability in the EAJ meridional displacement. Specifically, the models with a stronger intensity of the EAJ meridional displacement tend to reproduce a stronger J-R relationship, and vice versa. The associated intermodel correlation coefficient between the CC(J, R) and interannual standard deviation of EAJI is 0.60. In contrast to the westerly jet, the interannual variability discrepancy of precipitation anomalies exhibits no significant correlations with the simulated J-R relationship and cannot explain the simulation diversity in the J-R relationship.
A reasonable reproduced interannual relationship between different monsoon members is crucial for improving the capacity in simulating and predicting the East Asian monsoon. Our results imply that more attention should be paid to the bias of the westerly jet, including the climatology and interannual variability, to achieve more reasonable precipitation simulation in East Asia. In addition, simulation of the tropical historical rainfall is also worthy of more attention.
However, it should be mentioned that the physical linkage between the J-R relationship and the mean state remains unclear, especially the connections with tropical rainfall, and thus needs further investigation in the future. On the other hand, the meridional displacement of the EAJ can be affected by the surface air temperatures around the Russian Far East (Lin et al., 2018a, b), by transient eddies (Xiang and Yang, 2012; Xiao and Zhang, 2012), and by tropical cyclone activities (Chen et al., 2017, 2018; Hu et al., 2019). Whether these factors can affect the intensity of the interannual variability in the EAJ and result in the diversity of the EAJ intensity is a question requiring further investigation. Moreover, rainfall simulations can be affected by various factors, but particularly the model resolution (Zhang et al., 2008; Kan et al., 2015; Goswami and Goswami, 2017; Huang et al., 2018) and the partitioning of stratiform and convective precipitation (e.g., Huang et al., 2013; Yan et al., 2019), making the J-R relationship in models more complicated.
Acknowledgments. We thank the two anonymous reviewers and the editor for their constructive comments. This work was supported by the National Key Research and Development Program of China (Grant No. 2018YFA0606501) and the National Natural Science Foundation of China (Grant Nos. 41721004, U1502233 and 41775083).
