0 引言
【研究意义】冬小麦在我国是仅次于水稻的第二大粮食作物,其播种面积约占粮食播种总面积的1/5。叶面积指数(leaf area index,LAI)与作物的蒸腾作用和光合作用密切相关,是反映作物群体长势状况的重要指标[1,2,3],快速、无损、精准地监测冬小麦关键生育期的叶面积指数,对准确掌握长势动态、水肥调控、灾害监测和产量预测等田间生产管理具有重要意义[4,5,6,7],历来受到农业管理部门的高度重视。利用农作物植被指数,能够非破坏性地获取作物生长状况,该方法能高效的监测冬小麦长势动态,但需要以地面实证研究为基础建立实用的指数,确定其可用性与不确定性[8,9,10]。当前冬小麦叶面积指数观测主要可分为田间取样和遥感监测两种方式。田间取样主要是破坏性获取植株样本,在室内通过比叶重法或面积量算法来获取样本点的LAI,精度较高,但费时费力、代表性较差,仅适用于小范围区域,且具有一定的主观性。遥感监测技术具有大面积实时观测、客观性强和成本低等特点,目前已成为农业管理部门监测作物生长状况的主要手段之一。【前人研究进展】近年来高光谱传感器的迅猛发展,为农作物叶面积指数遥感监测提供了日益丰富的多谱段、多分辨率的数据源[11,12]。农作物叶面积指数的高光谱响应特征分析及敏感光谱指数优选是区域尺度遥感反演的基础。贺佳等[13]基于冬小麦不同生育时期,建立叶面积指数高光谱遥感监测模型,提高了叶面积指数高光谱监测精度;刘珂等[14]研究利用实测冬小麦冠层高光谱反射率,构造了不同光谱分辨率和波段组合的5种光谱数据,研究解释了高光谱遥感数据是否能提高植被参数反演精度的问题;李子扬等[15]利用辐射传输模型(PROSPECT和SAILH)模拟高光谱冠层反射率数据进行叶面积指数遥感反演,结果显示所建模型能较好的反映出真实叶面积指数。作物冠层光谱反射率受多种因素的影响,如土壤背景、作物生物物理特性和水肥管理等[16]。通过冠层光谱的多波段信息构建各种植被指数来反演叶面积指数,可有效凸显作物群体结构信息,降低干扰因素的影响。当前最常用的归一化植被指数NDVI(normalized difference vegetation index)与叶面积指数具有较好的相关性[17],但NDVI与土壤背景亮度有很好的关系,较易受到土壤类型的干扰,且NDVI在LAI较高时具有易饱和的缺陷[18];HUETE等[19]提出的土壤调整指数SAVI(soil-adjusted vegetation index)能有效消除土壤带来的影响;KAUFMAN等[20]从作物生物物理特性的角度提出了大气阻抗指数ARVI(atmospherically resistant vegetation index),通过增加蓝色波段信息,使得其对大气阻抗能力优于NDVI。不同的植被指数具有不同的表征能力和局限性,近年来一些****提出了指数组合的方法来构建新型植被指数,以期提高作物群体参数反演精度。如HABOUDANE等[21]构建的TCARI/OSAVI(transformed chlorophyll absorption in reflectance index/optimized soil-adjusted vegetable index),该指数对叶绿素含量的变化很敏感,对LAI的变化和底层土壤背景具有抵抗性。因此加强叶面积指数的高光谱机理解析,进一步优化植被指数构建方法,有助于提高作物叶面积指数的遥感反演精度,降低土壤、植株水分、叶片色素等干扰因素的影响。【本研究切入点】考虑到作物冠层光谱是作物各种理化特性综合作用的结果,前人基于高光谱数据反演LAI的研究多是在方法改进上提高叶面积指数反演的精度,而未考虑植株含水量对其的影响。而叶面积指数与植株含水量存在较大的表征差异,即叶面积指数高低与植株含水量高低往往不一致,本研究旨在构建一个能有效避免植株含水量干扰的光谱指数来提升作物叶面积指数的高光谱反演精度。【拟解决的关键问题】通过开展冬小麦水肥交叉田间试验,分析标准化差分红边指数NDRE(normalized difference red edge)、水分敏感指数WI(water index)与叶面积指数的相关性,据此构建一个新型的植被指数——红边抗水植被指数(red-edge resistance water vegetable index,RRWVI)。与多种常用植被指数对比分析RRWVI对冬小麦叶面积指数反演的可行性和有效性,实现提升冬小麦叶面积指数高光谱反演的精度,以期为区域尺度遥感监测提供方法借鉴。1 材料与方法
1.1 研究区域与试验设计
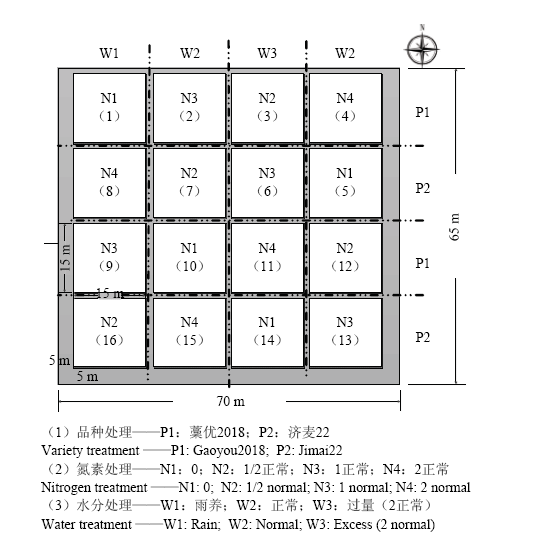
田间试验设在北京市昌平区小汤山国家精准农业研究示范基地(北纬40°00′—40°21′,东经116°34′—117°00′),海拔高度 36m,研究区域地理位置如图1所示。试验地土壤类型为潮土,气候类型为大陆性季风气候。试验时间为2013—2014年小麦生长季,选用2个不同筋性的小麦品种济麦22(中筋麦)和藳优2018(强筋麦)。设置不同的氮肥梯度和灌溉梯度,其他管理条件完全相同。播种时间为2013年9月27日,播种量为330—345 kg·hm-2。氮肥梯度4个:0(N1)、103.5 kg N·hm-2(1/2正常,N2)、207 kg N·hm-2(正常,N3)、60 kg N·hm-2(2倍正常,N4),基追比1﹕1。水分处理3个:雨养(W1)、正常灌溉(W2)、过量灌溉(2倍正常水,W3),正常水量750 m3·hm-2。小区70 m×65 m,共16个小区,每个小区4个角点采用亚米级GPS进行定位,每区15 m×15 m,试验设计如图2。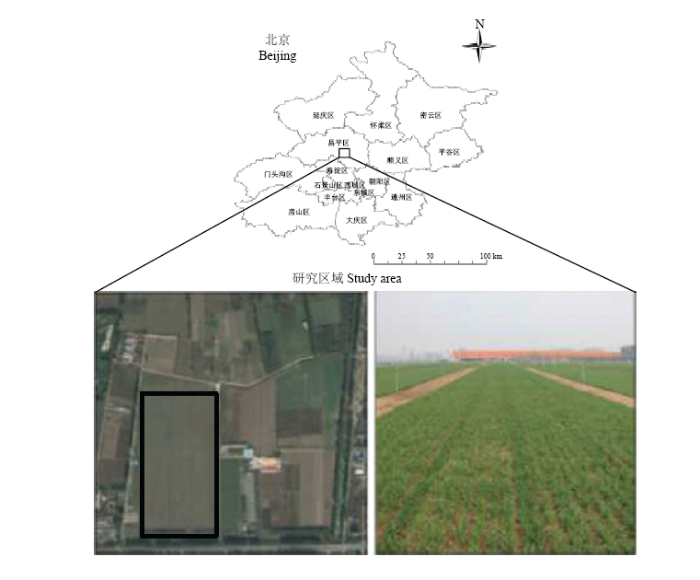 显示原图|下载原图ZIP|生成PPT
图1研究区地理位置
-->Fig. 1The geographical location of the study area
-->
 显示原图|下载原图ZIP|生成PPT
图2水肥试验图
-->Fig. 2The map of water and fertilizer
-->
1.2 数据获取
开展5次关键生育期的田间观测,分别是返青期(3月25日)、拔节期(4月8日)、孕穗期(4月22日)、开花期(5月5日)和灌浆期(5月22日),各生育期冬小麦生长状况如图3所示。室外测量冠层光谱反射率数据,室内测量叶面积指数、叶片含水量和植株含水量。采用美国ASD Fieldspec Pro FR2500光谱仪测定田间冠层光谱数据,波谱范围为350—2 500 nm,其中350—1 000 nm的光谱采样间隔为1.4 nm,光谱分辨率为3 nm,1 000—2 500 nm的光谱采样间隔为2 nm,光谱分辨率为10 nm。冠层光谱测定时间为10:00—14:00,天气晴朗、无云无风。测量时探头垂直于冠层上方1 m左右,测定前后均用白板进行标定,每小区测量3个样点,每个样点测量10次冠层光谱,取平均值作为该样本小区的冠层光谱反射率。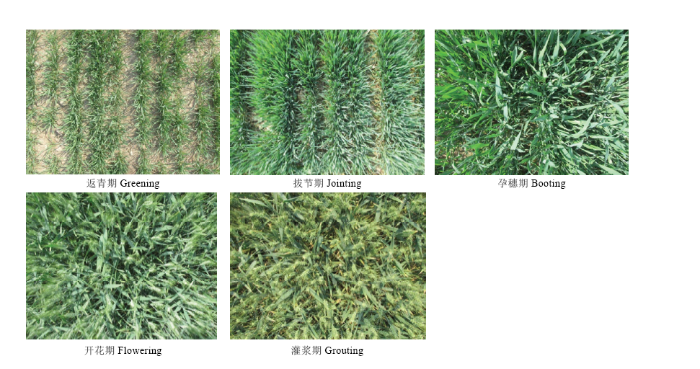 显示原图|下载原图ZIP|生成PPT
图3冬小麦关键生育期图片
-->Fig. 3Pictures of key growth period of winter wheat
-->
叶面积测量采用比叶重法,针对每一样本小区,在测量高光谱的相同位置选取具有代表性的10株小麦作为样品放入密封取样袋,在室内将叶片和茎迅速称鲜重,取展开叶片中部宽窄一致的地方,剪成2 cm的小段,用直尺测定总宽度,计算取样面积,装入小纸袋烘干后称重,并将其他剩余绿叶全部烘干后称重;所有剩余植株绿叶均摘下擦净烘干后称重;茎烘干后称重。LAI计算公式为(1),叶片含水量和植株含水量的计算公式为(2)和(3):
$叶面积指数=\frac{\text{w1+w2}}{\text{w1×10×A×10000}}\text{×S×M}$ (1)
$叶片含水量=\frac{\text{w4-w1-w2}}{\text{w4}}\text{ }\!\!\times\!\!\text{ 100 }\!\!\%\!\!\text{ }$ (2)
$植株含水量=\frac{\text{w4+w5-w1-w2-w6}}{\text{w4+w5}}\times 100\text{ }\!\!\%\!\!\text{ }$(3)
式中,S为标叶面积(cm2);A为取样面积(m2);M为取样面积上的总株数;10 000是将cm2换算成m2;W1为标叶重(g);W2为10株的余叶重(g);W3为剩余植株叶片重(g);W4为10株叶片总鲜重(g);W5为10株茎鲜重(g);W6为10株茎干重(g)。
1.3 数据分析
1.3.1 新植被指数构建 作物光谱反射率“红边”是指作物冠层在红波段的强吸收到近红外波段多次散射形成高反射的过度波段,红边是植被营养、长势、水分和叶面积等的指示性特点,得到了广泛应用和证实[22,23]。植被生长旺盛时,红边会红移,当遇病虫害和水肥胁迫时红边会蓝移。FITZGERALD等[24]提出了标准化差分红边指数NDRE,提高了多种作物理化参数的反演精度,NDRE计算公式如下:$\text{NDRE=}\frac{{{\text{R}}_{\text{790}}}\text{-}{{\text{R}}_{\text{720}}}}{{{\text{R}}_{\text{790}}}\text{+}{{\text{R}}_{\text{720}}}}$ (4)
水敏感光谱指数是指叶片水分吸收不同能量波长处的反射率和强度的组合。水分指数WI已经成功用于评估不同含水量的植被种类[25],其计算公式如下:
$\text{WI=}\frac{{{\text{R}}_{\text{900}}}}{{{\text{R}}_{\text{970}}}}$ (5)
叶面积指数是小麦生长状况的重要群体结构参数,考虑到植株含水量会对叶面积指数高光谱反演造成影响,本文尝试将NDRE与WI组合运算,构建新型光谱指数—红边抗水植被指数(red-edge resistance water vegetable index, RRWVI),旨在提高LAI高光谱反演的精度。RRWVI的计算公式如下:
$\text{RRWVI=}\frac{\text{NDRE}}{\text{WI}}\text{=}\frac{{{\text{R}}_{\text{970}}}\text{(}{{\text{R}}_{\text{790}}}\text{-}{{\text{R}}_{\text{720}}}\text{)}}{{{\text{R}}_{\text{900}}}\text{(}{{\text{R}}_{\text{790}}}\text{+}{{\text{R}}_{\text{720}}}\text{)}}$ (6)
1.3.2 LAI高光谱反演模型构建与验证 共计获取5个生育期70个样本数据,为了分析构建的新型植被指数对于冬小麦叶面积指数的反演能力,在田间观测样本中随机抽取约2/3(45个)样本作为训练样本,计算RRWVI以及前人研究中常用的植被指数,以未参与建模的约1/3(25个)样本作为检验样本。考虑到LAI较大时植被指数易饱和的问题,采用指数函数构建冬小麦叶面积指数高光谱反演模型。冠层光谱反射率受大气吸收、土壤背景、光照等因素的影响,因此选择的参照植被指数尽量全面,所选植被指数如表1。
Table 1
表1
表1常用植被指数计算公式
Table 1Common vegetation index calculation formula
| 植被指数 Vegetable index | 名称 Name | 公式 Formula | 参考文献 References |
|---|---|---|---|
| RRWVI | 红边抗水植被指数 Red-edge resistance water vegetable index | $\frac{{{\text{R}}_{\text{970}}}\text{(}{{\text{R}}_{\text{790}}}\text{-}{{\text{R}}_{\text{720}}}\text{)}}{{{\text{R}}_{\text{900}}}\text{(}{{\text{R}}_{\text{790}}}\text{+}{{\text{R}}_{\text{720}}}\text{)}}$ | |
| NDVI | 归一化植被指数 Normalized difference vegetation index | $\frac{{{\text{R}}_{\text{800}}}\text{-}{{\text{R}}_{\text{670}}}}{{{\text{R}}_{\text{800}}}\text{+}{{\text{R}}_{\text{670}}}}$ | [26] |
| RVI | 比值植被指数 Ratio vegetation index | $\frac{{{\text{R}}_{\text{800}}}}{{{\text{R}}_{\text{670}}}}$ | [27] |
| DVI | 差值植被指数 Difference vegetation index | ${{\text{R}}_{\text{800}}}\text{-}{{\text{R}}_{670}}$ | [28] |
| SAVI | 土壤调节植被指数 Soil-adjusted vegetation index | $\frac{\text{1}\text{.5(}{{\text{R}}_{\text{800}}}\text{-}{{\text{R}}_{\text{670}}}\text{)}}{{{\text{R}}_{\text{800}}}\text{+}{{\text{R}}_{\text{670}}}\text{+0}\text{.5}}$ | [29] |
| NDRE | 标准化差分红边植被指数 Normalized difference red edge | $\frac{{{\text{R}}_{\text{790}}}\text{-}{{\text{R}}_{\text{720}}}}{{{\text{R}}_{\text{790}}}\text{+}{{\text{R}}_{\text{720}}}}$ | [24] |
| NVI | 新植被指数 New vegetable index | $\frac{{{\text{R}}_{\text{777}}}\text{-}{{\text{R}}_{\text{747}}}}{{{\text{R}}_{\text{673}}}}$ | [30] |
| NPCI | 归一化色素叶绿素植被指数 Normalized pigment chlorophyll vegetation index | $\frac{{{\text{R}}_{\text{800}}}\text{-}{{\text{R}}_{\text{680}}}}{{{\text{R}}_{\text{800}}}\text{+}{{\text{R}}_{\text{680}}}}$ | [31] |
| WI | 水分指数 Water index | $\frac{{{\text{R}}_{\text{900}}}}{{{\text{R}}_{\text{970}}}}$ | [25] |
| PRI | 光辐射指数 Photon radiance index | $\frac{{{\text{R}}_{\text{570}}}\text{-}{{\text{R}}_{\text{531}}}}{{{\text{R}}_{\text{570}}}\text{+}{{\text{R}}_{\text{531}}}}$ | [32] |
新窗口打开
1.3.3 精度评价 以未参与建模的约1/3(25个)样本作为检验样本,评价各个植被指数构建的叶面积指数反演模型,采用决定系数(coefficient of determination,R2)、均方根误差(root mean aquare error,RMSE)2个指标对检验样本的预测值和实验值进行模型精度评价。
$RMSE=\sqrt{\frac{1}{n}\times\sum_{i=1}^{n}(P_{i}-Q_{i})^{2}}$ (7)
式中,Pi为LAI预测值,Qi为LAI观测值,i为样本。
2 结果
2.1 冬小麦LAI生育进程分析与高光谱特征分析
首先,分析冬小麦LAI生育进程变化规律(图4)。随着生育期的推进冬小麦的叶面积指数先增加后降低,孕穗期达到最大。麦苗越冬以后,当日平均气温达到5℃左右时小麦开始返青,此时小麦植株明显恢复生长,田间麦苗覆盖率很低,LAI为1.0左右;起身期植株生长发育加快,至拔节期小麦LAI可达3.5左右,与返青期LAI差异显著,此时光谱响应特征信息明显,基本能够反映冬小麦的长势好坏,该时期是水肥调控的重要时期;孕穗期是小麦旗叶长出的时期,此时LAI在整个生育期达到最大,不同的水肥处理样本LAI差异较大,在5—8之间;开花期冬小麦从营养生长向生殖生长转变,LAI较孕穗期有所降低,缺水缺肥处理的样本生育进程明显提前,部分样本叶片变黄、脱落,导致LAI降低,开花期平均LAI在5.5左右;灌浆期植株营养成分向籽粒转移,冬小麦LAI显著下降。藁优2018与济麦22筋性不同,虽同属于紧凑株型,但前者分蘖能力大于后者,使得整个生育期的LAI表现出藁优2018略高于济麦22。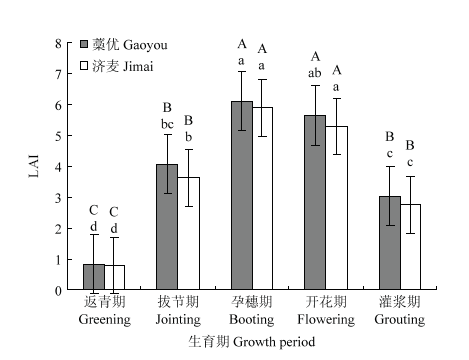 显示原图|下载原图ZIP|生成PPT
图4冬小麦关键生育期LAI的变化分析
图中大写字母表示LAI在0.01水平下差异显著,小写字母表示LAI在0.05水平下差异显著
-->Fig. 4Analysis of changes in LAI at key growth stages of winter wheat
The uppercase letters indicate that the LAI is significantly different at P<0.01, and the lowercase letters indicate that the LAI is significantly different at P<0.05
-->
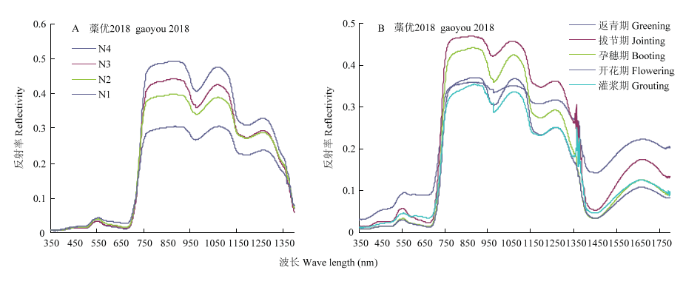
其次,分析冬小麦关键生育期冠层光谱响应特征。不同生育期、不同冠层结构和不同植株水分均会表现出不同的光谱反射特征。图5-A显示了不同氮水平下冬小麦冠层光谱反射率(以藁优2018正常水小麦孕穗期为例),在近红外波段(720—1 350 nm),冬小麦冠层光谱反射率随着施氮量的增加而增大,与氮肥梯度完全一致,其中2倍氮肥处理的近红外反射率达到最高;不同施氮水平下小麦冠层光谱反射率在可见光波段(350—720 nm)差异不明显。图5-B显示了不同生育期下冬小麦冠层光谱反射率(以藁优2018正常水肥处理为例),从图中可以看出,小麦冠层光谱反射率变化波形大体一致,在可见光波段小麦冠层光谱反射率在550 nm处有较大差异,近红外区域,从返青期到拔节期光谱反射率升高且达到最高,之后随着生育期的推进,冠层光谱反射率逐渐下降,在灌浆期达到最低。
 显示原图|下载原图ZIP|生成PPT
图5不同施氮水平的冬小麦冠层光谱变化(A)和关键生育期冬小麦冠层光谱变化(B)
-->Fig. 5Canopy spectral changes of winter wheat with different nitrogen levels(A) and canopy spectral changes of winter wheat in key growth stages
-->
2.2 新型光谱指数RRWVI分析
冬小麦不同生育期叶片含水量不同,各个生育期的NDRE和WI均存在较好的相关性(图6)。因此,本文参考HABOUDANE等[21]创建新型植被指数的方法,猜想叶面积指数很可能与斜率(NDRE/WI)密切相关,据此构建一个新的植被指数—红边抗水植被指数(RRWVI),探讨该指数与LAI的响应关系。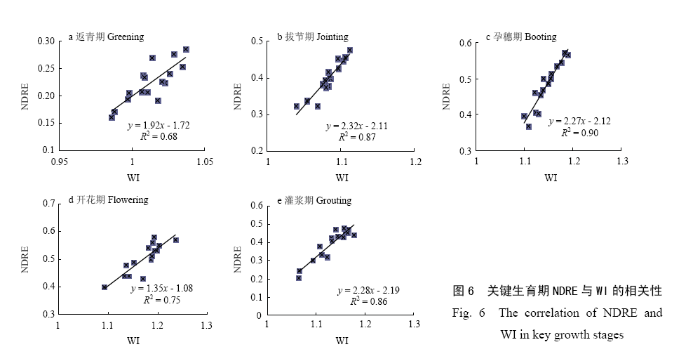 显示原图|下载原图ZIP|生成PPT
图6关键生育期NDRE与WI的相关性
-->Fig. 6The correlation of NDRE and WI in key growth stages
-->
2.3 新型光谱指数的LAI反演模型分析
随机抽取45个样本作为训练样本,计算RRWVI以及前人研究中常用的植被指数,采用指数函数构建冬小麦叶面积指数高光谱反演模型。结果表明,各种植被指数建立的LAI反演模型的决定系数均较高,在0.49—0.83之间,其中新构建的RRWVI模型的决定系数最高,R2达到0.83;其次是NDVI,R2为0.78,NDRE和SAVI所建模型的R2值分别为0.73和0.71;PRI与DVI效果接近,R2分别为0.66、0.67;RVI和NPCI的R2分别为0.59和0.56。从均方根误差角度来看,NVI有最大的均方根误差(RMSE=1.905),新构建的植被指数RRWVI有最小的均方根误差,RMSE为1.038。综合来看,与常用的几种植被指数相比,新型植被指数RRWVI是一个预测冬小麦LAI前景较好的指数(表2)。Table 2
表2
表2基于植被指数的LAI反演模型对比分析
Table 2Comparison and analysis of LAI inversion models based on vegetation index
| 参数 Parameter | 模型 Model | R2 | RMSE |
|---|---|---|---|
| NDVI | y = 0.1053e4.3133x | 0.78 | 1.216 |
| RVI | y = 1.3344e0.0601x | 0.59 | 1.754 |
| DVI | y = 0.296e7.4489x | 0.67 | 1.429 |
| SAVI | y = 0.1901e5.3888x | 0.71 | 1.31 |
| PRI | y = 5.0448e-21.59x | 0.66 | 1.433 |
| NVI | y = 1.7431e0.2685x | 0.49 | 1.905 |
| NPCI | y = 6.235e4.2439x | 0.56 | 1.464 |
| NDRE | y = 0.3073e5.6259x | 0.73 | 1.365 |
| RRWVI | y = 0.1614e8.0405x | 0.83 | 1.038 |
新窗口打开
2.4 模型精度验证
利用剩余的25个样本进行精度评价,计算检验样本的预测值与实测值之间的决定系数和RMSE(图7)。各个植被指数的反演模型的LAI预测值与实测值一致性均较好,检验样本的决定系数在0.54—0.86,RMSE在0.78—1.72。新构建的RRWVI模型的决定系数最高,可达0.86,RMSE为0.78,说明该植被指数稳定性较好;其次是NDVI,R2为0.842,RMSE=0.85;比值植被指数RVI、土壤调节植被指数SAVI和标准化差分红边植被指数NDRE的LAI反演精度相当,R2在0.75左右,RMSE在1.1左右;然后是NVI、DVI、NPCI的精度逐次降低,其中PRI精度最低,R2为0.544,RMSE为1.72。新构建的植被指数充分显示了红边波段带在监测冬小麦LAI上的优势,同时考虑植株水分含量对冠层光谱的影响,提高了冬小麦叶面积指数的反演精度,在所选用的植被指数中监测冬小麦多生育期的叶面积指数效果最佳。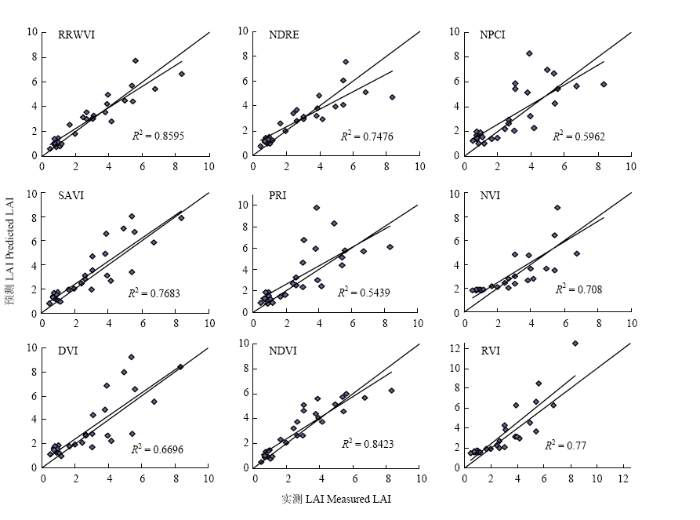 显示原图|下载原图ZIP|生成PPT
图7基于检验样本的LAI反演模型精度验证
-->Fig. 7Accuracy verification of LAI inversion model based on test samples
-->
3 讨论
叶面积指数是表征作物冠层结构的重要指标之一,可以反映作物生长发育的动态变化,也是作物遥感估产的重要中间参量。敏感光谱指数优选是区域尺度作物叶面积指数卫星遥感反演的基础。植株水分是决定作物冠层光谱特征的重要因素之一,会影响作物叶面积指数的光谱诊断能力。反演植株生理生化参数的研究中应用最多的是红边参数,通常是指680—750 nm,红边会随叶面积指数、植株水分含量、叶绿素含量等参数的变化而变化。许多****考虑到光谱指数的响应能力的不同,开展了大量用于叶面积指数反演的光谱指数研究。HATFIELD等[33]研究发现比值植被指数RVI与LAI的相关性较高,能很好的预测冬小麦LAI;GITELSON等[34]提出绿波段比值植被指数GRVI(green ratio vegetation index),利用该指数预测LAI具有较高的精度;为了解决NDVI易受土壤背景的影响的问题,RONDEAUX等[35]提出优化土壤调整植被指数OSAVI。HABOUDANE等[36]将TCARI和OSAVI两种植被指数结合构建新的植被指数TCARI/OSAVI预测作物叶绿素含量并取得较高的精度。本文尝试了将应用较为广泛的NDRE和WI进行数学组合,提出了红边抗水植被指数(RRWVI),在田间试验的支持下,开展了RRWVI、NDRE、WI与LAI的相关性对比分析,并以常用植被指数作为参考,分析了基于RRWVI的冬小麦LAI光谱反演模型精度,取得了优于常用植被指数的反演效果。本文使用的数据来源于国家精准农业示范基地开展的小区水肥控制试验,包含了2个品种、4个氮肥梯度和3个灌溉梯度,规范的田间观测确保了LAI与光谱数据的可靠性,使得本文取得了较为满意的研究效果。结果显示新型植被指数RRWVI既适用于不同的筋性品种,又适用于不同的水肥管理条件,具有较好的普适性。本文使用了2种不同的小麦筋性品种进行验证,今后将尝试使用更多的小麦品种来评价新型植被指数RRWVI的稳定性和普适性。此外,本文仅考虑了叶片水分对冠层光谱反演LAI的影响,暂未考虑叶绿素对冠层光谱的影响,有必要在今后的研究中分析LAI、叶片水分、叶片叶绿素对冠层光谱的耦合影响,从而进一步提高作物LAI的光谱诊断能力。本文构建的新型植被指数RRWVI使用的光谱波段分别为720、790、900、970 nm,近年来高光谱卫星技术发展迅速,如CHRIS、ARIES-1、HJ-1A HSI、EO-1 Hyperion等高光谱影像均具备这些波段,以及2018年发射成功的高分5号所搭载的全谱段光谱成像仪也能获取上述波段的影像,因此RRWVI在利用高光谱卫星影像进行区域尺度叶面积指数监测方面具备潜在的应用价值;此外,随着无人机技术的日益成熟,其携带的成像光谱仪具有波段更窄、波段范围更宽的特点,且空间分辨率更高,RRWVI在利用无人机成像光谱进行园区尺度监测上也具备较大潜力。我们将在后续的研究中进一步验证新型植被指数RRWVI在卫星高光谱及无人机高光谱影像上的实际应用能力。
4 结论
本文旨在分析冠层叶片水分含量对作物冠层光谱的影响,构建新型光谱指数来提高作物叶面积指数高光谱反演的精度。通过标准化差分红边指数(NDRE)、水分敏感指数(WI)与叶面积指数的相关性分析,构建了一个新型的植被指数——红边抗水植被指数(red-edge resistance water vegetable index,RRWVI),选取常用的植被指数作为参照,分析RRWVI对于冬小麦叶面积指数的响应能力。与常用的植被指数相比,本文所构建的RRWVI与LAI具有较高的相关性,有效地提高了冬小麦叶面积指数高光谱反演精度,决定系数可达0.83,取得了比NDRE、NDVI等常用植被指数更为可靠的反演效果;利用剩余的1/3样本进行精度评价,新构建的RRWVI模型的决定系数最高,R2可达0.86,RMSE为0.78,说明该植被指数稳定性较好。本文采用指数形式构建的反演模型在一定程度上避免了LAI较大时植被指数易饱和的问题。RRWVI反演冬小麦叶面积指数的同时考虑了植株水分对冠层光谱的影响,可为区域尺度作物叶面积指数的遥感监测提供一种新的方法借鉴。The authors have declared that no competing interests exist.
参考文献 原文顺序
文献年度倒序
文中引用次数倒序
被引期刊影响因子
| [1] | . Motivated by the increasing importance of hyperspectral remote sensing data, this study sought to determine whether current-generation narrow-band hyperspectral remote sensing data could better track vegetation leaf area index (LAI) than traditional broad-band multispectral data. The study takes advantage of a unique dataset, wherein field measurements of LAI were acquired at the same general time and grain size as both Landsat ETM+ and AVIRIS (Airborne Visible/Infrared Imaging Spectrometer) imagery in four different biomes. Biome types sampled included row-crop agriculture, tallgrass prairie, mixed hardwood-conifer forest, and boreal conifer forest. The effects of bandwidth, band placement, and number of bands were isolated from radiometric quality by comparing regression models derived from individual AVIRIS channels with those derived from simulated ETM+ and MODIS channels using the AVIRIS data. Models with selected subsets of individual AVIRIS channels performed better to predict LAI than those based on the broadband datasets, although the potential to overfit models using the large number of available AVIRIS bands is a concern. Models based on actual ETM+ data were generally stronger than those based on simulated ETM+ data, suggesting that, for predicting LAI, ETM+ data suffer no penalty for having lower radiometric quality. NDVI was generally not sensitive to LAI at the four sites. Band placement of broad-band sensors (e.g., simulated ETM+ and MODIS) did not affect relationships with LAI, suggesting that there is no inherent advantage to MODIS spectral properties over those of ETM+ for estimating LAI. Spectral channels in the red-edge and shortwave-infrared regions were generally more important than those in the near-infrared for predicting LAI. |
| [2] | . |
| [3] | . Leaf area index (LAI) is one of the key structural variables in terrestrial vegetation ecosystems. Remote sensing offers an opportunity to accurately derive LAI at regional scales. The anisotropy of canopy reflectance, variations in background characteristics, and variability in atmospheric conditions constitute three factors that can strongly constrain the accuracy of retrieved LAI. Based on a hybrid canopy reflectance model, a new hyperspectral directional second derivative method (DSD) is proposed in this paper. This method can estimate LAI accurately through analyzing the canopy anisotropy. The effect of the background can also be effectively removed. With the aid of a widely-accepted atmospheric model, the influence of atmospheric conditions can be minimized as well. Thus the inversion precision and the dynamic range can be markedly improved, which has been proved by numerical simulations. As the derivative method is very sensitive to random noise, we put forward an innovative filtering approach, by which the data can be de-noised in spectral and spatial dimensions synchronously. It shows that the filtering method can remove random noise effectively; therefore, the method can be applied to hyperspectral images. The study region was situated in Zhangye, Gansu Province, China; hyperspectral and multi-angular images of the study region were acquired via the Compact High-Resolution Imaging Spectrometer/Project for On-Board Autonomy (CHRIS/PROBA), on 4 June 2008. After the pre-processing procedures, the DSD method was applied, and the retrieved LAI was validated by ground reference data at 11 sites. Results show that the new LAI inversion method is accurate and effective with the aid of the innovative filtering method. |
| [4] | . 为给小麦调优栽培提供信息支持,利用卫星影像信息结合地面试验数据,通过分析小麦拔节期叶面积指数、生物量以及植株氮素含量三个群体质量指标与植被指数之间的关系,建立了基于归一化植被指数(NDVI)、比值植被指数(RVI)的小麦群体质量指标监测模型.结果表明,NDVI与叶面积指数和植株氮素含量呈现显著的正相关关系(R2分别为0.8483和0.8238),与地上部生物量间的相关性未达显著水平(R2=0.7746).RVI与叶面积指数和植株氮素含量呈线性正相关(R2=0.7651和R2=0.78),而与地上部生物量呈显著线性正相关(R2=0.8277).利用不同的试验数据对所建模型进行了检验,监测值与实测值较为吻合,根均方差(RMSE)分别为0.19、106.13 kg·ha-1和0.136%,显示模型具有较好的监测性和通用性.因此,在拔节期可以利用NDVI对叶面积指数和植株氮素含量进行监测,对地上部生物量的监测则以利用RVI数据较好. . 为给小麦调优栽培提供信息支持,利用卫星影像信息结合地面试验数据,通过分析小麦拔节期叶面积指数、生物量以及植株氮素含量三个群体质量指标与植被指数之间的关系,建立了基于归一化植被指数(NDVI)、比值植被指数(RVI)的小麦群体质量指标监测模型.结果表明,NDVI与叶面积指数和植株氮素含量呈现显著的正相关关系(R2分别为0.8483和0.8238),与地上部生物量间的相关性未达显著水平(R2=0.7746).RVI与叶面积指数和植株氮素含量呈线性正相关(R2=0.7651和R2=0.78),而与地上部生物量呈显著线性正相关(R2=0.8277).利用不同的试验数据对所建模型进行了检验,监测值与实测值较为吻合,根均方差(RMSE)分别为0.19、106.13 kg·ha-1和0.136%,显示模型具有较好的监测性和通用性.因此,在拔节期可以利用NDVI对叶面积指数和植株氮素含量进行监测,对地上部生物量的监测则以利用RVI数据较好. |
| [5] | . The Landsat 5 mission is in jeopardy. Therefore, the United States Geological Survey (USGS) is exploring ways to alleviate a data gap if both Landsat 5 and 7 missions fail prior to the planned launch of Landsat 8 (known as the Landsat Data Continuity Mission) in 2013 [Randy, 2012]. Using the Chinese HJ1-CCD remote sensing data, analyses were performed on the spectral signature of these two different sensors to investigate the substitution of existing sensors for Landsat 5 TM in certain fields of research. In particular, a comparison was made between Landsat 5 TM and the HJ1-CCD in terms of orbital parameters, imaging features and spectral response characteristics, among other characteristics. Thereafter, a comparative analysis was performed on the "at-satellite" reflectance of nine pairs of remote sensing images of different land cover in China, and a mutual quantitative relationship was established. The results indicate that Landsat 5 TM and HJ1-CCD have similar orbital parameters, and the latter has a higher time resolution with advantages in its breadth and the quantity of sensors, although both have the same spatial resolution. Regarding the imaging and spectral response characteristics, although the at-satellite reflectance of HJ1-CCD is different from that of Landsat 5 TM for red, green, blue and near infra-red bands, there is still a broad correlation between HJ1-CCD and Landsat 5 TM, and the coefficient of determination approaches unity. Therefore, a mutual complementation and substitution of the at-satellite reflectance between HJ1-CCD and Landsat 5 TM images is feasible. |
| [6] | . Crop simulation is useful for characterizing and predicting the crop growth and yield due to abiotic stress and also climate change events at the national and international levels, under different agronomic management options. Crop simulation models will gain wider acceptance if they are robust, accessible and easy to use. To simulate the growth of wheat on a daily basis using inputs of weather, soil, variety and management practices, a web-based application of the crop simulation model ‘Web InfoCrop - Wheat’ was designed and developed at the Indian Agricultural Research Institute. The Web InfoCrop – Wheat model was developed using Visual Studio Express, SQL Server, NET framework 4.0 and hosted athttp://InfoCrop.iari.res.in. This web-based model has separate modules for input variables, management conditions, and result outputs. Crop model users after registration without any payment, have the right to insert, edit or update and delete data within their private domains while the system manager alone has the administrative right to add data to the public domain, this will ensure authentic data to be available in the public domain. This is done mainly to ensure the availability of factual data to the public and also to maintain the privacy of the user data. The users can run the model to simulate the wheat crop growth and yield, at a single day interval or as defined. This web-based model performed well under different irrigation and nitrogen management practices for the observed and predicted yield and biomass with significantR2(0.958 and 0.947 respectively) and RMSE (0.054 and 1.318, respectively). Thus, the ‘Web InfoCrop – Wheat’ crop model provides an innovative and efficient approach to the evolving crop simulation model to be used as a decision support tool in the agricultural production system. |
| [7] | . The increasing number of sensor types for terrestrial remote sensing has necessitated supplementary efforts to evaluate and standardize data from the different available sensors. In this study, we assess the potential use of IKONOS, ETM+, and SPOT HRVIR sensors for leaf area index (LAI) estimation in forest stands. In situ measurements of LAI in 28 coniferous and deciduous stands are compared to reflectance in the visible, near-infrared, and shortwave bands, and also to five spectral vegetation indices (SVIs): Normalised Difference Vegetation Index (NDVI), Simple Ratio (SR), Soil Adjusted Vegetation Index (SAVI), Enhanced Vegetation Index (EVI), and Atmospherically Resistant Vegetation Index (ARVI). The three sensor types show the same predictive ability for stand LAI, with an uncertainty of about 1.0 m 2/m 2 for LAI between 0.5 and 6.9 m 2/m 2. For each sensor type, the strength of the empirical relationship between LAI and NDVI remains the same, regardless of the image processing level considered [digital counts, radiances using calibration coefficients for each sensor, top of atmosphere (TOA), and top of canopy (TOC) reflectances]. On the other hand, NDVIs based on radiance, TOA reflectance, and TOC reflectance, determined from IKONOS radiometric data, are systematically lower than from SPOT and ETM+ data. The offset is approximately 0.11 NDVI units for radiance and TOA reflectance-based NDVI, and approximately 0.20 NDVI units after atmospheric corrections. The same conclusions were observed using the other indices. SVIs using IKONOS data are always lower than those computed using ETM+ and SPOT data. Factors that may explain this behavior were investigated. Based on simulations using the SAIL bidirectional canopy reflectance model coupled with the PROSPECT leaf optical properties model (i.e., PROSAIL), we show that the spectral response in radiance of IKONOS sensor in the red band is the main factor explaining the differences in SVIs between IKONOS and the other two sensors. Finally, we conclude that, for bare soils or very sparse vegetation, radiometric data acquired by IKONOS, SPOT, and ETM+ are similar and may be used without any correction. For surfaces covered with dense vegetation, a negative offset of 10% of IKONOS NDVI should be considered. |
| [8] | . . |
| [9] | . . |
| [10] | . 叶面积指数表征叶片的疏密程度和冠层结构特征,体现植被光合、呼吸和蒸腾作用等生物物理过程的能力,是描述土壤-植被-大气之间物质和能量交换的关键参数。目前多种卫星传感器观测生成了多个区域和全球的叶面积指数标准产品。本文综述了基于光学遥感数据的叶面积指数反演进展:首先,介绍了叶面积指数的定义和在生态系统模拟中的作用;然后,阐述了基于光学遥感反演叶面积指数的基本原理;在此基础上,论述了基于植被指数经验关系和基于物理模型的两种主要遥感反演算法,讨论了2种算法的优点和存在的问题,并总结了现有的主要全球数据产品及其特点,论述了产品检验的方法和需要注意的问题;最后,总结了当前叶面积指数反演中存在的问题,并展望了其发展趋势和研究方向。 . 叶面积指数表征叶片的疏密程度和冠层结构特征,体现植被光合、呼吸和蒸腾作用等生物物理过程的能力,是描述土壤-植被-大气之间物质和能量交换的关键参数。目前多种卫星传感器观测生成了多个区域和全球的叶面积指数标准产品。本文综述了基于光学遥感数据的叶面积指数反演进展:首先,介绍了叶面积指数的定义和在生态系统模拟中的作用;然后,阐述了基于光学遥感反演叶面积指数的基本原理;在此基础上,论述了基于植被指数经验关系和基于物理模型的两种主要遥感反演算法,讨论了2种算法的优点和存在的问题,并总结了现有的主要全球数据产品及其特点,论述了产品检验的方法和需要注意的问题;最后,总结了当前叶面积指数反演中存在的问题,并展望了其发展趋势和研究方向。 |
| [11] | . |
| [12] | . 78 Validation of the MODIS collection 5 LAI product over an area of coniferous forest. 78 Analysis suggests that new product shows a much more realistic temporal LAI dynamic. 78 We find improved spatial consistency between the MODIS and upscaled LAI data. 78 Results also indicate that the MODIS LAI underestimates the upper range of field LAI. |
| [13] | . 高光谱遥感能快速无损获取植被冠层信息,是实现作物长势实时监测的重要技术。为研究不同氮磷水平下冬小麦不同生育时期叶面积指数高光谱遥感监测模型,提高叶面积指数高光谱监测精度,该研究连续5 a定位测定黄土高原旱地不同氮磷水平和不同冬小麦品种各生育时期冠层光谱反射率与叶面积指数,通过相关分析、回归分析等统计方法,构建不同生育时期冬小麦叶面积指数监测模型。结果表明:不同氮磷水平下,冬小麦叶面积指数随施肥量增加呈递增趋势,随生育时期改变呈抛物线趋势变化;随着氮磷供应量的增加,冠层光谱反射率在可见光波段显著降低2%~5%(P<0.05),在近红外波段显著增加4%~10%(P<0.05);不同生育时期叶面积指数与优化土壤调整植被指数、增强型植被指数Ⅱ、新型植被指数、修正归一化差异植被指数、修正简单比值植被指数均达极显著相关(P<0.01);拔节期、孕穗期、抽穗期、灌浆期和成熟期叶面积指数分别与优化土壤调整植被指数、增强型植被指数Ⅱ、增强型植被指数Ⅱ、修正归一化差异植被指数和修正简单比值植被指数拟合效果较好,决定系数分别为0.952、0.979、0.989、0.960和0.993;以不同年份独立数据验证模型表明,所建预测模型均有较好的验证结果,相对误差分别为13.0%、13.5%、12.8%、12.6%和14.0%,均方根误差分别为:0.313、0.336、0.316、0.316、0.324。因此,优化土壤调整植被指数、增强型植被指数Ⅱ、增强型植被指数Ⅱ、修正归一化差异植被指数和修正简单比值植被指数能有效评价拔节期、孕穗期、抽穗期、灌浆期和成熟期冬小麦叶面积指数。同时,叶面积指数分段监测模型较统一监测模型精度有所改善。该结果为实现不同肥力水平下冬小麦不同生育时期长势精确监测提供理论依据和技术支撑。 . 高光谱遥感能快速无损获取植被冠层信息,是实现作物长势实时监测的重要技术。为研究不同氮磷水平下冬小麦不同生育时期叶面积指数高光谱遥感监测模型,提高叶面积指数高光谱监测精度,该研究连续5 a定位测定黄土高原旱地不同氮磷水平和不同冬小麦品种各生育时期冠层光谱反射率与叶面积指数,通过相关分析、回归分析等统计方法,构建不同生育时期冬小麦叶面积指数监测模型。结果表明:不同氮磷水平下,冬小麦叶面积指数随施肥量增加呈递增趋势,随生育时期改变呈抛物线趋势变化;随着氮磷供应量的增加,冠层光谱反射率在可见光波段显著降低2%~5%(P<0.05),在近红外波段显著增加4%~10%(P<0.05);不同生育时期叶面积指数与优化土壤调整植被指数、增强型植被指数Ⅱ、新型植被指数、修正归一化差异植被指数、修正简单比值植被指数均达极显著相关(P<0.01);拔节期、孕穗期、抽穗期、灌浆期和成熟期叶面积指数分别与优化土壤调整植被指数、增强型植被指数Ⅱ、增强型植被指数Ⅱ、修正归一化差异植被指数和修正简单比值植被指数拟合效果较好,决定系数分别为0.952、0.979、0.989、0.960和0.993;以不同年份独立数据验证模型表明,所建预测模型均有较好的验证结果,相对误差分别为13.0%、13.5%、12.8%、12.6%和14.0%,均方根误差分别为:0.313、0.336、0.316、0.316、0.324。因此,优化土壤调整植被指数、增强型植被指数Ⅱ、增强型植被指数Ⅱ、修正归一化差异植被指数和修正简单比值植被指数能有效评价拔节期、孕穗期、抽穗期、灌浆期和成熟期冬小麦叶面积指数。同时,叶面积指数分段监测模型较统一监测模型精度有所改善。该结果为实现不同肥力水平下冬小麦不同生育时期长势精确监测提供理论依据和技术支撑。 |
| [14] | . 近年来,高光谱遥感数据广泛应用于农作物叶面积指数(LAI)反演。与常用的多光谱遥感数据相比,高光谱数据能否提高农作物LAI反演的精度和稳定性还存在争议。针对这一问题,该研究利用实测冬小麦冠层高光谱反射率数据,构造了不同光谱分辨率和波段组合的5种光谱数据。基于ACRM(a two-layer canopy reflectance model)模型、2套参数化方案及上述5种光谱数据,对冬小麦LAI进行反演,分析光谱分辨率、高光谱数据波段选择、模型参数不确定性3方面因素对LAI反演精度与稳定性的影响。研究结果表明:当波段选择适宜、模型参数不确定性较小且光谱数据分辨率较高时,LAI反演精度与稳定性更高,提高光谱分辨率对LAI反演精度的改进作用随光谱分辨率的升高而降低;反之,当高光谱数据波段选择不当或者模型参数不确定性较大时,提高光谱数据的分辨率并未提高LAI反演精度。该研究解释了"高光谱遥感数据能否提高植被参数反演精度"问题,为进一步发挥高光谱数据在农作物LAI反演中的潜力提供了科学参考。 . 近年来,高光谱遥感数据广泛应用于农作物叶面积指数(LAI)反演。与常用的多光谱遥感数据相比,高光谱数据能否提高农作物LAI反演的精度和稳定性还存在争议。针对这一问题,该研究利用实测冬小麦冠层高光谱反射率数据,构造了不同光谱分辨率和波段组合的5种光谱数据。基于ACRM(a two-layer canopy reflectance model)模型、2套参数化方案及上述5种光谱数据,对冬小麦LAI进行反演,分析光谱分辨率、高光谱数据波段选择、模型参数不确定性3方面因素对LAI反演精度与稳定性的影响。研究结果表明:当波段选择适宜、模型参数不确定性较小且光谱数据分辨率较高时,LAI反演精度与稳定性更高,提高光谱分辨率对LAI反演精度的改进作用随光谱分辨率的升高而降低;反之,当高光谱数据波段选择不当或者模型参数不确定性较大时,提高光谱数据的分辨率并未提高LAI反演精度。该研究解释了"高光谱遥感数据能否提高植被参数反演精度"问题,为进一步发挥高光谱数据在农作物LAI反演中的潜力提供了科学参考。 |
| [15] | . 文中耦合叶片辐射传输模型(PROSPECT)和冠层辐射传输模型(SAILH),基于高光谱载荷通道设置,模拟高光谱冠层反射率数据;利用模拟数据深入分析了不同植被指数与叶面积指数之间的敏感性;通过敏感性分析发现改进型叶绿素吸收植被指数(MCARI2)具备抗土壤背景因素的影响能力,而且对叶面积指数较为敏感,因此该研究建立植被指数MCARI2 与叶面积指数之间的经验统计模型,并用于高光谱数据进行叶面积指数反演;最后利用飞行同步测量的叶面积指数对反演模型进行精度分析。结果表明:相比实测叶面积指数,文中建立的反演模型约低估0.42,该反演模型能够较好的反映出地物真实叶面积指数。 . 文中耦合叶片辐射传输模型(PROSPECT)和冠层辐射传输模型(SAILH),基于高光谱载荷通道设置,模拟高光谱冠层反射率数据;利用模拟数据深入分析了不同植被指数与叶面积指数之间的敏感性;通过敏感性分析发现改进型叶绿素吸收植被指数(MCARI2)具备抗土壤背景因素的影响能力,而且对叶面积指数较为敏感,因此该研究建立植被指数MCARI2 与叶面积指数之间的经验统计模型,并用于高光谱数据进行叶面积指数反演;最后利用飞行同步测量的叶面积指数对反演模型进行精度分析。结果表明:相比实测叶面积指数,文中建立的反演模型约低估0.42,该反演模型能够较好的反映出地物真实叶面积指数。 |
| [16] | . Non-destructive monitoring of wheat nitrogen (N) status is essential for precision N management during wheat production. In this study, the quantitative correlation between leaf N concentration (LNC) and ground-based canopy hyperspectral reflectance in winter wheat was investigated. Field experiments were conducted for four years at different locations (Xinyang, Zhengzhou, and Shangshui) in China. Different N application rates, planting density, growth stages, and wheat cultivars were used. We developed a novel index (water resistance N index [WRNI]) that integrated the advantages of an index that minimizes water effects and an index sensitive to LNC. Data showed that the proposed combined index (WRNI), the ratio of the normalized difference red-edge index (NDRE) and floating-position water band index (FWBI) was both sensitive to LNC and resistant to variations in leaf water. Then, we optimized the bands of NDRE/FWBI to create an integrated narrow-band vegetable index((R735-R720) R900Rmin(930-980) (R735+R720))to trace the dynamic changes in LNC in winter wheat. Our novel index and 15 selected common indices were tested for stability across growth stages, locations, years, treatments, cultivars, and plant types in estimating LNC in winter wheat. Six of the 16 previously determined indices performed well, and R705/(R717+R491) and mND705both showed the highest coefficients of determination (R2=0.832 and 0.818, respectively) and the lowest root mean square error (RMSE=0.401 and 0.417, respectively). When compared with the optimized common indices, the novel index WRNI was most closely correlated with LNC, and the corresponding linear equation yielded R2=0.843 and RMSE=0.382 across the whole 16 datasets; this further indicated a superior trace for LNC changes under heterogeneous field conditions. These models can accurately estimate LNC in winter wheat, and the novel index WRNI is promising for detecting LNC on a regional scale in heterogeneous fields under variable climatic conditions. |
| [17] | . The Normalized Difference Vegetation Index (NDVI) is widely used for monitoring, analyzing, and mapping temporal and spatial distributions of physiological and biophysical characteristics of vegetation. It is well documented that the NDVI approaches saturation asymptotically under conditions of moderate-to-high aboveground biomass. While reflectance in the red region (ρ red) exhibits a nearly flat response once the leaf area index (LAI) exceeds 2, the near infrared (NIR) reflectance (ρ NIR) continue to respond significantly to changes in moderate-to-high vegetation density (LAI from 2 to 6) in crops. However, this higher sensitivity of the ρ NIR has little effect on NDVI values once the ρ NIR exceeds 30 %. In this paper a simple modification of the NDVI was proposed. The Wide Dynamic Range Vegetation Index, WDRVI = ( a * ρ NIR-ρ red)/( a * ρ NIR+ρ red), where the weighting coefficient a has a value of 0.1–0.2, increases correlation with vegetation fraction by linearizing the relationship for typical wheat, soybean, and maize canopies. The sensitivity of the WDRVI to moderate-to-high LAI (between 2 and 6) was at least three times greater than that of the NDVI. By enhancing the dynamic range while using the same bands as the NDVI, the WDRVI enables a more robust characterization of crop physiological and phenological characteristics. Although this index needs further evaluation, the linear relationship with vegetation fraction and much higher sensitivity to change in LAI will be especially valuable for precision agriculture and monitoring vegetation status under conditions of moderate-to-high density. It is anticipated that the new index will complement the NDVI and other vegetation indices that are based on the red and NIR spectral bands. |
| [18] | . The objective of this paper is to determine spectral bands that are best suited for characterizing agricultural crop biophysical variables. The data for this study comes from ground-level hyperspectral reflectance measurements of cotton, potato, soybeans, corn, and sunflower. Reflectance was measured in 490 discrete narrow bands between 350 and 1,050 nm. Observed crop characteristics included wet biomass, leaf area index, plant height, and (for cotton only) yield. Three types of hyperspectral predictors were tested: optimum multiple narrow band reflectance (OMNBR), narrow band normalized difference vegetation index (NDVI) involving all possible two-band combinations of 490 channels, and the soil-adjusted vegetation indices. A critical problem with OMNBR models was that of “over fitting” (i.e., using more spectral channels than experimental samples to obtain a highly maximum R 2 value). This problem was addressed by comparing the R 2 values of crop variables with the R 2 values computed for random data of a large sample size. The combinations of two to four narrow bands in OMNBR models explained most (64% to 92%) of the variability in crop biophysical variables. The second part of the paper describes a rigorous search procedure to identify the best narrow band NDVI predictors of crop biophysical variables. Special narrow band lambda (λ 1) versus lambda (λ 2) plots of R 2 values illustrate the most effective wavelength combinations (λ 1 and λ 2) and bandwidths (Δλ 1 and Δλ 2) for predicting the biophysical quantities of each crop. The best of these two-band indices were further tested to see if soil adjustment or nonlinear fitting could improve their predictive accuracy. The best of the narrow band NDVI models explained 64% to 88% variability in different crop biophysical variables. A strong relationship with crop characteristics is located in specific narrow bands in the longer wavelength portion of the red (650 nm to 700 nm), with secondary clusters in the shorter wavelength portion of green (500 nm to 550 nm), in one particular section of the near-infrared (900 nm to 940 nm), and in the moisture sensitive near-infrared (centered at 982 nm). This study recommends a 12 narrow band sensor, in the 350 nm to 1,050 nm range of the spectrum, for optimum estimation of agricultural crop biophysical information. |
| [19] | . The spectral behavior of a cotton canopy with four soil types alternately inserted underneath was examined at various levels of vegetation density. Measured composite spectra, representing various mixtures of vegetation with different soil backgrounds, were compared with existing measures of greenness, including the NIR-red band ratios, the perpendicular vegetation index (PVI), and the greenness vegetation index (GVI). Observed spectral patterns involving constant vegetation amounts with different soil backgrounds could not be explained nor predicted by either the ratio or the orthogonal greenness measures. All greenness measures were found to be strongly dependent on soil brightness. Furthermore, soil-induced greenness changes became greater with increasing amounts of vegetation up to 60% green cover. The results presented suggests that soil and plant spectra interactively mix in a nonadditive, partly correlated manner to produce composite canopy spectra. |
| [20] | . |
| [21] | . Recent studies have demonstrated the usefulness of optical indices from hyperspectral remote sensing in the assessment of vegetation biophysical variables both in forestry and agriculture. Those indices are, however, the combined response to variations of several vegetation and environmental properties, such as Leaf Area Index (LAI), leaf chlorophyll content, canopy shadows, and background soil reflectance. Of particular significance to precision agriculture is chlorophyll content, an indicator of photosynthesis activity, which is related to the nitrogen concentration in green vegetation and serves as a measure of the crop response to nitrogen application. This paper presents a combined modeling and indices-based approach to predicting the crop chlorophyll content from remote sensing data while minimizing LAI (vegetation parameter) influence and underlying soil (background) effects. This combined method has been developed first using simulated data and followed by evaluation in terms of quantitative predictive capability using real hyperspectral airborne data. Simulations consisted of leaf and canopy reflectance modeling with PROSPECT and SAILH radiative transfer models. In this modeling study, we developed an index that integrates advantages of indices minimizing soil background effects and indices that are sensitive to chlorophyll concentration. Simulated data have shown that the proposed index Transformed Chlorophyll Absorption in Reflectance Index/Optimized Soil-Adjusted Vegetation Index (TCARI/OSAVI) is both very sensitive to chlorophyll content variations and very resistant to the variations of LAI and solar zenith angle. It was therefore possible to generate a predictive equation to estimate leaf chlorophyll content from the combined optical index derived from above-canopy reflectance. This relationship was evaluated by application to hyperspectral CASI imagery collected over corn crops in three experimental farms from Ontario and Quebec, Canada. The results presented here are from the L'Acadie, Quebec, Agriculture and Agri-Food Canada research site. Images of predicted leaf chlorophyll content were generated. Evaluation showed chlorophyll variability over crop plots with various levels of nitrogen, and revealed an excellent agreement with ground truth, with a correlation of r 2=.81 between estimated and field measured chlorophyll content data. |
| [22] | . <P class=04 ><SPAN lang=EN-US ><?xml:namespace prefix = o ns = "urn:schemas-microsoft-com:office:office" /><o:p></P><P class=04 ><SPAN >利用</SPAN><SPAN lang=EN-US >FieldSpec FR2500</SPAN><SPAN >光谱仪测定了不同氮素处理冬小麦冠层光谱,分析其红边特征变化规律及与农学成分的相关关系。结果表明,波长</SPAN><SPAN lang=EN-US >550 nm</SPAN><SPAN >、</SPAN><SPAN lang=EN-US >680 nm</SPAN><SPAN >、</SPAN><SPAN lang=EN-US >980 nm</SPAN><SPAN >、</SPAN><SPAN lang=EN-US >1100 nm</SPAN><SPAN >与</SPAN><SPAN lang=EN-US >350</SPAN><SPAN >~</SPAN><SPAN lang=EN-US >680 nm</SPAN><SPAN >和</SPAN><SPAN lang=EN-US >750</SPAN><SPAN >~</SPAN><SPAN lang=EN-US >1100 nm</SPAN><SPAN >可作为氮素营养诊断的敏感特征点与波段范围。随着施氮量的提高,拔节期、抽穗期以及灌浆期的红边位置(</SPAN><SPAN lang=EN-US >REP</SPAN><SPAN >)、红谷位置(</SPAN><SPAN lang=EN-US >Lo</SPAN><SPAN >)与光谱反射率一阶微分极大值(</SPAN><SPAN lang=EN-US >FD_Max</SPAN><SPAN >)均增大,红边宽度(</SPAN><SPAN lang=EN-US >Lwidth</SPAN><SPAN >)则有减小的趋势。总体上看,施氮与无氮处理在整个生育期均存在较大差异,施氮处理之间差异较小。冠层反射光谱的红边位置、红谷位置、随生育期向长波方向移动,呈现</SPAN><SPAN lang=EN-US >“</SPAN><SPAN >红移</SPAN><SPAN lang=EN-US >”</SPAN><SPAN >现象;从抽穗期开始逐渐减小,呈现</SPAN><SPAN lang=EN-US >“</SPAN><SPAN >蓝移</SPAN><SPAN lang=EN-US >”</SPAN><SPAN >现象。冬小麦红边参数中红边位置与农学组分之间的相关性优于其他参数,除与地上部生物量正相关显著外,与叶面积指数、叶含水率、叶绿素含量、叶可溶性蛋白含量、叶鲜重、叶含氮量均呈正相关且达到极显著水平。红谷位置则与叶面积指数、叶含水率、叶绿素含量、叶鲜重以及</SPAN><SPAN lang=EN-US >SPAD</SPAN><SPAN >值呈极显著正相关;与可溶性蛋白呈显著正相关。红边宽度与叶面积指数、叶含水率、叶氮含量、叶绿素含量以及叶鲜重均呈极显著正相关;与可溶性蛋白含量呈显著正相关。反射率一阶导数极大值与叶面积指数、叶含水率、叶鲜重呈极显著正相关,与叶含氮量极显著负相关。通过红边参数与农学组分稳定良好的数学关系,可以对农学组分进行预测估算。</SPAN><SPAN lang=EN-US ><o:p></o:p></SPAN></P></o:p></SPAN> . <P class=04 ><SPAN lang=EN-US ><?xml:namespace prefix = o ns = "urn:schemas-microsoft-com:office:office" /><o:p></P><P class=04 ><SPAN >利用</SPAN><SPAN lang=EN-US >FieldSpec FR2500</SPAN><SPAN >光谱仪测定了不同氮素处理冬小麦冠层光谱,分析其红边特征变化规律及与农学成分的相关关系。结果表明,波长</SPAN><SPAN lang=EN-US >550 nm</SPAN><SPAN >、</SPAN><SPAN lang=EN-US >680 nm</SPAN><SPAN >、</SPAN><SPAN lang=EN-US >980 nm</SPAN><SPAN >、</SPAN><SPAN lang=EN-US >1100 nm</SPAN><SPAN >与</SPAN><SPAN lang=EN-US >350</SPAN><SPAN >~</SPAN><SPAN lang=EN-US >680 nm</SPAN><SPAN >和</SPAN><SPAN lang=EN-US >750</SPAN><SPAN >~</SPAN><SPAN lang=EN-US >1100 nm</SPAN><SPAN >可作为氮素营养诊断的敏感特征点与波段范围。随着施氮量的提高,拔节期、抽穗期以及灌浆期的红边位置(</SPAN><SPAN lang=EN-US >REP</SPAN><SPAN >)、红谷位置(</SPAN><SPAN lang=EN-US >Lo</SPAN><SPAN >)与光谱反射率一阶微分极大值(</SPAN><SPAN lang=EN-US >FD_Max</SPAN><SPAN >)均增大,红边宽度(</SPAN><SPAN lang=EN-US >Lwidth</SPAN><SPAN >)则有减小的趋势。总体上看,施氮与无氮处理在整个生育期均存在较大差异,施氮处理之间差异较小。冠层反射光谱的红边位置、红谷位置、随生育期向长波方向移动,呈现</SPAN><SPAN lang=EN-US >“</SPAN><SPAN >红移</SPAN><SPAN lang=EN-US >”</SPAN><SPAN >现象;从抽穗期开始逐渐减小,呈现</SPAN><SPAN lang=EN-US >“</SPAN><SPAN >蓝移</SPAN><SPAN lang=EN-US >”</SPAN><SPAN >现象。冬小麦红边参数中红边位置与农学组分之间的相关性优于其他参数,除与地上部生物量正相关显著外,与叶面积指数、叶含水率、叶绿素含量、叶可溶性蛋白含量、叶鲜重、叶含氮量均呈正相关且达到极显著水平。红谷位置则与叶面积指数、叶含水率、叶绿素含量、叶鲜重以及</SPAN><SPAN lang=EN-US >SPAD</SPAN><SPAN >值呈极显著正相关;与可溶性蛋白呈显著正相关。红边宽度与叶面积指数、叶含水率、叶氮含量、叶绿素含量以及叶鲜重均呈极显著正相关;与可溶性蛋白含量呈显著正相关。反射率一阶导数极大值与叶面积指数、叶含水率、叶鲜重呈极显著正相关,与叶含氮量极显著负相关。通过红边参数与农学组分稳定良好的数学关系,可以对农学组分进行预测估算。</SPAN><SPAN lang=EN-US ><o:p></o:p></SPAN></P></o:p></SPAN> |
| [23] | . <p>通过对不同氮肥条件下的小麦植株由上而下进行器官疏剪,分析了不同处理下冠层光谱反射率及其红边参数的变化。结果表明,冠层光谱反射率因不同肥力、不同疏剪处理而有较大的差异,表现出不同程度的红边的“红移”和“蓝移”现象。各处理的红边曲线形状均出现双峰现象,表现为第二个峰值高于第一个峰值,并且均为N1>N2>N0。相关分析表明,随着由上而下的疏剪处理,不同叶位叶片光谱反射率对冠层光谱的贡献增加,并且其红边参数与相应的叶片全氮含量的相关系数也增加,部分达到显著或极显著相关水平。该结果为利用下部缺素敏感叶片的光谱特征进行小麦养分的及时补充提供了可靠的理论依据。</p> . <p>通过对不同氮肥条件下的小麦植株由上而下进行器官疏剪,分析了不同处理下冠层光谱反射率及其红边参数的变化。结果表明,冠层光谱反射率因不同肥力、不同疏剪处理而有较大的差异,表现出不同程度的红边的“红移”和“蓝移”现象。各处理的红边曲线形状均出现双峰现象,表现为第二个峰值高于第一个峰值,并且均为N1>N2>N0。相关分析表明,随着由上而下的疏剪处理,不同叶位叶片光谱反射率对冠层光谱的贡献增加,并且其红边参数与相应的叶片全氮含量的相关系数也增加,部分达到显著或极显著相关水平。该结果为利用下部缺素敏感叶片的光谱特征进行小麦养分的及时补充提供了可靠的理论依据。</p> |
| [24] | . Variable-rate technologies and site-specific crop nutrient management require real-time spatial information about the potential for response to in-season crop management interventions. Thermal and spectral properties of canopies can provide relevant information for non-destructive measurement of crop water and nitrogen stresses. In previous studies, foliage temperature was successfully estimated from canopy-scale (mixed foliage and soil) temperatures and the multispectral Canopy Chlorophyll Content Index (CCCI) was effective in measuring canopy-scale N status in rainfed wheat ( Triticum aestivum L.) systems in Horsham, Victoria, Australia. In the present study, results showed that under irrigated wheat systems in Maricopa, Arizona, USA, the theoretical derivation of foliage temperature unmixing produced relationships similar to those in Horsham. Derivation of the CCCI led to an r 2 relationship with chlorophyll a of 0.53 after Zadoks stage 43. This was later than the relationship ( r 2 02=020.68) developed for Horsham after Zadoks stage 33 but early enough to be used for potential mid-season N fertilizer recommendations. Additionally, ground-based hyperspectral data estimated plant N (g02kg 611 ) in Horsham with an r 2 02=020.86 but was confounded by water supply and N interactions. By combining canopy thermal and spectral properties, varying water and N status can potentially be identified eventually permitting targeted N applications to those parts of a field where N can be used most efficiently by the crop. |
| [25] | . Water Index WI (R900/R970) was used for the estimation of plant water concentration (PWC) by ground-based, reflectance measurements. Reflectance and PWC were measured for adult plants growing in the field throughout an annual cycle and in potted seedlings submitted to progressive desiccation. The species studied were characteristicly Mediterranean: Pinus halepensis, Quercus ilex, Quercus coccifera, Arbutus unedo, Cistus albidus, Cistus monspeliensis, Phillyrea angustifolia, Pistacia lentiscus and Brachypodium retusum . WI was significantly correlated with PWC when all the species were considered together, and with almost all the species considered individually, especially when a wider range of PWC was obtained by extreme dessication of experimental plants. The correlations increased when normalizing WI by NDVI. The wavelength of the trough corresponding to water absorption band tended to shift from 970-980 nm to lower wavelengths 930-950 nm with decreasing PWCs. Infrared measurement of plant temperature and T leaf - T air provided worse assessment of PWC. A simple radiometer measuring plant reflectance at 680, 900, and 970nm could speed up the measurement of PWC, and be useful in wildfire risk evaluation and drought assessment. |
| [26] | . This paper introduces yellowness index (YI) as a measure for chlorosis of leaves in stressed plants. YI provides a measure of the change in shape of the reflectance spectra between the maximum near 0.55 mu m and the minimum near 0.65 mu m. Quantitatively, YI is a simple, three-point approximation of the second derivative of the spectra, calculated using a finite divided difference approximation. YI is compared with two vegetation indices based on spectral changes in the region of the red edge, VI and NDVI. For manganese-deficient soybean leaves, YI, VI and NDVI were all closely related to leaf chlorophyll concentrations. YI is calculated from wavelengths in the visible that are thought to be less sensitive to changes in leaf structure or water content. Because YI is an approximation of a spectral second derivative, it should be less sensitive to atmospheric effects than many other vegetation indices. Finally, although the results reported here are promising, they are based on leaf-level observations and must be verified at the canopy level for remote sensing applications. An example of the correlation between NDVI and YI in AVIRIS data is given. |
| [27] | . |
| [28] | . Spectral properties of a wheat canopy with vegetation fraction (VF) from 0% to 100% in visible and near-infrared (NIR) ranges of the spectrum were studied in order to devise a technique for remote estimation of VF. When VF was <60%, from emergence till middle of the elongation stage, four distinct, and quite independent, spectral bands of reflectance existed in the visible range of the spectrum: 400 to 500 nm, 530 to 600 nm, near 670 nm, and around 700 nm. When VF was between 60% and 100%, reflectance in the NIR leveled off or even decreases with an increase of VF. The decreased reflectance in the NIR, occurring at or near the midseason, can be a limiting factor in the use of that spectral region for VF estimation. It was found that for VF>60%, the information content of reflectance spectra in visible range can be expressed by only two independent pairs of spectral bands: (1) the blue from 400 to 500 nm and the red near 670 nm; (2) the green around 550 nm and the red edge region near 700 nm. We propose using only the visible range of the spectrum to quantitatively estimate VF. The green (as well as a 700-nm band) and the red (near 670 nm) reflectances were used in developing new indices, which were linearly proportional to wheat VF ranging from 0% to 100%. The Atmospherically Resistant Vegetation Index (ARVI) concept was used to correct indices for atmospheric effects. Visible Atmospherically Resistant Index in the form VARI=( R green R red)/( R green+ R red R blue) was found to be minimally sensitive to atmospheric effects allowing estimation of VF with an error of <10% in a wide range of atmospheric optical thickness. Validation of the newly suggested technique was carried out using wheat independent data sets and reflectance data obtained for cornfields in Nebraska. Predicted green VF was compared with retrieved from digital images. Despite the fact that the reflectance contrast among the visible channels is much smaller than between the visible and NIR, the sensitivity of suggested indices to moderate to high values of VF is much higher than for the Normalized Difference Vegetation Index (NDVI), and the error in VF prediction did not exceed 10%. Suggested indices will complement the widely used NDVI, ARVI, Soil Adjusted Vegetation Index (SAVI) and others, which are based on the red and the NIR bands in VF estimation, and also Green Atmospherically Resistant Index (GARI), which is based on the green and the NIR bands. |
| [29] | . |
| [30] | . Leaf pigment content can provide valuable insight into the physiological performance of leaves. Measurement of spectral reflectance provides a fast, nondestructive method for pigment estimation. A large number of spectral indices have been developed for estimation of leaf pigment content. However, in most cases these indices have been tested for only one or at most a few related species and thus it is not clear whether they can be applied across species with varying leaf structural characteristics. Our objective in this study was to develop spectral indices for prediction of leaf pigment content that are relatively insensitive to species and leaf structure variation and thus could be applied in larger scale remote-sensing studies without extensive calibration. We also quantified the degree of spectral interference between pigments when multiple pigments occur within the same leaf tissue. We found that previously published spectral indices provided relatively poor correlations with leaf chlorophyll content when applied across a wide range of species and plant functional types. Leaf surface reflectance appeared to be the most important factor in this variation. By developing a new spectral index that reduces the effect of differences in leaf surface reflectance, we were able to significantly improve the correlations with chlorophyll content. We also found that an index based on the first derivative of reflectance in the red edge region was insensitive to leaf structural variation. The presence of other pigments did not significantly affect estimation of chlorophyll from spectral reflectance. Previously published carotenoid and anthocyanin indices performed poorly across the whole data set. However, we found that the photochemical reflectance index (PRI, originally developed for estimation of xanthophyll cycle pigment changes) was related to carotenoid/chlorophyll ratios in green leaves. This result has important implications for the interpretation of PRI measured at both large and small scales. Our results demonstrate that spectral indices can be applied across species with widely varying leaf structure without the necessity for extensive calibration for each species. This opens up new possibilities for assessment of vegetation health in heterogeneous natural environments. |
| [31] | . We followed diurnal and seasonal changes in physiology and spectral reflectance of leaves throughout the canopies of sunflower plants grown in control, nitrogen (N)-limited, and water-stressed plots. Leaves from control sunflower plants had significantly higher levels of nitrogen, chlorophyll (chl), ribulose bis phosphate carboxylase / oxygenase (RuBPCase) activity and photosynthetic rates and lower starch content and leaf thickness than N-limited plants. Water-stressed plants had the highest N and chl contents (on an area basis). They also had the lowest water potential and photosynthetic rates, in spite of maintaining high RuBPCase activities. Leaves from stressed plants (especially N-limited) had significantly higher reflectances in the visible wavelengths and lower in the near IR than leaves from control plants. The only clear trend across canopy levels was the higher reflectance at all wavelengths but especially in the visible of the lower (oldest) leaves. NDVI-like parameters were useful in distinguishing stress and control leaves over the growing season. However, several narrow-band indices provided better physiological information than NDVI. The physiological reflectance index (PRI) ( R 550 R 530 / R 550 + R 530 ) followed diurnal changes in xanthophyll pigments and photosynthetic rates of control and N-limited leaves. The maximum of the first derivative of reflectance in the green ( dG ) was correlated with diurnal photosynthetic rate, and with seasonal chl and N changes. The normalized pigment chlorophyll ratio Index (NPCI) ( R 680 R 430 / R 680 + R 430 ) varied with total pigments / chl. The water band index (WBI) ( R 970 / R 902 ) followed water status. The normalized ratio between the maxima of the first derivatives of reflectances at the red edge and green regions (EGFN) was correlated with chl and N content. Principal components analysis yielded several indicators of physiological status. The first principal component was higher in control leaves, the second was higher in N-limited leaves, and the third was higher in water-limited leaves. Discriminant analysis based on the combination of several narrow-band spectral indices clearly separated leaves into the three treatment groups. These results illustrate the promise of narrow-band spectroradiometry for assessing the physiological state of vegetation. |
| [32] | . We present a new “physiological reflectance index” (PRI) isolated from narrow waveband spectral measurements of sunflower canopies. This index correlates with the epoxidation state of the xanthophyll cycle pigments and with the efficiency of photosynthesis in control and nitrogen stress canopies, but not in water stress canopies undergoing midday wilting. It is analogous in formulation to the broadband normalized difference vegetation index (NDVI) and uses reflectance at 531 nm and at a reference wavelength to minimize complications associated with diurnal sun angle changes. In conjunction with other methods, this index may lead to improved remote and ground-based estimates of canopy photosynthetic function. |
| [33] | . Several vegetative indices were analysed for their sensitivity and stability to green-leaf-area index (LAI) changes over various planting dates and irrigation frequencies of wheat grown at Phoenix, Arizona, from 1978 to 1980. Seasonal patterns of greenness showed that values saturated at LAI values above 4 0 did not return to the pre-emergence bare-soil value at senescence, and were not uniquely related to LAI over the various planting dates. Regressions of individual MSS band reflectances against LAI also showed that there was not a unique relation between any of the bands and LAI. However, the near-infrared/red reflectance ratio was stable over all planting dates and could be used successfully over a number of years and locations |
| [34] | . Most animals use a “green” spectral range to remotely sense the presence and vitality of vegetation. While humans possess the same ability in their eyes, man-made space-borne sensors that sense evolution of global vegetation, have so far used a combination of the red and near infrared channels instead. In this article we challenge this approach, using measurements of reflectance spectra from 400 nm to 750 nm with spectral resolution of 2 nm, with simultaneous determination of pigment concentrations of mature and autumn senescing leaves. We show that, for a wide range of leaf greenness, the maximum sensitivity of reflectance coincides with the red absorption maximum of chlorophyll- a (Chl- a ) at 670 nm. However, for yellow-green to green leaves (with Chl- a more than 3–5 μg/cm 2 ), the reflectance near 670 nm is not sensitive to chlorophyll concentration because of saturation of the relationship of absorptions versus chlorophyll concentration. Maximum sensitivity of Chl- a concentration for a wide range of its variation (0.3–45 μg/cm 2 ) was found, not surprisingly so, around the green band from 520 nm to 630 nm and also near 700 nm. We found that the inverse of the reflectance in the green band was proportional to Chl- a concentration with correlation r 2 > 0.95. This band will be present on several future satellite sensors with a global view of vegetation (SeaWiFS to be launched in 1996, Polder on ADEOS-1 also in 1996, and MODIS on EOS in 1998 and 2000). New indexes that use the green channel and are resistant to atmospheric effects are developed. A green ja:math was tested for a range of Chl- a from 0.3 μg/cm 2 to 45 μg/cm 2 , and found to have an error in the chlorophyll a derivation at leaf level of less than 3 μg/cm 2 . The new index has wider dynamic range than the NDVI and is, on average, at least five times more sensitive to Chl- a concentration. A green atmospherically resistant vegetation index (GARI), tailored on the concept of ARVI (Kaufman and Tanré, 1992), is developed and is expected to be as resistant to atmospheric effects as ARVI but more sensitive to a wide range of Chl- a concentrations. While NDVI and ARVI are sensitive to vegetation fraction and to rate of absorption of photosynthetic solar radiation, a green vegetation index like GARI should be added to sense the concentration of chlorophyll, to measure the rate of photosynthesis and to monitor plant stress. |
| [35] | . The sensitivity of the normalized difference vegetation index (NDVI) to soil background and atmospheric effects has generated an increasing interest in the development of new indices, such as the soil-adjusted vegetation index (SAVI), transformed soil-adjusted vegetation index (TSAVI), atmospherically resistant vegetation index (AR VI), global environment monitoring index (GEMI), modified soil-adjusted vegetation index (MSAVI), which are less sensitive to these external influences. These indices are theoretically more reliable than NDVI, although they are not yet widely used with satellite data. This article focuses on testing and comparing the sensitivity of NDVI, SAVI, TSAVI, MSAVI and GEMI to soil background effects. Indices are simulated with the SAIL model for a large range of soil reflectances, including sand, clay, and dark peat, with additional variations induced by moisture and roughness. The general formulation of the SAVI family of indices with the form VI = (NIR - R) / (NIR + R + X) is also reexamined. The value of the parameter X is critical in the minimization of soil effects. A value of X = 0.16 is found as the optimized value. Index performances are compared by means of an analysis of variance. |
| [36] | . A growing number of studies have focused on evaluating spectral indices in terms of their sensitivity to vegetation biophysical parameters, as well as to external factors affecting canopy reflectance. In this context, leaf and canopy radiative transfer models are valuable for modeling and understanding the behavior of such indices. In the present work, PROSPECT and SAILH models have been used to simulate a wide range of crop canopy reflectances in an attempt to study the sensitivity of a set of vegetation indices to green leaf area index (LAI), and to modify some of them in order to enhance their responsivity to LAI variations. The aim of the paper was to present a method for minimizing the effect of leaf chlorophyll content on the prediction of green LAI, and to develop new algorithms that adequately predict the LAI of crop canopies. Analyses based on both simulated and real hyperspectral data were carried out to compare performances of existing vegetation indices (Normalized Difference Vegetation Index [NDVI], Renormalized Difference Vegetation Index [RDVI], Modified Simple Ratio [MSR], Soil-Adjusted Vegetation Index [SAVI], Soil and Atmospherically Resistant Vegetation Index [SARVI], MSAVI, Triangular Vegetation Index [TVI], and Modified Chlorophyll Absorption Ratio Index [MCARI]) and to design new ones (MTVI1, MCARI1, MTVI2, and MCARI2) that are both less sensitive to chlorophyll content variations and linearly related to green LAI. Thorough analyses showed that the above existing vegetation indices were either sensitive to chlorophyll concentration changes or affected by saturation at high LAI levels. Conversely, two of the spectral indices developed as a part of this study, a modified triangular vegetation index (MTVI2) and a modified chlorophyll absorption ratio index (MCARI2), proved to be the best predictors of green LAI. Related predictive algorithms were tested on CASI (Compact Airborne Spectrographic Imager) hyperspectral images and, then, validated using ground truth measurements. The latter were collected simultaneously with image acquisition for different crop types (soybean, corn, and wheat), at different growth stages, and under various fertilization treatments. Prediction power analysis of proposed algorithms based on MCARI2 and MTVI2 resulted in agreements between modeled and ground measurement of non-destructive LAI, with coefficients of determination ( r 2) being 0.98 for soybean, 0.89 for corn, and 0.74 for wheat. The corresponding RMSE for LAI were estimated at 0.28, 0.46, and 0.85, respectively. |
