 ,1,2,3, 孙亚楠1,2,31
 2
3
Analysis of Drought Characteristics and Its Trend Change in Shaanxi Province Based on SPEI and MI
DING YiBo1, XU JiaTun1,2,3, LI Liang1,2,3, CAI HuanJie,1,2,3, SUN YaNan1,2,3通讯作者:
责任编辑: 李云霞
收稿日期:2019-03-22接受日期:2019-07-19网络出版日期:2019-12-01
| 基金资助: |
Received:2019-03-22Accepted:2019-07-19Online:2019-12-01
作者简介 About authors
丁怡博,E-mail:dingyiboxbnl@nwafu.edu.cn

摘要
关键词:
Abstract
Keywords:
PDF (3334KB)元数据多维度评价相关文章导出EndNote|Ris|Bibtex收藏本文
本文引用格式
丁怡博, 徐家屯, 李亮, 蔡焕杰, 孙亚楠. 基于SPEI和MI分析陕西省干旱特征及趋势变化[J]. 中国农业科学, 2019, 52(23): 4296-4308 doi:10.3864/j.issn.0578-1752.2019.23.010
DING YiBo, XU JiaTun, LI Liang, CAI HuanJie, SUN YaNan.
0 引言
【研究意义】干旱是一种最为频繁和最为复杂的自然灾害,干旱的影响程度较大且持续时间较长,对人类社会的影响通常持续几个月甚至几年,造成粮食减产、饥饿和土地退化等灾害[1,2]。农业是对干旱影响最敏感且受影响程度最大的产业,日照、气温和水分都直接影响农业生产的状况和水平[3]。中国黄土高原是全球干旱的严重地区[4],陕西省部分区域正处于黄土高原,具有典型的大陆性季风气候,南北地域差异较大,气候多变,旱涝灾害多,农业生产极易受到影响,干旱频发、持续时间长,破坏了农作物正常生长机制[5] 。由于CMIP5模式输出未来的RCP情景数据,缺乏足够的气象因子通过彭曼公式计算考作物蒸发蒸腾量(ET0)。因此,探究在未来气象数据条件下能准确模拟未来干旱指数的方法,为研究未来干旱变化提供借鉴和参考。利用此方法分析陕西省过去与未来长时间序列干旱变化,为分析未来气候变化提供依据。【前人研究进展】目前干旱分析研究中,常选用MCKEE等[6]提出的标准化降水指数(SPI)和RAYNE [7]提出的帕尔默综合气象干旱指数(PDSI)。VICENTE-SERRANO等[8]考虑到SPI只选用降水气象因子反映干旱的不足,在基础上进行改进提出标准化降水蒸散指数(SPEI)。当前干旱指数方面的探究主要集中在结合历史气象数据对研究区域干旱进行分析,如赵兴凯等[9] 利用SPEI研究陕北黄土区的气候变化对土壤水分的影响,在其研究中标准化降水蒸散指数(SPEI)可消除降水的时空差异,对干旱变化反映敏感,能很好地反映不同区域和时段的干旱状况;孙滨峰等[10]利用SPEI对东北干旱时空特征进行分析。尽管SPEI被广泛应用于区域干旱评价当中,但该指标也存在一些不足,一些研究****对该指标进行了一些改进,如ZHANG等[11,12]在作物需水量计算部分增加了土壤含水量、径流量、积融雪等因子,提高了考虑区域水文循环物理过程对干旱发生发展趋势影响的准确性。曹兴等[13]对中天山北坡相对干旱指数(MI)进行变化趋势分析,发现MI优点在于综合考虑降水、温度对水分收支的影响;马柱国等[14]对中国北方湿润状况的趋势分析,MI作为一个理想的指标在中国典型干旱区研究中得到较好的应用。同时也有部分研究结合全球气候模式输出气象数据(CMIP5)对干旱进行分析,如赵天保等[15]基于CMIP5多模式对全球典型干旱半干旱区气候变化研究。未来气候变化可以被认为是影响未来干旱的主要因素。作物生长对干旱程度有敏感的响应,干旱程度对于农业生产具有重要的影响。段春锋等[16]和曹红霞等[17]计算了西北地区气象因子与ET0的偏相关系数,认为ET0的影响程度大小依次为风速、日照时数、气温和相对湿度。而王升等[18]分析了不同气象因子的引入对不同模型输出结果准确度的影响,结果表明在气温基础上引入日照时数对精度提升最为显著。【本研究切入点】目前很少有研究基于气象的历史数据和CMIP5模式输出的未来预测数据计算干旱指数。根据干旱指数的统计值对过去和未来长时间序列的时空分布进行系统研究,需深入研究未来不同RCP情景(不同CO2排放浓度)的干旱变化特征,用于预测未来气候变化下陕西省干旱特征变化。【拟解决的关键问题】本研究对陕西省各站点61年历史数据进行训练和检验,比较各模型模拟精度用以寻找在CMIP5模式输出的未来气候条件下可准确模拟ET0进而计算干旱指数的方法。分析陕西省过去和未来长时间序列干旱时空趋势变化。为陕西省水资源调配及农林生态建设提供科学依据。1 材料与方法
1.1 研究区域
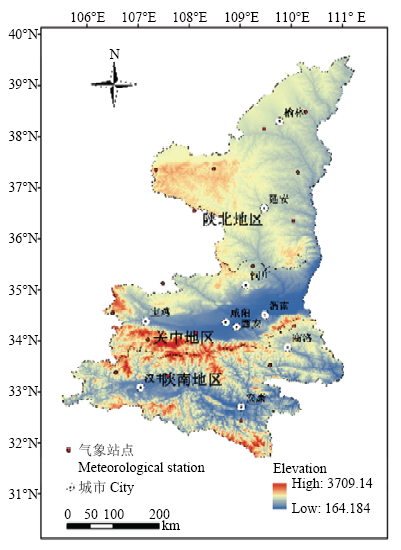
陕西省(105°29′—111°15′E,31°42′—39°35′N)位于中国西北地区东部的黄河中游,全省总面积为20.58万km2,以北山和秦岭为界,全省分为陕北高原、关中平原和秦巴山地三大地貌区。地处内陆中纬度地带,远离水汽源地的地理位置,使其形成显著的大陆性季风气候。全省年平均气温11.6℃,平均降水653 mm,主要集中于全年的7—9月,年均蒸发量1 608 mm。多年平均地表径流量425.8亿m3,水资源总量445亿m3。水资源时空分布严重不均,内流水系主要分布在陕北北部的风沙草滩区,占全省总面积的2.3%,外流水系约占全省面积的97.7%,以秦岭为界,分属于黄河、长江两大流域。冬季是枯水期,夏秋为丰水期。1.2 数据来源与处理
本文所研究数据主要来源气象站数据和GCM数据:选取陕西省18个气象站点(延长、绥德、吴旗、定边、靖边、神木、榆林、华山、武功、太白、陇县、洛川、长武、安康、商县、佛坪、汉中和留坝)(图1)的1958—2018年逐日气象观测数据作为实测气象站数据,由中国气象资料共享服务网下载(图1
 新窗口打开|下载原图ZIP|生成PPT
图1陕西省气象站点分布
Fig. 1Distribution of meteorological stations in Shaanxi Province
GCM数据来源于PCMDI提供的CMIP5模型中RCP2.6和RCP8.5情景下的输出气象数据(
Table 1
表1
表1CMIP5全球气候模式基本信息
Table 1
| 序号 Serial number | 模式名称 Mode name | 模式所在国家 Mode of country |
|---|---|---|
| 1 | bcc-csm1-1 | 中国China |
| 2 | CanESM2 | 加拿大Canada |
| 3 | CSIRO-Mk3-6-0 | 澳大利亚Australia |
| 4 | HadGEM2-ES | 英国United Kingdom |
| 5 | MPI-ESM-LR | 德国Germany |
| 6 | MRI-CGCM3 | 日本Japan |
新窗口打开|下载CSV
1.3 研究方法
1.3.1 参考作物蒸发蒸腾量计算方法(1)Penman-Monteith公式
FAO P-M模型计算ET0的标准方法[20],表达式为
式中,Rn为太阳净辐射(MJ·m-2·d-1);G为土壤热通量(MJ·m-2·d-1);△为饱和水汽压-温度曲线斜率(kg·Pa·℃-1);γ为湿度计常数(kg·Pa·℃-1);u2为2 m高度处的风速(m·s-1);es为饱和水汽压(kPa);ea为实际水汽压,(kPa);T为2 m高度处平均气温(℃)。
(2)Hargreaves模型[21]
式中,ET0为Hargreaves模型计算的参考作物蒸发蒸腾量(mm·d-1);Ra为大气顶层辐射蒸发(MJ·m-2·d-1),λ为水汽化潜热(λ=2.45 MJ·kg-1);Tmean、Tmax和Tmin为平均温度、最高温度和最低温度(℃)。
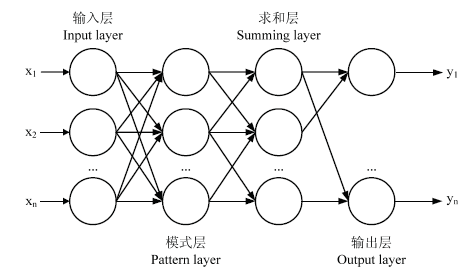
(3)广义回归神经网络模型(GRNN)
广义回归神经网络模型(GRNN neural networks modeling,GRNN)[22]属于径向基神经网络其中的一种神经网络类型。GRNN结构图见图2。
图2
 新窗口打开|下载原图ZIP|生成PPT
图2GRNN模型结构图
Fig. 2GRNN model structure diagram
(4)多元线性回归模型(MLR)
多元线性回归模型[23](multiple linear regression,MLR)分析通过利用数学表达方式,根据自变量的取值来预测因变量的取值。
1.3.2 Mann-Kendall趋势检验法 目前国内外对于趋势检验有多种统计方法。本文采取世界气象组织(WMO)推荐使用的Mann-Kendall趋势检验法,但有相关研究表明[24,25]时间序列存在的自相关性会对趋势检验的准确性产生影响,COX等[26] 曾提出趋势的显著性会被序列的自相关性放大,导致得出不同的检验结果。本文对于序列分析其自相关性,对自相关性显著序列进行去除自相关性处理,再利用M-K对序列进行趋势检验。
1.3.3 干旱指数计算
(1)标准降水蒸发指数(SPEI)
本文采用BEGUERIA等[27]SEPI的计算方法。干早不仅受到降水的影响,而且与蒸散密切相关。2010 年Vicente Serrano采用降水与参考作物蒸发蒸腾量(ET0)的差值构建了SPEI指数,并采用了3个参数的log-logistic概率分布函数来描述其变化,通过正态标准化处理,最终用标准化降水与蒸散差值的累积频率分布来划分干早等级。
(2)相对湿润指数(MI)
本文采用MA等[28]的相对湿润指数的计算方法。
式中,MI为模式段相对湿润指数;P为某时段的降雨量(mm)。
(3)气象干旱等级划分
采用国家气象局制定的标准降水蒸发指数(SPEI)和相对湿润指数(MI)作为干旱等级划分标准[29],见表2。
Table 2
表2
表2SPEI和MI干旱等级划分
Table 2
| 等级 Category | 类型 Type | SPEI | MI |
|---|---|---|---|
| 1 | 无旱 No drought | -0.5<SPEI | -0.40<MI |
| 2 | 轻旱 Mild drought | -1.0<SPEI≤-0.5 | -0.65<MI≤-0.40 |
| 3 | 中旱 Moderate drought | -1.5<SPEI≤-1.0 | -0.80<MI≤-0.65 |
| 4 | 重旱 Severe drought | -2.0<SPEI≤-1.5 | -0.95<MI≤-0.80 |
| 5 | 特旱 Extreme drought | SPEI≤-2.0 | MI≤-0.95 |
新窗口打开|下载CSV
1.3.4 误差指标
式中,Xobs.i为实测值;Xmodel.i为模拟值。
2 结果
2.1 不同模型模拟参考作物蒸发蒸腾量的结果对比
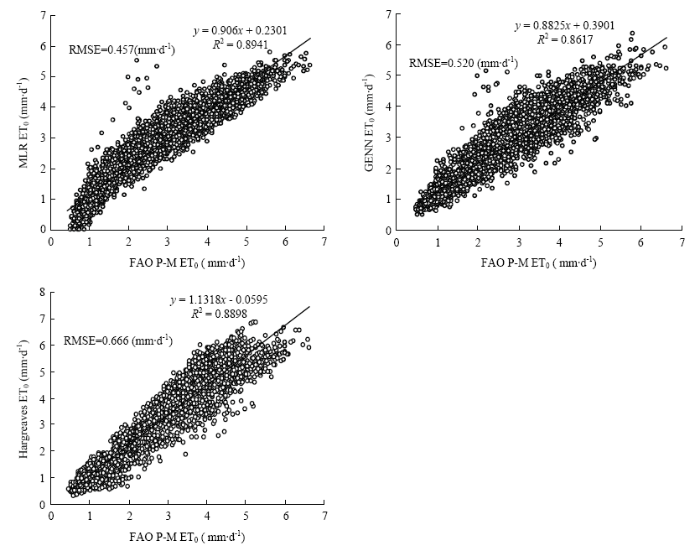
目前很多****对气象要素对ET0的影响关系进行研究,其中段春锋等[16]对西北地区气象要素与ET0进行偏相关分析,表明影响ET0程度的气象因子依次为风速、日照时数、气温、风速和相对湿度。根据CMIP5模型输出的气象要素种类,MLR和GRNN模型输入平均气温和风速气象因子,采用1958—1999年(42年)数据作为训练样本,2000—2018年(19年)数据作为检验样本。Hargreaves模型输入最高气温、最低气温和平均气温气象因子模拟ET0,由于Hargreaves模型无需训练样本,只采用2000—2018年数据作为检测样本。以FAO P-M公式计算结果作为真实ET0,分别采用R2和RMSE衡量模型模拟准确度。MLR准确度最高(RMSE=0.457 mm·d-1,R2=0.8941);GRNN模拟准确度次之(RMSE=0.520 mm·d-1,R2=0.8617)(图3);Hargreaves模拟准确度最低(RMSE=0.666 mm·d-1,R2=0.889)。Hargreaves结果的R2略优于GRNN,因此选取MLR估算未来不同RCP情境下ET0。图3
 新窗口打开|下载原图ZIP|生成PPT
图3输入平均气温时MLR、GRNN和Hargreaves方法模拟ET0的结果比较散点图
Fig. 3Comparing scatter plots of simulation results of ET0 by MLR, GRNN and Hargreaves method with input average temperature
2.2 历史干旱分析与检验
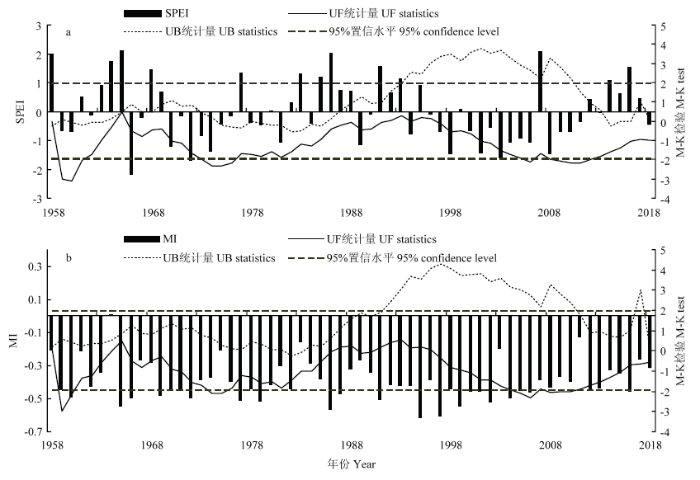
利用实测气象数据和FAO P-M公式计算ET0,根据ET0和实测降水数据计算陕西省的18个站点1958—2018年的SPEI和MI(图4)。陕西省各站点过去(1958—2018年)的SPEI均值分布在-2.174— 2.100之间,多年平均干旱指数为0.001,属于无旱干旱等级;MI分布在-0.614—0.006之间,全省多年干旱指数为-0.394,同样属于无旱干旱等级;利用M-K检验对陕西省过去61年(1958—2018年)的干旱指数进行趋势检验。SPEI反映出的干旱程度在整个61年中处于下降状态,且在20世纪60年代初期、70年代中期和21世纪10年代初期出现显著的下降,1965年为SPEI长时间序列(1958—2018年)的突变年份(图4-a)。1961—2010年该地区年平均SPEI以0.175 /(10a)的速度下降,1994和1977年是SPEI长时间序列(1961—2010年)突变年份,这与周丹等[30]得出的陕西省SPEI以0.18/(10a)的速度下降并且1990年趋势开始突变下降的结论基本一致;MI反映出的干旱程度在61年中同样处于下降状态,但相对于SPEI反映出的下降速度稍慢(图4-b)。在20世纪60年代中期、80年代中后期与90年代中期有一定的上升趋势。MI的M-K检验与SPEI不同,未反映出突变年份。图4
 新窗口打开|下载原图ZIP|生成PPT
图41958—2018年陕西省SPEI(a)和MI(b)时间序列M-K趋势检验
UF和UB为统计量序列,用以判断时间序列变化趋势以及检查突变点。置信区间临界值为0.05
Fig. 4M-K trend test of SPEI (a) and MI (b) time series in Shaanxi Province from 1958 to 2018
UF and UB are statistical sequences used to determine trends in time series and to check for mutation points. The confidence interval threshold is 0.05
由于CMIP5气候模式和新的排放情景来预估未来气候系统的变化,因此比较某些时间区段不同RCP情景下模拟与实际气象数据计算的干旱指数,进而评估不同模式在陕西省的准确度,为后续研究筛选模式提供依据。利用RCP2.6和RCP8.5情景下的气象数据和MLR模拟2006—2018年干旱指数,不同模式的RMSE基本相近,而HadGEM2-ES误差相对较小(RMSE均值为0.938)(图5)。高峰等[31]的研究结论表明HadGEM2-ES模式更适合中国地区。因此,本文选用HadGEM2-ES模式进行后续研究。由于不同模式的历史模拟气象数据未经过修正,导致RMSE大于2006—2018年不同RCP情景的RMSE(表3);关中地区模拟干旱指数误差较大,陕北和陕南地区误差相近(表3)。在2006—2018年RCP2.6情景比RCP8.5情景更接近真实干旱情况。2006—2018年SPEI分布在-1.459—2.083之间,MI分布在-0.461—-0.128(图6)。由于MI计算方法,在降水较大且ET0较低的月份存在极值,进而导致MI的RMSE较大。
图5
 新窗口打开|下载原图ZIP|生成PPT
图5分时段比较不同模式下模拟SPEI误差比较
Fig. 5Comparison of simulated SPEI error under different modes in different time periods
Table 3
表3
表3HadGEM2-ES模式2006—2018年RCP2.6与RCP8.5情景下干旱指数误差比较
Table 3
| 干旱指数 Drought index | RCP情景 RCP scenario | RMSE | |||
|---|---|---|---|---|---|
| 陕北 Northern Shaanxi | 关中 Central Shaanxi plain | 陕南 Southern Shaanxi | 陕西 Shaanxi | ||
| MI | RCP2.6 | 0.306 | 0.563 | 0.378 | 0.416 |
| RCP8.5 | 0.149 | 0.309 | 0.317 | 0.258 | |
| SPEI | RCP2.6 | 0.505 | 0.720 | 0.576 | 0.596 |
| RCP8.5 | 0.427 | 0.597 | 0.563 | 0.522 | |
新窗口打开|下载CSV
图6
 新窗口打开|下载原图ZIP|生成PPT
图6RCP2.6情景下陕西省SPEI与MI趋势检验
Fig. 6SPEI and MI trend test in Shaanxi Province under RCP 2.6 scenarios
2.3 干旱趋势时间分析
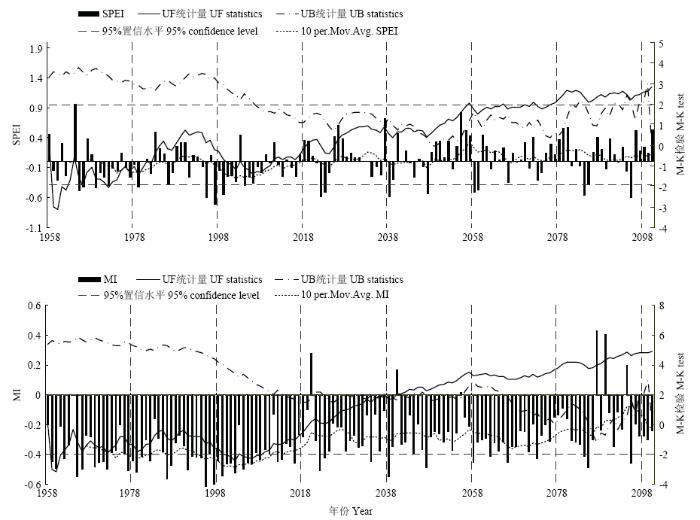
研究长时间序列的干旱指数,更有利于分析干旱的特征变化,将陕西省过去(1958—2018年)和未来(2019—2100年)共143年SPEI和MI进行M-K检验和滑动平均分析。比较不同时段的干旱指数在不同RCP情景下的变化异同。在RCP2.6情景下研究区(全省各站点均值),SPEI多年均值为0.017,在21世纪40年代存在突变年份,且在21世纪20年代之前SPEI均处于下降的趋势,在此之后均处于上升的趋势(图6);MI多年均值为-0.312,在21世纪40年代存在突变年份,且在21世纪20年代之前处于下降趋势,此后均处于上升趋势(21世纪30年代之后显著上升)。在不同时段SPEI与MI的10年滑动平均整体趋势基本一致,但MI在21世纪80年代之后表现显著增长。
在RCP8.5情景下,多年SPEI均值为0.015,在21世纪10和80年代存在突变年份,且在20世纪70年代之前处于下降趋势,在此之后均处于上升趋势(图7);多年MI均值为-0.313,在21世纪10年代存在突变年份,且在21世纪10年代之前处于下降趋势,在此之后均处于上升趋势(21世纪20年代之后显著上升)。长时间序列的SPEI与MI滑动平均波峰与波谷相对应,反映的干旱变化趋势相一致。在1958— 2018年之间,两者的滑动平均处于波动状态,SPEI波动程度较大。在2018—2038年之间,MI的滑动平均存在明显的峰值。
图7
 新窗口打开|下载原图ZIP|生成PPT
图7RCP8.5情景下陕西省SPEI与MI趋势检验
Fig. 7SPEI and MI trend test in Shaanxi Province under RCP 8.5 scenarios
不同RCP情景下的多年干旱指数均值相近,但未来(2019—2100年)RCP2.6情景下的干旱指数均大于RCP8.5,未来RCP8.5情景比RCP2.6情景的干旱程度更大。
2.4 干旱趋势空间分析
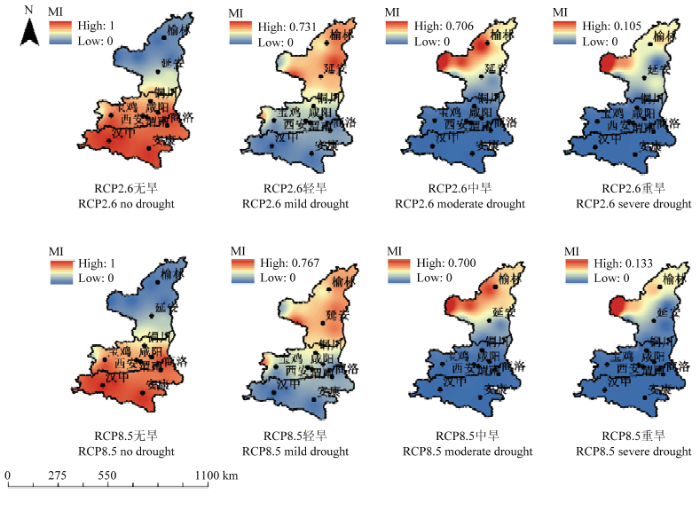
在RCP2.6情景下,陕西省SPEI多年无旱频率均值为0.707,轻旱、中旱和重旱等频率均值分别为0.148、0.115和0.029。RCP8.5情景下SPEI无旱频率均值为0.724,其中轻旱、中旱和重旱频率均值分别为0.140、0.096和0.040(图8)。在RCP2.6情景下MI无旱频率均值为0.555,轻旱、中旱、和重旱等频率均值分别为0.294,0.136和0.210。在RCP8.5情景下MI无旱频率均值为0.518,轻旱、中旱和重旱等频率均值分别为0.323,0.145和0.012(图9)。通过比较可以得出,陕西省在1958—2100年长时间序列中,主要表现为无旱,其次为轻旱、中旱和重旱。在不同RCP情景下SPEI和MI干旱频率较为接近,但相同RCP情景下无旱、中旱和重旱频率具有较大差别。图8
 新窗口打开|下载原图ZIP|生成PPT
图8不同RCP情景下陕西省1958—2100年SPEI干旱频率
Fig. 8SPEI drought frequency in Shaanxi Province from 1958 to 2100 under different RCP scenarios
图9
 新窗口打开|下载原图ZIP|生成PPT
图9不同RCP情景下陕西省1958—2100年MI干旱频率
Fig. 9MI drought frequency in Shaanxi Province from 1958 to 2100 under different RCP scenarios
SPEI与MI干旱空间分布基本一致,仅在部分地区存在少许不同。陕西省无旱频率由北到南呈现明显的梯度(图8、图9)。陕北地区频率最高,关中地区其次,陕南地区最低。陕西省无旱主要集中在陕南地区和关中南部地区;轻旱、中旱和重旱集中在陕北地区,而重旱主要集中在陕北西部地区。本研究结果同吴迪等[32]利用模糊聚类循环迭代模型评价陕西省农业干旱风险的结果较为相似,也可以说明在空间上陕西省过去与未来整体干旱程度分布并未有较大的变化。
2.5 作物生长季干旱分析
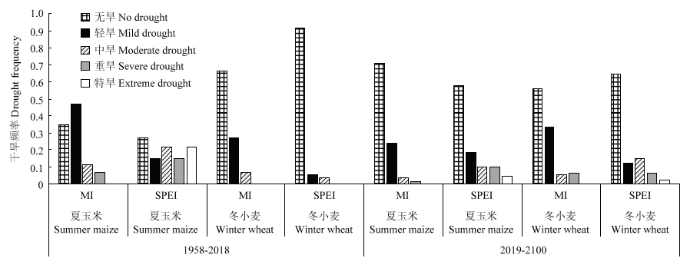
陕西地区的季节作物主要为冬小麦和夏玉米。冬小麦和夏玉米的生长季在10月至次年6月和次年6月至10月[33,34]。由空间干旱频率的研究可知,不同RCP情景的干旱频率较为接近,因此只对夏玉米和冬小麦在RCP8.5情景的生长季的干旱频率进行研究。SPEI和MI均反映出未来冬小麦生长季的无旱频率有一定程度降低(SPEI变化频率-0.269,MI变化频率-0.100),其他旱情频率均有微弱提高(图10)。未来夏玉米生长季的无旱频率有一定程度提高(SPEI变化频率0.312,MI变化频率0.361),其他旱情频率均微弱降低。1958—2100年夏玉米生长季SPEI反映的干旱程度较重,而冬小麦生长季MI反映的干旱程度较轻;关中地区的夏玉米生长季的干旱程度变化最大,其次为陕南和陕北地区。陕北地区的冬小麦干旱程度变化最大,其次为陕南和关中地区。关中、陕南和陕北地区夏玉米SEPI无旱频率变化依次为0.294、0.203和0.135,MI无旱频率变化依次为0.288、0.225和0.186。陕北、关中和陕南地区冬小麦SEPI无旱频率变化依次为-0.221、0.184和-0.132,MI无旱频率依次为0.048、-0.046和0.038。
图10
 新窗口打开|下载原图ZIP|生成PPT
图10陕西省冬小麦和夏玉米生长季内SPEI和MI干旱频率
Fig. 10SPEI and MI drought frequency in winter wheat and summer maize growing season in Shaanxi Province
3 讨论
MLR在输入平均气温时模拟ET0准确度(RMSE= 0.527 mm·d-1,R2=0.858)与王升等[18]输入相同气象因子的随机森林模型(RF)模拟西南喀斯特地区的准确度(RMSE=0.546 mm·d-1),R2=0.875)相近。导致以上两种模型模拟准确度偏低的原因可能是Hargreaves为经验公式类模型,模型模拟精确度与当地气候条件等因素有关,更适用于在缺乏历史气象数据的情况下对ET0进行模拟;气温与ET0线性关系较强,而GRNN更适合对非线性问题模拟。未来冬小麦生长季内干旱特征变化,可能会对作物产量产生影响。LIU等[35]和成林等[36]的研究结果表明,年内干旱已经从20世纪80年代的夏秋季干旱变为20世纪90年代的秋冬季干旱以及最近10年的冬季和春季干旱,冬小麦产量与SPEI存在稳定的相关性,冬小麦产量一直受干旱影响。PE?A-GALLARDO等[37]的研究显示,在3—9个月的时间尺度上冬小麦产量与SPEI在4月和5月呈现正相关关系。上述研究结论的年内干旱时间分布与本研究不同RCP情景下未来的干旱频率在冬小麦生长季变化相近,且上述的冬小麦的产量受干旱影响。在未来RCP8.5情景下,冬小麦生长季干旱频率增加,可能导致陕西省未来冬小麦产量降低。
从时间和空间分析,结果显示陕西省不同RCP未来情景下的干旱程度均有所降低,且RCP2.6情景下的干旱降低程度大于RCP8.5情景下的降低程度。RCP情景变量为降水、气温和风速,分析不同干旱指数与降水以及气温变量的相关程度,并分析不同RCP情景下降水和气温变化趋势,进而得出该结果形成原因。利用陕西省1958—2018年实测气象数据(月尺度),计算干旱指数与平均温度、风速和降水的偏相关系数。
SPEI和MI与降水(0.764, 0.895)呈现明显正相关关系,与气温(-0.683, -0.449)呈现明显负相关关系,与风速(-0.020, -0.024)呈现微弱负相关。 1958—2018年累计降水量呈现微弱下降趋势,多年均值为618.5 mm,平均气温呈现上升趋势,多年均值为10.4℃;在RCP2.6情景下2019—2100年累计降水量呈下降趋势,多年均值为715.8 mm,RCP8.5情景下呈上升趋势,多年均值为719.1 mm;在RCP2.6情景下2019—2100年平均气温呈上升趋势,多年平均为11.6℃,RCP8.5情景下呈上升趋势,多年平均为13.0℃。说明在不同RCP情景下,未来降水与气温比过去均有所提高,这与莫兴国等[38]的结论相吻合。由于干旱指数与降水和气温存在明显相关性,可以说明未来RCP情景的降水与气温变化影响干旱指数变化。RCP2.6和RCP8.5情景下多年降水量和温度均值比过去均有较大增加。SPEI与降水和气温的偏相关系数相近,MI与降水偏相关系数大于气温。气温增长量小于降水增长量,说明未来SPEI增加程度(0.763)大于MI增加程度(0.017)是由于未来降水增加程度大于温度。
4 结论
不同干旱指数均能反映相同的干旱变化特征,但由于SPEI与MI计算方式不同,导致某些时间区段干旱变化特征存在一定差别。而不同RCP情景和干旱指数反映的空间干旱频率未存在明显差别,且未来陕西省干旱空间分布未有明显变化;未来干旱程度降低同时气温和降水均增加,因此陕西省未来农业发展可以适当扩大耕地面积,加大渠系建设,发展集雨设施,采用地膜覆盖方式减少土壤蒸发进而减少作物蒸散发量。未来夏玉米生长季内干旱程度降低,冬小麦生长季内干旱程度增加。未来陕西省应当加强冬小麦生长季的防旱措施,减少因未来气候变化对陕西省冬小麦产量的影响。参考文献 原文顺序
文献年度倒序
文中引用次数倒序
被引期刊影响因子
DOI:10.1016/j.wace.2015.07.003URL [本文引用: 1]
DOI:10.1038/nature09364URLPMID:20811450 [本文引用: 1]

China is the world's most populous country and a major emitter of greenhouse gases. Consequently, much research has focused on China's influence on climate change but somewhat less has been written about the impact of climate change on China. China experienced explosive economic growth in recent decades, but with only 7% of the world's arable land available to feed 22% of the world's population, China's economy may be vulnerable to climate change itself. We find, however, that notwithstanding the clear warming that has occurred in China in recent decades, current understanding does not allow a clear assessment of the impact of anthropogenic climate change on China's water resources and agriculture and therefore China's ability to feed its people. To reach a more definitive conclusion, future work must improve regional climate simulations-especially of precipitation-and develop a better understanding of the managed and unmanaged responses of crops to changes in climate, diseases, pests and atmospheric constituents.
URL [本文引用: 1]
The period 1961-2007 was divided into twoby the time node of year 1981, and the change characteristics of the agricultural climate resources both in periodⅠ(1961-1980) and in period Ⅱ (1981-2007) were analyzed and compared. The results showed that under the background of global warming, the average climatic trend rate of ≥10 ℃ accumulated temperature in the middle and lower reaches of Yangtze River in temperaturedefined growth season during 1961-2007 was 74 ℃·d·10 a-1, and the ≥10 ℃ accumulated temperature in period Ⅱ was 124 ℃·d higher than that in period I. Comparing with that in period I, the safe planting boundary of double cropping rice in period Ⅱ moved 0.79° northward. In 1961-2007, the precipitation in temperature-defined growth season had an overall increasing trend. Comparing with those in period I, the precipitationand the area of ≥767 mm precipitation (water requirement for normal growth of double cropping rice) in period II were increased by 1.6% and 1.13×10.4 km2, respectively. The average sunshine hour in temperature-defined growth seasonin period II was reduced by 8.1%, comparing with that in period I. In recent 47 years, about 91.1% stations in the reaches showed a decreasing trend in sunshine hours. Comparing with that in period I, the reference crop evapotranspirati
on in temperature-defined growth season in period Ⅱ showed a slightly decreasing trend, and its low value region expanded while its high value region narrowed. The beginning date of daily temperature over 10 ℃ was averagely 2 days earlier in period Ⅱ than that in period I, while the ending date was in reverse. The ending date of daily temperature over 22 ℃ was almost the same in periods I andⅡ.
[本文引用: 1]
[本文引用: 1]
DOI:10.1007/s11069-015-1594-0URL [本文引用: 1]
[本文引用: 1]
DOI:10.1016/j.scitotenv.2015.11.167URLPMID:26688051 [本文引用: 1]
Annual and summertime trends towards increasingly variable values of the Palmer Drought Severity Index (PDSI) over a sub-decadal period (five years) were investigated within the contiguous United States between 1895 and the present. For the contiguous United States as a whole, there is a significant increasing trend in the five-year running minimum-maximum ranges for the annual PDSI (aPDSI5 yr(min|max, range)). During this time frame, the average aPDSI5 yr(min|max, range) has increased by about one full unit, indicating a substantial increase in drought variability over short time scales across the United States. The end members of the running aPDSI5 yr(min|max, range) highlight even more rapid changes in the drought index variability within the past 120 years. This increasing variability in the aPDSI5 yr(min|max, range) is driven primarily by changes taking place in the Pacific and Atlantic Ocean coastal climate regions, climate regions which collectively comprise one-third the area of the contiguous United States. Similar trends were found for the annual and summertime Palmer Hydrological Drought Index (PHDI), the Palmer Modified Drought Index (PMDI), and the Palmer Z Index (PZI). Overall, interannual drought patterns in the contiguous United States are becoming more extreme and difficult to predict, posing a challenge to agricultural and other water-resource related planning efforts.
DOI:10.1175/2009JCLI2909.1URL [本文引用: 1]
[本文引用: 1]
[本文引用: 1]
[本文引用: 1]
[本文引用: 1]
DOI:10.1002/2015JD023772URL [本文引用: 1]
[本文引用: 1]
[本文引用: 1]
[本文引用: 1]
DOI:10.11676/qxxb2001.077URL [本文引用: 1]
利用1951~1997年中国160站月降水和平均气温资料,通过计算的地表湿润指数Hi=P/Pe(P为观测的月降水总量,Pe为月最大潜在蒸发),对比分析了中国华北、西北两个典型干旱区区域平均地表湿润指数的年代年际变化特征及季节性差异,并讨论了它与降水和气温的联系。最后,给出了地表湿润指数年及各季节变化趋势的地理分布。研究表明:西北西部和华北地区的年际及年代际变化趋势基本相反,前者地表为变湿趋势,后者为变干趋势。华北地区的干化趋势主要发生在夏秋季节,而西北除东部的秋季和西部的夏季外,其它季节均存在变湿趋势。
DOI:10.11676/qxxb2001.077URL [本文引用: 1]
利用1951~1997年中国160站月降水和平均气温资料,通过计算的地表湿润指数Hi=P/Pe(P为观测的月降水总量,Pe为月最大潜在蒸发),对比分析了中国华北、西北两个典型干旱区区域平均地表湿润指数的年代年际变化特征及季节性差异,并讨论了它与降水和气温的联系。最后,给出了地表湿润指数年及各季节变化趋势的地理分布。研究表明:西北西部和华北地区的年际及年代际变化趋势基本相反,前者地表为变湿趋势,后者为变干趋势。华北地区的干化趋势主要发生在夏秋季节,而西北除东部的秋季和西部的夏季外,其它季节均存在变湿趋势。
URL [本文引用: 1]
应用CRU 3.1气温资料和GPCC V6降水数据,系统评估了国际耦合模式比较计划第5阶段(CMIP5)中17个耦合模式对全球典型干旱半干旱区的长期气候变化的模拟能力,并在此基础上分析了不同典型浓度路径(representative concentration pathways,RCPs)下典型干旱半干旱区未来的气候变化情景. 结果表明:大多数模式都能模拟出全球陆地以及典型干旱半干旱区观测气温时空分布特征,特别是近60年来显著增温的空间格局,但增温幅度偏小0.1~0.3℃/50 a;大多数模式难以捕捉到全球陆地观测降水的年际变化特征,模拟的变率和趋势均明显偏弱,不同模式对干旱半干旱区降水的模拟存在较大的时空差异,但总体上还是多模式集成结果更为接近观测值;在人类活动和自然变化的共同影响下,全球及其不同干旱半干旱区未来气温的变化均是以显著增温为主,特别是高端浓度路径(RCP 8.5)下的增温幅度几乎是中低端浓度路径(RCP 4.5)下的2倍;降水的未来变化情景基本上是“干愈干、湿愈湿”的时空特征,也是高端浓度路径下的变化更为明显;而未来中国北方干旱半干旱区很可能是气温上升、降水增加最为显著的地区之一.
URL [本文引用: 2]
It is important to understand the effect of climate change on reference crop evapotranspiration. Based on the FAO-56 Penman-Monteith equation, the temporal-spatial variation characteristics of ET0 (reference crop evapotranspiration), ETrad and ETaero and the possible causes of their changes were studied in growing season in Northwest China using a 49-year dataset. The results showed that ET0 decreased significantly in the whole study area due to the increasing trend of ETrad and the decreasing trend of ETaero. The yearly change trends of ET0 were more significant in the first region than in the other two regions because of their different climate characteristics. The absolute values of partial correlation coefficients between ET0 and four climate variables indicated that wind played the most important role in the changes of ET0 in Northwest China, followed by solar radiation and air temperature. The contributions of climate variables to ET0 in first region were similar to the whole region, while in second region the contributions of wind, solar radiation and air temperature were equivalent. The relative humidity showed larger contribution in third region than in the other two regions.
URL [本文引用: 1]
Changes of reference crop evapotranspiration (ET0) and its causes were analyzed by the computed ET0 using Penman-Monteith equation which was recommended by FAO according to weather data of 41 years for 30 weather stations in Guanzhong Region of Shaanxi Province(Central Shaanxi Plain). The results show that ET0 presents periodical changes based on decreasing trend in the long term and increasing trend before and after 1980 respectively in the short term. The maximum ET0 appeared on June before 1980 and on June and July after 1980. ET0 percentage between May and August in a year after 1980 is less than the one before 1980, but still is over 50%. The tendencies for mean, maximum and minimum temperature are to increase and those for wind speed, sunlight hours and relative humidity are to decrease. ET0 is related positively to wind speed, sunlight hours insignificantly, and is related negatively to water vapor insignificantly. The influence capacity of weather factors on ET0 is as follows: wind speed>sunlight hours>water vapor>yearly evaporation. The decline trend of ET0 is mainly caused by the decrease of wind speed and sunlight hours.
[本文引用: 2]
[本文引用: 2]
DOI:10.1175/2011BAMS3110.1URL [本文引用: 1]
[本文引用: 1]
DOI:10.1007/s11356-019-06419-wURLPMID:31625116 [本文引用: 1]
This study examined the sensitivity of reference crop evapotranspiration (ET0) to climatic variables in a humid region in Iran. ET0 was estimated using the FAO-56 Penman-Monteith (PMF-56), Blaney-Criddle (BC), and Hargreaves-Samani (HG) methods. Sensitivity analysis was performed by two distinct methods which were (i) changing the value of a certain climatic parameter in a range between ± 20% of its long-term mean with an increment of 5%, and calculating the percentage of change in ET0, while the other parameter values were kept constant; and (ii) calculating the sensitivity coefficients (SCs) for each of the climatic variables. For each of the climatic parameters, the Iso-SC maps were plotted using the Arc-GIS software. Results indicated that the most sensitive parameter for ET0 was the maximum air temperature (Tmax) by PMF-56 and HG methods. Increasing Tmax up to 20% led to an increase in ET0 between 8.5 and 15%, at the selected stations by PMF-56. In contrast, the less sensitive parameter for ET0 was the minimum air temperature (Tmin) for PMF-56 and Tmean for HG. For PMF-56, increasing the minimum relative humidity (RHmin) to 20% led to a decrease in ET0 in the range between 0.5 and 5%. The highest values of SC in the cases of Tmax and Tmin were found to be equal to 0.8 and 0.53, respectively. Similarly, the SC in the case of RHmin varied between - 0.29 and - 0.0038. This range for wind speed was between 0.06 and 0.22 and in the case of sunshine hours it was between 0.272 and 0.385. These findings would be useful in the scientific management of water resources in the region.
URL [本文引用: 1]
参考作物蒸散量(reference evapotranspiration, ET0)精确模拟对水资源高效利用和灌溉制度制定具有重要意义,该文以四川盆地
URL [本文引用: 1]
参考作物蒸散量(reference evapotranspiration, ET0)精确模拟对水资源高效利用和灌溉制度制定具有重要意义,该文以四川盆地
DOI:10.1186/s13007-019-0520-yURLPMID:31832078 [本文引用: 1]
Predicting impact of plant tissue culture media components on explant proliferation is important especially in commercial scale for optimizing efficient culture media. Previous studies have focused on predicting the impact of media components on explant growth via conventional multi-layer perceptron neural networks (MLPNN) and Multiple Linear Regression (MLR) methods. So, there is an opportunity to find more efficient algorithms such as Radial Basis Function Neural Network (RBFNN) and Gene Expression Programming (GEP). Here, a novel algorithm, i.e. GEP which has not been previously applied in plant tissue culture researches was compared to RBFNN and MLR for the first time. Pear rootstocks (Pyrodwarf and OHF) were used as case studies on predicting the effect of minerals and some hormones in the culture medium on proliferation indices.
DOI:10.1016/S0022-1694(97)00125-XURL [本文引用: 1]
[本文引用: 1]
[本文引用: 1]
DOI:10.1093/biomet/42.1-2.80URL [本文引用: 1]
DOI:10.1002/joc.3887URL [本文引用: 1]
The standardized precipitation evapotranspiration index (SPEI) was developed in 2010 and has been used in an increasing number of climatology and hydrology studies. The objective of this article is to describe computing options that provide flexible and robust use of the SPEI. In particular, we present methods for estimating the parameters of the log-logistic distribution for obtaining standardized values, methods for computing reference evapotranspiration (ET0), and weighting kernels used for calculation of the SPEI at different time scales. We discuss the use of alternative ET0 and actual evapotranspiration (ETa) methods and different options on the resulting SPEI series by use of observational and global gridded data. The results indicate that the equation used to calculate ET0 can have a significant effect on the SPEI in some regions of the world. Although the original formulation of the SPEI was based on plotting-positions Probability Weighted Moment (PWM), we now recommend use of unbiased PWM for model fitting. Finally, we present new software tools for computation and analysis of SPEI series, an updated global gridded database, and a real-time drought-monitoring system.
[本文引用: 1]
[本文引用: 1]
[本文引用: 1]
[本文引用: 1]
[本文引用: 1]
[本文引用: 1]
[本文引用: 1]
[本文引用: 1]
[本文引用: 1]
DOI:10.1016/j.eja.2007.03.002URL [本文引用: 1]
[D].
DOI:10.1016/j.ijfoodmicro.2019.108471URLPMID:31841786 [本文引用: 1]
This work presents the attempt to enhance the flavor complexity of cider fermented by different non-Saccharomyces species. Pichia kluyveri and Hanseniaspora vineae pure cultures were used as reference ciders. Mixed cultures between all 4 species gave 5 fermentations, where Hanseniaspora uvarum or Torulaspora quercuum were included for apple juice fermentation. Chemical composition and sensorial properties of all ciders were studied. The results indicated that the growth of P. kluyveri and H. vineae were interreacted and also affected by H. uvarum and T. quercuum. H. vineae was more capable of consuming sugar than P. kluyveri. Ciders from the single culture fermentation with P. kluyveri (Pk), as well as from mixed fermentation with P. kluyveri and H. uvarum (Pk-Hu), had high residual sugar, sugar/acid ratio, and glucose-fructose consumption ratio. Large shifts in the consumption and production of organic acids and polyphenols among all ciders were observed. The calculation of the relative odor activity value (rOAV) showed that 17 volatile compounds had an rOAV &gt;1 in at least one sample, and acetate esters and ethyl esters were the groups with the highest number of volatile compounds of importance to the cider aroma. Among these 17 compounds, 3-methylbutyl acetate, 2-methylbutyl acetate, ethyl hexanoate, ethyl octanoate, and β-damascenone exhibited high rOAVs in some ciders and might contribute fruity, floral, and sweet features to the cider aroma. Besides, the tropical fruity aroma from 3-methylbutyl acetate was only perceived in Pk and Pk-Hu. The partial least squares regression (PLSR) analysis revealed that acetate esters contributed positively to the roasted and cooked odor of all ciders. This is the first study evaluating simultaneous fermentation of two non-Saccharomyces yeasts to produce cider, which provides new insights into cider production.
DOI:10.1016/j.jhydrol.2018.07.077URL [本文引用: 1]
URL [本文引用: 1]
Agriculture is one of the industries that is most sensitive to global warming. Crop yield analysis is an efficient approach to evaluating the impact of climate change on agriculture. Henan Province (which is in the south region of North China Plain) is one of the most important production bases of winter wheat, a crop that is sensitive to global warming. This study used historical climate data and average winter wheat yield to determine the trends in precipitation and temperature during winter wheat growing season in Henan Province. It then utilized the extracted climatic productivity and Mann-Kendall mutation testing method to separate two distinct stages of the effects of climate change on agriculture. For each of the stages, regression equations were also established among temperature, climate change and yield. Then the impact of warming climate on unit yield of winter wheat was eventually analyzed at each stage using the equations. While there was no drastic change in precipitation during the 1961~2007 winter wheat season in Henan Province, the temperature rose continuously. In comparison with precipitation, temperature showed significant correlations with climate and unit yield of winter wheat. For the period of 1961~1981, the correlation between winter wheat yield and temperature departure was significant and positive. This correlation weakened after 1987, after which time yield fluctuation was limited. Since the mid 1980s, air temperatures during winter wheat seasons in Henan Province increased dramatically, with an average temperature increase of 0.81 oC per decade. In comparison with 1961~1981 (the pre-warming stage/period), wheat yield increased by 173.4%~245.9% in 1991~2000 and 2001~2007, and the contribution rate of temperature rise was 15.6%~20.7%. Average temperatures were relative higher in wintering, re-greening, heading and flowering stages. Warming positively influenced unit yield of winter wheat, as average temperatures were lower than the suitable temperature range. In the conspicuous 2001~2007 warming period, however, only 1.0% of the yield increase was due to temperature rise. This showed that unit yield of winter wheat increased with improved cultivation techniques. The study showed that while the sensitivity of yield to temperature variation decreased, the adaptability of agriculture to environment factors increased.
DOI:10.1016/j.agrformet.2018.09.019URL [本文引用: 1]
[本文引用: 1]
[本文引用: 1]
