 ,1,2, 蔡义承,1, 谭昌伟,1, 李振海2, 杨贵军2, 冯海宽2, 韩东2
Field Wheat Ears Counting Based on Superpixel Segmentation Method
DU Ying,1,2, CAI YiCheng,1, TAN ChangWei,1, LI ZhenHai2, YANG GuiJun2, FENG HaiKuan2, HAN Dong2通讯作者:
第一联系人:
收稿日期:2018-08-25接受日期:2018-09-28网络出版日期:2019-01-01
| 基金资助: |
Received:2018-08-25Accepted:2018-09-28Online:2019-01-01

摘要
关键词:
Abstract
Keywords:
PDF (5816KB)元数据多维度评价相关文章导出EndNote|Ris|Bibtex收藏本文
本文引用格式
杜颖, 蔡义承, 谭昌伟, 李振海, 杨贵军, 冯海宽, 韩东. 基于超像素分割的田间小麦穗数统计方法[J]. 中国农业科学, 2019, 52(1): 21-33 doi:10.3864/j.issn.0578-1752.2019.01.003
DU Ying, CAI YiCheng, TAN ChangWei, LI ZhenHai, YANG GuiJun, FENG HaiKuan, HAN Dong.
0 引言
【研究意义】小麦是世界贸易量最大的重要粮食作物,也是我国主要的粮食作物之一。作为小麦主要进口国之一,规范生产管理、稳定品种品质是小麦产量提高的重要途径,与我国的国民经济和粮食安全息息相关。单位面积穗数是小麦产量构成要素之一,快速准确的穗数统计对高产栽培和良种选育都有重要意义[1,2]。传统的人工田间调查方法费时费力,随着农业信息化、机械化水平的提高,图像处理技术在作物生产领域已经得到广泛应用。对在病害检测[3,4,5]、产量预测[6,7,8]、品种识别[9,10,11]都起到显著的推进作用。【前人研究进展】在通过图像处理获取小麦表型信息方面前人也有广泛的研究。JIN等[12]提出了一种利用低空高分辨率无人机影像估算出苗期小麦植株密度的田间高通量表型信息提取方法,验证结果表明该方法在不同密度和基因型下有很高的可重复性。WALTER等[13]通过对数码照片进行3D点云处理,估测小麦的冠层高度和收获指数取得可靠结果,并通过增加拟合图像数进一步提高模型可靠性。小麦穗部的研究主要集中在麦穗的识别和测量上,陈含等[14]通过Sobel算子边缘检测,从模糊背景中分割出麦穗,并与绿色(G)分量法和最大值法的处理结果进行对比,证实该分割方法更为高效,耗时明显减少。LI等[15]利用基于Laws纹理能力测度算法的神经网络对麦穗进行检测,结合面积和高度阈值改进检测效果,获得80%以上的麦穗检测率,同时还对麦穗面积进行了有效测量。路文超等[16]通过图像处理技术拟合麦穗主部中心曲线,结合灰度差异统计,有效同步测量穗长和小穗数。王宁等[17]基于图像分形,利用分形维数作为像元特征阈值分割麦穗,根据麦穗竖直方向倾角旋转矫正麦穗以及列特征计算麦穗粒数。以上方法都是针对室内单株麦穗,针对田间复杂环境下麦穗研究较少,仅刘涛等[18]通过颜色特征和纹理特征,分别针对田间撒播小麦和条播小麦进行麦穗识别计数,两种方法均能有效计数,其中基于颜色特征的方法被证实更为快速高效。FERNANDEZGALLEGO等[19]对田间拍摄的小麦数码照片,分别使用拉普拉斯滤波和中值滤波后提取麦穗主体部分,采用峰值检测算法提取图像峰值确定麦穗数目,并分析了不同时期穗数与产量的关系,发现开花期穗数与产量相关性最高。【本研究切入点】以往麦穗识别相关研究中大多基于像素级进行图像处理,并且在进行麦穗识别时较少考虑到长势差异对识别效果的影响。因此,本研究一方面对田间小麦图像进行预处理后,将像素聚集为超像素,基于超像素进行图像分析识别麦穗,以此降低在图像特征统计时无关像素的影响,提高识别效果。另一方面,本研究通过氮梯度处理形成长势差异,比较了不同氮处理下的麦穗计数结果,提高麦穗统计的可靠性。【拟解决的关键问题】为了快速准确地统计大田小麦穗数,本研究对小麦田间数码照片进行SLIC超像素分割处理后,利用颜色特征识别麦穗,再提取麦穗骨架,通过骨架角点计算小麦穗数,并通过比较不同氮水平下该方法的计数准确率,分析长势差异对该方法识别效果的影响,旨在为大田估产中穗数统计提供一种新的可靠途径。
1 材料与方法
1.1 试验设计
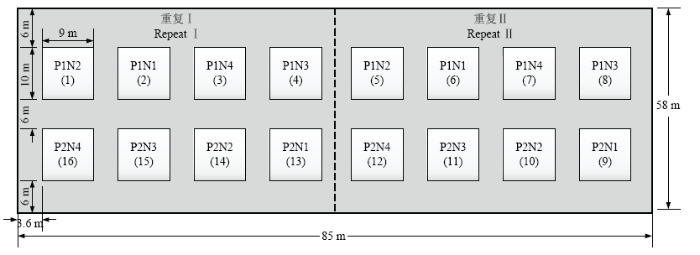
本试验于2013年在北京市昌平区小汤山国家精准农业研究示范基地(北纬 40°00′—40°21′,东经116°34′—117°00′,海拔高度 36 m)进行。试验设计为氮素和品种的完全随机试验(图1),冬小麦品种为中麦175和中优206,均为冬性中早熟长芒品种,熟期和穗型相似;氮肥水平4个,尿素施用量分别是0(N1),228 kg·hm-2(N2,1/2正常施氮量),456 kg·hm-2(N3,正常施氮量),912 kg·hm-2(N4,过量施肥);重复2个,共16个小区,其他按正常水平进行田间管理。图1
 新窗口打开|下载原图ZIP|生成PPT
图1试验设计图
(1)品种处理——P1:中麦 175;P2:中优206。(2)氮素处理——N1:0;N2:1/2正常;N3:1倍正常;N4:2倍正常
Fig. 1Experimental design
(1) Variety treatment——P1: Zhongmai 175; P2: Zhongyou 206. (2) Nitrogen treatment——N1: 0; N2: 1/2 Normal; N3: 1 Normal; N4: 2 Normal
1.2 数据获取
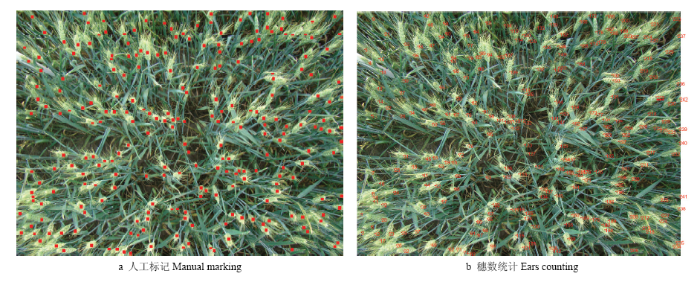
1.2.1 小麦数码影像获取 本研究所用小麦数码影像获取于2013年5月31日(灌浆期)下午5:00(太阳天顶角63°07′51″,方位角96°56′19″),晴朗无风条件下背光手持SONY DSC-H9数码相机田间垂直拍摄。高度为高于小麦冠层顶部约1 m,拍摄面积约为每幅0.75 m2(5行小麦,行距15 cm)。每个小区获取3张分辨率2 592×1 944的小麦数码影像,共48幅。1.2.2 穗数人工获取 在麦穗人工统计过程中,本研究采用人工判读和机器计数相结合的方法(图2)。首先对小麦数码影像进行人工判读,标记出麦穗部分;然后在MATLAB R2016a中提取图像的标记点,对标记点进行数目统计并在图像中标号以获得准确、直观的穗数统计结果。
1.3 麦穗识别方法
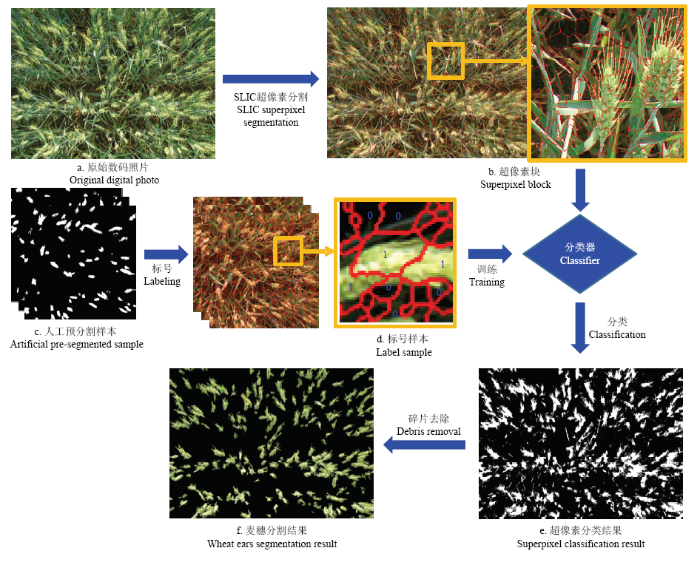
麦穗识别过程主要包括以下步骤:超像素分割处理、样本标记、颜色特征分析、分类器训练和识别(图3)。具体步骤如下。(1)利用简单线性迭代聚类(simple linear iterative clustering,SLIC)超像素分割算法对小麦数码照片进行预处理。超像素是指具有同质特征的相邻像素构成的图像块,超像素分割就是将像素聚合成超像素的处理过程,在图像预处理过程被广泛应用。SLIC算法是众多超像素分割算法中的典型代表[20],该算法基于颜色相似度和空间距离关系,利用改进的K均值聚类算法进行局部迭代聚类生成超像素。算法主要涉及两个关键参数:预分割的像素数(n)和像素紧凑度(m)。预分割的像素数n即为图像中的聚类中心数,按照所设定的n值在图像中均匀分配聚类中心,一般来说n越大所得超像素越小分割效果越好,但是同时也会大大增加计算量,影响整体效率,因此需要根据图像的大小合理设定n值;像素紧凑度m为每个类内的最大距离(包括空间距离和颜色距离)的权值,m值越大所分割的超像素边界越规则,较复杂的图片往往需要较小的m值。本试验所用图片大小2 592×1 944,n和m分别设置为10 000和10。
图2
 新窗口打开|下载原图ZIP|生成PPT
图2穗数人工获取过程
Fig. 2Ears manual counting process
图3
 新窗口打开|下载原图ZIP|生成PPT
图3麦穗识别过程
Fig. 3Ears segmentation process
(2)每个氮水平中(不考虑品种)随机裁剪5幅500×500的小麦图片,作为样本进行人工预分割,根据人工预分割结果对样本进行标记,将麦穗占比大于0.8的超像素标记为1,小于0.8的标记为0。
(3)对几个常用的颜色指数进行分析,选取适宜的指数作为分类特征[21,22]。具体包括超绿值(Eg)、归一化红绿指数(Dgr)和归一化蓝绿指数(Dgb),公式如下:
Eg = 2g-r-b;
Dgr = (g-r) / (g+r);
Dgb = (g-b) / (g+b)。
式中,g,r和b分别表示绿色分量值、红色分量值和蓝色分量值。
(4)利用MATLAB R2016a中的分类学习工具箱(classification learner),根据颜色特征分析结果,选取适宜的指数用作分类特征,选择几个常用的支持向量机(support vector machine,SVM)和K近邻(K nearst neighbour,NN)分类器进行训练(表1),根据训练结果中分类器的准确率选择最佳分类器。
Table 1
表1
表1不同类型分类器特征
Table 1
| 分类器类型 Classifier type | 预测速度 Prediction speed | 内存占用 Memory usage | 解释性 Interpretability | 模型灵活性 Model flexibility |
|---|---|---|---|---|
| 线性支持向量机 linSVM | 二分类:快 Binary: Fast 多分类:中 Multiclass: Medium | 中等 Medium | 简单 Easy | 低 Low 在类之间进行简单的线性分隔 Makes a simple linear separation between classes |
| 二次多项式支持向量机 quaSVM | 二分类:快 Binary: Fast 多分类:慢 Multiclass: Slow | 二分类:中等 Binary: Medium 多分类:大 Multiclass: Large | 困难 Hard | 中等 Medium |
| 三次多项式支持向量机 cubSVM | 二分类:快 Binary: Fast 多分类:慢 Multiclass: Slow | 二分类:中等 Binary: Medium 多分类:大 Multiclass: Large | 困难 Hard | 中等 Medium |
| 细高斯支持向量机 finGSVM | 二分类:快 Binary: Fast 多分类:慢 Multiclass: Slow | 二分类:中等 Binary: Medium 多分类:大 Multiclass: Large | 困难 Hard | 高,随内核刻度设置而减小 High, creases with kernel scale setting 类之间精细区分,内核刻度为sqrt(P)/4 Makes finely detailed distinctions between classes, with kernel scale set to sqrt(P)/4 |
| 中度高斯支持向量机 medGSVM | 二分类:快 Binary: Fast 多分类:慢 Multiclass: Slow | 二分类:中等 Binary: Medium 多分类:大 Multiclass: Large | 困难 Hard | 中等 Medium 中度区分,内核刻度为sqrt(P) Medium distinctions, with kernel scale set to sqrt(P) |
| 粗高斯支持向量机 coaGSVM | 二分类:快 Binary: Fast 多分类:慢 Multiclass: Slow | 二分类:中等 Binary: Medium 多分类:大 Multiclass: Large | 困难 Hard | 低 Low 在类之间粗区分,内核刻度为sqrt(P)*4,其中P为预测因子数 Makes coarse distinctions between classes, with kernel scale set to sqrt(P)*4, where P is the number of predictors |
| 细 K最近邻 finKNN | 中 Medium | 中等 Medium | 困难 Hard | 类之间细微差异区分,邻域数设为1 Finely detailed distinctions between classes. The number of neighbors is set to 1 |
| 中度 K最近邻 medKNN | 中 Medium | 中等 Medium | 困难 Hard | 类之间中等差异区分,邻域数设为10 Medium distinctions between classes. The number of neighbors is set to 10 |
| 粗 K最近邻 coaKNN | 中 Medium | 中等 Medium | 困难 Hard | 类之间粗略差异区分,邻域数设为100 Coarse distinctions between classes. The number of neighbors is set to 100 |
| 余弦 K最近邻 cosKNN | 中 Medium | 中等 Medium | 困难 Hard | 使用余弦距离度量,在类之间中等区分,邻域数设为10 Medium distinctions between classes, using a cosine distance metric. The number of neighbors is set to 10 |
| 三次多项式 K最近邻 cubKNN | 慢 Slow | 中等 Medium | 困难 Hard | 使用立方距离度量,在类之间中等区分,邻域数设为10 Medium distinctions between classes, using a cubic distance metric. The number of neighbors is set to 10 |
| 加权 K最近邻 weiKNN | 中 Medium | 中等 Medium | 困难 Hard | 使用权重距离度量,在类之间中等区分,邻域数设为10 Medium distinctions between classes, using a distance weight. The number of neighbors is set to 10 |
新窗口打开|下载CSV
(5)通过所选取的分类器对预处理后的图像进行麦穗分类识别,分类后结果进行简单的形态学处理,去除背景碎片后即为麦穗识别结果。
1.4 麦穗自动计数方法
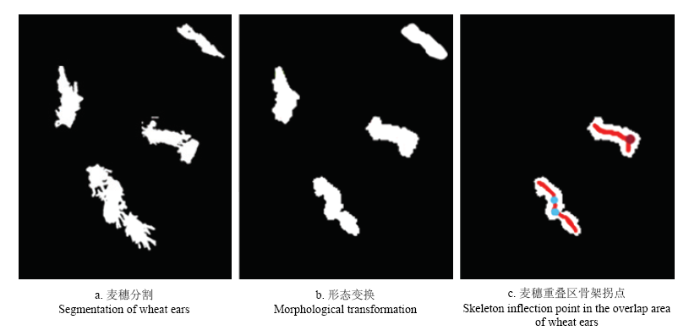
如图4所示,对麦穗识别结果二值化,通过腐蚀膨胀等形态学变换[23],保留麦穗的主体部分弱化边缘,减少邻近麦穗的黏连情况。对二值图进行区域统计,计算出二值图中区域数目(nregion)、面积等属性。由于大田环境复杂且灌浆期随着籽粒的充实麦穗形态普遍较大,形态学处理后的二值图中仍存在少量麦穗重叠部分,根据区域的面积和形态(长宽比)等参数筛选出麦穗重叠区,针对重叠区进行骨架提取[24,25]并计算骨架拐点数[26](npoint),重叠区麦穗数为npoint + 1,总麦穗数为nregion + npoint。图4
 新窗口打开|下载原图ZIP|生成PPT
图4穗数统计过程
Fig. 4Ears counting process
1.5 统计分析
在SPSS 22.0中采用Pearson相关系数(r)和线性回归分析方法,分析麦穗自动统计数目与人工计数的关系,比较不同氮水平下麦穗自动统计数目与人工计数的相关性,以人工计数为标准计算准确率(A)。通过比较不同氮水平下的计数准确率,分析长势差异对该方法识别效果的影响。准确率A计算公式如下:$A=\left( 1-\frac{\left| {{N}_{c}}-{{N}_{a}} \right|}{{{N}_{a}}} \right)\times 100%$
式中,Nc为自动统计值,Na为人工计数值,A为准确率。
2 结果
2.1 麦穗识别
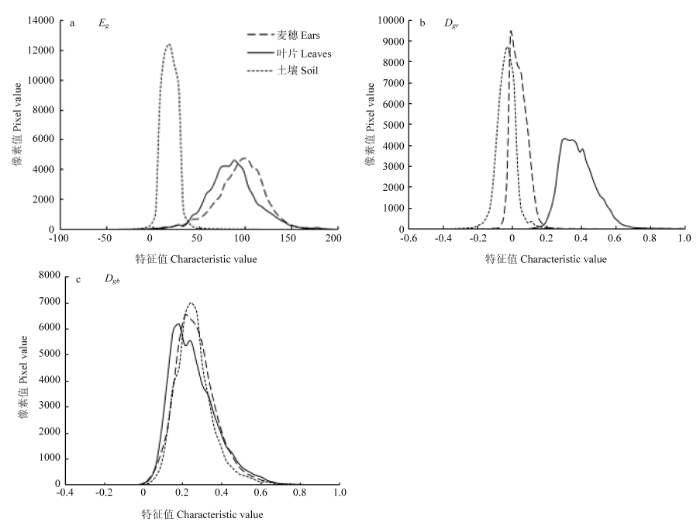
2.1.1 分类特征分析 本研究选用超绿值(Eg)、归一化红绿指数(Dgr)和归一化蓝绿指数(Dgb)这3个与G分量相关的颜色指数,分别对灌浆期麦穗样本、叶片样本和土壤样本进行计算分析(图5)。结果表明,土壤部分的Eg值整体偏小且分布集中,与麦穗部分几乎没有重叠,而叶片与麦穗的Eg分布范围和曲线形态都极为相近,重叠现象严重,因此Eg可以用于麦穗和土壤的区分,但是无法解决图像中的叶片干扰(图5-a);土壤部分的Dgr整体偏小,在大于0的部分与麦穗曲线有着严重的重叠,但是叶片整体分布Dgr值较大区域与麦穗曲线重叠不明显,且峰值差异大,对麦穗和叶片有较好的区分效果;3种样本的Dgb曲线几乎重叠,对麦穗识别意义不大。图5
 新窗口打开|下载原图ZIP|生成PPT
图5颜色直方图
a:超绿指数Eg,b:归一化红绿指数Dgr,c:归一化蓝绿指数Dgb
Fig. 5Color histogram
a: Super green index, Eg; b: Normalized red green index, Dgr; c: Normalized blue green index, Dgb
2.1.2 分类器训练结果 选取Eg和Dgr为分类特征,对MTLAB R2016a自带的分类学习工具箱中SVM和KNN分类器(表1)进行训练,根据训练结果,确定适宜的分类器(表2)。结果表明,无氮水平下(N1)分类准确率均达到80%,medGSVM分类器准确率最高,为87.2%;低氮水平下(N2)各分类器准确率差异不大,均在90%左右,finGSVM分类器最为理想,准确率为92.6%;正常氮水平下(N3),几乎所有分类器准确率均达到90%,medGSVM分类器最为理想,准确率达93.5%;高氮水平下(N4),所有分类器准确率均高于90%,cubSVM分类器最为理想,准确率为93.8%;氮水平混合的情况下,weiKNN分类器最为理想,准确率为88.2%。在单一氮水平下,SVM分类器表现更为理想,有较高的准确率,而对于混合样本,KNN分类器准确率则高于SVM分类器。随着氮素水平的提高,分类准确率有所提升,并趋于稳定,例如N2较N1分类准确率提高了5.4%,N3较N2分类准确率提高了0.9%,N4较N3分类准确率仅提高了0.3%。总体而言,施氮样本(N2、N3、N4)分类准确率相近,无氮处理下植株长势较差,在均一度、颜色、大小等方面与施氮样本有鲜明差异,因此混合样本内部差异较大,分类准确率较低。
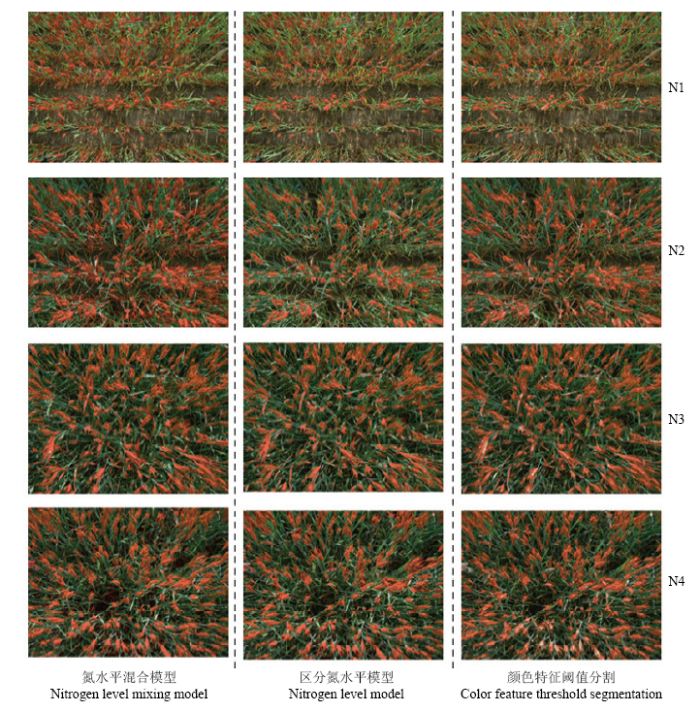
2.1.3 麦穗识别结果 利用所确定的分类器分别对预处理后的图像进行麦穗分类识别(图6)。作为对照,利用颜色特征Eg和Dgr对小麦图进行自动阈值计算,叠加2次阈值分割结果即为基于像素的麦穗识别结果。结果表明,区分氮水平的麦穗识别结果较混合氮水平的分类器识别效果更优,所得麦穗部分叶片混杂明显减少;对比基于像素的阈值分割结果,基于超像素的识别结果中麦穗主体更为完整,有效改善穗部斑块缺失,麦穗的形态、大小均得到更好的表达;随着氮素水平的提高,麦穗形态更为清晰,分割效果有所提升,施氮区域(N2、N3、N4)麦穗均能被有效识别,分类效果与分类器训练结果一致。
图6
 新窗口打开|下载原图ZIP|生成PPT
图6麦穗识别结果
Fig. 6Ears segmentation results
Table 2
表2
表2分类器训练结果(分类准确率,%)
Table 2
| 分类器类型 Classifier type | 氮水平 Nitrogen level | ||||
|---|---|---|---|---|---|
| N1 | N2 | N3 | N4 | 混合 Mix | |
| linSVM | 81.2 | 86.2 | 90.1 | 90.9 | 85.1 |
| quaSVM | 86.1 | 89.7 | 91.9 | 92.8 | 87.6 |
| cubSVM | 86.6 | 89.5 | 92.2 | 93.8 | 56.8 |
| finGSVM | 84.9 | 92.6 | 90.7 | 93.1 | 88.2 |
| medGSVM | 87.2 | 90.5 | 93.5 | 92.7 | 88.2 |
| coaGSVM | 82.4 | 87.0 | 90.6 | 90.8 | 86.3 |
| finKNN | 85.0 | 89.5 | 87.0 | 92.3 | 85.2 |
| medKNN | 85.8 | 89.9 | 92.3 | 93.0 | 85.2 |
| coaKNN | 83.4 | 88.4 | 90.8 | 90.9 | 87.2 |
| cosKNN | 84.8 | 89.4 | 91.1 | 93.0 | 87.1 |
| cubKNN | 85.5 | 89.8 | 92.0 | 91.4 | 87.1 |
| weiKNN | 86.4 | 91.1 | 92.1 | 92.2 | 88.2 |
新窗口打开|下载CSV
2.2 穗数统计
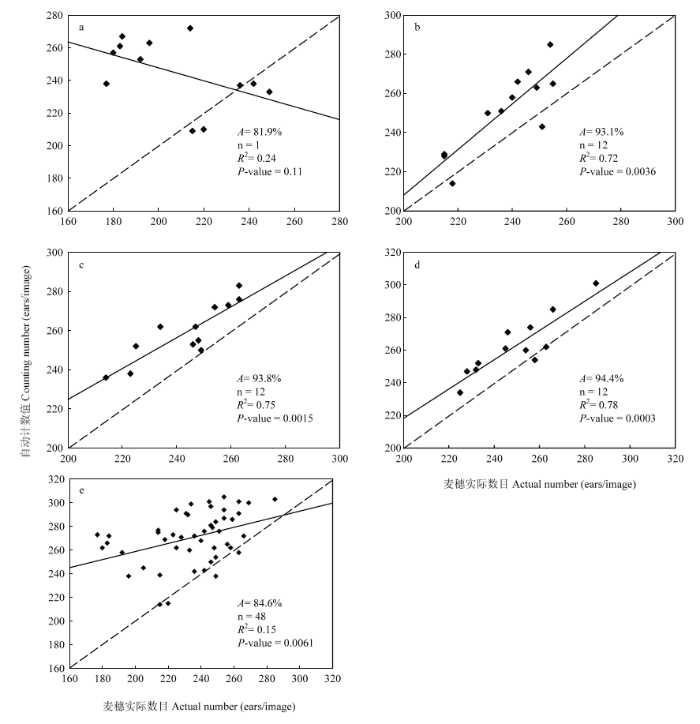
2.2.1 不同氮肥水平的麦穗计数结果 分别将样本按氮肥水平划分和忽略氮肥水平混合,训练相应分类模型对超像素块分类提取麦穗,对麦穗识别结果进行自动穗数统计,以人工计数结果作为穗数的真实值计算计数准确率,对自动统计所得穗数和实际穗数进行线性回归分析,形成1﹕1关系图(图7)。比较不同氮水平下的麦穗统计结果,无氮水平下计数准确率为81.9%,穗数较少时统计结果存在严重偏差,穗数统计值与实际值间相关性也较差(R2 = 0.24,P>0.05),表现为差异不显著,麦穗统计效果差。其他3种施氮水平下均有较准确率(AN2 = 93.1%,AN3 = 94.1%,AN4 = 94.4% ),且穗数自动统计值与实际值之间也有较好的相关性(R2N2 = 072,R2N3 = 0.75,R2N4 = 0.78),均达到极显著相关(P<0.01),麦穗自动计数准确率较高。随着氮素水平的上升,麦穗自动计数效果有所改善,高氮水平下效果最优,准确率达94.4%。穗数统计是基于麦穗识别结果的二值图进行区域处理和统计计算的,因此不同氮水平下的穗数统计效果与麦穗识别效果表现一致,在无氮条件下适用性较差,施氮区域均能有效统计。在忽略氮水平混合所有样本情况下,麦穗自动计数准确率为84.6%,R2为0.15,在本研究平均每幅图中240穗的情况下,统计效果较差,无法满足实际生产上的穗数统计要求。图7
 新窗口打开|下载原图ZIP|生成PPT
图7麦穗统计结果
a. 无氮,b.低氮,c. 正常氮,d. 高氮,e.氮水平混合
Fig. 7Ears counting results
a. Nitrogen-free, b. Low-nitrogen, c. Normal nitrogen, d. High nitrogen, e. Nitrogen level mixing
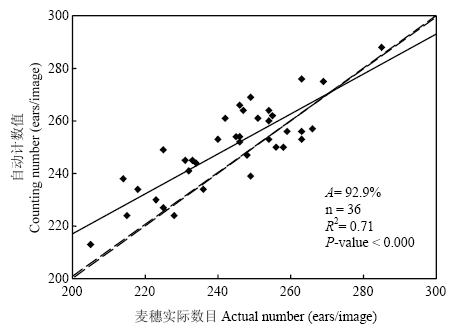
2.2.2 施氮区综合麦穗计数结果 根据上述分析结果,在训练样本中排除极端的无氮样本,对其余混合样本进行K-means聚类,建立具有代表性的混合样本集用于分类器训练。根据训练结果(表3),综合考虑总体分类准确率和穗部分类准确率,选择weiKNN分类器用于识别麦穗,对麦穗识别结果进行自动穗数统计(图8)。与直接混合所有氮水平的统计结果(图7-e)相比,统计效果明显改善,计数准确率由84.6%提高到了92.9%,穗数统计值与实测值相关性也有明显改善,R2由0.15提高到了0.71。因此,在施氮区域可以忽略氮水平差异进行的麦穗识别统计,统计结果较为可靠。
Table 3
表3
表3施氮样本分类训练结果
Table 3
| 分类器类型 Classifier type | 总体准确率 Overall accuracy (%) | 穗部准确率 Ear accuracy (%) | 背景准确率 Background accuracy (%) |
|---|---|---|---|
| linSVM | 87.1 | 88.0 | 86.0 |
| quaSVM | 89.2 | 91.0 | 87.0 |
| cubSVM | 84.0 | 77.0 | 91.0 |
| finGSVM | 89.2 | 89.0 | 90.0 |
| medGSVM | 89.5 | 91.0 | 88.0 |
| coaGSVM | 88.0 | 90.0 | 86.0 |
| finKNN | 87.4 | 87.0 | 87.0 |
| medKNN | 89.4 | 90.0 | 89.0 |
| coaKNN | 89.1 | 93.0 | 86.0 |
| cosKNN | 88.8 | 88.0 | 90.0 |
| cubKNN | 88.9 | 89.0 | 88.0 |
| weiKNN | 90.2 | 93.0 | 88.0 |
新窗口打开|下载CSV
图8
 新窗口打开|下载原图ZIP|生成PPT
图8施氮区麦穗统计结果
Fig. 8Ears counting result in nitrogen application
3 讨论
麦穗自动计数的准确度建立在可靠的麦穗图像分割之上的。在目前的图像分割方法中,根据目标特性提取的图像特征,主要包括颜色、纹理、形状[27]。然而,用纹理特征对灌浆期小麦进行麦穗分割时受叶片干扰较大,效果不理想[28]。由于灌浆期小麦群体较大,麦穗遮挡严重,形状特征也很难准确提取[29]。根据田间观察,在灌浆期,麦穗有着明显的颜色变化,逐渐由绿色转为黄绿色,而茎秆和叶片部分仍保持绿色,颜色特征可适用于该时期的麦穗分割,这也与前人的研究一致[30]。此外,大部分图像分割算法均以像素作为基本处理对象,忽略了像素之间固有的空间信息,对于非结构化的自然场景下的图像处理效果不佳。而且随着科技的发展,遥感技术的应用越来越广泛,面对大尺寸的遥感影像时,直接基于像素的分割方法在计算效率上难以满足需求。与像素相比,超像素的优势主要体现为对像素之间空间组织关系的有效利用以及降低处理对象规模和后续处理的计算复杂度,提高处理效率[31,32,33]。基于前人研究[34,35],本研究用超像素分割对图像进行预处理并提取颜色信息用作麦穗特征描述,旨在获得高效准确的麦穗识别效果。利用提取的图像特征,本研究采用SVM和KNN两种分类器模型来进行麦穗识别。结果表明,在单一氮水平下SVM分类器表现更为理想,有较高的分类准确率,而对于混合样本,KNN分类器分类准确率优于SVM分类器。众所周知,SVM作为建立在统计学习理论基础上的分类方法在解决小样本、非线性及高维模式识别中表现出许多特有的优势,然而在面对训练样本和支持向量数目多的分类问题时,效果不甚理想[36]。KNN作为经典的懒惰学习方法,计算量大,效率较低,然而对于类域的交叉较多的或者大规模的待分样本集来说有很好的适用性[37]。本研究结果从样本量因素考虑,即样本量较小时SVM分类器效果较优,样本量较大时KNN分类器更为适用,与此两种分类器特性相符。
不同氮梯度处理下的识别结果表明,无氮处理相比其他氮处理,麦穗识别效果较差。由于严重缺氮,无氮处理下的小麦植株细弱,叶片、茎秆与麦穗均呈黄绿色,在这种情况下提取图像颜色特征用于麦穗识别,错分现象严重,识别效果较差;同时受穗形短小影响,在分类后处理过程中,面积较小的麦穗极易被误判为背景碎片被去除,引起严重的漏分。因此无氮处理下麦穗识别效果不尽人意。
本研究选取灌浆期小麦田间影像进行分析,结合小麦的生育进程,花后籽粒受精麦穗体积不断增大,随着籽粒的灌浆充实逐渐达到顶满仓,麦穗体积达到最大值,因此该时期田间影像中麦穗为主要成分。在此之前的开花期,田间影像中叶片比重较大,相反麦穗比例较小,不利于图像特征提取和分析。在此之后的成熟期,随着籽粒成熟,叶片逐渐衰老,植株整体呈金黄色,麦穗与植株的区分度降低,并且田间影像中土壤背景的影响增加了图像特征提取难度。因此本研究认为灌浆期是利用颜色特征识别麦穗的最佳时期。然而灌浆期内小麦形态和颜色变化鲜明,本研究仅选用了单一时期影像,多生育时期结合对田间图像解析和麦穗识别的影响仍有待进一步探究。此外,本研究所采用的数码相机为普通消费级相机(SONY DSC-HX200),由于未进行严格的检校,在近距离获取图像时,其存在较大的光学误差和边缘畸变误差。在麦穗图像获取过程中,田间情况复杂,叶片与麦穗姿态各异,导致相同麦穗的光照条件存在差异,使得图像上麦穗的颜色特征发生较大差异,降低了基于颜色特征分割方法的准确率。以上这些因素均降低了麦穗的识别效果,因此还需要进一步研究,探究一种更好表达麦穗特征的图像获取和处理方法,从而改善麦穗识别效果,提高计数准确率。
4 结论
通过颜色直方图分析,利用颜色特征Eg和Dgr可以有效识别灌浆期麦穗。相较于基于像素的分割方法,基于超像素块分割得到的麦穗形态更为完整,边缘信息保持较好,错分现象也有所改善。受不同氮素水平下小麦长势差异影响,该方法在长势较好的高氮水平下麦穗识别统计效果最优(AN4 = 94.4%),在正常氮(AN3 = 94.1%)和低氮水平(AN2 = 93.1%)下同样适用,长势较差的无氮水平(AN1 = 81.9%)下效果较差。针对混合样本,排除极端无氮情况后,样本长势差异减小,麦穗统计结果有明显改善,准确率达到92.9%,提高了8.3%。因此在一般环境下,利用超像素和颜色特征的麦穗自动统计方法可以快速准确地对大田小麦进行穗数计算,长势过弱以及差异过大区域不推荐使用。参考文献 原文顺序
文献年度倒序
文中引用次数倒序
被引期刊影响因子
DOI:10.3321/j.issn:0496-3490.2006.11.017URLMagsci [本文引用: 1]

以8个不同类型的超级小麦新品种(系)为材料,研究了不同土壤肥力条件下3种类型超级小麦的产量构成因素变化及其对籽粒产量的相关分析和通径分析。结果表明,在高肥地力下,大穗型品种和中间型品种的产量高于多穗型品种;而中、低肥力下,多穗型品种的产量又显著高于大穗型品种。在本试验条件下,大穗型和多穗型品种的穗数、
DOI:10.3321/j.issn:0496-3490.2006.11.017URLMagsci [本文引用: 1]
以8个不同类型的超级小麦新品种(系)为材料,研究了不同土壤肥力条件下3种类型超级小麦的产量构成因素变化及其对籽粒产量的相关分析和通径分析。结果表明,在高肥地力下,大穗型品种和中间型品种的产量高于多穗型品种;而中、低肥力下,多穗型品种的产量又显著高于大穗型品种。在本试验条件下,大穗型和多穗型品种的穗数、
URL [本文引用: 1]
1997年山东省和全国各地一样小麦获得大丰收。麦收前由省科委和农业厅牵头组成专家组对全省各地的小麦超高产攻关田进行考察与实打验收。有16块高产田达标(9000kg/hm2)。烟台地区还刷新了北方冬麦区两项高产记录。龙口市北马镇前诸留村的1.163hm...
.
URL [本文引用: 1]
1997年山东省和全国各地一样小麦获得大丰收。麦收前由省科委和农业厅牵头组成专家组对全省各地的小麦超高产攻关田进行考察与实打验收。有16块高产田达标(9000kg/hm2)。烟台地区还刷新了北方冬麦区两项高产记录。龙口市北马镇前诸留村的1.163hm...
DOI:10.3390/s18010123URLPMID:29300315 [本文引用: 1]
Hyperspectral imaging covering the spectral range of 384 1034 nm combined with chemometric methods was used to detectSclerotinia sclerotiorum(SS) on oilseed rape stems by two sample sets (60 healthy and 60 infected stems for each set). Second derivative spectra and PCA loadings were used to select the optimal wavelengths. Discriminant models were built and compared to detect SS on oilseed rape stems, including partial least squares-discriminant analysis, radial basis function neural network, support vector machine and extreme learning machine. The discriminant models using full spectra and optimal wavelengths showed good performance with classification accuracies of over 80% for the calibration and prediction set. Comparing all developed models, the optimal classification accuracies of the calibration and prediction set were over 90%. The similarity of selected optimal wavelengths also indicated the feasibility of using hyperspectral imaging to detect SS on oilseed rape stems. The results indicated that hyperspectral imaging could be used as a fast, non-destructive and reliable technique to detect plant diseases on stems.
DOI:10.3969/j.issn.1002-6819.2014.18.023URLMagsci [本文引用: 1]
实现对受到病原侵染的小麦植株进行早期检测,对于小麦病害的监测预警和及早防治具有重要意义。为研究热红外成像技术早期检测小麦病害的可行性,该研究以小麦条锈病为例,以健康小麦植株、条锈病潜育期和发病期小麦植株为试验材料,利用热红外成像技术采集他们的热红外图像和叶片温度,在潜育期内连续检测其热红外图像和叶片温度随接种天数的变化。通过图像对比发现,接种后第5天,肉眼观察热红外图像可将受到侵染但未显症的小麦植株与健康植株区分开来。进一步数据处理,表明接种后第3天处于条锈病潜育期的小麦植株叶片平均温度和不同部位最大温差分别比健康植株叶片的低0.08℃和高0.04℃(P<0.05),可将处于条锈病潜育期的小麦植株与健康植株区分开来。随着接种后天数的增加,处于条锈病潜育期的小麦植株叶片的平均温度和最大温差与健康小麦植株叶片的差异逐渐增大。接种后第12天,接种小麦植株叶片平均温度比健康植株叶片低1.22℃,接种小麦植株叶片最大温差比健康植株叶片高1.58℃。可见,利用热红外成像技术可以早期检测到小麦受到病原侵染后的温度变化,热红外成像技术作为一种小麦病害早期检测的方法是可行的。
URL [本文引用: 1]
小麦白粉病和条锈病是小麦常发病害中为害较重的两种病害, 在我国小麦产区均有发生, 但它们由不同病原引起, 需要采取不同的防治措施。 因此, 快速、 准确的获取小麦病害类型信息对于病害的防治具有重要的指导意义。 遥感数据具有快速、 准确的获取空间上连续信息的特点, 提出一种基于实测冠层高光谱数据信息的小麦病害定量识别方法。 通过对标准化光谱进行连续小波变换, 分析350~1 300 nm范围内各波段及其连续小波特征与小麦白粉病和条锈病之间的相关性, 以及在不同病害间的差异性, 筛选出对不同病害敏感的光谱波段(SBs)和小波特征(WFs), 然后采用Fisher判别分析法分别基于SBs, WFs以及结合SBs和WFs建立小麦白粉病、 条锈病及正常小麦识别模型, 分别采用未参与建模的55个地面调查数据和留一法进行验证。 结果显示: (1)基于WFs模型的总体识别精度(分别为92.7%和90.4%)明显高于基于SBs模型的总体识别精度(分别为65.5%和61.5%); (2)SBs和WFs结合模型的总体识别精度(分别为94.6%和91.1%)略高于基于WFs模型的总体识别精度, 在Fisher80-55模型中白粉病和正常样本的生产者精度提高了10%以上。 (3)条锈病样本能在基于WFs和SBs & WFs的模型中准确判别出来, 用户精度和生产者精度均达到100%。 结果表明采用作物光谱信息能够准确的识别健康作物和不同类型的作物病害, 为采用遥感影像进行大范围作物病害识别提供了理论基础, 对于指导作物病害防治具有实际应用价值。
DOI:10.3864/j.issn.0578-1752.2017.16.005URL [本文引用: 1]
[目的]卫星遥感具有覆盖范围广、获取速度快、信息量大、动态性强等优势,能够及时准确地获取作物产量信息,反映作物产量空间变化趋势。遥感技术作物估产已成为现代农业生产中研究热点。通过改善遥感估产建模方法,以实现进一步提高大田作物遥感估产精度,为宏观了解不同区域作物产量形成情况及变化趋势提供直观、可靠的参考。[方法]论文结合2011—2012年江苏省大丰、兴化、姜堰、泰兴、仪征5个县区的定点观测试验,以国产卫星产品HJ-1A/1B影像为遥感数据,于小麦开花期开展大田定位观测区卫星遥感植被指数、关键生长指标与收获期单产间的定量分析。通过对产量与小麦生长指标以及植被指数进行定量关系分析,进一步增强遥感反演的机理性和重演性。将卫星遥感变量与小麦产量进行相关关系分析作为遥感估产的直接建模方法,间接建模方法则是选取与产量相关性较好的遥感变量以及与遥感变量相关性较好的主要苗情指标,利用筛选得到的敏感遥感变量,首先监测对应的小麦生长指标,结合该小麦生长指标与产量间的定量关系,进而建立间接估产模型,利用此模型进行小麦遥感间接估产。利用直接和间接建模方法,以相关性最高为原则,筛选估算产量的敏感卫星遥感变量。以2012年试验数据为建模样本,采用线性回归分析方法,分析小麦开花期苗情指标、产量与卫星遥感变量两两之间的相关性,分别构建以遥感植被指数为基础的大田小麦估产模型,与地面实测结果一起建立模型共同分析。以2011年试验数据为验证样本,选取评价指标拟合度(R2)和均方根误差(RMSE),对两类模型的估算精度进行验证和比较,以提高遥感反演的定量化水平和可信度。[结果]分别以差值植被指数(difference vegetation index,DVI)和比值植被指数(ratio vegetation index,RVI)为基础
DOI:10.1016/j.fcr.2016.08.008URL [本文引用: 1]
Nitrogen (N) supply significantly influences plant growth and crop yields. To investigate the dynamic process of wheat plant responses to nitrogen management, digital infrared thermography was used to detect canopy average temperature (CAT) during different wheat growth stages in three field management experiments, including N applied rates, N application methods and cultivation approaches, which were conducted in 2013–2014 in southeast China. The CAT was reduced with increased N rates, compared to the control (0N), applications of 300kgNha611reduced CAT by 14.0%, 10.7% and 9.2% at the tillering, heading and milking stages, respectively. The CAT was also sensitive to N application methods, in which the CAT of the farmers’ fertilizer practice (FFP) was lower and higher than that of the optimal N management (OPT) before the heading stage and after the heading stage, respectively. Considering the cultivation approaches, the effects of deep tillage (NC-DP) on the CAT was more efficient than normal cultivation (NC) in wheat production. Lower CAT was observed for higher wheat biomass and yield, as a result of the CAT being somewhat negatively correlated with leaf N content. The wheat yield could be estimated by monitoring the CAT based on the response curves of the grain yield and CAT to the N addition rate, which was associated with stomatal conductance and transpiration rate. In conclusion, our results indicated that canopy temperature may provide an effective tool for dynamical monitoring of wheat growth and yields.
DOI:10.3389/fpls.2016.00666URLPMID:4870241 [本文引用: 1]
Maize crop production is constrained worldwide by nitrogen (N) availability and particularly in poor tropical and subtropical soils. The development of affordable high-throughput crop monitoring and phenotyping techniques is key to improving maize cultivation under low-N fertilization. In this study several vegetation indices (VIs) derived from Red-Green-Blue (RGB) digital images at the leaf and canopy levels are proposed as low-cost tools for plant breeding and fertilization management. They were compared with the performance of the normalized difference vegetation index (NDVI) measured at ground level and from an aerial platform, as well as with leaf chlorophyll content (LCC) and other leaf composition and structural parameters at flowering stage. A set of 10 hybrids grown under five different nitrogen regimes and adequate water conditions were tested at the CIMMYT station of Harare (Zimbabwe). Grain yield and leaf N concentration across N fertilization levels were strongly predicted by most of these RGB indices (withR2~ 0.7), outperforming the prediction power of the NDVI and LCC. RGB indices also outperformed the NDVI when assessing genotypic differences in grain yield and leaf N concentration within a given level of N fertilization. The best predictor of leaf N concentration across the five N regimes was LCC but its performance within N treatments was inefficient. The leaf traits evaluated also seemed inefficient as phenotyping parameters. It is concluded that the adoption of RGB-based phenotyping techniques may significantly contribute to the progress of plant breeding and the appropriate management of fertilization.
DOI:10.14088/j.cnki.issn0439-8114.2016.09.055URL [本文引用: 1]
为了比较玉米品种图像识别中各 种神经网络识别模型的性能,搭建了一套基于统计特征提取和模式识别分类算法的玉米品种识别系统。采用扫描仪获得了11个玉米品种每个品种50粒子粒图像, 基于图像的统计特征,分别研究了7种人工神经网络(ANN)模型(BP、rbf、grnn、pnn、compet、sofm、ELM)的识别性能,进一步 考察了极限学习机(ELM)、支持向量机(SVM)模式分类过程性能。结果表明,在同样的情况下SVM模型较ANN模型的特征识别率高,另外神经网络模型 grnn和ELM识别效果较好,其他识别模型性能较差。对11个玉米品种种子的最高检出率为91.73%,另外,所采用的特征降维方法、特征维数、初始权 值的随机性选择等因素都会影响模型的识别效果。这对玉米种子纯度和品种真实性检验中人工神经网络模型的构建具有指导意义。
DOI:10.6041/j.issn.1000-1298.2017.04.040URL [本文引用: 1]
以“乔纳金”苹果,“红富士”苹果和“秦冠”苹果共90个试验样本为试材分别采集865 ~1 711 nm的近红外波段高光谱图像,选取苹果图像感兴趣区域(ROI),以分辨率2.8 nm提取其平均反射光谱数据,分别利用K近邻法(KNN)和径向基核函数支持向量机(RBF-SVM)进行品种判别,5折交叉检验.结果表明,3种苹果的近红外高光谱图像均在波长941 ~1602nm之间变得清晰,该区域200个波段下的平均反射光谱数据经KNN法中的10种距离算法评判,当K取值3和5时,切比雪夫距离、欧几里得距离和明可夫斯基距离3种距离算法的识别正确率均达到100%;SVM-RBF核函数模型中,γ取值为2-8~1的范围内识别正确率均在92%以上,当γ取值2-5,C取值为16和32时,识别正确率最高,为96.67%.故利用近红外高光谱图像技术结合KNN计算对苹果品种进行快速鉴别是优异和可靠的方案.
URL [本文引用: 1]
为了提高植物种类的识别率,采用叶片图像算法。首先建立植物种类特征模型,包括植物叶片颜色特征、形状特征、纹理特征;然后确定径向基函数神经网络的输入层、输出层、隐含层之间的关系;接着对径向基函数个数、中心及宽度优化,基于梯度下降方法对权重参数计算,自适应调节学习率;最后给出了植物种类识别过程。实验仿真选择植物叶片颜色特征、形状特征、纹理特征的特征量分别为6、7、7个,其中本文算法对植物种类识别的三个组合特征平均识别率为93.5%,高于单个特征、两个组合特征的平均识别率,形状特征对识别率所起的作用最大。
URL [本文引用: 1]
为了提高植物种类的识别率,采用叶片图像算法。首先建立植物种类特征模型,包括植物叶片颜色特征、形状特征、纹理特征;然后确定径向基函数神经网络的输入层、输出层、隐含层之间的关系;接着对径向基函数个数、中心及宽度优化,基于梯度下降方法对权重参数计算,自适应调节学习率;最后给出了植物种类识别过程。实验仿真选择植物叶片颜色特征、形状特征、纹理特征的特征量分别为6、7、7个,其中本文算法对植物种类识别的三个组合特征平均识别率为93.5%,高于单个特征、两个组合特征的平均识别率,形状特征对识别率所起的作用最大。
DOI:10.1016/j.rse.2017.06.007URL [本文引用: 1]
DOI:10.1016/j.fcr.2017.11.024URL [本文引用: 1]
Field-based next generation phenotyping has become of great interest to plant breeders and agricultural researchers in recent years, particularly for circumventing destructive or impractical phenotyping methods commonly used for certain traits. The non-destructive estimation of one such trait, above ground biomass (AGB), has been investigated repeatedly using 2D imagery, though little research has been conducted on 3D methods. The aims of the current study were to (i) investigate the use of readily-available consumer level digital cameras and software to estimate AGB, canopy height (CH) and harvest index (HI) of wheat plots, (ii) investigate the suitability of this data as a replacement for destructive sampling methods within a wheat breeding programme, and (iii) identify the point cloud density required for accurate estimation of AGB. To achieve this, a small plot trial of a single wheat cultivar was conducted in an irrigated nursery, at Roseworthy, South Australia. At physiological maturity plots were measured for CH and whole plots were harvested to attain AGB and threshed to measure grain yield and calculate HI. Prior to harvesting each plot was imaged using a digital camera, with these images being processed into 3D point clouds, which were subsequently used to estimate plot volume and CH. Strong correlations were observed between actual measurements of AGB, CH and HI to those estimated from point clouds. Images were processed in subset batches to determine an optimal number of images for processing. Stronger correlations between AGB and plot volume were observed when more images were processed, though as few as 48 images provided sufficiently accurate estimates of AGB. These methods were shown to be effective at estimating AGB, CH and HI and could be adopted by small scale research programmes. This study shows that a higher-throughput adaptation of this photogrammetry method could be used in phenotype intensive research such as plant breeding programmes.
DOI:10.3969/j.issn.1003-188X.2013.03.007URL [本文引用: 1]
单位面积麦穗数是小麦产量预测的一个重要参数,如何从图像上自动识别出麦穗数是测产的关键。为此,使用Sobel算子对麦穗图像进行边缘检测,使麦穗从混有少量杂草的模糊的背景中分割开,并与加权平均法、G分量法和最大值法处理后的图像进行了比较。随机选取麦穗无交叉的50幅图像样本,分别使用上述方法处理,Sobel算子法与其他3种方法相比,图像分割的总体耗时至少减少了10%。实验结果表明,Sobel算子对麦穗图像分割是有效的。
.
DOI:10.3969/j.issn.1003-188X.2013.03.007URL [本文引用: 1]
单位面积麦穗数是小麦产量预测的一个重要参数,如何从图像上自动识别出麦穗数是测产的关键。为此,使用Sobel算子对麦穗图像进行边缘检测,使麦穗从混有少量杂草的模糊的背景中分割开,并与加权平均法、G分量法和最大值法处理后的图像进行了比较。随机选取麦穗无交叉的50幅图像样本,分别使用上述方法处理,Sobel算子法与其他3种方法相比,图像分割的总体耗时至少减少了10%。实验结果表明,Sobel算子对麦穗图像分割是有效的。
DOI:10.1186/s13007-017-0231-1URL [本文引用: 1]
The spike of a cereal plant is the grain-bearing organ whose physical characteristics are proxy measures of grain yield. The ability to detect and characterise spikes from 2D images of cereal plants, such as wheat, therefore provides vital information on tiller number and yield potential. We have developed a novel spike detection method for wheat plants involving, firstly, an improved colour index method for plant segmentation and, secondly, a neural network-based method using Laws texture energy for spike detection. The spike detection step was further improved by removing noise using an area and height threshold. The evaluation results showed an accuracy of over 80% in identification of spikes. In the proposed method we also measure the area of individual spikes as well as all spikes of individual plants under different experimental conditions. The correlation between the final average grain yield and spike area is also discussed in this paper. Our highly accurate yield trait phenotyping method for spike number counting and spike area estimation, is useful and reliable not only for grain yield estimation but also for detecting and quantifying subtle phenotypic variations arising from genetic or environmental differences.
DOI:10.13733/j.jcam.issn.2095-5553.2016.06.46URL [本文引用: 1]
小麦穗长和小穗数能够直接反映小麦产量,是育种家非常关心的两个穗部形态参数。为快速测量这两个参数,本文提出一种基于图像处理技术的穗长和小穗数同步测量方法,首先采用形态学处理算法去除麦芒得到麦穗主部图像,然后采用拟合麦穗主部中心曲线的方法来计算麦穗长度,最后采用将曲线穿过小穗区域并统计灰度差异的方法计算小穗数。针对4个品种的50个麦穗进行测量试验,以验证算法性能。试验结果表明,本文穗长和小穗数同步提取算法不仅适用于较直立的麦穗,而且适用于弯曲的麦穗;和人工用直尺沿穗身测量穗长的方法相比,本文穗长提取算法测量结果的平均绝对误差为0.47cm,相对误差为3.95%;和人眼计数测量小穗数的方法相比,本文小穗数提取算法测量结果的平均绝对误差为1.6(≈2),相对误差为7.89%,能有效同步测量穗长和小穗数。
DOI:10.15888/j.cnki.csa.006030URL [本文引用: 1]
针对小麦育种中小麦单穗粒数品质测定的问题,本文提出了一种基于图像分形分割的麦穗粒数计算方法.首先,利用分形几何中分数维概念,计算图像分形维数作为像元特征,根据像元特征选定一个适当的阈值分割麦穗图像;然后通过分析分割图像的行像素的灰度特征,计算麦穗与图像竖直方向的倾角,按此倾角旋转麦穗图像使麦穗处于图像竖直方向,得到旋转后的麦穗角度矫正图;最后,根据矫正图像的列数据波形特征计算麦穗粒数.实验证明该方法比传统测量方法流程更简洁,准确率更高,计算速度更快,可用于小麦育种中穗粒数测定.
DOI:10.15888/j.cnki.csa.006030URL [本文引用: 1]
针对小麦育种中小麦单穗粒数品质测定的问题,本文提出了一种基于图像分形分割的麦穗粒数计算方法.首先,利用分形几何中分数维概念,计算图像分形维数作为像元特征,根据像元特征选定一个适当的阈值分割麦穗图像;然后通过分析分割图像的行像素的灰度特征,计算麦穗与图像竖直方向的倾角,按此倾角旋转麦穗图像使麦穗处于图像竖直方向,得到旋转后的麦穗角度矫正图;最后,根据矫正图像的列数据波形特征计算麦穗粒数.实验证明该方法比传统测量方法流程更简洁,准确率更高,计算速度更快,可用于小麦育种中穗粒数测定.
DOI:10.6041/j.issn.1000-1298.2014.02.047URL [本文引用: 1]
The number of wheatears in each square meter is a main parameter of grain production estimate. In order to intelligently calculate the number of wheatears in certain parts, a in-field wheatear counting method based on image analysis technique was designed. Firstly, several color features such as normalized difference index were analyzed to get suitable features, which were used to extract wheatear from original image. Secondly, a comparison of the five texture features (energy, contrast, homogeneity, entropy and relation) was performed and the appropriate features were selected to segment wheat images. Finally, the number of ears was calculated. In this step, erosion and dilation operations in binary mathematical morphology were performed so as to clear impurities and awns. Hole filling algorithm and thinning algorithm were used to get unbroken wheatear and its skeleton. Corner detection algorithm was selected to get the corners of skeleton with the purpose of estimating the wheatear number of connected region. The advantages and disadvantages of the color segmentation and texture segmentation were deeply analyzed. Twenty images with 71 92 pixels were used to evaluate the run-time of color segmentation and texture segmentation. The former took 16.97 ms and the latter took 17.76 s. To validate the effectiveness of the designed method, 35 drilling wheat images and 35 broadcasting wheat images were tested, and the average counting accuracy data for drilling wheat and broadcasting wheat were 95.77% and 96.89%, respectively.The experimental results showed that the color feature and the texture feature could be used to extract wheatear from original wheat image, and the color segmentation was faster than texture segmentation but less environmental adaptability. The corners of skeleton had close relationship with the number of wheatears in connected region.
DOI:10.1186/s13007-018-0289-4URL [本文引用: 1]
The number of ears per unit ground area (ear density) is one of the main agronomic yield components in determining grain yield in wheat. A fast evaluation of this attribute may contribute to monitoring the efficiency of crop management practices, to an early prediction of grain yield or as a phenotyping trait in breeding programs. Currently the number of ears is counted manually, which is time consuming. Moreover, there is no single standardized protocol for counting the ears. An automatic ear-counting algorithm is proposed to estimate ear density under field conditions based on zenithal color digital images taken from above the crop in natural light conditions. Field trials were carried out at two sites in Spain during the 2014/2015 crop season on a set of 24 varieties of durum wheat with two growing conditions per site. The algorithm for counting uses three steps: (1) a Laplacian frequency filter chosen to remove low and high frequency elements appearing in an image, (2) a Median filter to reduce high noise still present around the ears and (3) segmentation usingFind Maximato segment local peaks and determine the ear count within the image. The results demonstrate high success rate (higher than 90%) between the algorithm counts and the manual (image-based) ear counts, and precision, with a low standard deviation (around 5%). The relationships between algorithm ear counts and grain yield was also significant and greater than the correlation with manual (field-based) ear counts. In this approach, results demonstrate that automatic ear counting performed on data captured around anthesis correlated better with grain yield than with images captured at later stages when the low performance of ear counting at late grain filling stages was associated with the loss of contrast between canopy and ears. Developing robust, low-cost and efficient field methods to assess wheat ear density, as a major agronomic component of yield, is highly relevant for phenotyping efforts towards increases in grain yield. Although the phenological stage of measurements is important, the robust image analysis algorithm presented here appears to be amenable from aerial or other automated platforms. The online version of this article (10.1186/s13007-018-0289-4) contains supplementary material, which is available to authorized users.
DOI:10.1109/TPAMI.2012.120URLPMID:22641706 [本文引用: 1]
Abstract Computer vision applications have come to rely increasingly on superpixels in recent years, but it is not always clear what constitutes a good superpixel algorithm. In an effort to understand the benefits and drawbacks of existing methods, we empirically compare five state-of-the-art superpixel algorithms for their ability to adhere to image boundaries, speed, memory efficiency, and their impact on segmentation performance. We then introduce a new superpixel algorithm, simple linear iterative clustering (SLIC), which adapts a k-means clustering approach to efficiently generate superpixels. Despite its simplicity, SLIC adheres to boundaries as well as or better than previous methods. At the same time, it is faster and more memory efficient, improves segmentation performance, and is straightforward to extend to supervoxel generation.
URL [本文引用: 1]
为了解决K-均值算法对农业图像中常用的超绿特征2G-R-B图像分割效果不佳的缺点,提出一种基于微粒群与K-均值算法的图像分割方法。先用K-均值算法对图像进行快速分类,然后将分类结果作为其中一个微粒的结果,利用微粒群算法计算,最后用K-均值算法在新的分类基础上计算新的聚类中心,更新当前的位置,以得到最优的图像分割阈值。试验结果表明,改进算法对超绿特征2G-R-B图像能够准确分割目标,且对不同类型的农业超绿图像具有较好的适应性。
URL [本文引用: 1]
为了解决K-均值算法对农业图像中常用的超绿特征2G-R-B图像分割效果不佳的缺点,提出一种基于微粒群与K-均值算法的图像分割方法。先用K-均值算法对图像进行快速分类,然后将分类结果作为其中一个微粒的结果,利用微粒群算法计算,最后用K-均值算法在新的分类基础上计算新的聚类中心,更新当前的位置,以得到最优的图像分割阈值。试验结果表明,改进算法对超绿特征2G-R-B图像能够准确分割目标,且对不同类型的农业超绿图像具有较好的适应性。
DOI:10.1016/S0168-1699(03)00086-3URL [本文引用: 1]
A new method for estimating the number of apple fruits and measuring their diameter in the orchard was developed and tested. A thermal camera captured images of apple trees five times during the vegetation period June eptember 2001. Each time 120 images of twenty apple trees were recorded late in the afternoon to achieve a temperature gradient between fruits and their background. Recorded images were processed using several image processing algorithms. Correlation coefficients R 2 from 0.83 to 0.88 were established between the manually measured fruit number and the estimated number based on a fruit detection algorithm. According to fruit development and the established growing curve, the value of the correlation coefficient, R 2, increased during the ripening period. For measuring the fruit's diameter values of R 2 between 0.68 and 0.70 were established. These slightly increased according to the fruit's colour and size development during the ripening period.
DOI:10.1109/IGARSS.2008.4778858URL [本文引用: 1]
Take-all of wheat took place in major wheat production area of He Nan Province, China. The gaeumannomyces graminis infected area has increased in recent years and become one of primary reasons for wheat output reduction. This research focused on take-all of wheat monitoring by remote sensing. According to the ground spectral measurement and feature of take-all infected samples and healthy sample as well as the corresponding pixels of remote sensing images, two methods for TM multispectral remote sensing data feature extraction of take-all of wheat were proposed in this paper. The monitoring of take-all of wheat can be used in evaluation of infected area, controlling of wheat seed from infected area, and also guidance for infected area soil remedy.
DOI:10.3969/j.issn.1000-386X.2006.03.044URL [本文引用: 1]
对目标图像提取其骨架,在目标检测、图像编码及光学字符识别等计算机视觉、图像处理与模式识别领域有着广泛的应用.简要介绍了调节形态学的基本算子和性质,在此基础上提出了一种二值图像的调节形态学骨架提取算法,最后给出了用调节形态学方法获取二值图像骨架的实例.
DOI:10.3969/j.issn.1000-386X.2006.03.044URL [本文引用: 1]
对目标图像提取其骨架,在目标检测、图像编码及光学字符识别等计算机视觉、图像处理与模式识别领域有着广泛的应用.简要介绍了调节形态学的基本算子和性质,在此基础上提出了一种二值图像的调节形态学骨架提取算法,最后给出了用调节形态学方法获取二值图像骨架的实例.
DOI:10.3969/j.issn.1560-8999.2003.02.021URL [本文引用: 1]
本文从遥感图像上提取空间格局的过程中,对基于数学形态学的主要细化算法进行了归纳总结,结合各算法实现的效果图,将其进行对比分析,找出它们各自的优缺点.最后对其进行了综合改进,针对空间格局图像的复杂多变、非细长的面状特征,提出一种提炼其骨架的细化算法, 并且给出了具体的程序实现方法.
DOI:10.3969/j.issn.1560-8999.2003.02.021URL [本文引用: 1]
本文从遥感图像上提取空间格局的过程中,对基于数学形态学的主要细化算法进行了归纳总结,结合各算法实现的效果图,将其进行对比分析,找出它们各自的优缺点.最后对其进行了综合改进,针对空间格局图像的复杂多变、非细长的面状特征,提出一种提炼其骨架的细化算法, 并且给出了具体的程序实现方法.
DOI:10.11834/jig.20050357URL [本文引用: 1]
Presents a new real time corner detection algorithm. Corners are important information carriers in object recognition. Accurate, stable and fast detecting corners in digital image are common problems facing to corner detectors. Aiming at these problems and different from traditional corner detection algorithms, based on chain code, the algorithm constructs k(k>8) neighborhood chain codes of pixels and uses these chain codes to describe contours. Based on the differential definition of curvature, a curvature function is derived from k neighborhood chain codes. Corners are detected as those contour pixels, whose curvature the is largest in a lobe of contour curvature histogram. Convex and concave corners can be differentiated quickly by checking color attributes of pixels between corner edges. To validate the algorithm, tests comparing the new algorithm to 4 corner detection algorithms are given. The results show the new algorithm is not only accurate and stable, but also simple and fast, which make the algorithm suitable for the embedded computation environment.
DOI:10.1007/s00138-015-0679-9URL [本文引用: 1]
Feature detection and matching is a fundamental problem in many computer vision applications. In the past decades, various types of feature detectors and descriptors have been proposed in the literature. Although several comparative studies on feature detectors and descriptors have been performed in the past, few studies have been carried out concerning recently proposed descriptors such as BRISK, FREAK, etc. Also, previous comparisons were either application oriented or limited in experimentation or in the number of detectors and descriptors compared. This paper provides a comprehensive review of a large number of popular feature detectors developed in the last three decades. The study makes several contributions to the development of a generic comparison of feature detectors and descriptors. First, we conduct comparisons of invariance against image transformations such as illumination changes, blurring, rotation, scaling, viewpoint changes, exposure, JPEG compression, combined scaling and rotation, and combined viewpoint changes. Second, we provide a proper distinction between detectors and descriptors using separate comparisons. Third, a few detectors have been tested on the variation of parameter values. Fourth, we conduct a statistical analysis of invariance against four popular types of transformations: viewpoint changes, blurring, scaling, and rotation. Fifth, we carry out intuitive matching between detectors and descriptors, testing on simulated and practical scenarios. Last, we conduct exhaustive experiments on several datasets for each combination of detectors and descriptors to provide a ranking that can also be weighted to suit specific applications.
DOI:10.1109/CSSE.2008.294URL [本文引用: 1]
This Image partition plays an important role in both qualitative and quantitative analysis of medical ultrasound images. But medical ultrasound images have features of poor contrast and strong speckle noise and segmenting result may not be satisfactory with traditional image segmentation method. Medical ultrasound images are segmented using image segmentation method based on texture feature and graph cut in this paper. The texture feature parameters are obtained according to gray level co-occurrence matrix. The similarities matrix is made based on texture feature parameters and gray intensity of pixel. We use the spectral graph theoretic framework of Normalized cuts to find partitions of an image based on the similarities matrix. Experimental results show that the method is an effective segmentation method for medical ultrasonic image.
DOI:10.1109/TMM.2015.2500727URL [本文引用: 1]
With the sharp increasing of mobile devices, conducting search on mobile devices becomes pervasive, and one of the most popular applications is mobile visual search. To achieve low bit-rate visual search, most of the existing works focus on addressing local descriptor coding and BoW histogram compression . In this paper, we extend the concept of image retargeting and propose a new image resizing approach that is devoted to preserving the robust local features in the query image while resizing it. Based on the extended concept, we introduce a novel mobile-visual-search scheme that conducts the proposed approach to reduce the size of the query image for achieving low bit-rate visual search. Extensive experiments on Oxford 5 K and Flickr 100k datasets show that our approach obtains superior retrieval performance than state-of-the-art image resizing approaches at the similar query size; meanwhile, it is cost effective in terms of processing time.
DOI:10.3390/rs10020246URL [本文引用: 1]
To obtain an accurate count of wheat spikes, which is crucial for estimating yield, this paper proposes a new algorithm that uses computer vision to achieve this goal from an image. First, a home-built semi-autonomous multi-sensor field-based phenotype platform (FPP) is used to obtain orthographic images of wheat plots at the filling stage. The data acquisition system of the FPP provides high-definition RGB images and multispectral images of the corresponding quadrats. Then, the high-definition panchromatic images are obtained by fusion of three channels of RGB. The Gram chmidt fusion algorithm is then used to fuse these multispectral and panchromatic images, thereby improving the color identification degree of the targets. Next, the maximum entropy segmentation method is used to do the coarse-segmentation. The threshold of this method is determined by a firefly algorithm based on chaos theory (FACT), and then a morphological filter is used to de-noise the coarse-segmentation results. Finally, morphological reconstruction theory is applied to segment the adhesive part of the de-noised image and realize the fine-segmentation of the image. The computer-generated counting results for the wheat plots, using independent regional statistical function in Matlab R2017b software, are then compared with field measurements which indicate that the proposed method provides a more accurate count of wheat spikes when compared with other traditional fusion and segmentation methods mentioned in this paper.
DOI:10.1109/TCSVT.2016.2539839URL [本文引用: 1]
As one of the most popular image oversegmentations, superpixel has been commonly used as supporting regions for primitives to reduce computations in various computer vision tasks. In this paper, we propose a novel superpixel segmentation approach based on a distance function that is designed to balance among boundary adherence, intensity homogeneity, and compactness (COM) characteristics of the resulting superpixels. Given an expected number of superpixels, our method begins with initializing the superpixel seed positions to obtain the initial labels of pixels. Then, we optimize the superpixels iteratively based on the defined distance measurement. We update the positions and intensities of superpixel seeds based on the three-sigma rule. The experimental results demonstrate that our algorithm is more effective and accurate than previous superpixel methods and achieves a comparable tradeoff between superpixel COM and adherence to object boundaries.
DOI:10.11834/jig.20150502URL [本文引用: 1]
目的超像素(superpixel)是近年来快速发展的一种图像预处理技术,它将图像快速分割为一定数量的具有语义意义的子区域,相比于传统处理方法中的基本单元——像素,超像素更有利于局部特征的提取与结构信息的表达,并且能够大幅度降低后续处理的计算复杂度,在计算机视觉领域尤其是图像分割中得到了广泛的应用,为使国内外研究者对超像素理论及其在图像分割中的应用有一个比较全面的认识,对其进行系统综述。方法以图像分割为应用背景,在广泛调研文献特别是超像素最新发展成果的基础上,结合对比实验,对每种方法的基本思想、方法特点进行总结,并对超像素分割目前存在的局限性进行说明,对未来可能发展方向进行展望。结果不同的超像素分割算法在分割思想、性能特点上各不相同。当前的超像素方法普遍在超像素数量、紧密度与分割质量、算法实用性之间存在相互制约,同时对于某些特殊目标的分割也难以取得较好的结果。结论超像素作为一种有效的图像预处理手段具有较高的研究价值,但针对目前超像素存在的一些局限性还需要进行深入的研究。
DOI:10.1109/CVPR.2013.477URL [本文引用: 1]
We propose an approach to improve the detection performance of a generic detector when it is applied to a particular video. The performance of offline-trained objects detectors are usually degraded in unconstrained video environments due to variant illuminations, backgrounds and camera viewpoints. Moreover, most object detectors are trained using Haar-like features or gradient features but ignore video specific features like consistent color patterns. In our approach, we apply a Superpixel-based Bag-of-Words (BoW) model to iteratively refine the output of a generic detector. Compared to other related work, our method builds a video-specific detector using superpixels, hence it can handle the problem of appearance variation. Most importantly, using Conditional Random Field (CRF) along with our super pixel-based BoW model, we develop and algorithm to segment the object from the background. Therefore our method generates an output of the exact object regions instead of the bounding boxes generated by most detectors. In general, our method takes detection bounding boxes of a generic detector as input and generates the detection output with higher average precision and precise object regions. The experiments on four recent datasets demonstrate the effectiveness of our approach and significantly improves the state-of-art detector by 5-16% in average precision.
DOI:10.1109/TPAMI.2012.47URLPMID:22331852 [本文引用: 1]
VCells, the proposed Edge-Weighted Centroidal Voronoi Tessellations (EWCVTs)-based algorithm, is used to generate superpixels, i.e., an oversegmentation of an image. For a wide range of images, the new algorithm is capable of generating roughly uniform subregions and nicely preserving local image boundaries. The undersegmentation error is effectively limited in a controllable manner. Moreover, VCells is very efficient with core computational cost at O(K√n(c)·N) in which K, n(c), and N are the number of iterations, superpixels, and pixels, respectively. Extensive qualitative discussions are provided, together with the high-quality segmentation results of VCells on a wide range of complex images. The simplicity and efficiency of our model are demonstrated by complexity analysis, time, and accuracy evaluations.
DOI:10.1186/s13007-017-0254-7URLPMID:5704426 [本文引用: 1]
Rice panicle phenotyping is important in rice breeding, and rice panicle segmentation is the first and key step for image-based panicle phenotyping. Because of the challenge of illumination differentials, panicle shape deformations, rice accession variations, different reproductive stages and the field complex background, rice panicle segmentation in the field is a very large challenge. In this paper, we propose a rice panicle segmentation algorithm called Panicle-SEG, which is based on simple linear iterative clustering superpixel regions generation, convolutional neural network classification and entropy rate superpixel optimization. To build the Panicle-SEG-CNN model and test the segmentation effects, 684 training images and 48 testing images were randomly selected, respectively. Six indicators, including Qseg, Sr, SSIM, Precision, Recall and F-measure, are employed to evaluate the segmentation effects, and the average segmentation results for the 48 testing samples are 0.626, 0.730, 0.891, 0.821, 0.730, and 76.73%, respectively. Compared with other segmentation approaches, including HSeg, i2 hysteresis thresholding and jointSeg, the proposed Panicle-SEG algorithm has better performance on segmentation accuracy. Meanwhile, the executing speed is also improved when combined with multithreading and CUDA parallel acceleration. Moreover, Panicle-SEG was demonstrated to be a robust segmentation algorithm, which can be expanded for different rice accessions, different field environments, different camera angles, different reproductive stages, and indoor rice images. The testing dataset and segmentation software are available online. In conclusion, the results demonstrate that Panicle-SEG is a robust method for panicle segmentation, and it creates a new opportunity for nondestructive yield estimation. The online version of this article (10.1186/s13007-017-0254-7) contains supplementary material, which is available to authorized users.
DOI:10.3969/j.issn.1001-9960.2008.28.285URL [本文引用: 1]
本文介绍了文本分类的起源,常用的几类文本分类方法及基于SVM(Support Vector Machines)文本分类的基本原理和方法。并在分析文本分类的特点的基础上比较了在文本分类中应用SVM的优势及存在的问题。最后总结出了SVM在文本分类中应用的两个主要研究方向。
.
DOI:10.3969/j.issn.1001-9960.2008.28.285URL [本文引用: 1]
本文介绍了文本分类的起源,常用的几类文本分类方法及基于SVM(Support Vector Machines)文本分类的基本原理和方法。并在分析文本分类的特点的基础上比较了在文本分类中应用SVM的优势及存在的问题。最后总结出了SVM在文本分类中应用的两个主要研究方向。
DOI:10.1007/s11517-015-1393-5URLPMID:26403299 [本文引用: 1]
The measurement and analysis of the arterial pulse waveform (APW) are the means for cardiovascular risk assessment. Optical sensors represent an attractive instrumental solution to APW assessment due to their truly non-contact nature that makes the measurement of the skin surface displacement possible, especially at the carotid artery site. In this work, an automatic method to extract and classify the acquired data of APW signals and noise segments was proposed. Two classifiers were implemented: k-nearest neighbours and support vector machine (SVM), and a comparative study was made, considering widely used performance metrics. This work represents a wide study in feature creation for APW. A pool of 37 features was extracted and split in different subsets: amplitude features, time domain statistics, wavelet features, cross-correlation features and frequency domain statistics. The support vector machine recursive feature elimination was implemented for feature selection in order to identify the most relevant feature. The best result (0.952 accuracy) in discrimination between signals and noise was obtained for the SVM classifier with an optimal feature subset .
