辛俐1,胡兴军1,2,高炳钊1,2,刘江1,曹杰汛3
(1. 吉林大学 汽车工程学院,长春130022;2. 汽车仿真与控制国家重点实验室(吉林大学),长春130022; 3. 东风日产乘用车技术中心,广州,510800)
摘要:
驻车通风可加速前风窗玻璃降温和车内除湿,能够有效改善汽车的除霜性能,本文基于CFD方法,采用Realizable k–ε湍流模型,对汽车前风窗降温及车内除湿性能进行了研究. 首先,利用简化模型试验来验证仿真方法的准确性,并证明驻车通风能有效预防车窗内表面结霜;然后对驾驶室模型的驻车通风过程进行仿真,获得了通风参数、降温除湿效果、流场结构之间的关系. 结果表明:各通风参数中,除霜气流流量对前风窗玻璃的降温影响最大;在大流量除霜气流的基础上,全开吹脸风门并使其气流方向向上偏转,有利于促进气流的混合和排出.
关键词: 驻车通风 前风窗降温 驾驶室除湿 除霜 通风参数
DOI:10.11918/j.issn.0367-6234.201803121
分类号:U461.1
文献标识码:A
基金项目:国家自然科学基金(51705190)
Influence of parked car ventilation parameters on defrost performance
XIN Li1,HU Xingjun1,2,GAO Bingzhao1,2,LIU Jiang1,CAO Jiexun3
(1. College of Automotive Engineering(Jilin University), Changchun 130022, China; 2. State Key Laboratory of Automobile Simulation and Control(Jilin University), Changchun 130022, China; 3. Dongfeng Nissan Technical Center, Guangzhou 510800,China)
Abstract:
Parked car ventilation reduces the cooling time of the front windshield, improves the efficiency of the dehumidification in the cabin and effectively improves the defrosting performance of the windshield. Based on the CFD method and the Realizable k–ε turbulence model, this paper studies the cooling of the front windshield and the dehumidification performance in the cabin. First, the simplified model test is used to verify the accuracy of the simulation method and to testify that the parking ventilation can prevent frost from building up on the inside of a window. Second, the parking ventilation process is simulated to obtain the relationship between ventilation parameters, cooling and dehumidification effects, and flow field structures. The results show that the rate of flow of defrosting airflow is the key factor in terms of the cooling effect of the front windshield compared with all the other ventilation parameters. In addition to the high rate of flow of defrosting airflow, deflecting upward the airflow from the dashboard vent which are fully opened benefits the mixing and discharging of airflow.
Key words: parked car ventilation front windshield cooling cabin dehumidification defrosting ventilation parameter
辛俐, 胡兴军, 高炳钊, 刘江, 曹杰汛. 驻车通风对汽车除霜性能的影响[J]. 哈尔滨工业大学学报, 2019, 51(1): 184-190. DOI: 10.11918/j.issn.0367-6234.201803121.

XIN Li, HU Xingjun, GAO Bingzhao, LIU Jiang, CAO Jiexun. Influence of parked car ventilation parameters on defrost performance[J]. Journal of Harbin Institute of Technology, 2019, 51(1): 184-190. DOI: 10.11918/j.issn.0367-6234.201803121.

基金项目 国家自然科学基金(51705190) 作者简介 辛俐(1991—),女,博士研究生;
胡兴军(1976—),男,教授,博士生导师 通信作者 胡兴军, hxj@jlu.edu.cn 文章历史 收稿日期: 2018-03-22
Contents -->Abstract Full text Figures/Tables PDF
驻车通风对汽车除霜性能的影响
辛俐1, 胡兴军1,2

 , 高炳钊1,2, 刘江1, 曹杰汛3
 1. 吉林大学 汽车工程学院,长春 130022;
2. 汽车仿真与控制国家重点实验室(吉林大学),长春 130022;
3. 东风日产乘用车技术中心,广州,510800
收稿日期: 2018-03-22
基金项目: 国家自然科学基金(51705190)
作者简介: 辛俐(1991—),女,博士研究生;
胡兴军(1976—),男,教授,博士生导师
通信作者: 胡兴军, hxj@jlu.edu.cn
摘要: 驻车通风可加速前风窗玻璃降温和车内除湿,能够有效改善汽车的除霜性能,本文基于CFD方法,采用Realizable k-ε湍流模型,对汽车前风窗降温及车内除湿性能进行了研究.首先,利用简化模型试验来验证仿真方法的准确性,并证明驻车通风能有效预防车窗内表面结霜;然后对驾驶室模型的驻车通风过程进行仿真,获得了通风参数、降温除湿效果、流场结构之间的关系.结果表明:各通风参数中,除霜气流流量对前风窗玻璃的降温影响最大;在大流量除霜气流的基础上,全开吹脸风门并使其气流方向向上偏转,有利于促进气流的混合和排出.
关键词: 驻车通风 前风窗降温 驾驶室除湿 除霜 通风参数
Influence of parked car ventilation parameters on defrost performance
XIN Li1, HU Xingjun1,2

 , GAO Bingzhao1,2, LIU Jiang1, CAO Jiexun3
 1. College of Automotive Engineering(Jilin University), Changchun 130022, China;
2. State Key Laboratory of Automobile Simulation and Control(Jilin University), Changchun 130022, China;
3. Dongfeng Nissan Technical Center, Guangzhou 510800, China
Abstract: Parked car ventilation reduces the cooling time of the front windshield, improves the efficiency of the dehumidification in the cabin and effectively improves the defrosting performance of the windshield. Based on the CFD method and the Realizable k-ε turbulence model, this paper studies the cooling of the front windshield and the dehumidification performance in the cabin. First, the simplified model test is used to verify the accuracy of the simulation method and to testify that the parking ventilation can prevent frost from building up on the inside of a window. Second, the parking ventilation process is simulated to obtain the relationship between ventilation parameters, cooling and dehumidification effects, and flow field structures. The results show that the rate of flow of defrosting airflow is the key factor in terms of the cooling effect of the front windshield compared with all the other ventilation parameters. In addition to the high rate of flow of defrosting airflow, deflecting upward the airflow from the dashboard vent which are fully opened benefits the mixing and discharging of airflow.
Keywords: parked car ventilation front windshield cooling cabin dehumidification defrosting ventilation parameter
汽车风窗玻璃结霜直接影响到驾驶员的行车视野,是涉及汽车安全的一项重要指标[1].近几年来,国内外许多学对汽车风窗玻璃除霜性能进行了深入的研究. Waku等人通过CFD软件模拟风窗除霜过程,讨论了除霜气流的流速、湿度和温度等因素对除霜效果的影响[2].张晓兰等建立了汽车除霜性能动态模型,量化挡风玻璃附近的气流速度场,从流场特性的角度对风道结构进行了优化设计[3].邓峰等对汽车内部流场进行模拟,探究了车内气流的速度、温度、湿度、车窗玻璃温度以及空气传热量等参数对汽车前风窗玻璃除霜除雾效率和效果的影响[4].徐晓明等对汽车方舱空调进行了系统的研究,发现了进出风模式对舱内气流的速度和温度分布的影响规律[5]. Kang等人通过比较数值模拟和实车试验,验证CFD技术在汽车除霜上应用的可行性,并对除霜喷嘴进行优化[6].袁侠义等对除霜系统左右风量分配以及气流走势进行了优化[7].胡文举等发现环境的温湿度对除霜系统动态特性具有重要影响[8].谷正气等基于集成方法对除霜除雾风道进行了优化改进,发现在不增加空调送风量的基础上优化后的风道送风分布更加均匀,明显改善汽车除霜性能[9].
上述研究为改进汽车行驶时的除霜性能提供了非常有意义的指导,但未对驻车时预防风窗玻璃结霜的问题进行系统的研究分析.汽车长时间放置在寒冷的室外时,风窗玻璃内外表面容易出现结霜,车窗外表面结霜是由融化的雪花或空气中的水蒸气冻结形成,车窗内表面结霜则是驾驶室内的水蒸气达到过冷条件,在玻璃内表面上凝结产生霜层沉积[10-11].风窗玻璃结霜后,汽车行驶前需要进行除霜操作,费时费力.基于此,本文在既定汽车空调系统的基础上,驾驶员离开汽车时驻车通风,增快前风窗玻璃降温速度并迅速降低车内绝对湿度,减轻前风窗融雪结冰和内表面结霜,并对比分析驻车通风总量、风量匹配和吹脸风向通风参数对降温除湿效果的影响,为驻车通风过程中各通风参数的选择提供参考依据.
1 数值计算方法 1.1 固体壁面使用瞬态方法研究驻车通风时,车窗玻璃和车身材料本身的储热能力对驾驶室内温度变化有较大影响,因此本次计算中对车身材料厚度方向进行网格划分,定义相应的材料物性参数[12],并将多层材料组成的车身壁面等效为各向同性的单层均匀材料.假设某车身壁面由三层不同材料(a, b, c)组成,其厚度δe、导热系数λe、密度ρe和比热容cp, e按以下方法计算:
${\delta _e} = {\delta _a} + {\delta _b} + {\delta _c},$ (1)
${\lambda _e} = \frac{{{\delta _e}}}{{\frac{{{\delta _a}}}{{{\lambda _a}}} + \frac{{{\delta _b}}}{{{\lambda _b}}} + \frac{{{\delta _c}}}{{{\lambda _c}}}}},$ (2)
${\rho _e} = \frac{{{\rho _a}{\delta _a} + {\rho _b}{\delta _b} + {\rho _c}{\delta _c}}}{{{\delta _e}}},$ (3)
${c_{p,e}} = \frac{{{c_{p,a}}{\rho _a}{\delta _a} + {c_{p,b}}{\rho _b}{\delta _b} + {c_{p,c}}{\rho _c}{\delta _c}}}{{{\rho _e}{\delta _e}}}.$ (4)
式中,δa、δb和δc分别为材料的厚度;λa、λb和λc分别为材料的导热系数;ρa、ρb和ρc分别为材料的密度;cp, a、cp, b和cp, c分别为材料的比热容.
1.2 空气物性冬季驻车通风时,空气温度的变化范围较大,应考虑空气密度随温差变化对数值计算的影响[13],因此,本研究在驻车通风过程中将各物性参数设置为温度函数.根据冬季试验空气温度的变化范围,取-20~30 ℃空气密度,将空气密度和空气温度线性拟合,得下式所示的近似函数:
$\rho = 2.5446 - 0.00457T.$ (5)
其中:ρ为空气密度; T为空气温度,单位为K.
利用萨瑟兰(Sutherland)公式,得空气动力粘度、导热系数与温度的关系公式如下:
$\mu = {\mu _r}{\left( {\frac{T}{{{T_r}}}} \right)^{3/2}}\frac{{{T_r} + {S_\mu }}}{{T + {S_\mu }}},$ (6)
$\lambda = {\lambda _r}{\left( {\frac{T}{{{T_r}}}} \right)^{3/2}}\frac{{{T_r} + {S_\lambda }}}{{T + {S_\lambda }}}.$ (7)
式中:Tr为参考温度,Tr=273.15 K;μr为动力粘度,μr=1.716×10⁻⁵Pa·s;Sμ为动力粘度的萨瑟兰常数,Sμ=111 K;λr为导热系数,λr=2.414×10⁻² W·m-1·K-1;Sλ为导热系数的萨瑟兰常数,Sλ=194 K.
1.3 湿度计算在计算空气湿度时,采用Buck经验公式[14]表示不同温度下的饱和水蒸气压es.
${e_s} = 611.21\exp \left( {\frac{{17.502\left( {T - 273.15} \right)}}{{T - 32.18}}} \right).$ (8)
水蒸气压e与绝对湿度ρvapor间的关系可通过下式获得:
${\rho _{{\rm{vapor}},s}} = \frac{{{e_s}}}{{{R_{{\rm{vapor}}}}T}},$ (9)
${R_{{\rm{vapor}}}} = \frac{R}{{{M_{{H_2}O}}}}.$ (10)
式中: Rvapor为水蒸气的气体常数;R为理想气体常数;MH2O为水的摩尔质量.
为了直观地分析驾驶室内湿度场,进行试验数据与仿真结果的对比,需要将计算所得的绝对湿度ρvapor与相对湿度进行换算,相对湿度RH的计算公式如下式:
$RH = \frac{{{\rho _{{\rm{vapor}}}}}}{{{\rho _{{\rm{vapor}},s}}}} \times 100\% = \frac{e}{{{e_s}}} \times 100\% .$ (11)
1.4 湍流模型采用Realizable k-ε湍流模型来计算驾驶室内的通风气流速度和温度分布.相比于SST k-ω模型和RNG k-ε模型,Realizable k-ε模型对通风口射流产生气流的速度和温度梯度的模拟更加准确[15].其控制方程可表示如下:
$\begin{array}{l}\frac{\partial }{{\partial t}}\left( {\rho k} \right) + \frac{{\partial \left( {\rho k{u_i}} \right)}}{{\partial {x_i}}} = \frac{\partial }{{\partial {x_j}}}\left[ {\left( {\mu + \frac{{{u_t}}}{{{\sigma _k}}}} \right)\frac{{\partial k}}{{\partial {x_j}}}} \right] + \\\;\;\;{G_k} + {G_b} - \rho \varepsilon - {Y_M},\end{array}$ (12)
$\begin{array}{l}\frac{{\partial \left( {\rho \varepsilon } \right)}}{{\partial t}} + \frac{{\partial \left( {\rho \varepsilon {u_i}} \right)}}{{\partial {x_i}}} = \frac{\partial }{{\partial {x_j}}}\left[ {\left( {\mu + \frac{{{u_t}}}{{{\sigma _\varepsilon }}}} \right)\frac{{\partial \varepsilon }}{{\partial {x_j}}}} \right] + \\\rho {C_1}E\varepsilon - \rho {C_2}\frac{{{\varepsilon ^2}}}{{k + \sqrt {v\varepsilon } }} + {C_{1\varepsilon }}\frac{\varepsilon }{k}{C_{3\varepsilon }}{G_b} + S\varepsilon .\end{array}$ (13)
式中:
2 简化模型试验与仿真 2.1 简化模型利用简化模型验证仿真计算方法的有效性,如图 1所示,该模型除倾斜玻璃壁面外,其他壁面均采用XPS和PEF材料.图中空气温湿度测点为A至F,玻璃内表面温湿度测点为G1至G6.试验地点为背光侧,太阳散射强度为24~32 W/m2.试验时长为1 800 s,模型附近环境风速时均值为1 m/s,通风口风速约1.3 m/s,环境温度和入口气流温度均约-9 ℃,绝对湿度约为1.295 4 g/m3.
Figure 1
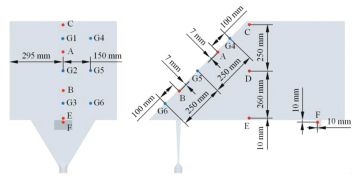 图 1 试验模型及测点位置 Figure 1 Test model and measuring point position
 2.2 简化模型试验与仿真结果分析图 2为试验5 min时两模型对比,相比通风模型,不通风模型玻璃表面出现起雾结霜现象,因此驻车通风除湿能有效预防车窗内表面结霜.
Figure 2
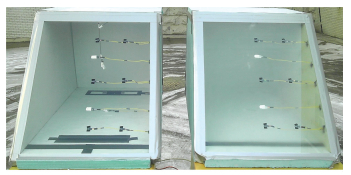 图 2 通风预防内结霜对比试验 Figure 2 Ventilation prevention internal frost contrast test
 A至F点仿真模拟与试验测量温湿度曲线如图 3所示,可见两曲线较为吻合,最大温度差为3.5 ℃,最大绝对湿度差为1.1 g/m3,误差产生原因主要是仿真与试验模型内温湿度场的初始分布不同.随着仿真进行,模型内温湿度均值逐渐接近试验值,仿真与试验结果趋于一致.前风窗玻璃前期降温主要依靠外表面对外散热,受内部温度场影响较小,所以仿真和试验误差较小,如图 4所示.从计算结果可以看出文中所提到的计算方法可以用来预测驻车通风时车内温湿度的变化.
Figure 3
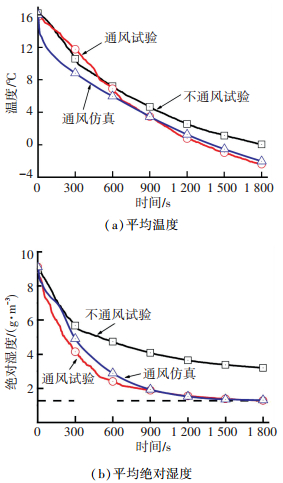 图 3 A至F点试验与仿真平均温湿度对比 Figure 3 Comparison of average temperature and humidity between test and simulation of A and F point
 Figure 4
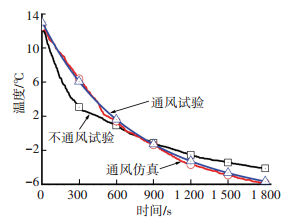 图 4 G1至G6点试验与仿真测点平均温度对比 Figure 4 Comparison of average temperature between test and simulation of G1 and G6 point
 3 仿真模型的建立 3.1 驾驶室模型进行驻车通风具体仿真分析时,采用某驾驶室内表面的1:1几何模型.为了减少网格数量,节省计算时间,对车内结构进行简化,并根据固体壁面参数将驾驶室划分为11个区域,如图 5所示.计算入口是各空调出风口,计算出口为驾驶室排气口.
Figure 5
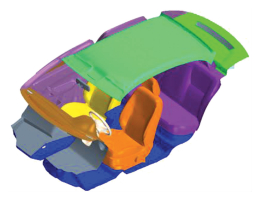 图 5 驾驶室几何模型 Figure 5 Cabin geometry model
 3.2 网格划分进行计算模型网格划分时,车身壁面和气流出入口均为三角形面网格.为捕捉边界层内的流动和提高计算精度,将边界层划分为三棱柱网格.对空气域采用非结构四面体网格离散,并向空气域外侧拉伸面网格,生成与车身固体壁面厚度相等的体网格,共生成410万体网格,如图 6所示.
Figure 6
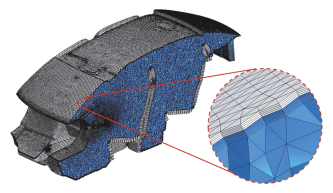 图 6 乘员舱及车身固体壁面网格划分 Figure 6 Grid configuration of passenger compartment and car body solid wall
 3.3 边界条件和初始条件设置仿真过程中,前风窗、侧窗、后风窗以及地板、顶盖、左右侧围和车门等外表面对流换热系数设为10 W·m-2·K-1,其他固体壁面设置为绝热壁面.其他边界条件及初始化条件设置如表 1所示.
表 1
计算域入口条件 速度入口
绝对湿度:1.295 4 g/m3
温度:-9 ℃
计算域出口条件 压力出口
温度:-9 ℃
初始条件 初始温度:16 ℃
初始绝对湿度:9.112 g/m3
表 1 边界条件及初始条件设置 Table 1 Boundary conditions and initial conditions
3.4 通风参数假设研究不同通风参数降温除湿效果时,各风门的开闭和吹脸出风口风向可独立工作,空调出风口布置形式如图 7所示,包括除霜出风口a、吹脸出风口b和吹脚出风口c.
Figure 7
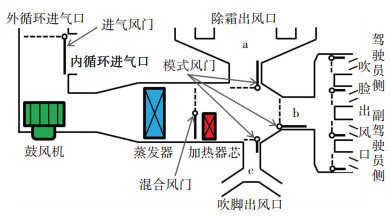 图 7 空调结构示意图 Figure 7 Air conditioning structure
 4 计算结果及分析采用除湿率ηv量化除湿效果,驻车通风效果越好,ηv越接近100%.
${\eta _v} = \frac{{{\rho _{{\rm{vapor,0}}}} - {\rho _{{\rm{vapor}}}}}}{{{\rho _{{\rm{vapor,0}}}} - {\rho _{{\rm{vapor}},e}}}} \times 100\% .$ (14)
式中: ρvapor为模型内平均绝对湿度;ρvapor, 0初始时刻模型内平均绝对湿度;ρvapor, e为外环境和入口气流绝对湿度.
具体分析中以通风总风量、通风风量匹配和吹脸风向等通风参数为研究对象,前风窗玻璃平均温度达到0 ℃的时间tg和除湿率超过99%的时间tv作为玻璃降温和除湿效果的衡量指标.
4.1 总风量分析比较驻车通风总风量对驾驶室降温除湿效果和内流场特性的影响时,风门全开且各吹脸出风口风向角水平并平行于汽车纵向对称面.从图 8中可发现玻璃平均温度随时间几乎成线性变化,随着总风量增加,玻璃平均温度降至0 ℃的时间tg明显缩短,总风量450 m3/h时tg仅为418 s.
Figure 8
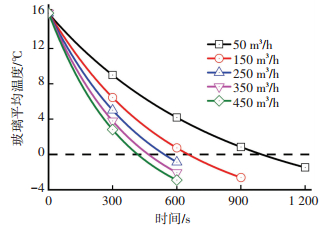 图 8 不同总风量玻璃平均温度 Figure 8 Front windshield average temperature with different total air volumes
 图 9为通风5 min后,总通风量为50 m3/h和450 m3/h时前风窗玻璃内外表面温度云图.当通风气流流量低时,除霜气流速度较低难以直接吹至前风窗内表面,前风窗玻璃外表面与环境产生对流换热导致外表面温度较低,风窗玻璃内表面比外表面高出近1 ℃,如图 9(a)所示.当通风气流流量增大时,车窗玻璃中间形成低温扇形区,如图 9(b)所示,这说明高流量的除霜气流对前风窗玻璃降温有明显的促进作用.
Figure 9
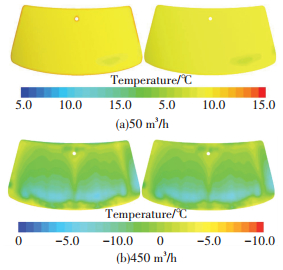 图 9 不同总风量前风窗玻璃内外表面温度云图 Figure 9 Temperature contour of front windshield surface with different total air volumes
 图 10为不同通风总量时除湿率随时间的变化.由图 10可知,当除湿率小于85%时,各通风总量下湿度下降速度较快,而当除湿率超过85%后湿度下降的速度迅速减小,除湿时间增长.比较发现,总风量较小时,增加总风量能显著加快除湿,但总风量超过250 m3/h,除湿率曲线几乎重合,即继续增加通风量对除湿效果影响较小.
Figure 10
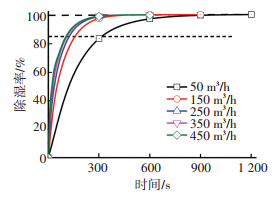 图 10 不同总风量除湿率 Figure 10 Dehumidification rate with different total air volumes
 4.2 风量分配分析比较驻车通风风量分配对驾驶室除湿和风窗降温效果的影响时,总风量Q0取250 m3/h,各吹脸出风口风向水平且平行于汽车纵向对称面,各风门示意图如图 7所示.
从表 2可以看出不同模式风门的开度直接影响降温除湿效果,方案8和方案2分别为前风窗降温和车内除湿最佳方案,而方案5的tg和tv最接近,为整体最优方案.比较tg可以发现,前风窗降温主要受除霜出风口的影响,除霜气流随着其他出风口风门的关闭而增大,前风窗玻璃降温速度增快.保持除霜出风口风门全开,比较tv可以发现吹脸出风口风门的开度是影响驾驶内除湿的主要影响因素.方案3、5和8的tv依次增大,其中吹脸出风口关闭比全开的tv增加了90%.在全开除霜口风门和吹脸出风门的基础上,半开吹脚出风口风门,tv时间最短,仅为297 s.
表 2
1 1 1 1 544 303
2 1 1 1/2 539 297
3 1 1 0 536 326
4 1 1/2 1 488 338
5 1 1/2 0 467 417
6 1 0 1 442 551
7 1 0 1/2 430 553
8 1 0 0 417 603
表 2 不同风门开度及tg和tv Table 2 Different air door opening and tg and tv
方案1中所有风门全开,tg为544 s,前风窗玻璃表面的流速较低,如图 11所示.方案8中关闭吹脚和吹脸出风口风门,此时除霜气流最大,tg仅为417 s,如图 12所示.增大除霜气流,会直接增大除霜气流冲击到玻璃内侧表面的流速,在玻璃内表里面形成高速气流扇形区,从而增快对流换热速度,前风窗降温时间tg减小.
Figure 11
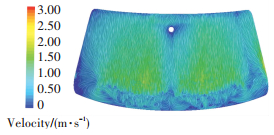 图 11 方案1前风窗玻璃内侧10mm处速度云图 Figure 11 Case 1: Velocity contour at 10 mm from the windshield
 Figure 12
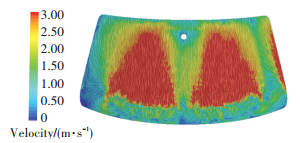 图 12 方案8前风窗玻璃内侧10 mm处速度云图 Figure 12 Case 8: Velocity contour at 10 mm from the windshield
 图 13为仅开除霜口风门通风180 s时的绝对湿度分布图.从图 13中可以看出低湿气流主要沿前风窗及顶部流动,湿度场呈上低下高的分布,前风窗及车顶前部区域绝对湿度处于较低水平.而全开吹脸模式风门后,驾驶室内中部区域的流动增强,整体湿度下降.并且吹脸气流在座椅靠背处流动受阻,从形成较大的旋涡,从而该处绝对湿度较低,如图 14方案3所示.
Figure 13
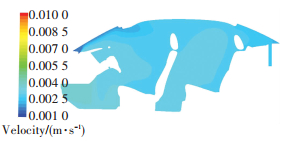 图 13 方案8 180 s时驾驶员座椅纵向对称面绝对湿度云图 Figure 13 Case 8: Absolute humidity contour on longitudinal symmetry plane after 180 s
 Figure 14
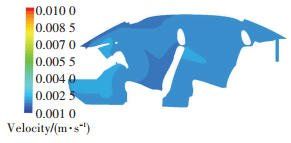 图 14 方案3 180 s时驾驶员座椅纵向对称面绝对湿度云图 Figure 14 Case 3: Absolute humidity contour longitudinal symmetry plane after 180 s
 4.3 吹脸出风口风向分析比较驻车通风吹脸出风口风向对驾驶室风窗降温和除湿效果的影响时,采用最佳通风总量及风量匹配方案5的设置, 即总风量Q0取250 m3/h,除霜出风口风门全开,吹脸出风口风门半开,关闭吹脚出风口风门.
4.3.1 吹脸纵向风向角分析研究吹脸纵向风向角对驾驶室降温效果的影响时,各吹脸出风口的横向风向角η取0°.纵向风向角ζ、tg和tv如表 3所示.从表 3中可以看出,吹脸出风口纵向风向角对前风窗降温影响较小,对除湿率影响较大.由于通风总量和出风口风量分配一定,各方案除霜气流的速度和流动结构相似,所以前风窗玻璃降温时间tg变化较小,在463~474 s之间波动.但对比分析不同纵向风向角除湿效果时,吹脸气流斜向上偏转除湿时间tv较短,斜向下偏转则会延长除湿时间tv.方案11中所有纵向风向角均向上偏转30°,获得最好的除湿效果,tv比方案5缩短39 s,比除湿时间最长的方案14减少106 s.
表 3
9 0 30 30 0 470 391
10 30 0 0 30 465 406
11 30 30 30 30 464 377
12 0 -15 -15 0 472 455
13 -15 0 0 -15 470 434
14 -15 -15 -15 -15 474 483
15 -15 30 30 -15 472 430
16 30 -15 -15 30 472 445
表 3 不同吹脸纵向风向角及tg和tv Table 3 Different blowing face longitudinal wind angles and tg and tv
图 15为吹脸纵向风向角为0°和吹脸纵向风向角向上偏转30°的速度流线图.由图 15可知,相比于方案5,方案11驾驶室前排和后排区域存在大量的气流流动,且流速较高,能快速地吹除车内湿空气,降低车内绝对湿度.
Figure 15
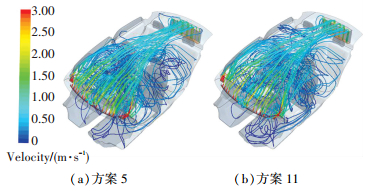 图 15 不同吹脸纵向风向角速度流线图 Figure 15 Velocity streamline with different blowing face longitudinal wind angles
 4.3.2 吹脸横向风向角分析研究吹脸横向风向角对驾驶室降温效果的影响时,各吹脸出风口的纵向风向角ζ取0°,横向风向角η、tg和tv见表 4.从表 4可以看出,风口横向风向角对前风窗玻璃降温影响较小,对除湿率有一定影响,但不及纵向风向角明显.中央吹脸气流向两侧偏转时,直接吹向后部的气流减小,流动规则性变差,如方案17所示,tv增加50 s,明显地降低了除湿速率.
表 4
17 0 -30 30 0 471 467
18 30 0 0 -30 465 422
19 0 -30 0 -30 463 448
20 30 0 30 0 468 448
21 30 -30 30 -30 465 450
表 4 不同吹脸横向风向角及tg和tv Table 4 Different blowing face horizontal wind angles and tg and tv
5 结论1) 通过简化模型实验,证明驻车通风能有效地预防车窗玻璃内表面结霜,并且试验验证了仿真计算的正确性,为后续研究奠定基础.
2) 研究5种驻车通风总风量对驾驶室降温除湿效果和内流场特性的影响,发现增大通风总风量能明显加快前风窗玻璃降温,但当气流流量超过250 m3/h后,增加总风量对除湿时间影响较小.
3) 对8种风量匹配进行比较分析,为使驾驶室内快速降温除湿,应全开除霜风口风门,半开吹脸出风口风门.其中除霜出风口气流流量是影响前风窗玻璃降温的主因素.
4) 对吹脸出风口风向角研究发现,吹脸风向对前风窗玻璃降温影响较小,吹脸纵向风向角对车内除湿影响较大,横向风向角影响较小.分析车内除湿tv,可见吹脸出风口气流斜向上30°有利于加快车内除湿,而气流方向斜向下则会加大除湿时间.
参考文献
[1] 张炳力, 胡忠文, 薛铁龙. 基于程序集成及响应面模型的车辆除霜性能优化[J]. 汽车工程, 2015, 37(5): 605.
ZHANG Bingli, HU Zhongwen, XUE Tielong. Optimization of vehicle defrosting performance based on program integration and response surface model[J]. Automotive Engineering, 2015, 37(5): 605.
[2] WAKU T, WATANABE N, MATSUMOTO J, et al. An efficient numerical approach for evaluating the windshield defogging time[J]. SAE Technical Paper, 2004.
[3] 张晓兰, 施俊业, 陈江平. 汽车挡风玻璃除霜性能数值模拟[J]. 汽车工程, 2007, 29(11): 1009.
ZHANG Xiaolan, SHI Junye, CHEN Jiangping. Numerical simulation on defrost performance of automotive windshield[J]. Automotive Engineering, 2007, 29(11): 1009. DOI:10.3321/j.issn:1000-680x.2007.11.019
[4] 邓峰, 谷正气, 杨易, 等. 汽车前风窗玻璃除霜除雾数值模拟分析和研究[J]. 汽车工程, 2009, 31(2): 175.
DENG Feng, GU Zhengqi, YANG Yi, et al. Numerical simulation analysis on defrosting and defogging of automotive windshield[J]. Automotive Engineering, 2009, 31(2): 175. DOI:10.3321/j.issn:1000-680X.2009.02.017
[5] 徐晓明, 赵又群. 汽车方舱空调系统的仿真分析[J]. 哈尔滨工业大学学报, 2012, 44(3): 92.
XU Xiaoming, ZHAO Youqun. Simulation analysis of car shelter air-conditioning[J]. Journal of Harbin Institute of Technology, 2012, 44(3): 92.
[6] KANG S J, KADER M F, JUN Y D, et al. Automobile defrosting system analysis through a full-scale model[J]. International Journal of Automotive Technology, 2011, 12(1): 39. DOI:10.1007/s12239-011-0005-0
[7] 袁侠义, 戴澍凯, 姜叶洁, 等. 汽车除霜性能CFD分析与试验验证[J]. 客车技术与研究, 2015(5): 52.
YUAN Xiayi, DAI Shukai, JIANG Yejie, et al. CFD analysis and test verification on automotive defrosting performance[J]. Bus & Coach Technology and Research, 2015(5): 52. DOI:10.3969/j.issn.1006-3331.2015.05.017
[8] 胡文举, 姜益强, 姚杨, 等. 温湿度对空气源热泵相变蓄能除霜系统特性影响[J]. 哈尔滨工业大学学报, 2012, 44(6): 65.
HU Wenju, JIANG Yiqiang, YAO Yang, et al. Effect of air temperature and humidity on system defrosting characteristics of a PCM based air source heat pump[J]. Journal of Harbin Institute of Technology, 2012, 44(6): 65.
[9] 谷正气, 文琪, 汤柱良, 等. 基于集成方法的汽车除霜除雾风道改进[J]. 中南大学学报(自然科学版), 2017, 48(10): 2649.
GU Zhengqi, WEN Qi, TANG Zhuliang, et al. Improvement of auto defrosting and demisting air duct based on integrated method[J]. Journal of Central South University(Science and Technology), 2017, 48(10): 2649. DOI:10.11817/j.issn.1672-7207.2017.10.013
[10] TSUNEMOTO H, ISHITANI H, KAKUBARI Y. Study of melting phenomenon of frost and ice on the windshield[J]. JSAE Review, 1994, 15(1): 53. DOI:10.1016/0389-4304(94)90007-8
[11] NORIN F, MYHR K, KULLMAN L, et al. Prevention of frost formation on automobile glazing[J]. SAE Technical Paper, 1987.
[12] HAN T, CHEN K H. Assessment of various environmental thermal loads on passenger compartment soak and cool-down analyses[J]. SAE Technical Paper, 2009.
[13] 宋姗姗, 郭雪岩. Boussinesq近似与封闭腔体内自然对流的数值模拟[J]. 力学季刊, 2012, 33(1): 60.
SONG Shanshan, GUO Xueyan. Boussinesq approximation and numerical simulation of natural convection in a closed square cavity[J]. Chinese Quarterly of Mechanics, 2012, 33(1): 60. DOI:10.3969/j.issn.0254-0053.2012.01.009
[14] BUCK A L. New equations for computing vapor pressure and enhancement factor[J]. Journal of Applied Meteorology, 1981, 20(12): 1527. 2.0.CO;2" target="_blank" title="点击浏览原文">DOI:10.1175/1520-0450(1981)020<1527:NEFCVP>2.0.CO;2
[15] KUZNIK F, RUSAOU?N G, BRAU J. Experimental and numerical study of a full scale ventilated enclosure: comparison of four two equations closure turbulence models[J]. Building and Environment, 2007, 42(3): 1043. DOI:10.1016/j.buildenv.2005.11.024
