Haixing Liu, Jing Lu, Ming Zhao, Yixing Yuan
(School of Municipal and Environmental Engineering, Harbin Institute of Technology, Harbin 150090, China)
Abstract:
In order to compare two advanced multi-objective evolutionary algorithms, a multi-objective water distribution problem is formulated in this paper. The multi-objective optimization has received more attention in the water distribution system design. On the one hand the cost of water distribution system including capital, operational, and maintenance cost is mostly concerned issue by the utilities all the time; on the other hand improving the performance of water distribution systems is of equivalent importance, which is often conflicting with the previous goal. Many performance metrics of water networks are developed in recent years, including total or maximum pressure deficit, resilience, inequity, probabilistic robustness, and risk measure. In this paper, a new resilience metric based on the energy analysis of water distribution systems is proposed. Two optimization objectives are comprised of capital cost and the new resilience index. A heuristic algorithm, speed-constrained multi-objective particle swarm optimization (SMPSO) extended on the basis of the multi-objective particle swarm algorithm, is introduced to compare with another state-of-the-art heuristic algorithm, NSGA-II. The solutions are evaluated by two metrics, namely spread and hypervolume. To illustrate the capability of SMPSO to efficiently identify good designs, two benchmark problems (two-loop network and Hanoi network) are employed. From several aspects the results demonstrate that SMPSO is a competitive and potential tool to tackle with the optimization problem of complex systems.
Key words: water distribution system design optimization multi-objective particle swarm optimization
DOI:10.11916/j.issn.1005-9113.2016.03.002
Clc Number:TU991.33
Fund:
Haixing Liu, Jing Lu, Ming Zhao, Yixing Yuan. Multi-objective Optimisation Design of Water Distribution Systems: Comparison of Two Evolutionary Algorithms[J]. Journal of Harbin Institute of Technology, 2016, 23(3): 30-38. DOI: 10.11916/j.issn.1005-9113.2016.03.002.

Fund Project of Application Technology Research and Development Plan in Heilongjiang Province(Grant No. GA13C302) Corresponding author E-mail: zhming1188@126.com. Article history Received: 2015-05-14
Contents Abstract Full text Figures/Tables PDF
Multi-objective Optimisation Design of Water Distribution Systems: Comparison of Two Evolutionary Algorithms
Haixing Liu, Jing Lu, Ming Zhao

 , Yixing Yuan
 School of Municipal and Environmental Engineering, Harbin Institute of Technology, Harbin 150090, China
Received: 2015-05-14
Fund: Project of Application Technology Research and Development Plan in Heilongjiang Province(Grant No. GA13C302)
Corresponding author: E-mail: zhming1188@126.com.
Abstract: In order to compare two advanced multi-objective evolutionary algorithms, a multi-objective water distribution problem is formulated in this paper. The multi-objective optimization has received more attention in the water distribution system design. On the one hand the cost of water distribution system including capital, operational, and maintenance cost is mostly concerned issue by the utilities all the time; on the other hand improving the performance of water distribution systems is of equivalent importance, which is often conflicting with the previous goal. Many performance metrics of water networks are developed in recent years, including total or maximum pressure deficit, resilience, inequity, probabilistic robustness, and risk measure. In this paper, a new resilience metric based on the energy analysis of water distribution systems is proposed. Two optimization objectives are comprised of capital cost and the new resilience index. A heuristic algorithm, speed-constrained multi-objective particle swarm optimization (SMPSO) extended on the basis of the multi-objective particle swarm algorithm, is introduced to compare with another state-of-the-art heuristic algorithm, NSGA-Ⅱ. The solutions are evaluated by two metrics, namely spread and hypervolume. To illustrate the capability of SMPSO to efficiently identify good designs, two benchmark problems (two-loop network and Hanoi network) are employed. From several aspects the results demonstrate that SMPSO is a competitive and potential tool to tackle with the optimization problem of complex systems.
Key words: water distribution system design optimization multi-objective particle swarm optimization
1 Introduction Water distribution systems (WDS) are large and complex systems involving interconnected spatial structures and dynamic instantaneous changes. However, high dimensionality, nonlinearity, discrete and multi-constraints nature of WDS optimisation problems seriously limits the capability to search for the optimal solution in the often large solution space. Evolutionary algorithms (EAs) have proved to be a flexible and powerful tool in the search for good solutions to WDS optimisation problems. EAs were firstly employed to solve WDS design and rehabilitation problems in which only a single objective was optimized[1-3]. Then EAs play an important role in solving WDS design problem during the following two decades. Keedwell and Khu[4] proposed a hybrid genetic algorithm (GA) using a heuristic based local representative cellular automata approach to provide a good initial population to the genetic algorithm runs. Kapelan et al.[5] utilised an improved GA which was capable of identifying robust optimal solutions with reduced computational effort to tackle the uncertainty in nodal demands and pipe roughness. Nicklow et al.[6] introduced a comprehensive review of state-of-the-art GA methods and their applications to the field of water resources planning and management.
Other meta-heuristic based optimization methods used in the design of WDS include simulated annealing[7]; tabu search[8]; ant colony optimization[9]; and metamodels[10]. Shuffled frog leaping algorithm (SFLA) was used by Eusuff and Lansey[11] to determine optimal discrete pipe sizes for a new WDS and network expansions, which was based on evolution of memes carried by interactive individuals and a global exchange of information among the population.
The evolution mechanism of population of particle swarm optimization (PSO) is similar in concept to SFLA. Suribabu and Neelakantan[12] used the basic theory of PSO to solve the single objective problem of WDS design. Geem[13] proposed a modified harmony search algorithm incorporating particle swarm concept applied to the design of four benchmark networks with good results. Babu et al.[14] presented a hybrid model in order to explore the optimal combination of pipe diameters by effectively utilizing local and global search capabilities of PSO and GA respectively with minimal computational burden. Particle swarm algorithm demonstrates the powerful potential of search compared with other optimization algorithms[15-16], however it has not received sufficient attentions in WDS design. In this paper, a novel improved PSO algorithm is introduced to solve the WDS design problems. It achieves competitive results compared NSGA-Ⅱ[17] by the performance metrics.
In WDS design problems theeconomic goal is always pursued by the water company in order to produce the biggest benefit in the limit of capital resources. Furthermore, researchers abstract many valuable optimization objectives, for instance, system performance index, water quality, and sustainability aiming at achieving a certain level of service for utilities, keeping security of the WDS, and confronting the global climate change. WDS performance measure, including total pressure deficit, maximum pressure deficit, minimum surplus pressure, resilience[18-20], probabilistic robustness[5], risk[21], and inequity[22], forms trade-off with the objective of cost. A new resilience index based on the analysis of system energy is proposed in this paper. Two objectives are chosen: 1) to minimize the total WDS design cost and 2) to maximize the resilience of WDS. Decision variables are the alternative design options for each pipe in the network. The optimization algorithm is tested in two cases, both of which are based on the benchmarks of two loop network[23] and Hanoi network [24].
The outline of this paper is structured as follows. Firstly the literature of resilience is reviewed and the new resilience is formulated in Section 2. The next section includes a brief description of two algorithms and two performance metrics of solutions considered in this study. In Sections 4 and 5 the results are analyzed based on the two benchmark networks. Finally, the important conclusions are drawn in Section 6.
2 Literature Review and a New Resilience Index 2.1 Reliability and Resilience Reliability assessment of WDS can be classified into two main categories: topological, andhydraulic[25]. Topological reliability refers to the probability that a given network is physically connected, given its components' mechanical reliabilities (i.e., the components' probabilities to remain operational over a specified time interval under specified environmental conditions). Hydraulic reliability is the probability that a WDS can supply its consumers' demand over a specified time interval under specified environmental conditions. As such, hydraulic reliability refers directly to the basic function of a WDS: conveyance of desired water quantities at desired pressures to desired appropriate locations at desired appropriate times[25].
Todini[18] defined resilience as the ratio of surplus internal power in the network to the maximum power that could be dissipated internally, while still satisfying the constraints on nodal demand and nodal heads. It was also stated that providing higher surplus heads and power at the nodes may help the network perform under abnormal conditions with respect to the additional energy that is available for dissipation in such cases.
Although resilience is a different concept from reliability, they are correlated as the increase in resilience will improve the reliability of a network. The reliability concept is wider, not only representing the probability of WDS mechanical elements working contecutively, but also illustrating the probability of continuously severing the consumers with sufficient pressure, quantity, and even water quality at demand nodes. Resilience is similar to the hydraulic reliability. Resilience indicates the surplus capability of water supply to the consumers. The surplus capability is characterized by energy (power), and a new resilience index is proposed in Section 2.3. Several resilience formulations from the literature are reviewed as follows.
2.2 Resilience Index One of the most widely used surrogate measures is the resilience index (IR) introduced by Todini[18]. This index which has recently been used by other researchers[26-27] is described in Eq.(1):
$${I_{\rm{R}}} = {{\sum {_{i = 1}^{{n_{{\rm{node}}}}}{q_i}({h_{{\rm{ava, }}i}} - {h_{{\rm{req, }}i}})} } \over {\left( {\sum {_{j = 1}^{{n_{{\rm{reservoir}}}}}{Q_j}{H_j} + \sum {_{k = 1}^{{n_{{\rm{pump}}}}}{{{P_k}} \over \gamma }} } } \right) - \sum {_{i = 1}^{{n_{{\rm{node}}}}}{q_i}{h_{{\rm{req, }}i}}} }}$$ (1)
where IR is the resilience index; qi is the demand at node i; hava, i and hreq, i represent head of node j and head required at node j respectively; nnode is the number of demand nodes; nreservoir is the number of reservoirs; npump is the number of pumps; Qj, Hj are the flow and the head of reservoir j respectively; Pk is the power introduced by pump k into the system, and γis the specific weight of water.
Todini's resilience index examines the entire network (junctions) as a whole entity, with values ranging between 0 and 1 (0 representing no resilience and 1 representing perfect resilience). If there are some individual junctions that do not satisfy the required head minimum, the calculated value of resilience index is likely to still be between 0 and 1. It is likely that the resilience index value is equal to 0 in some special scenario where the junction heads are in the minimum head required nearby. To rectify the above shortcomings satisfying the constraints on nodal heads were implemented in most applications. Todini's resilience index does not infer to the WDS physical structure, so it is no meaningful to compare to different topological networks.
Prasad and Park[19] modified Todini's resilience index called network resilience (RN) which incorporates the effects of both surplus power and reliable loops. Reliable loops can be ensured if the pipes connected to a node do not vary greatly in diameter. If D1j, D2j, …, Dnpj(where D1j≥D2j≥…≥Dnpj) are the diameters of the pipes connected to node j, then uniformity of that node is given by Eq.(2):
$${c_j} = {{\sum {_{i = 1}^{{n_{\rm{p}}}}D{i_j}} } \over {{n_{{\rm{pmax}}}}\left( {D{i_j}} \right)}}$$ (2)
where np is the number of pipes connected to node j. The network resilience index is followed as
$${R_{\rm{N}}} = {{\sum {_{i = 1}^{{n_{{\rm{node}}}}}{c_i}{q_i}\left( {{h_{{\rm{ava}}, i}} - {h_{req, i}}} \right)} } \over {\left( {\sum {_{i = 1}^{{n_{{\rm{reservoir}}}}}{Q_j}{H_j} + \sum {_{k = 1}^{{n_{{\rm{pump}}}}}{{{P_k}} \over \gamma }} } } \right) - \sum {_{i = 1}^{{n_{{\rm{node}}}}}{q_i}{h_{req, i}}} }}$$ (3)
Jayaram and Srinivasan[20] proposed the modified resilience index (IMR), which theoretically overcomes the drawback of Todini's resilience index when evaluating networks with multiple sources. In contrast to Todini's resilience index, the value of the modified resilience index is directly proportional to the total surplus power at the demand nodes. In fact the IMR simplified the Todini's IR, however, IMR boundary value greater than 1 does not demonstrate the specific physical significance compared to Todini's IR and Prasad's IMR values up to a maximum of 1. IMR describes the additional power ratio at demand nodes which can provide the sufficient energy dissipated in the network in case of enhanced demands or unexpected deterioration of the network, as shown in Eq.(4).
$${I_{{\rm{MR}}}} = {{\sum {_{j = 1}^{{n_{{\rm{node}}}}}{q_i}\left( {{h_{{\rm{ava}}, i}} - {h_{req, i}}} \right)} } \over {\sum {_{j = 1}^{{n_{{\rm{node}}}}}{q_i}{h_{req, i}}} }}$$ (4)
Recently, Banos et al.[28] using two different metrics (average minimum over-demand and average percentage of unfeasible scenarios) compared the three resilience index mentioned above. When the demands of nodes are randomly increased, the non-dominated solutions (cost-resilience tradeoffs) are analyzed in terms of their capability to maintain the required pressures at nodes. The results show different resilience indexes are suitable for different design scenario. These resilience indexes are all from the point of view of energy (or power) to address a quantity indicator for systems performance. Tanks are common elements to comprise WDS, which store water quantity as well as energy. In this paper, a new resilience index is proposed based on the analysis of system energy conservation including the tank energy in the WDS as well.
2.3 New Resilience Index The total power (energy per unit time) which is the sum of power input into the system is equal to the available part plus unavailable part (Punava) dissipated in the WDS due to the resistance of components and water loss.
$${P_{{\rm{total}}}} = {P_{{\rm{ava}}}} + {P_{{\rm{unava}}}}$$ (5)
In this paper the resilience index is defined as the ratio of the available power (Pava) to the total power (Ptotal), which is termed as new resilience index.
$${I_{{\rm{RN}}}} = {{{P_{{\rm{ava}}}}} \over {{P_{{\rm{total}}}}}}$$ (6)
The input power includes the power at the entrance to the water distribution network as well as the power introduced into the network by pumps (Ppump).
$${P_{{\rm{total}}}} = \gamma \sum {_{j = 1}^{{n_{{\rm{reservoirs}}}}}{Q_j}{H_j}} + \sum {_{l = 1}^{{n_{_{pump}}}}{P_k}} $$ (7)
The available power includes the power delivered to theuser in terms of flow (qi) and head (hava, i) at each demand node and the power of tank aggregated.
$${P_{{\rm{ava}}}} = \gamma \sum {_{j = 1}^{{n_{{\rm{node}}}}}{q_i}{h_{{\rm{ava}}, i}}} + \gamma \sum {_{l = 1}^{{n_{{\rm{tank}}}}}{Q_l}{H_l}} $$ (8)
where Ql is the tank flow in or out of the network, and Hl is the elevation of the water surface of the tank.
So the new resilience index can be written as:
$${I_{{\rm{RN}}}} = {{\sum {_{j = 1}^{{n_{{\rm{node}}}}}{q_i}{h_{{\rm{ava}}, i}}} + \sum {_{l = 1}^{{n_{{\rm{tank}}}}}{Q_l}{H_l}} } \over {\sum {_{j = 1}^{{n_{{\rm{reservoirs}}}}}{Q_j}{H_j}} + \sum {_{k = 1}^{{n_{_{{\rm{pump}}}}}}{{{P_k}} \over \gamma }} }}$$ (9)
In this formulation the tank flow is above 0 when the water comes into the tank, and vice versa.The new resilience index has the complete new physical meaning. The formula is more straightforward than other indices due to the reduction of the pressure head parameter. It explicitly introduces the tank power into the formulation because the tank can store energy in water distribution systems. The larger new resilience is, the higher the ratio of the available power is, and thus the water distribution systems can resist more external disturbance and sustain the normal operating conditions.
3 Optimization Methodology In this section a novel heuristic algorithm, called speed-constrained multi-objective particle swarm optimization (SMPSO), is introduced which was developed by Nebro et al.[16]. Meanwhile a brief description of state-of-the-art NSGA-Ⅱ[17] is also included, and the results produced by NSGA-Ⅱ are considered to compare with SMPSO's in the next section.
3.1 NSGA-Ⅱ The nondominated sorting genetic algorithm Ⅱ (NSGA-Ⅱ) is proposed by Deb et al.[17], and has often been used for comparison purpose by other researchers[29-31], as well as improved by Kollat and Reed. Deb extended dominance constraint-handling strategy based on a nondominated sorting procedure and developed the elitist policy in the multi-objective evolutionary algorithm. Constrained multi-objective evolutionary algorithm is very suitable for the WDS optimization issues which involve high dimensionality, non-linearity and multi-constrained conditions.
3.2 SMPSO PSO algorithm, a population-based search algorithm, is a bio-inspired heuristic mimicking the social behaviour of bird flocking or fish schooling[32]. Its individuals, called particles and of which the population consist as swarm, move under a certain velocity vector through hyperdimensional search space. Changes to the position of the particles within the search space are based on the social-psychological tendency of individuals to emulate the success of other individuals. The position of each particle is changed according to its own experience and that of its neighbours to achieve ideal positions which form the optimal solutions.
Nebro et al.[16] proposed that the velocity of the particle trends to become quite high so-called swarm explosion in multi-objectives PSO (MOPSO). The particles with high speed can reach the boundary easily in the narrow variable space. SMPSO employs velocity constriction method to produce new effective particle positions in those cases in which the velocity becomes too high. Other features of SMPSO include the use of polynomial mutation as a turbulence factor and crowded distance for uniformity in the fixed-size solution set.
SMPSO has several features in common with NSGA-Ⅱ. In Pareto dominance theory, keeping the solutions density uniformity by crowding distance, tackling with constraint conditions, and ensuring the diversity of solution by mutation operator. There are some different aspects between them. Firstly, the mechanisms of producing the offspring generation are different. In addition, the elite strategies are extinguishing. NSGA-Ⅱ keeps the good solutions based on nondominated sorting procedure in which a mixing pool of parent and offspring generation is made to sort by nondomination rules and crowding distance. By contrast, SMPSO has an external leader archive to store the nondominated solutions found during the search.
3.3 Performance Metrics There are two distinct evaluation goals in multi-objective optimization: to identify solutions convergence in terms of the Pareto-optimal solutions, and to check the diversity of solutions in the obtained non-dominated front.In this paper the spread indicator[17] and the hypervolume indicator[33] are employed to evaluate performance of the two heuristic algorithms mentioned above. The spread indicator measures the relation of distance between a tested solution set and a reference set involving the extreme solutions. A lower value demonstrates a better diversity of non-dominated solutions. Hypervolume using a unary value can evaluate both goals in a combined sense. Larger values of this indicator are desirable as this indicates a closer approximation to the reference set. A normalized value of hypervolume against the reference set is calculated here, thus the desired value is 1.
4 Case Study In this study two modified benchmarks of WDS, two loop network[23] and Hanoi network[24], are adopted to test the algorithms and analysis the new objective. The two cases appeared in lots of WDS optimization literature[3, 18-19, 24]. The optimization algorithms are combined with EPANET2 hydraulic engine[34] to balance the hydraulic conditions and determine the heads at all nodes.
4.1 Brief Description of Two Loop Network Two loop network(TLN) is derived from Ref.[23]. This simple network is always used to explain WDS problems shown in Fig. 1. The node information is shown in Table 1. The modified TLN is comprised of two loops including 6 junctions and 9 pipes. All of pipes are 1 000 m in length and 130 in Hazen-Williams coefficient. The reservoir and the tank are linked to nodes 2 and 7 respectively. The initial water level and elevation of tank are 10 m and 200 m, respectively.
Figure 1
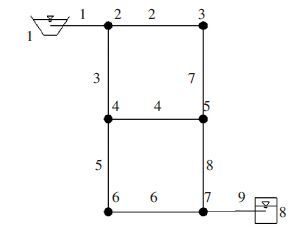 Figure 1 Modified two loop network
 表 1
1210Reservoir
2150100
3160100
4155120
5150270
6165330
7160200
8210 (Initial head)Tank
Table 1 Head and demand for TLN
4.2 Brief Description of Hanoi Network The second example is based on the schematic of Hanoi network as shown in Fig. 2. The system is subject to a one demand loading condition, and it consists of 35 links (including the pipe 35 linked to the tank) and 32 demand nodes fed by a single reservoir at a constant head of 100 m and an additional tank with the head of 60 m. The minimum pressure head requirement at all nodes is 30 m. All nodes are at zero elevation. The six optional commercial pipe diameters 305, 406, 508, 610, 760, 1 016 mm with a Hazen-Williams coefficient of 130 are considered for each of the links. On the basis of original Hanoi a tank with initial water head 60 m is linked to the network through the pipe 35. More detailed instructions and the input file of EPANET2 is available from CWS (2004). The decision variables are only considered all pipes in the scope of candidate diameters. One of the objectives is construction cost C($) formulated as:
Figure 2
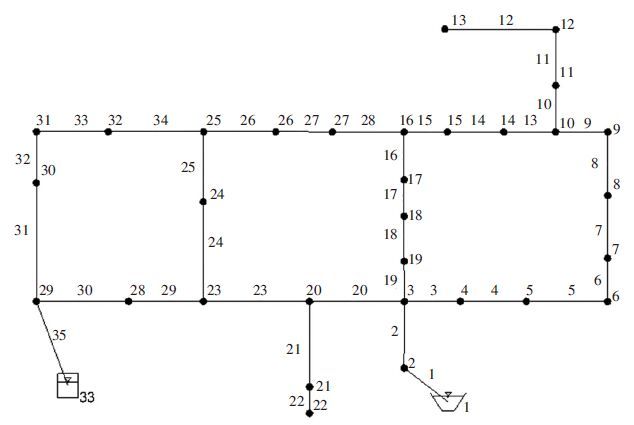 Figure 2 Modified Hanoi network
 $$C = \sum\limits_{i = 1}^{{n_{\rm{p}}}} {f\left( {{D_i}, {L_i}} \right)} $$ (10)
where Di is the pipe diameter (mm); np is the total number of pipes, and Li is the pipe length (m).
5 Results and Discussions The two algorithms performed in modified TLN and modified Hanoi network with the set of operators and associated parameters are shown in Table 2. The settings of parameter have been chosen to guarantee a fair comparison between the algorithms. The population size of NSGA-Ⅱ is equal to 100. SMPSO using 100 particles comprises of an optimized swarm, as well as an external archive which keeps the leader particle is size of 100. Simulated binary crossover (SBX) and polynomial mutation in NSGA-Ⅱ have been used as the crossover and mutation operators, respectively. The distribution indexes for both operators are ηc=20 and ηm=20, respectively. The crossover probability is pc=0.9 in NSGA-Ⅱ and the mutation probability is pm=1/N in both algorithms, where N is the number of decision variables.
To restrict the influence of random effects, the experiments are repeated fifty times per test problem, always using a randomly generated initial population. To compare quality of the fronts the solution sets of 250th generation have been chosen.
Optimization runs performed on a PC with a 2.6 GHz Intel Core 6700 processor, 4.0 GB of RAM and the MS Windows XP Pro operating system. The time unit is second. STDEV is short for the value of standard deviation. All the values are produced in the 50 runs using the parameters of Table 3.
表 2
NSGA-Ⅱ100250Binary tournamentSBX p=0.9Polymonial p=1/NN/A
SMPSO100250N/AN/APolymonial p=1/N100
N is the number of variables.
Table 2 Parameters of algorithms
表 3
TLNNSGA-Ⅱ56.3459.9853.152.219 1
SMPSO50.2653.6048.481.143 3
HanoiNSGA-Ⅱ66.5269.2564.760.873 1
SMPSO63.6971.2662.211.313 8
Table 3 Algorithms computational times
In the experiments of computational times it is noted that every run should be in the almost same environment with respect to available capacity of RAM and CPU. There are two ways to balance this problem: 1) adjust the available capacity before every single run, and 2) alternatively perform 100 consecutive runs switching between NSGA-Ⅱ and SMPSO in turn. The four values of computational times, including average, maximum, minimum, and standard deviation, are shown in Table 3. The performance of SMPSO is better in both cases in the comparison of average computational time. Thus, SMPSO can save some computation resources. The minimums of computational time are 48.48 s and 62.21 s respectively, both obtained from SMPSO. In fact, the procedure of SMPSO is simpler than NSGA-Ⅱ, because solutions will be given ranks during the computation of NSGA-Ⅱ, nevertheless the SMPSO only has an archive implementing the elite strategy.
The Pareto optimal fronts are obtained from 50 runs using each algorithm. Thus, the non-dominated solutions (quasi-true Pareto front) are picked up from 50 fronts of each problem using the methodology of non-dominated sorting. The metrics of spread and hypervolume, ranging from 0 to 1, are relative values to the Pareto front. Two aspects on the quality of approximated fronts are discussed as follows:
1) The distribution of approximated fronts: in two cases, SMPSO has advantages for spread in Figs. 3 and 4. NSGA-Ⅱ cannot reach some areas, especially the high cost region in the best spread front. Likewise, the same situation is shown in Table 4. The average, maximum, and minimum of SMPSO's spreads are much lower (better) than NSGA's. SMPSO is more stable on the spread metric, based on the standard deviation value as shown in Table 4.
Figure 3
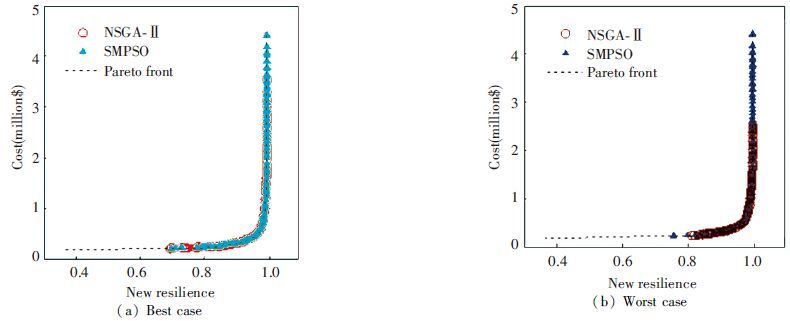 Figure 3 Pareto fronts evaluated by the spread metric for TLN
 Figure 4
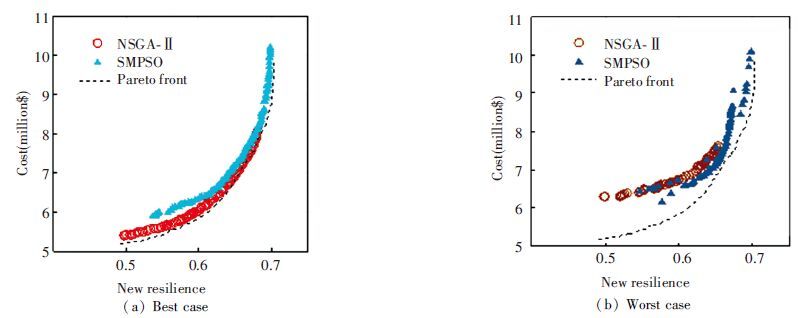 Figure 4 Pareto fronts evaluated by the spread metric for Hanoi network
 表 4
TLNNSGA-Ⅱ0.790 622 6380.854 247 4450.708 641 0940.036 042 492
SMPSO0.605 754 3460.669 878 1490.559 046 3830.025 400 569
HanoiNSGA-Ⅱ0.708 033 2330.998 818 9750.548 114 7920.088 151 7 13
SMPSO0.629 907 3080.882 922 4250.460 590 4790.101 676 974
Note that STDEV is short for standard deviation.
Table 4 Spread for the 250th generation
2) The convergence speed of approximated fronts. The hypervolume is one of few metrics which can assess the quality of convergence as well as diversity. Nevertheless, it can be used along with the spread metric to obtain a better evaluation. The hypervolume results are shown in Figs. 5 and 6. In both cases, the averages of hypervolume of NSGA-Ⅱ are a bit larger (better) than the value of SMPSO in Table 5, although the distributions of solutions computed by SMPSO are superior. Apparently it is proved that the convergence speed of NSGA-Ⅱ compared with the SMPSO solution set is faster in the same generation. However, the performance of SMPSO still shows superior stability compared with NSGA-Ⅱ on the metric of hypervolume.
Figure 5
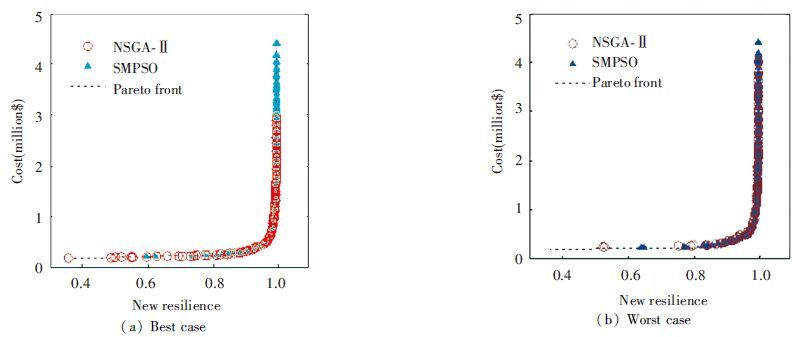 Figure 5 Pareto fronts evaluated by hypervolume for TLN
 Figure 6
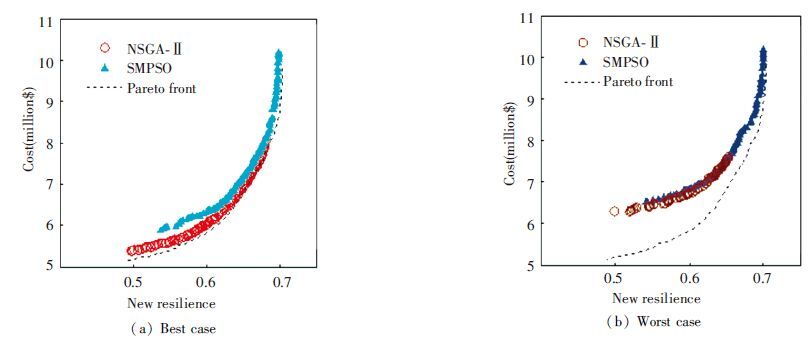 Figure 6 Pareto fronts evaluated by hypervolume for Hanoi network
 表 5
TLNNSGA-Ⅱ0.976 372 7390.978 710 9120.970 802 6010.001 478 206
SMPSO0.976 067 2740.977 309 510.974 293 0570.000 731 669
HanoiNSGA-Ⅱ0.654 281 390.712 545 880.514 679 890.043 653 799
SMPSO0.631 296 0930.688 435 2730.560 863 1820.033 195 916
Note that STDEV is short for standard deviation.
Table 5 Hypervolume for the 250th generation
The two algorithms are 50 times run for each benchmark network using the parameters in Table 1, but the number of generations is 1 000. The average of hypervolume in each generation is calculated and shown in Fig. 7 for TLN problem.
Figure 7
 Figure 7 Hypervolume of 1 000 generations for TLN
 Fig. 8 for Hanoi problem. The initial population for every run is fixed in order to reduce the effect of randomness. For the modified Hanoi network the hypervolume metric is better in each generation. It is only illustrated the degree of convergence of NSGA-Ⅱ is better in the same generation, but not the speed of convergence because the time of producing a generation is faster in SMPSO in Table 1.
Figure 8
 Figure 8 Hypervolume of 1 000 generations for Hanoi
 6 Conclusions 1) A novel index used for assessing water distribution systems' performance is developed in this paper. The pros and cons of two state of the art evolutionary algorithms (a classic NSGA-Ⅱ and a relatively new SMPSO) are derived from the optimization process of water distribution system design in two benchmark network.
2) The new resilience index can obtain a significant tradeoff with the objective of network construction cost by the optimisation process. The new resilience index implies the system energy conversation and the concept of available power in WDSs. All parts of energy of WDS are considered, in particular including tank power which is new finding compared to other resilience index. In WDSs, the power delivered by tanks plays a key role in providing energy to the whole system.
3) The SMPSO and NSGA-Ⅱ are efficient and effective heuristic algorithms in optimizing WDS problems. Two evaluation metrics of algorithm are used to compare convergence and diversity of evolutionary algorithms. SMPSO having more simple computational complexity will spend shorter time in every generation. SMPSO has better diversity with respect to Pareto fronts. Nevertheless, NSGA-Ⅱ has better convergence compared with SMPSO in the same generation. By analysing the standard deviation value, it is investigated that the quality of SMPSO solutions is much more stable than NSGA-Ⅱ. It illustrates that different algorithms are suitable for a certain range of optimization problems. The engineer can depend on the different requirements to choose the optimization algorithm. In the future work, a hybrid self-adaptive heuristic algorithm is expected to be developed for searching solutions in complex water distribution problems.
References
[1] Simpson A R, Dandy G C, Murphy L J. Genetic algorithms compared to other techniques for pipe optimization. Journal of Water Resources Planning and Management, 1994, 120(4): 423-443. (
 0)
0)[2] Dandy G C, Simpson A R, Murphy L J. An improved genetic algorithm for pipe network optimization. Water Resources Research, 1996, 32(2): 449-458. (
 0)
0)[3] Savic D A, Walters G A. Genetic algorithms for least-cost design of water distribution networks. Journal of Water Resources Planning and Management, 1997, 123(2): 67-77. (
 0)
0)[4] Khu S T, Keedwell E. Introducing more choices (flexibility) in the upgrading of water distribution networks: the New York city tunnel network example. Engineering Optimization, 2005, 37(3): 291-305. (
 0)
0)[5] Kapelan Z S, Savic D A, Walters G A. Multiobjective design of water distribution systems under uncertainty. Water Resources Research, 2005, 41(11). (
 0)
0)[6] Nicklow J, Reed P, Savic D, et al. State of the art for genetic algorithms and beyond in water resources planning and management. Journal of Water Resources Planning and Management, 2010, 136(4): 412-432. (
 0)
0)[7] Cunha M D C. Water distribution network design optimization: simulated annealing approach. Journal of Water Resources Planning and Management, 2014, 125(4): 215-221. (
 0)
0)[8] Cunha M D C, Ribeiro L. Tabu search algorithms for water network optimization. European Journal of Operational Research, 2004, 157(3): 746-758. (
 0)
0)[9] Maier H R, Simpson A R, Zecchin A C, et al. Ant colony optimization for design of water distribution systems. Journal of Water Resources Planning and Management, 2003, 129(3): 200-209. (
 0)
0)[10] Broad D, Dandy G, Maier H. Water distribution system optimization using metamodels. Journal of Water Resources Planning and Management, 2005, 131(3): 172-180. (
 0)
0)[11] Eusuff M M, Lansey K E. Optimization of water distribution network design using the Shuffled Frog Leaping algorithm. American Society of Civil Engineers, 2014, 129(3): 210-225. (
 0)
0)[12] Suribabu C, Neelakantan T. Design of water distribution networks using particle swarm optimization. Urban Water Journal, 2007, 3(2): 111-120. (
 0)
0)[13] Geem Z W. Particle-swarm harmony search for water network design. Engineering Optimization, 2009, 41(4): 297-311. (
 0)
0)[14] Babu K S J, Vijayalakshmi D P. Self-adaptive PSO-GA hybrid model for combinatorial water distribution network design. Journal of Pipeline Systems Engineering and Practice, 2014, 4(1): 57-67. (
 0)
0)[15] Sierra M R, Coello C A C. Improving PSO-based multi-objective optimization using crowding, mutation and ∈-dominance. In Emo, 2005. 505-519. (
 0)
0)[16] Nebro A J, Durillo J, Garcia-Nieto J, et al. Smpso: a new pso-based metaheuristic for multi-objective optimization. Computational intelligence in miulti-criteria decision-making, 2009. MCDM′09. IEEE Symposium on Nashville. TN: IEEE, 2009. 66-73. (
 0)
0)[17] Deb K, Pratap A, Agarwal S, et al. A fast and elitist multiobjective genetic algorithm: NSGA-Ⅱ. Evolutionary Computation, IEEE Transactions on, 2002, 6(2): 182-197. (
 0)
0)[18] Todini E. Looped water distribution networks design using a resilience index based heuristic approach. Urban Water, 2000, 2(2): 115-122. (
 0)
0)[19] Prasad T, Park N. Multiobjective genetic algorithms for design of water distribution networks. Journal of Water Resources Planning and Management, 2004, 130(1): 73-82. (
 0)
0)[20] Jayaram N, Srinivasan K. Performance-based optimal design and rehabilitation of water distribution networks using life cycle costing. Water Resources Research, 2008, 44(1). (
 0)
0)[21] Kapelan Z, Savic D, Walters G, et al. Risk-and robustness-based solutions to a multi-objective water distribution system rehabilitation problem under uncertainty. Water Science and Technology, 2006, 53(1): 61-75. (
 0)
0)[22] Chandapillai J, Sudheer K, Saseendran S. Design of water distribution network for equitable supply. Water Resources Management, 2012, 26(2): 391-406. (
 0)
0)[23] Alperovits E, Shamir U. Design of optimal water distribution systems. Water Resources Research, 1977, 13(6): 885-900. (
 0)
0)[24] Fujiwara O, Khang D B. A two-phase decomposition method for optimal design of looped water distribution networks. Water Resources Research, 1990, 26(4): 539-549. (
 0)
0)[25] Ostfeld A. Reliability analysis of regional water distribution systems. Urban Water, 2001, 3(4): 253-260. (
 0)
0)[26] Farmani R, Walters G, Savic D. Trade-off between total cost and reliability for anytown water distribution network. Journal of Water Resources Planning and Management, 2005, 131(3): 161-171. (
 0)
0)[27] Vasan A, Simonovic S P. Optimization of water distribution network design using differential evolution. Journal of Water Resources Planning and Management, 2010, 136(2): 279-287. (
 0)
0)[28] Baos R, Reca J, Martínez J, et al. Resilience indexes for water distribution network design: a performance analysis under demand uncertainty. Water Resources Management, 2011, 25(10): 2351-2366. (
 0)
0)[29] Reyes-Sierra M, Coello C A C. Multi-objective particle swarm optimizers: a survey of the state-of-the-art. International Journal of Computational Intelligence Research, 2006, 2(3): 287-308. (
 0)
0)[30] Zhang Q, Li H. MOEA/D: a multiobjective evolutionary algorithm based on decomposition. Evolutionary Computation, IEEE Transactions on, 2007, 11(6): 712-731. (
 0)
0)[31] Tang Y, Reed P M, Kollat J B. Parallelization strategies for rapid and robust evolutionary multiobjective optimization in water resources applications. Advances in Water Resources, 2007, 30(3): 335-353. (
 0)
0)[32] Sahely H R, Kennedy C A, Adams B J. Developing sustainability criteria for urban infrastructure systems. Canadian Journal of Civil Engineering, 2005, 32(1): 72-85. (
 0)
0)[33] Zitzler E, Thiele L. Multiobjective evolutionary algorithms: a comparative case study and the strength Pareto approach. Evolutionary Computation, IEEE Transactions on, 1999, 3(4): 257-271. (
 0)
0)[34] Rossman L A. EPANET 2: Users Manual. US: EPA, 2000. (
 0)
0)