

兰州大学 生物化学与分子生物学研究所,甘肃 兰州 730000
收稿日期:2019-05-16;接收日期:2019-08-08;网络出版时间:2019-09-09
基金项目:甘肃省科技计划项目(No. 18JR3RA275),兰州市城关区科技计划项目(No. 2018SHFZ0048)资助
摘要:胃癌是全球第四大最常见的癌症,也是全球癌症中引起死亡的第二大原因。为了降低胃癌的死亡率,目前亟需解决的问题是发现新的早期胃癌特异性的标志物,提高早期胃癌的检出率,从而从根本上解决胃癌死亡率高的问题。实验室前期研究发现过氧化物酶4 (Peroxiredoxin 4,PRDX4)具有早期胃癌标志物的潜能,文中通过建立恶性转化模型及转化细胞过表达等方法,研究PRDX4在转化细胞中的作用。结果显示PRDX4通过减少转化细胞中活性氧(Reactive oxygen species,ROS)含量,使细胞处在利于生长增殖的微环境中,从而促进细胞发生恶性转化,即PRDX4通过清除ROS促进胃癌的发生发展。
新早期胃癌标志物PRDX4通过清除ROS促进胃癌的发生发展
Ruhan Jia, Daling Shi, Wenhui Li, Jing Yang, Yanmin Zhang, Yuewu Han


Institute of Biochemistry and Molecular Biology, Lanzhou University, Lanzhou 730000, Gansu, China
Received: May 16, 2019; Accepted: August 8, 2019; Published: September 9, 2019
Supported by: Science-Technology Support Plan Projects of Gansu Province (No. 18JR3RA275), Science-Technology Support Plan Projects of Lanzhou Chengguan District (No. 2018SHFZ0048)
Corresponding author: Yuewu Han. Tel: +86-931-8164585; E-mail: hanyuewu730000@163.com.
Abstract: Gastric cancer is the fourth most common cancer in the world and the second leading cause of death in cancer worldwide. In order to reduce the mortality rate of gastric cancer, the problem that needs to be solved at present is to find new specific markers of early gastric cancer and increase the detection rate of early gastric cancer, thus fundamentally solving the problem of high mortality of gastric cancer. Previous studies in our laboratory found that Peroxiredoxin 4 (PRDX4) has the potential for early gastric cancer markers. In this study, the role of PRDX4 in transformed cells was studied by establishing a malignant transformation model and transforming cell overexpression, the experiment proves that PRDX4 is responsible for growth and proliferation by reducing the content of reactive oxygen species (ROS) in transformed cells. In the microenvironment, it promotes the malignant transformation of cells, that is, PRDX4 promotes the development of gastric cancer via eliminating ROS.
Keywords: 过氧化物酶4早期胃癌活性氧生物标志物
Gastric cancer (GC) is a major world health problem due to its high morbidity and mortality. GC is the 4th most common cancer and the 2nd leading cause of cancer-related deaths[1-3]. In addition to Japan and South Korea, the five-year survival rate of advanced GC in other countries and regions of the world is even less than 10%[4]. However, if GC is diagnosed in early stage instead of advanced stage, the five-year survival rate would rise up to 95%[5], which means the fundamental way to treat GC is to diagnose it in early stage. As early gastric cancer is asymptomatic or asymptomatic, the optimal treatment period is delayed[6]. At present, nevertheless, some serum biomarkers are employed in screening for early stage GC, such as CA19-9 and CEA. However, the sensitivity and specificity of these tumor markers are still low[2, 7]. Therefore, it is urgent that to discover a novel efficient biomarker for early gastric cancer.
In our previous work, we successfully selected a potential biomarker, Peroxiredoxin-4(PRDX4), for early gastric cancer by Cell-SELEX procedures[8-11]. PRDX4 is an antioxidant protein which localized in the endoplasmic reticulum[12]. It is not only responsible for maintaining steady state levels of reactive oxygen species (ROS), but also for reactivation of oxidized phosphatases[13-17]. PRDX4 is special in the PRDX family, because it’s more likely to appear in extracellular fluids due to the cleavable signal peptide it has. Therefore, PRDX4 has the chance that appear in the cell membrane, and also could be tested in serum[18-21].
Besides, we studied the expression level of PRDX4 in early gastric cancer tissue through clinical experiment, and the result showed that the PRDX4 expression level is significantly different from advanced GC tissue and early GC tissue. These data indicated PRDX4 plays an important role in tumorigenesis and progression of gastric cancer, suggesting that it may be a potential biomarker for early GC. In order to investigate the role of PRDX4 in tumorigenesis and progression of gastric cancer, we established a PRDX4 overexpressed GC transformed cell line model and validated its biological significance in GC by regulating ROS concentration.
1 Materials and methods1.1 Cell line and cell cultureThe human gastric mucosal epithelial cell line (GES-1) was cultured in Dulbecco’s Modified Eagle Medium (DMEM; Solarbio, Beijing, China), supplemented with 10% fetal bovine serum (FBS; Zhejiang Tianhang Biotechnology Co., Ltd., China). All media contained 100 U/mL penicillin and 100 μg/mL streptomycin. All cell lines were maintained at 37 ℃ in 5% CO2.
1.2 Induced cell transformationN-methyl-N-vitro-N-nitrosoguanidine (MNNG) is a chemical mutagen and carcinogen, in this experiment, it was used to induce cell transformation. Cells were seeded in a 25 cm2 plate at density of 5×10⁵ in 4 mL media and cultured for overnight. At 50%–60% confluency, 16 μL MNNG (2×10⁻² mol/L) were added into 4 mL media to reach the final concentration 8×10⁻⁵ mol/L. Continued to culture for 4 h, 8 h, 12 h, 16 h, 20 h and 24 h, removed the media and changed into fresh clean media and cultured for a further 24 h.
1.3 MTT cell proliferation assayCells were seeded in 96-well plate at density of 2×10³/well in 200 μL media and cultured for 24 h to reach 50%–60% confluency. The cells were transfected with PRDX4 plasmid or blank plasmid and cultured for a further 24–96 h. 20 μL MTT (Thiazolyl Blue, Solarbio, Beijing, China) were added into each well and then incubated for 4 h. After that, discarded the media in and added 150 μL DMSO into each well gently. The absorbance of the wells determined using a plate reader at a test wavelength of 490 nm.
1.4 Wound healing assayCells were seeded in a 6-well plate at density of 5×10⁵/well in 2 mL media and cultured for overnight. At 50%–60% confluency, the cells were transfected with PRDX4 plasmid or blank plasmid and cultured for a further 36 h. Upon reaching 90% confluency, a scratch was created with a 10 μL-pipette tip and wells were washed with PBS to remove loosen cells. Then the cells were incubated in fresh media and cell scratches were photographed 24 h later.
1.5 Soft agar colony formation assayCells (2×10³) were resuspended in 4 mL of 0.7% agarose in DMEM containing 10% FBS, and overlaid with 1.2% agarose in 60 mm culture dishes. The dishes were incubated routinely for 10 d, then photographed and counted.
1.6 Reverse transcription-polymerase chain reactionTotal RNA was extracted from cell line using RNAiso Plus (TaKaRa, Japan). The prepared RNA (5 ng) was mixed with oligo-dT primers and random hexamer primers, incubated in 65 ℃ for 5 min and then in 0 ℃ for 5 min. After that, mixed with reaction buffer, Ribo LockTMRNA enzyme inhibitor, Rever AidTMM-MwLV reverse transcriptase and 10 mmol/L dNTP Mix (Thermo, USA) for 5 min at 25 ℃, 60 min at 42 ℃, 5 min at 70 ℃. Followed by PCR amplification with specific primers for PRDX4 (forward: 5′-AAGCAAAGCGAAGATTTCCAAG-3′; reverse: 5′-CAAGTGGGTAGAAGAAGAAAACC AA-3′). PCR amplification was performed in 20 μL with the following program: pre-denaturation for 3 min at 95 ℃, annealing for 1 min at 55 ℃, extension for 30 s at 72 ℃, and a final elongation at 72 ℃ for 7 min. GAPDH served as an internal positive control (forward: 5′-TTAGCCAGACAGG CACCAAA-3′; reverse: 5′-GCTCCTTTACCCACG CTTTCT-3′). PCR was performed for 35 cycles. PCR products were detected by electrophoresis on a 1% agarose gel for later analyses.
1.7 Western blottingWhole-cell proteins were prepared from the protein lysates (Solarbio, Beijing, China). The concentration of protein lysates was tested by BCA protein quantification kit (Sangon, Shanghai, China). Briefly, 100 μg of total protein was loaded and separated on sodium dodecyl sulfate-polyacrylamide gels, then transferred to polyvinylidine difluoride (PVDF). The expression of PRDX4 was determined using primary antibody (1:1 000 dilution; Abcam, United Kingdom) followed by HRP-goat anti-mouse IgG (1:2 000 dilution). The blots were detected using the enhanced chemiluminescence Western blotting detection system (iBOX Scientia gel imager).
1.8 Detection of expression of PRDX4 in cell line by ELISAPreparation of whole-cell protein lysates using the protein lysate (Solarbio, Beijing, China). The concentration of protein lysates was tested by BCA protein quantification kit (Sangon, Shanghai, China). The PRDX4 protein concentration was detected with the quantitative ELISA kit according to manufacturers instructions. Briefly, added 50 μL sample and 100 μL HRP labelled antibody to each well, incubated in 37 ℃ for 60 min, then wash 5 times. 100 μL substrate solution was added to each well, incubated for no longer than 20 min at 37 ℃ and avoid from light. 50 μL stop solution was added in wells. Finally, the reaction was read spectrophotmetrically at ~570 nm.
1.9 Plasmid construction and cell transfectionThe whole coding regin of PRDX4 (NM_006406) was cloned into the GV230 vector (CMV-MCS-EGFP- SV40-Neomycin) at the Xho I/Kpn I sites, and the construction procedure was completed by GENECHEM, Shanghai, China. GES-1 cells were selected and cultured at 60%–70% confluence in 6-well plates. Cells were transfected with recombinant PRDX4 plasmids or empty vector for 36 h using X-treme GENE9 (Roche, Swiss). To confirm the transfection efficiency, RT-PCR and Western blotting were performed.
1.10 Detection of ROS level in cells by fluorescent probeDilute the fluorescent probe DCFH-DA by DMEM into 1:1 000, and the concentration of probe was 10 μmol/L. Cells were washed down and diluted it into 1×10⁶/mL, then added 2 mL prepared DCFH-DA. Incubated for 20 min at 37 ℃, then washed for 3 times by DMEM in order to remove the un-loaded probe. Detection of fluorescent intensity by fluorescence spectrophotometer was performed.
1.11 Statistical analysisTo evaluate the possible differences of PRDX4 expression in different cell, we performed Pearson’s X2 test. The Student’s two-sided t-test was used to compare test and control sample values in MTT assay, soft agar colony formation assay. All statistical analysis was carried out using the SPSS 16.0 software. P values < 0.05 considered statistically significant.
2 Results and discussion2.1 Construction of GES-1 malignant transformation cell line modelDuring the malignant transformation of GES-1 cell line by MNNG, the cell morphology of GES-1 gradually changed from spindle cells to round or irregular shape with the prolongation of induction time, and it changed from uniform arrangement to a cell stack. Cell growth even loss contact inhibition (Fig. 1). Based on the change of cell morphology, it can be initially determined that the cell transformation model was established successfully. The cells induced by MNNG are hereinafter referred to as MTC (Malignant Transformed Cell) cells.
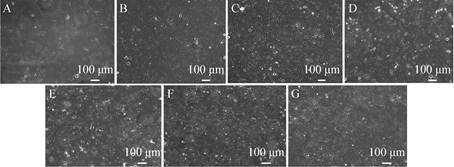 |
| Fig. 1 The morphological changes of GES-1 cells induced by MNNG (10×). (A) GES-1. (B) MTC-4. (C) MTC-8. (D) MTC-12. (E) MTC-16. (F) MTC-20. (G) MTC-24 (MTC-4, MTC-8, MTC-12, MTC-16, MTC-20, MTC-24 represent the induction by MNNG at 4, 8, 12, 16, 20, 24 h). |
| 图选项 |
2.2 Detection of cell migration ability after induction of different timeCell migration ability is one of the important characteristics of tumor cells, and it is positively correlated with the degree of cell malignancy. It can be seen from Fig. 2 that when the cells were induced to 4 h and 8 h, the healing rate of the scratched area (0.25±0.02, 0.29±0.04, respectively) was not significantly different from that of GES-1 cells (0.21±0.04) (*P < 0.05). When the cells were induced to 12 h and 16 h, the healing rate of the scratched area (0.43±0.05, 0.47±0.03, respectively) gradually increased, and the migration ability of the cells gradually increased (**P < 0.01). When the cells were induced to 20 h and 24 h, the alignment was performed. The healing rate of the marks reached 0.53±0.04 and 0.61±0.05, and the migration ability of the cells was the strongest. It can be preliminarily judged that with the prolongation of induction time, the degree of cell transformation gradually increases. When the cells are induced to 16 h, the cells have been completely transformed, and the cells have completely transformed when induced to 24 h.
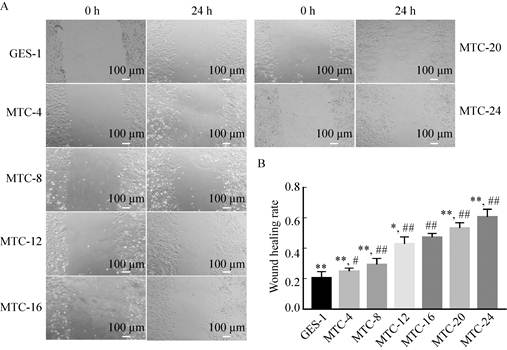 |
| Fig. 2 Detection of cell migration ability after induction at different time. (A) Scratch test result. (B) Wound healing ability analysis (*P < 0.05, ** P < 0.01, versus MTC-16; # P < 0.05, ## P < 0.01, versus GES-1). |
| 图选项 |
2.3 Detection of cell clone formation ability after induction of different timeThe ability of cells to clone is enhanced and is also a feature of tumor cells. Normal cells do not form cell aggregates in soft agar medium, mainly because of the contact inhibition of normal cells, so under the same growth condition, tumor cells clones in soft agar aggregated to a greater extent. It can be seen from Fig. 3 that when MNNG was induced to 16 h (1.81 cm2) and later, it was found that the cell clone formed by single cell growth was larger than GES-1 (0.65 cm2) cells, and the number of clones was also significantly increased, there was a significant difference (**P < 0.01). When induced to 24 h (2.21 cm2), the single cell clone formed was the largest, and when induced to 4 h (1.32 cm2), the clone formed was similar to the GES-1 cells. Therefore, it can be inferred that the cells were in the initial transformation, and by 24 h, the cells had completely malignant transformation.
 |
| Fig. 3 Detection of cell clone formation ability after induction at different time. (A) A single cell clone formation after induction at different time (40×). (B) Changes in single cell cloning area after induction at different time (*P < 0.05, **P < 0.01, versus GES-1). |
| 图选项 |
2.4 Detection of cell proliferation ability after induction of different timeTumor cells are more proliferative than normal cells. The results of MTT assay showed that the proliferation of cells was the same as that of GES-1 cells when induced to 4 h. When induced to 8 h, 12 h, and 16 h, the proliferative capacity of transformed cells increased gradually. When induced to 20 h, the cells proliferated. When induced to 24 h, the proliferative ability of the transformed cells was reduced to the level of 8 h. Therefore, with the prolongation of induction time, the proliferation rate of transformed cells gradually increased, reaching the highest when induced to 16 h, and if the induction time reached 20 h and 24 h, it would lead to a decrease in proliferation rate. The reason is because the limitation of the MTT method itself. MTT mainly judges the proliferation rate by detecting the number of living cells, and the long-term induction of MNNG causes a large number of cell death, so the cell proliferation rate induced for a long time is low (Fig. 4).
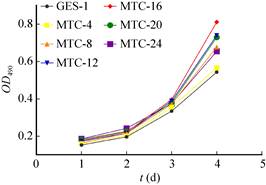 |
| Fig. 4 Detection of cell proliferation ability after induction at different time. |
| 图选项 |
Based on the above results, it can be inferred that when the MNNG was induced to 16 h, the tumor-associated cell function data showed that the cells had almost completely transformed, and the cells were completely transformed at 24 h. Therefore, the transformed cells (MTC-16) were selected as the host cell transfected with the PRDX4 overexpression plasmid, which is the experimental material and object for studying the mechanism of PRDX4 promoting gastric cancer.
2.5 Detection of ROS content in transformed cells after induction for different timeThe detection of ROS content in cells induced at different times was compared with the result of the same culture time of GES-1 cells (Fig. 5): as the induction time prolonged, the fluorescence intensity of the transformed cells first increased and then decreased. When the induction time was extended to 16 h, the fluorescence intensity of the transformed cells increased to 51 092.92±99.54, which reached the highest. When the induction time was extended to 20 h and 24 h, the fluorescence intensity of the transformed cells decreased slightly, which were 49 652.14±429.15 and 47 558.16±956.53, respectively. There was a significant difference in fluorescence intensity values between groups (**P < 0.01). The fluorescence intensity values of the transformed cells in each group were significantly higher than those in GES-1 cells (42 231.99±1 064.91), and the lowest fluorescence intensity of MTC-4 cells (47 649.10±1 167.12) was also significantly higher than that of GES-1 (##P < 0.01).
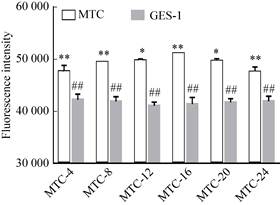 |
| Fig. 5 Detection of ROS in cells after induction at different time (*P < 0.05, versus the next group; ** P < 0.01, versus the next group; ##P < 0.01; versus MTC group). |
| 图选项 |
The results showed that ROS could promote the cell transformation process with the prolongation of induction time. When the cells were basically transformed (after 16 h induction), as the degree of transformation further increased, the ROS content gradually decreased, and the transformed cells were prevented from undergoing apoptosis. The growth and proliferation of tumor cells provide a good microenvironment.
2.6 Detection of PRDX4 mRNA in tested cells after induction for different timeThe results of changes in RNA content in transformed cells with different induction time showed (Fig. 6A, B, D). Before 8 h of induction, the content of PRDX4 mRNA in the cells was basically at the same level. When induced for 8–12 h, the content was significant. Increase, when induced for 12–16 h, the content decreased significantly, and then after 16 h induction, the content was at the same level. The results showed that the expression level of PRDX4 gradually increased when induced to 8–12 h, and the expression level gradually decreased when induced to 12–16 h.
 |
| Fig. 6 Detection of PRDX4 content after induction at different time. (A) Electrophoresis of GADPH mRNA. (B) Electrophoresis of PRDX4 mRNA (1#–7# represent GES-1, MTC-4, MTC-8, MTC-12, MTC-16, MTC-20 and MTC-24, same as follow). (C) Electrophoresis of PRDX4 Western blotting. (D) Relative expression level of PRDX4 mRNA (grayscale analysis). (E) Relative expression level of PRDX4 protein (grayscale analysis). (F) ELISA test of PRDX4 protein concentration (*P < 0.05, **P < 0.01, versus MTC-16; # P < 0.05, ## P < 0.01, versus GES-1). |
| 图选项 |
2.7 Detection of PRDX4 protein content at different induction time by Western blotting assayThe results showed that with the prolongation of induction time, the content of PRDX4 increased first and then decreased gradually. When induced at 0–16 h, the expression of PRDX4 increased gradually, and the content of PRDX4 reached the highest at 16 h, 16–24 h. The PRDX4 content gradually decreased (**P < 0.01) (Fig. 6C, E).
2.8 ELISA detection of PRDX4 protein content at different induction timeThe results showed that with the prolongation of induction time, the content of PRDX4 in the cells increased first and then decreased. At 0 h, 4 h, 8 h and 12 h, the content of PRDX4 in the cells was basically the same (contents were (2.70±0.47) ng/mL, (2.53±0.27) ng/mL, (2.73±0.05) ng/mL and (2.71±0.06) ng/mL, respectively), no significant difference; When induced to 16 h, the content of PRDX4 was the highest, reaching (3.51±0.08) ng/mL, which was significantly different from the content of GES-1 cells (**P < 0.01). When induced to 20 h and 24 h, the content of PRDX4 in the cells was A certain degree of reduction (contents of (3.22±0.07) ng/mL and (3.14±0.19) ng/mL, respectively) (Fig. 6F).
The above results indicated that, firstly, the PRDX4 mRNA and protein levels showed a consistent trend, indicating that the PRDX4 gene expression level increased first and then decreased. Secondly, when induced for 0–12 h, the ROS content in the transformed cells showed a gradual increase trend, which proved that ROS promoted cell transformation in cells, which promoted tumorigenesis, and PRDX4 did not promptly eliminate ROS in transformed cells, which indirectly led to tumorigenesis. After induction for 12–16 h, the content of PRDX4 protein increased sharply due to ROS stimulation, but the clearance rate of ROS by PRDX4 was much lower than that of ROS. Therefore, PRDX4 had no effect on the total content of ROS in cells. When induced for 16–24 h, the content of PRDX4 protein decreased gradually, and the ROS content in the cells also decreased gradually. It is speculated that the clearance rate of ROS in cells was higher than that of ROS due to the increase of PRDX4 protein content after 16 h, causing ROS in cells. The total amount is reduced, and the apoptosis of the transformed cells due to the excessive ROS content is avoided, so that the cells are in a good microenvironment favorable for growth and proliferation, thereby promoting the further deterioration of the transformed cells, that is, the function of promoting tumor development.
2.9 Transfection of PRDX4 overexpression vectorThe PRDX4 overexpression vector was bought in Genechem (Shanghai, China). The GV230 plasmid selected in this experiment contains the green fluorescent protein (EGFP) gene sequence, so when the vector is transfected into eukaryotic cells and successfully expressed, the cells are green under a fluorescence microscope. In this experiment, the PRDX4 overexpression vector (GV230-PRDX4) and the blank plasmid (GV230) were transfected into MTC-16 cells by liposome transient transfection, and the transfection efficiency was about 60% (Fig. 7). The PRDX4 overexpression vector was successfully transfected.
 |
| Fig. 7 Transfection result of PRDX4 overexpression plasmid (20×). |
| 图选项 |
2.10 Western blotting verified the successful construction of PRDX4 overexpression systemThe experiment was divided into GES-1, MTC-16, MTC-16-GV230 and MTC-16-PRDX4 groups, and Western blotting was used to detect PRDX4 protein content in cells (Fig. 8A). Gray scale analysis (Fig. 8B) The content of PRDX4 protein in MTC-16-PRDX4 cells was significantly higher than that of GES-1, MTC-16 and MTC-16-GV230 (**P < 0.01), which proved that the PRDX4 overexpression system was successfully constructed.
 |
| Fig. 8 Detection with Western blotting of PRDX4 content after PRDX4 overexpression. (A) Electrophoresis of PRDX4 Western blotting (1#–4#:GES-1, MTC-16, MTC-16-GV230, MTC-16-PRDX4). (B) Relative expression level of PRDX4 protein (grayscale analysis)(**P < 0.01, versus MTC-16-PRDX4). |
| 图选项 |
2.11 Detection of cell migration ability after overexpression of PRDX4The results of the scratch test showed that the healing rate of MTC-16-PRDX4 cells was the highest in the scratched area, reaching 0.8±0.05, while in the other cell groups, the scratch healing rate of GES-1 was 0.5±0.04, MTC-16 cells. There was no difference in the healing rate of MTC-16-GV230 cells, both of which was 0.65±0.03. Thus, MTC-16-PRDX4 cells have stronger cell migration ability (Fig. 9).
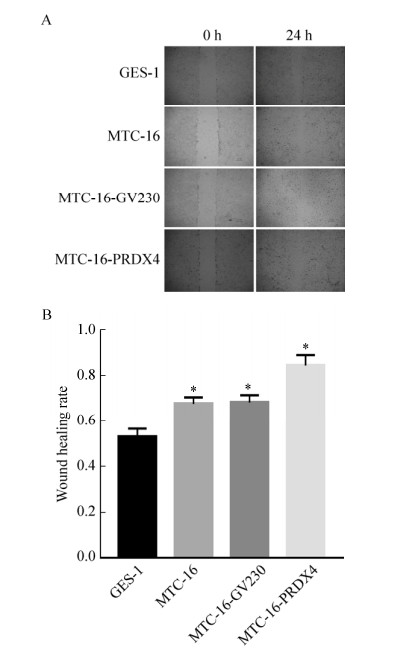 |
| Fig. 9 Detection of cell migration ability after PRDX4 overexpression. (A) Cell scratch test (4×). (B) wound healing rate (*P < 0.05, versus GES-1). |
| 图选项 |
2.12 Detection of cell clone formation ability after overexpression of PRDX4The results of cell soft agar colony formation experiments (Fig. 10) showed that the colony area of single cell clone formed by MTC-16-PRDX4 cells in soft agar reached (3.14±0.04) cm2, while the colony area of GES-1 cells was only (0.48±0.04) cm2. MTC-16 cells and MTC-16-GV230 cells were (1.26±0.03) cm2 and (1.45±0.05) cm2, respectively. As can be seen from the above experimental results, the ability of PRDX4 overexpressing MTC-16 cell clone formation was significantly increased (**P < 0.01, ##P < 0.01).
 |
| Fig. 10 Detection of cell colony formation ability after PRDX4 overexpression. (A) Single cell colony formation. (B) Changes in single cell cloning area after induction after PRDX4 overexpression (**P < 0.01, versus GES-1, ## P < 0.01, versus MTC-16-PRDX4). |
| 图选项 |
2.13 Detection of cell proliferation ability after overexpression of PRDX4Cell MTT assay showed that the proliferation of MTC-16-PRDX4 cells was significantly stronger than that of MTC-16 cells and MTC-16-GV230 cells (Fig. 11).
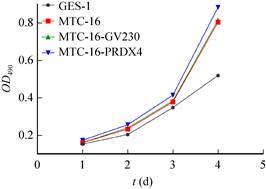 |
| Fig. 11 Detection of cell proliferation ability after PRDX4 overexpression. |
| 图选项 |
The above results indicate that the tumor-associated cell function index (migration ability, clonality and proliferation ability) of MTX-16 cells overexpressed by PRDX4 is significantly higher than that of MTC-16, further confirming that PRDX4 plays a role in promoting tumors in cells.
2.14 Detection of PRDX4 protein content in overexpression system by ELISAThe total protein in GES-1, MTC-16, MTC-16-GV230 and MTC-16-PRDX4 cells was detected by ELISA, and the results showed (Fig. 12): the concentration of PRDX4 protein in MTC-16-PRDX4 cells was 3.75±0.08 ng/mL, significantly higher than GES-1 (2.20±0.12 ng/mL), MTC-16 (3.14±0.06 ng/mL) and MTC-16-GV230 (3.05±0.08 ng/mL) cells.
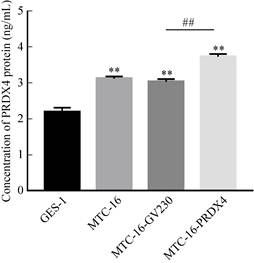 |
| Fig. 12 Detection with ELISA of PRDX4 content after PRDX4 overexpression. (**P < 0.01, versus GES-1; ##P < 0.01, MTC-16-GV230 versus MTC-16-PRDX4). |
| 图选项 |
2.15 Detection of ROS content in PRDX4 overexpression systemThe cells were divided into four groups: GES-1, MTC-16, MTC-16-GV230 and MTC-16- PRDX4. The ROS content in the cells was detected by fluorescent probe DCFH-DA. The results showed that, except for the blank control and the positive control. The fluorescence intensity of GES-1 cells was the lowest, which was 42 231.99±1 064.91. The fluorescence intensity of MTC-16 cells and MTC-16-GV230 cells transfected with empty plasmid were basically the same, 51 092.92 ±99.53 and 51 092.92±810.99, respectively; The fluorescence intensity in MTC-16-PRDX4 cells was significantly lower than that of MTC-16 cells, and was significantly higher than that of GES-1 cells, which was 45 271.78±1 736.2 (Fig. 13).
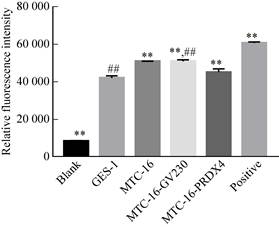 |
| Fig. 13 Detection of ROS level after PRDX4 overexpression (**P < 0.01, versus GES-1; ##P < 0.01, versus MTC-16-PRDX4). |
| 图选项 |
The above experimental results confirmed that the ROS content was significantly decreased in PRDX4 overexpressing cells. It can be confirmed that the function of PRDX4 in cells is to eliminate excess ROS in the cells, so that MTC-16-PRDX4 cells are in a microenvironment favorable for cell proliferation, which promotes the malignant development process of transformed cells, that is, promotes gastric cancer.
3 ConclusionThe level of ROS in tumor cells is generally higher than that of normal cells, and this conclusion has been confirmed by many experiments. ROS plays a two-fold role in tumor cells: on the one hand, in normal cells, slightly higher levels of ROS can stimulate abnormalities in tumor cells, and when intracellular damage accumulates, it can promote tumorigenesis; on the other hand, in tumor cells when the ROS content level is too high, it will lead to apoptosis or even necrosis, which is not conducive to the further proliferation of tumor cells, thereby inhibiting the development of tumors. Therefore, the effect of ROS on cells can be summarized as: when the ROS content in normal cells is too high, it can promote the occurrence of tumors; when the ROS content in tumor cells is too high, it inhibits the development of tumors.
The results of this study showed that when the cells were induced to 4 h, the ROS content in the cells was significantly higher than that of GES-1 cells, which confirmed that the induction of MNNG increased the ROS content in the cells and stimulated DNA damage in the cells, with the induction time. The prolongation of intracellular damage also accumulates; when induced for 0–12 h, the PRDX4 content in the transformed cells is not statistically different from that of GES-1 cells. It can be considered that the PRDX4 content has not changed at this stage, thus it has become an increase in ROS. One of the reasons is the indirect promotion of tumors; the subsequent induction of ROS content gradually increased from 12 h to 16 h, and it was found that the tumor-related functional indicators of the cells were also gradually increased, confirming that high levels of ROS stimulated cells to cause damage. And accumulation, eventually leading to malignant transformation of cells; when induced for 16–24 h, the malignant degree of the cells is still increasing, but the ROS content is decreased. Compared with PRDX4 protein content, the expression of PRDX4 suddenly rises after induction to 16 h. Hence, it is speculated that high levels of ROS stimulate the expression of antioxidant enzymes such as PRDX4, making anti-oxidases such as PRDX4 function as peroxidases. Thereby reducing the levels of ROS in cells, prevent the cell due to the high levels of ROS and apoptosis, such that cells in the microenvironment conducive to the growth and proliferation, thus promoting the development of gastric cancer. Through PRDX4 overexpression experiments, it was further proved that after PRDX4 overexpression, tumor-associated cell markers were elevated to different extents, confirming the promotion of PRDX4 on the development of gastric cancer; while PRDX4 overexpression, ROS content was significantly reduced, further confirming PRDX4 promotes the development of gastric cancer by reducing the level of ROS in gastric cancer cells. In summary, PRDX4 indirectly promotes the occurrence of gastric cancer, and at the same time, by clearing the ROS in the transformed cells, the cells are in a microenvironment favorable for growth and proliferation, avoiding apoptosis, and finally promoting the development of gastric cancer.
REFERENCES
| [1] | Ferlay J, Shin HR, Bray F, et al. Estimates of worldwide burden of cancer in 2008: GLOBOCAN 2008. Int J Cancer, 2010, 127(12): 2893-2917. |
| [2] | Jemal A, Bray F, Center MM, et al. Global cancer statistics. CA Cancer J Clin, 2011, 61(2): 69-90. |
| [3] | Hamashima C. Current issues and future perspectives of gastric cancer screening. World J Gastroenterol, 2014, 20(38): 13767-13774. |
| [4] | Cunning D, Okines AF, Ashley S. Capecitabine and oxaliplatin for advanced esophagogastric cancer. N Engl J Med, 2010, 362(9): 858-859. |
| [5] | Parkin DM, Bray F, Ferlay J, et al. Global cancer statistics, 2002. CA Cancer J Clin, 2005, 55: 74-108. |
| [6] | Schmidt N, Peitz U, Lippert H, Malfertheiner P. Missing gastric cancer in dyspepsia. Aliment Pharmacol Ther, 2005, 21: 813-820. |
| [7] | Shimada H, Noie T, Ohashi M, et al. Clinical significance of serum tumor markers for gastric cancer: a systematic review of literature by the Task Force of the Japanese Gastric Cancer Association. Gastric Cancer, 2014, 17(1): 26-33. |
| [8] | Pan Xu, Mingyang Shao, Ruhan Jia. Peroxiredoxin-4 as a Potential Biomarker of Early Gastric Cancer Screened by cell-SELEX. Transl Cancer Res, 2017, 6(2): 293-303. |
| [9] | Xu P, Ma C, Han YW. Significance of detection of primary cell ssDNA aptamer in early gastric adenocarcinoma. Pract J Cancer, 2014, 29(9): 1070-1072. |
| [10] | Guo P, Selection of aptamers to early gastric adenocarcinoma primary cells and preliminary extraction of cell membrane[D]. Lanzhou University, 2013. |
| [11] | Du ZY, Jia RH, Han YW. election of specific aptamers to PRDX4 as a potential serum biomarker for early gastric cancer. Chin J Biochem Mol Biol, 2018, 34(10): 1065-1072. |
| [12] | Jang JS, Cho HY, Lee YJ, et al. The differential proteome profile of stomach cancer: identification of the biomarker candidates. Oncol Res, 2004, 14(10): 491-499. |
| [13] | Winterbourn CC. The biological chemistry of hydrogen peroxide. Methods in enzymology, 2013, 528: 3-25. |
| [14] | Schulte J, Struck J, Bergmann A, et al. Immunoluminometric assay for quantification of peroxiredoxin 4 in human serum. Clin Chim Acta, 2010, 411(17/18): 1258-1263. |
| [15] | Ito R, Takahashi M, Ihara H, et al. Measurement of peroxiredoxin-4 serum levels in rat tissue and its use as a potential marker for hepatic disease. Mol Med Rep, 2012, 6(2): 379-384. |
| [16] | Trzeciecka A, Klossowski S, Bajor M, et al. Dimeric peroxiredoxins are druggableis in human Burkitt lymphoma. Oncotarget, 2016, 7(2): 1717-1731. |
| [17] | Wood ZA, Schr der E, Harris JR. Poole LB: Structure, mechanism and regulation of peroxiredoxins. Trends Biochem Sci, 2003, 28(1): 32-40. |
| [18] | Ajani JA, Ben trem D J, Besh S, et al. National Comprehensive Cancer Network. Gastric cancer, version2. 2013: featured updates to the NCCN Guidelines. J Natl Compr Canc Netw, 2013, 11(5): 531-546. |
| [19] | Isobe Y, Nashimoto A, Akazawa K, et al. Gastric cancertreatment in Japan: 2008 annual report of the JGCA nationwide registry. Gastric Cancer, 2011, 14(4): 301-316. |
| [20] | Okado-Matsumoto A, Matsumoto A, Fujii J. Taniguchi N: Peroxiredoxin IV is a secretable protein with heparin-binding properties under reduced conditions. J Biochem, 2000, 127(3): 493-501. |
| [21] | Tavender TJ. Sheppard AM and Bulleid NJ: Peroxiredoxin IV is an endoplasmic reticulum-localized enzyme forming oligomeric complexes in human cells. Biochem J, 2008, 411: 191-199. |
