 , 徐辉2, 许岩2, 游少鸿1, 王旭2, 胡烨1,2, 黄适尔1,2, 边睿2,4, 齐维晓2
 , 兰华春2, 刘会娟2, 曲久辉2,3
1. 桂林理工大学环境科学与工程学院, 桂林 541004;
2. 清华大学环境学院, 清华大学水质与水生态研究中心, 北京 100084;
3. 中国科学院生态环境研究中心, 饮用水科学与技术重点实验室, 北京 100085;
4. 东北师范大学环境学院, 长春 130117
收稿日期: 2021-03-11; 修回日期: 2021-05-13; 录用日期: 2021-05-13
基金项目: 长江重点江段特征污染物识别及其生态风险(No.20192001769)
作者简介: 曾超怡(1994—), 女, E-mail: chaoyizeng@126.com
通讯作者(责任作者): 齐维晓, E-mail: wxqi@mail.tsinghua.edu.cn
摘要:研究了长江攀枝花、宜宾、泸州、重庆、涪陵、三峡、岳阳、武汉、九江和南京共计10个重点江段枯水期和丰水期表层水中19种多环芳烃(PAHs)及其15种衍生物(SPAHs)的分布和来源, 评估了长江PAHs类污染的健康风险及时空差异.结果表明, 长江表层水中∑PAHs、∑SPAHs平均浓度分别为(147.3±59.8)、(73.2±29.7) ng·L-1, 检出率分别为82.9%、69.5%, 其中2~3环(S)PAHs所占比例为79%.在SPAHs中, ∑NPAHs(硝基取代PAHs)、∑MPAHs(甲基取代PAHs)、∑OPAHs(氧化PAHs)的平均浓度分别为(27.0±4.5)、(24.7±15.5)、(17.1±11.9) ng·L-1.根据分子比值法及主成分分析可知, 长江重点江段PAHs主要来源于生物质、化石及液体燃料燃烧, SPAHs主要来源于燃烧源和光化学转化, SPAHs及PAHs通过大气沉降汇入水体.采用毒性当量因子浓度计算对长江重点江段PAHs进行健康风险评估, 结果表明在枯水期具有致癌性PAHs的∑TEQBaP值(苯并芘毒性当量)较高, 其中岳阳、武汉江段的BaP毒性当量浓度高于我国地表水规定阈值, 应当高度重视长江流域PAHs在枯水期引起的健康风险.
关键词:多环芳烃(PAHs)多环芳烃衍生物(SPAHs)分布来源健康风险长江
Distribution and health risk of polycyclic aromatic hydrocarbons (PAHs) and their derivatives in surface water of the Yangtze River
ZENG Chaoyi1,2
 , XU Hui2, XU Yan2, YOU Shaohong1, WANG Xu2, HU Ye1,2, HUANG Shier1,2, BIAN Rui2,4, QI Weixiao2
 , LAN Huachun2, LIU Huijuan2, QU Jiuhui2,3
1. School of Environmental Science and Engineering, Guilin University of Technology, Guilin 541004;
2. Center for Water and Ecology, School of Environment, Tsinghua University, Beijing 100084;
3. Key Laboratory of Drinking Water Science and Technology, Research Center for Eco-Environmental Sciences, Chinese Academy of Sciences, Beijing 100085;
4. School of Environmental, Northeast Normal University, Changchun 130117
Received 11 March 2021; received in revised from 13 May 2021; accepted 13 May 2021
Abstract: The distribution and sources of 19 polycyclic aromatic hydrocarbons and their 15 derivatives in surface water of the Yangtze River were studied during dry and wet seasons, including Panzhihua, Yibin, Luzhou, Chongqing, Fuling, Three Gorges Reservoir, Yueyang, Wuhan, Jiujiang, and Nanjing sections. Besides, the health risk and spatial-temporal differences of PAHs pollution were assessed. The results show that the average concentrations of ∑PAHs and ∑SPAHs of the Yangtze River were respectively 147.3±59.8 and 73.2±29.7 ng·L-1, and their detection rates were respectively 82.9% and 69.5%, and 2~3 ring PAHs accounted for 79%. For SPAHs, the average concentrations of ∑NPAHs (nitrated-PAHs), ∑MPAHs (methyl PAHs), and ∑OPAHs (oxygenated-PAHs) were 27.0±4.5, 24.7±15.5 and 17.1±11.9 ng·L-1, respectively. According to the molecular ratio and principal component analysis of the sources of pollutants, biomass, fossil and liquid fuel combustion were the main sources of PAHs. Combustion sources and photochemical conversion were the main sources of SPAHs. Both SPAHs and PAHs mainly entered into water bodies through atmospheric deposition. The health risk of PAHs in the watershed was assessed by calculating the concentration of toxic equivalent factor. The results showed that the ∑TEQBaP value (benzopyrene toxicity equivalent) of carcinogenic PAHs in the dry season was relatively higher than that in the wet season. The ∑TEQBaP values in the Yueyang and Wuhan river sections were higher than the threshold value of Chinese surface water quality standard. Therefore, the health risk caused by PAHs should be focused in the Yangtze River during dry season.
Keywords: polycyclic aromatic hydrocarbons (PAHs)substituted polycyclic aromatic hydrocarbons (SPAHs)distributionsourcehealth riskYangtze river
1 引言(Introduction)具有“三致”效应的典型持久性有机污染物多环芳烃(Polycyclic aromatic hydrocarbons, PAHs)主要来源于生物质、煤和燃料的不完全燃烧排放以及石油类物质污染, 具有半挥发性、疏水性、亲脂性的特征(秦宁等, 2013; Zhang et al., 2017; González-Gaya et al., 2019).多环芳烃可远距离迁移并广泛分布于各种环境介质中, 并通过呼吸道和食物链直接或间接地危害人体健康, 从而引起国际社会的广泛关注(Zhang et al., 2012).多环芳烃在光化学及微生物的作用下可转化成带有取代基团的多环芳烃衍生物(Substituted polycyclic aromatic hydrocarbons, SPAHs), 如甲基多环芳烃(MPAHs)、氧化多环芳烃(OPAHs)和硝基多环芳烃(NPAHs), 部分SPAHs相对于PAHs具有更强的致突变和致癌性(Qiao et al., 2014b; 2014a).
长江流域承载着中国总人口的43%, 长江经济带占全国GDP的45%, 是中国工业化最早的地区(Kang et al., 2020).随着流域经济的快速发展, 人类活动的干扰及有毒有机污染物的输入, 导致潜在风险日益严重(Sun et al., 2021).据已有研究报道, 七大流域水体∑16PAHs平均质量浓度为2596.3 ng·L-1, 其中致癌类PAHs通过饮水途径产生的人体健康风险高于USEPA推荐的最大可接受风险水平(范博等, 2019);我国湖泊水体∑16PAHs质量浓度为4.0~12970.8 ng·L-1, 污染水平在全球范围内相对较高, BaA和Phe较高的RQ值对生态系统具有潜在风险(Meng et al., 2019).而水体多环芳烃衍生物的研究主要集中在污水处理厂进出水及其纳污河流, 其中Qiao等在北京纳污河流中检出∑MPAHs、∑OPAHs及∑ClPAHs质量浓度分别为(28.0±22.0)、(321.0±651.0)、30.0±12.0 ng·L-1(Qiao et al., 2020).目前对长江流域某个干流江段、支流及入海口的水体PAHs相关研究较多, 在重庆江段∑15PAHs质量浓度为65.6~1249.0 ng·L-1(邹家素等, 2017), 三峡库区∑13PAHs质量浓度为23.0~1630.0 ng·L-1(Tang et al., 2017), 丰水期武汉江段∑16PAHs质量浓度为20.8~90.4 ng·L-1(董磊等, 2018), 而缺乏对长江上、中、下游重点江段水体PAHs及SPAHs的系统研究.因此, 本研究通过分析长江重点江段水体中PAHs及SPAHs的浓度水平和时空分布特征, 利用分子比值法和主成分分析探讨污染物的来源, 并采用毒性当量因子(TEFs)进行健康风险评估, 以期为长江流域污染防控和水生态保护提供数据支持.
2 材料及方法(Materials and methods)2.1 实验材料及仪器2.1.1 实验材料本研究的多环芳烃目标化合物(PAHs)中有16种属于美国在“清洁水法”中规定优先污染物:萘(Naphthalene)、苊烯(Acenaphthylene)、苊(Acenaphthene)、芴(Fluorene)、菲(Phenanthrene)、蒽(Anthracene)、荧蒽(Fluoranthene)、芘(Pyrene)、苯并[a]蒽(Benzo[a]anthracene)、(Chrysene)、苯并[b]荧蒽(Benzo[b]fluoranthene)、苯并[k]荧蒽(Benzo[k]fluoranthene)、苯并[a]芘(Benzo[a]pyrene)、茚并[1, 2, 3-cd]芘(Indeno[1, 2, 3-cd]pyrene)、二苯并[a, h]蒽(Dibenzo[a, h]anthracene)、苯并[g, h, i]苝(Benzo[g, h, i]perylene);此外还有3种多环芳烃目标化合物(PAHs)为:苯并[j]荧蒽(Benzo[j]fluoranthene), 苯并[c]菲(Benzo[c]phenanthrene), 苯并[e]芘(Benzo[e]pyrene).15种多环芳烃衍生物:2-甲基萘(2-Methylnaphthalene)、1-甲基荧蒽(1-Methylfluoranthene)、2, 6-二甲基萘(2, 6-Dimethylnaphthalene)、3, 6-二甲基菲(3, 6-Dimethylphenanthrene)、7, 12-二甲基苯并[a]蒽(7, 12-Dimethyl-benz[a]anthracen)、3-甲基胆蒽(3-Methylcholanthrene)、9-芴酮(9-Fluorenone)、蒽醌(Anthraquinone)、2-甲基蒽醌(2-Methylanthranquinone)、苯并蒽-7, 12-二酮(Benz[a]anthracene-7, 12-dione)、2-硝基芴(2-Nitrofluorene)、9-硝基蒽(9-Nitroanthrancene)、3-硝基荧蒽(3-Nitrofluoranthene)、1-硝基芘(1-Nitropyrene)、7-硝基苯并蒽(7-Nitrobenz[a]anthracene).19种多环芳烃和15种多环芳烃衍生物标样, 均购于J&K, 北京百灵威科技有限公司.内标物质:二氟联苯(2-Fluorobiphenyl)和十氯联苯(Decachlorobiphenyl), 购于Aldrich Chemical Co., Inc.(Gillingham, Dorset, USA).甲醇(Methanol), HPLC级(Fisher Scientific, USA);正己烷(n-Hexane)、二氯甲烷(Dichloromethane)和丙酮(Acetone), 农残级(Fisher Scientific, USA);无水硫酸钠, 分析纯, 经450 ℃焙烧5 h后置于干燥皿中保存备用.
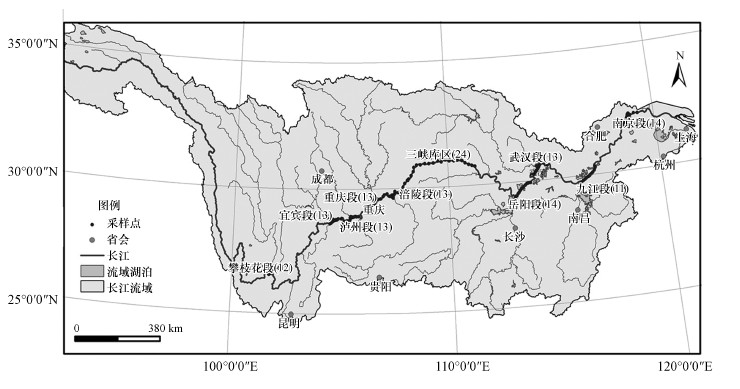
2.1.2 样品采集及处理以长江重点江段为研究区域, 包括攀枝花江段、宜宾江段、泸州江段、重庆江段、涪陵江段、三峡江段、岳阳江段、武汉江段、九江江段、南京江段, 每个江段采集样品区域为城市活动区上下游间约100 km范围内, 研究区域及采样点设置如图 1所示.采样点位设置数量如下:攀枝花(12个)、宜宾(13个)、泸州(13个)、重庆(13个)、涪陵(13个)、三峡(24个)、岳阳(11个)、武汉(13个)、九江(11个)、南京(14个), 共计137个样品.
图 1(Fig. 1)
 |
| 图 1 长江重点江段采样点分布示意 Fig. 1The sampling locations in the Yangtze River |
于2019年12月(枯水期)及2020年6月(丰水期)使用不锈钢采水器采集表层水, 储存于棕色玻璃瓶中, 现场用玻璃纤维滤膜过滤(直径142 mm×孔径0.7 μm(Millpore Co.)), 水相样品(2 L)用活化好的C18固相萃取柱(500 mg, Waters Co.)在固相萃取装置上富集, 富集完的小柱用铝箔纸包好冷藏运回实验室, 保存于冰箱(-20 ℃)中.在实验室, 先以10 mL二氯甲烷为洗脱剂, 分3次淋洗(4、3、3 mL), 最后以5 mL正己烷洗脱, 将收集的洗脱液进行旋转蒸发至2 mL左右, 再用无水硫酸钠去除洗脱液中的少量水分, 转移至K-D浓缩瓶加入内标后轻柔氮吹至1 mL, 使用气相色谱-质谱联用仪(7890B GC-5977B MSD, Agilent Technologies, USA)测定分析.2020年6月受疫情影响, 无法采集到武汉江段水样.
2.2 样品测定(S) PAHs仪器检测的气相色谱条件:色谱柱选用DB-17MS石英毛细管柱(30 m×0.25 mm×0.25 μm, Agilent Technologies, USA), 载气为高纯氦气, 流速为1 mL·min-1, 进样量1 μL不分流, 进样口温度为280 ℃.质谱条件:电离方式为电子轰击源(EI), 电子能量为70 eV, 选择离子扫描(SIM)方式.通过质谱图确认保留时间进行定性分析, 采用SIM模式进行定量分析, 使用内标法和11点校正曲线定量.
2.3 质量控制与质量保证采用内标法进行定量分析, 每测试15个样品同时完成一组质量控制样品的测试(方法空白、加标空白、基质加标、基质加标平行样、样品平行样).PAHs及SPAHs(不含Nap)的回收率为74.8%~126.8%, 检出限与定量限分别为3倍信噪比和10倍信噪比, 2 L水相样品中34种目标物的检出限为:0.02~2.97 ng·L-1, 定量限为:0.08~9.90 ng·L-1.
3 结果与讨论(Results and discussion)3.1 长江重点江段PAHs及SPAHs的检出频率及污染水平长江所有江段样品的∑PAHs、∑MPAHs、∑OPAHs、∑NPAHs、∑SPAHs总质量浓度如表 1所示.所有江段样品19种PAHs均有检出, 15种SPAHs中1-NP未检出, 其它SPAHs均有不同程度的检出.
表 1(Table 1)
| 表 1 长江重点江段表层水中∑PAHs、∑MPAHs、∑OPAHs、∑NPAHs质量浓度 Table 1 Concentrations of ∑PAHs, ∑MPAHs, ∑OPAHs, ∑NPAHs in the Yangtze River ? | ||||||||||||||||||||||||||||||||||||||||||||||||||||||
表 1 长江重点江段表层水中∑PAHs、∑MPAHs、∑OPAHs、∑NPAHs质量浓度 Table 1 Concentrations of ∑PAHs, ∑MPAHs, ∑OPAHs, ∑NPAHs in the Yangtze River ?
| ||||||||||||||||||||||||||||||||||||||||||||||||||||||
枯水期和丰水期所有江段样品∑PAHs的检出率为82.9%, 其中Fluo、Phe、Flua、Chry在所有江段样品为100%的检出率.所有江段水体∑PAHs质量浓度为53.7~370.3 ng·L-1, 平均质量浓度为147.3 ng·L-1, 与黄河口水体∑16PAHs(11.8~205.4 ng·L-1)(Li et al., 2017)和塞纳河水体∑13PAHs(11.0~221.0 ng·L-1)(Froger et al., 2019)水平相近, 与恒河流域水体∑16PAHs(50.0~65900.0 ng·L-1)(Sharma et al., 2018)及2016年王丹等(2016)报道的长江宜宾到泸州江段水体∑16PAHs(64.0~1150.0 ng·L-1)相比含量较低.丰水期所有江段水体∑PAHs质量浓度为150.5 ng·L-1, 与Zhao等在2021年报道的长江中下游水体∑16PAHs(312.2 ng·L-1)相比质量浓度较低(Zhao et al., 2021).
枯水期和丰水期所有江段样品∑SPAHs的检出率为69.5%, 其中2-MN、2, 6-DMN、9-FL在所有江段样品为100%的检出率, 7, 12-2MBaA、3-MC、3-NF在少数样品中有检出, 但浓度水平低于定量限.NPAHs及MPAHs在SPAHs中占比较高, 分别为39%和36%, OPAHs占比为25%.占比最高的NPAHs在枯水期和丰水期的检出率分别为59.2%、86.3%, 枯水期所有样品7-NBA的检出率为44.1%, 远低于丰水期(74.4%), 其中重庆、涪陵、三峡、九江江段在枯水期均未检出7-NBA.2-NF和9-NA在不同季节的检出率分别为92.2%、96.0%, 平均浓度分别为11.6、7.3 ng·L-1.枯水期和丰水期水体∑NPAHs的质量浓度分别为21.3~43.5、10.4~42.9 ng·L-1, 平均质量浓度分别为29.9、24.2 ng·L-1, 与太湖水体∑15NPAHs(ND~212.0 ng·L-1)(Kong et al., 2021)和日本浅野河水体∑5NPAHs(604.0 ng·L-1)(Chondo et al., 2013)相比浓度水平较低, 与中国梅川河水体∑7NPAHs(5.2 ng·L-1)和陆川河(6.2 ng·L-1)(Hung et al., 2012)相比质量浓度较高.OPAHs和MPAHs在不同季节的检出率分别为74.1%、65.2%, 平均质量浓度分别为17.1、24.7 ng·L-1, 与北京纳污河流水体∑4OPAHs(0.02~0.40 ng·L-1)和∑4MPAHs(0.06~0.19 ng·L-1)相比质量浓度较高(Qiao et al., 2014b), 远低于北京和广东污水处理厂出水纳污河流水体∑4OPAHs(844.9 ng·L-1)和∑4MPAHs(684.9 ng·L-1)浓度含量(Cao et al., 2018), 与潮白河表层水∑4MPAHs(28.0 ng·L-1)浓度水平相近(Qiao et al., 2020).
枯水期和丰水期长江所有江段2环(S)PAHs占比为60%(图 2), 2环(S)PAHs质量占比最低为丰水期的攀枝花江段(42%), 占比最高为枯水期的涪陵江段(87%).2环PAHs中Nap质量浓度最高, 平均浓度为76.4 ng·L-1, 与近10年长江流域Nap浓度(71.8 ng·L-1)相近(范博等, 2019).3环和4环(S)PAHs占比相近, 分别为19%、16%, 5~6环(S)PAHs所占比例最少.据报道可知, 辛醇-水分配系数(Kow)是影响PAHs在水体、土壤等介质中分配的主要因素, 环数越高的PAHs的Kow值也越高, 低水溶性及高疏水性使得水体中的高环PAHs更易吸附在悬浮颗粒物中(Wu et al., 2019).
图 2(Fig. 2)
 |
| 图 2 长江重点江段(S)PAHs分布特征 Fig. 2Compositional patterns of (S)PAHs in the Yangtze River |
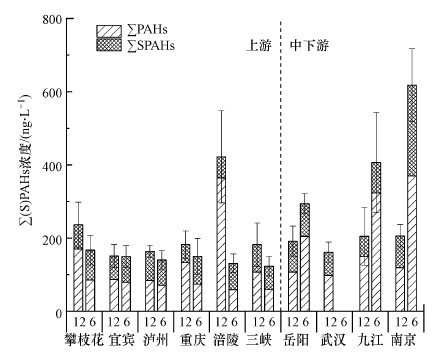
3.2 长江重点江段PAHs及SPAHs的季节和空间分布特征通过软件SPSS26.0对长江所有江段PAHs、SPAHs进行T-检验分析, 表明PAHs、SPAHs的含量在不同季节之间有显著性差异(p < 0.05).长江重点江段水体PAHs及SPAHs在不同季节的分布特征如图 3所示, 长江所有江段∑(S)PAHs浓度随着长江流向呈增加的趋势, 可能是从上游至下游人口密度和工业活动逐渐增加, 下游航运相对发达导致石油泄漏等污染(Kong et al., 2021).据报道, SPAHs与相应PAHs的比值可分析SPAHs的迁移(Walgraeve et al., 2010).长江重点江段MPAH/PAH在丰水期较高, 而OPAHs和NPAHs在不同季节的迁移转化没有显著性差异(图 4).这可能是因为MPAHs在土壤中残留比例较高(Chen et al., 2017), 大气强降水产生的地表径流对城市、道路和农田的冲刷增加了水体MPAHs的输入, 导致丰水期比值较高(Cailleaud et al., 2007).OPAHs和NPAHs的迁移转化可能由多种因素决定, 其中大气条件(光照、温度、大气氧化剂浓度)会影响OPAHs和NPAHs的生成, 不同季节的干湿沉降会影响其汇入水体后的含量, 此外母体PAHs的分布特征也会影响其比值大小.因此, 多种因素的影响导致OPAH/PAH和NPAH/PAH没有表现出显著的季节差异(Bandowe et al., 2014).
图 3(Fig. 3)
 |
| 图 3 枯水期(2019年12月)及丰水期(2020年6月)长江重点江段表层水中∑PAHs和∑SPAHs的质量浓度 (图中横坐标中12、6分别代表枯水期和丰水期) Fig. 3Concentration of ∑PAHs and ∑SPAHs in different sections of the Yangtze River during dry and wet seasons |
图 4(Fig. 4)
 |
| 图 4 枯水期及丰水期长江重点江段表层水中SPAH与相应PAH的比值 Fig. 4Ratios of SPAH and the corresponding PAH in the Yangtze River during dry and wet seasons |
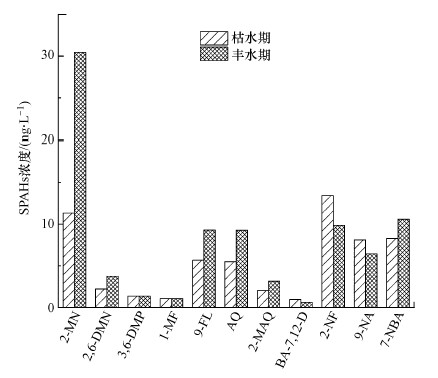
长江重点江段单种SPAHs在不同季节的浓度水平如图 5所示, 丰水期长江重点江段2-MN的平均质量浓度为30.4 ng·L-1, 2-MN的最高值出现在南京江段, 质量浓度为112.8 ng·L-1, 比其它江段浓度高一个数量级, 可能是南京江段航运较发达导致石油泄漏, 使得丰水期南京江段2-MN的质量浓度水平较高.AQ和2-MAQ通常来源于大气沉降和污染源的直接排放, 丰水期长江重点江段AQ和2-MAQ的质量浓度分别为2.6~45.2、2.1~5.7 ng·L-1, 平均值分别为9.3、3.2 ng·L-1, 与枯水期相比质量浓度水平较高, 丰水期Ant可能更易通过光化学过程生成AQ和2-MAQ后通过大气沉降汇入水中(Tomaz et al., 2017).本研究枯水期2-NF和9-NA高于丰水期, 枯水期长江重点江段2-NF和9-NA的质量浓度分别为4.8~21.0、3.9~13.6 ng·L-1.据报道, 气相PAHs在白天和夜间分别与羟基自由基和NO3反应生成NPAHs, 其中NPAHs在白天易受光照影响转化成其它物质(Eiguren-Fernandez et al., 2008).枯水期长江重点江段较高的2-NF和9-NA浓度表明, 可能是枯水期光照较弱使得大气中2-NF和9-NA在白天受到的光降解影响较小, 导致通过大气沉降进入水体的2-NF和9-NA浓度水平较高(Alves et al., 2017).
图 5(Fig. 5)
 |
| 图 5 枯水期(2019年12月)及丰水期(2020年6月)长江重点江段表层水中SPAHs的质量浓度 Fig. 5Concentration of SPAHs in the surface water of the Yangtze River during dry and wet seasons |
3.3 长江重点江段PAHs及SPAHs的来源分析具有相对稳定特征的Ant/Phe、Flua/Pyr、BaA/Chry同分异构体的比值广泛用于PAHs的来源分析:Ant/(Ant+Phe) < 0.1时石油排放为主要来源, 大于0.1时则生物质和煤燃烧是主要来源(Yunker et al., 2002);Flua/(Flua+Pyr) < 0.4时石油排放是主要来源, 比值在0.4~0.5时主要来源于液体燃料燃烧, 大于0.5时主要来源于生物质和煤燃烧(Baumard et al., 1999);BaA/(BaA+Chry)小于0.2时主要来源于石油排放, 比值在0.2~0.35时主要来源于石油和液体燃料燃烧混合源, 大于0.35时主要来源于生物质、煤燃烧(Zhang et al., 2004; Tuncel et al., 2015; 龚香宜等, 2015).
如图 6所示, 枯水期泸州、岳阳江段PAHs主要来源于生物质、煤燃烧.攀枝花江段PAHs主要来源于石油排放和生物质、煤燃烧的混合来源.如图 7所示, 丰水期攀枝花、泸州和岳阳江段PAHs主要来源于生物质、煤和液体燃料燃烧.总体来看, 宜宾、重庆、涪陵、三峡、九江、南京江段PAHs在不同季节的来源无显著差异, 其中宜宾江段PAHs主要来源于生物质和煤的燃烧, 南京江段PAHs来源最为复杂.结果表明, 燃烧源(生物质、化石和液体燃料燃烧混合)为长江所有江段PAHs的主要来源.
图 6(Fig. 6)
 |
| 图 6 长江重点江段枯水期PAHs的来源诊断图 Fig. 6Source identification plots of PAHs isomer ratios in the Yangtze River during dry seasons |
图 7(Fig. 7)
 |
| 图 7 长江重点江段丰水期PAHs的来源诊断图 Fig. 7Source identification plots of PAHs isomer ratios in the Yangtze River during wet seasons |
利用SPAHs/Ant、MPAHs/PAHs、2-硝基荧蒽与1-硝基芘的比值可作为SPAHs及其母体PAHs的来源分析.其中Ant与其衍生物比值大于1时, 主要来源于大气沉降, 小于1时主要来源于石油源的直接排放(Idowu et al., 2020).长江所有江段9-NA/Ant和AQ/Ant的比值在不同季节均大于1, 则表明Ant与其衍生物主要来源于大气沉降.MPAHs与相应母体PAHs的比值常作为MPAHs及其母体PAHs的来源分析, MPAHs/PAHs > 1时石油源为主要来源, 小于1时则表明燃烧源为主要来源(Kim et al., 1999).总体来看, 长江重点江段MPAHs/PAHs的比值小于1, 表明MPAHs及其母体PAHs主要来源于燃烧源, 其中丰水期南京江段2-MN/Nap的比值大于1, 则丰水期南京江段2-MN及Nap的主要来源于石油源的直接排放.NPAHs的来源主要包括液体燃料燃烧和PAHs光化学转化, 可用2-硝基荧蒽与1-硝基芘(1-NP)的比值来判断.其中2-硝基荧蒽产生于大气中Fluo与羟基自由基的反应, 而1-NP主要来自柴油燃烧尾气排放(Bandowe et al., 2017).当2-硝基荧蒽与1-NP的比值小于5时, NPAHs主要来源于液体燃料燃烧, 大于5时NPAHs则主要来源于光化学转化.尽管本研究未测定2-硝基荧蒽的含量, 但样品中均未检出1-NP, 表明近期长江重点江段表层水中的NPAHs主要来源于光化学转化(Kong et al., 2021).综上所述, MPAHs及其母体PAHs主要来源于燃烧源, NPAHs主要来源于光化学转化, SPAHs及其母体PAHs最终通过大气沉降进入水体.
采用主成分分析(PCA)对长江重点江段PAHs及SPAHs进行来源解析(Feng et al., 2019), 提取所有样品PAHs和SPAHs的6个特征值大于1的主成分, 累计解释了方差变量的73.4%.结果表明, 长江所有江段PAHs主要来源于生物质、煤和液体燃料燃烧, SPAHs主要来源于燃烧源和光化学转化, 与比值分析后所得结论一致.
3.4 长江重点江段PAHs及SPAHs的健康风险评估目前, 毒性当量因子(TEFs)广泛用于分析环境中PAHs的生态风险, 根据TEFs值可以计算美国联邦环保署列为优先控制污染物的16种典型PAHs及部分SPAHs相对BaP的毒性当量TEQBaP, 公式见式(1)(Nisbet et al., 1992; Wei et al., 2015; Alharbi et al., 2018):
 | (1) |
4 结论(Conclusions)枯水期和丰水期长江所有江段表层水中溶解态∑PAHs、∑MPAHs、∑OPAHs、∑NPAHs、∑SPAHs平均质量浓度分别为(147.3±59.8)、(24.7±15.5)、(17.1±11.9)、(27.0±4.5)、(73.2±29.7) ng·L-1.枯水期和丰水期所有江段样品∑PAHs和∑SPAHs的检出率分别为82.9%、69.5%, 长江所有江段溶解态(S)PAHs以低环为主, 2环(S)PAHs占比最高为60%.长江重点江段PAHs及SPAHs的含量在不同季节有显著性差异, ∑(S)PAHs浓度水平从上游至下游呈增加的趋势, 可能是下游人口密度大、工业活动多和航运较发达等因素导致.通过分子比值法及主成分分析可知长江重点江段PAHs主要来源于生物质、煤、煤油和柴油燃烧, MPAHs主要为燃烧源的一次贡献, NPAHs主要来源于光化学转化, SPAHs及其母体PAHs通过大气沉降进入水体.对流域PAHs进行BaP的毒性当量计算可知, PAHs的健康风险在不同季节差异明显.
表 2(Table 2)
| 表 2 长江重点江段PAHs及SPAHs的TEQ平均浓度(以BaPeq计) Table 2 TEQ mean concentrations of PAHs and SPAHs in the Yangtze River(BaPeq) ? | ||||||||||||||||||||||||||||||||||||||||||||||||||||||||||||||||||||||||||||||||||||||||||||||||||||||||||||||||||||||||||||||||||||||||||||||||||||||||||||||||||||||||||||||||||||||||||||||||||||||||||||||||||||||||||||||||||||||||||||||||||||||||||||||||||||||||||||||||||||||||||||||||||||||||||||||||||||||||||||||||||||||||||||||||||||||||||||||||||||||||||||||||||||||||||||||||||||||||||||||||||||||||||||||||||||||||||||||||||||||||||||||||||||||||||||||||||||||||||||||||||||||||||||||||||||||||||||||||||||||||||||||||||||||||||||||||||||||||||||||||||||||||||||||||||||||||||||||||||||||||||||||||||||||||||||||||||||||||||||
表 2 长江重点江段PAHs及SPAHs的TEQ平均浓度(以BaPeq计) Table 2 TEQ mean concentrations of PAHs and SPAHs in the Yangtze River(BaPeq) ?
| ||||||||||||||||||||||||||||||||||||||||||||||||||||||||||||||||||||||||||||||||||||||||||||||||||||||||||||||||||||||||||||||||||||||||||||||||||||||||||||||||||||||||||||||||||||||||||||||||||||||||||||||||||||||||||||||||||||||||||||||||||||||||||||||||||||||||||||||||||||||||||||||||||||||||||||||||||||||||||||||||||||||||||||||||||||||||||||||||||||||||||||||||||||||||||||||||||||||||||||||||||||||||||||||||||||||||||||||||||||||||||||||||||||||||||||||||||||||||||||||||||||||||||||||||||||||||||||||||||||||||||||||||||||||||||||||||||||||||||||||||||||||||||||||||||||||||||||||||||||||||||||||||||||||||||||||||||||||||||||
参考文献
| Alharbi O M L, Basheer A A, Khattab R A, et al. 2018. Health and environmental effects of persistent organic pollutants[J]. Journal of Molecular Liquids, 263: 442-453. DOI:10.1016/j.molliq.2018.05.029 |
| Alves C A, Vicente A M, Custódio D, et al. 2017. Polycyclic aromatic hydrocarbons and their derivatives (nitro-PAHs, oxygenated PAHs, and azaarenes) in PM2.5 from Southern European cities[J]. Science of the Total Environment, 595: 494-504. DOI:10.1016/j.scitotenv.2017.03.256 |
| Bandowe B A M, Meusel H. 2017. Nitrated polycyclic aromatic hydrocarbons (nitro-PAHs) in the environment - A review[J]. Science of the Total Environment, 581: 237-257. |
| Bandowe B A M, Meusel H, Huang R J, et al. 2014. PM25-bound oxygenated PAHs, nitro-PAHs and parent-PAHs from the atmosphere of a Chinese megacity: Seasonal variation, sources and cancer risk assessment[J]. Science of the Total Environment, 473-474: 77-87. DOI:10.1016/j.scitotenv.2013.11.108 |
| Baumard P, Budzinski H, Garrigues P, et al. 1999. Polycyclic aromatic hydrocarbon (PAH) burden of mussels (Mytilus sp.) in different marine environments in relation with sediment PAH contamination, and bioavailability[J]. Marine Environmental Research, 47: 415-439. DOI:10.1016/S0141-1136(98)00128-7 |
| Cailleaud K, Forget-leray J, Souissi S, et al. 2007. Seasonal variations of hydrophobic organic contaminant concentrations in the water-column of the Seine Estuary and their transfer to a planktonic species Eurytemora affinis (Calanoida, copepoda). Part 1: PCBs and PAHs[J]. Chemosphere, 70: 270-280. DOI:10.1016/j.chemosphere.2007.05.095 |
| Cao W, Qiao M, Liu B, et al. 2018. Occurrence of parent and substituted polycyclic aromatic hydrocarbons in typical wastewater treatment plants and effluent receiving rivers of Beijing, and risk assessment[J]. Journal of Environmental Science and Health, Part A, 53: 992-999. DOI:10.1080/10934529.2018.1471031 |
| Chen W, Wu X, Zhang H, et al. 2017. Contamination characteristics and source apportionment of methylated PAHs in agricultural soils from Yangtze River Delta, China[J]. Environmental Pollution, 230: 927-935. DOI:10.1016/j.envpol.2017.07.035 |
| Chondo Y, Li Y, Makino F, et al. 2013. Determination of selected nitropolycyclic aromatic hydrocarbons in water samples[J]. Chemical and Pharmaceutical Bulletin, 61: 1269-1274. DOI:10.1248/cpb.c13-00547 |
| 董磊, 汤显强, 林莉, 等. 2018. 长江武汉段丰水期水体和沉积物中多环芳烃及邻苯二甲酸酯类有机污染物污染特征及来源分析[J]. 环境科学, 39(6): 2588-2599. |
| Eiguren-fernandez A, Miguel A H, Di Stefano E, et al. 2008. Atmospheric distribution of gas-and particle-phase quinones in Southern California[J]. Aerosol Science and Technology, 42: 854-861. DOI:10.1080/02786820802339546 |
| 范博, 王晓南, 黄云, 等. 2019. 我国七大流域水体多环芳烃的分布特征及风险评价[J]. 环境科学, 40(5): 2101-2114. |
| Froger C, Quantin C, Gasperi J, et al. 2019. Impact of urban pressure on the spatial and temporal dynamics of PAH fluxes in an urban tributary of the Seine River (France)[J]. Chemosphere, 219: 1002-1013. DOI:10.1016/j.chemosphere.2018.12.088 |
| González-gaya B, Martínez-varela A, Vila-costa M, et al. 2019. Biodegradation as an important sink of aromatic hydrocarbons in the oceans[J]. Nature Geoscience, 12: 119-125. DOI:10.1038/s41561-018-0285-3 |
| 龚香宜, 何炎志, 孙云雷. 2015. 江汉平原四湖流域上区地下水中多环芳烃分布特征与源解析[J]. 环境科学学报, 35(3): 789-796. |
| Hung C H, Ho H P, Lin M T, et al. 2012. Purge-assisted headspace solid-phase microextraction combined with gas chromatography/mass spectrometry for the determination of trace nitrated polycyclic aromatic hydrocarbons in aqueous samples[J]. Journal of Chromatography A, 1265: 1-6. DOI:10.1016/j.chroma.2012.09.084 |
| Idowu O, Carbery M, O'connor W, et al. 2020. Speciation and source apportionment of polycyclic aromatic compounds (PACs) in sediments of the largest salt water lake of Australia[J]. Chemosphere, 246: 125779. DOI:10.1016/j.chemosphere.2019.125779 |
| Kang P, Zhang H, Duan H. 2020. Characterizing the implications of waste dumping surrounding the Yangtze River economic belt in China[J]. Journal Of Hazardous Materials, 383: 121207. DOI:10.1016/j.jhazmat.2019.121207 |
| Kim G B, Maruya K A, Lee R F, et al. 1999. Distribution and sources of polycyclic aromatic hydrocarbons in sediments from Kyeonggi Bay, Korea[J]. Marine Pollution Bulletin, 38: 7-15. DOI:10.1016/S0025-326X(99)80006-X |
| Kong J, Dai Y, Han M, et al. 2021. Nitrated and parent PAHs in the surface water of Lake Taihu, China: Occurrence, distribution, source, and human health risk assessment[J]. Journal of Environmental Sciences, 102: 159-169. DOI:10.1016/j.jes.2020.09.025 |
| Lei P, Zhang H, Shan B, et al. 2016. Distribution, diffusive fluxes, and toxicity of heavy metals and PAHs in pore water profiles from the northern bays of Taihu Lake[J]. Environmental Science And Pollution Research, 23: 22072-22083. DOI:10.1007/s11356-016-7467-6 |
| Li J, Li F, Liu Q. 2017. PAHs behavior in surface water and groundwater of the Yellow River estuary: Evidence from isotopes and hydrochemistry[J]. Chemosphere, 178: 143-153. DOI:10.1016/j.chemosphere.2017.03.052 |
| Liu M, Feng J, Hu P, et al. 2016. Spatial-temporal distributions, sources of polycyclic aromatic hydrocarbons (PAHs) in surface water and suspended particular matter from the upper reach of Huaihe River, China[J]. Ecological Engineering, 95: 143-151. DOI:10.1016/j.ecoleng.2016.06.045 |
| Luo X, Mai B, Yang Q, et al. 2004. Polycyclic aromatic hydrocarbons (PAHs) and organochlorine pesticides in water columns from the Pearl River and the Macao harbor in the Pearl River Delta in South China[J]. Marine Pollution Bulletin, 48: 1102-1115. DOI:10.1016/j.marpolbul.2003.12.018 |
| Meng Y, Liu X, Lu S, et al. 2019. A review on occurrence and risk of polycyclic aromatic hydrocarbons (PAHs) in lakes of China[J]. Science of the Total Environment, 651: 2497-2506. DOI:10.1016/j.scitotenv.2018.10.162 |
| Nisbet I C T, Lagoy P K. 1992. Toxic equivalency factors (TEFs) for polycyclic aromatic hydrocarbons (PAHs)[J]. Regulatory Toxicology and Pharmacology, 16: 290-300. DOI:10.1016/0273-2300(92)90009-X |
| Qiao M, Fu L, Li Z, et al. 2020. Distribution and ecological risk of substituted and parent polycyclic aromatic hydrocarbons in surface waters of the Bai, Chao, and Chaobai rivers in northern China[J]. Environmental Pollution, 257: 113600. DOI:10.1016/j.envpol.2019.113600 |
| Qiao M, Qi W, Liu H, et al. 2014a. Occurrence, behavior and removal of typical substituted and parent polycyclic aromatic hydrocarbons in a biological wastewater treatment plant[J]. Water Research, 52: 11-19. DOI:10.1016/j.watres.2013.12.032 |
| Qiao M, Qi W, Liu H, et al. 2014b. Oxygenated, nitrated, methyl and parent polycyclic aromatic hydrocarbons in rivers of Haihe River System, China: Occurrence, possible formation, and source and fate in a water-shortage area[J]. Science of the Total Environment, 481: 178-185. DOI:10.1016/j.scitotenv.2014.02.050 |
| 秦宁, 何伟, 王雁, 等. 2013. 巢湖水体和水产品中多环芳烃的含量与健康风险[J]. 环境科学学报, 33(1): 230-239. |
| Ringuet J, Albinet A, Leoz-garziandia E, et al. 2012. Diurnal/nocturnal concentrations and sources of particulate-bound PAHs, OPAHs and NPAHs at traffic and suburban sites in the region of Paris (France)[J]. Science of the Total Environment, 437: 297-305. DOI:10.1016/j.scitotenv.2012.07.072 |
| Sharma B M, Melymuk L, Bharat G K, et al. 2018. Spatial gradients of polycyclic aromatic hydrocarbons (PAHs) in air, atmospheric deposition, and surface water of the Ganges River basin[J]. Science of the Total Environment, 627: 1495-1504. DOI:10.1016/j.scitotenv.2018.01.262 |
| Sun Y, Zhang R, Ma R, et al. 2021a. Distribution, sources, and ecological risk assessment of polycyclic aromatic hydrocarbons in the sediments of Daihai Lake in Inner Mongolia, China[J]. Environmental Science and Pollution Research, 28: 23123-23132. DOI:10.1007/s11356-021-12349-3 |
| Tang Y M, Junaid M, Niu A, et al. 2017. Diverse toxicological risks of PAHs in surface water with an impounding level of 175 m in the Three Gorges Reservoir Area, China[J]. Science of the Total Environment, 580: 1085-1096. DOI:10.1016/j.scitotenv.2016.12.064 |
| Tomaz S, Jaffrezo J L, Favez O, et al. 2017. Sources and atmospheric chemistry of oxy-and nitro-PAHs in the ambient air of Grenoble (France)[J]. Atmospheric Environment, 161: 144-154. DOI:10.1016/j.atmosenv.2017.04.042 |
| Tuncel S G, Topal T. 2015. Polycyclic aromatic hydrocarbons (PAHs) in sea sediments of the Turkish Mediterranean coast, composition and sources[J]. Environmental Science and Pollution Research, 22: 4213-4221. DOI:10.1007/s11356-014-3621-1 |
| Walgraeve C, Demeestere K, Dewulf J, et al. 2010. Oxygenated polycyclic aromatic hydrocarbons in atmospheric particulate matter: Molecular characterization and occurrence[J]. Atmospheric Environment, 44: 1831-1846. DOI:10.1016/j.atmosenv.2009.12.004 |
| 王丹. 2016. 长江上游(宜宾至泸州段)毒害污染物分布特征及风险评价[M]. 邯郸: 河北工程大学. |
| Wang L, Yang Z, Niu J, et al. 2009. Characterization, ecological risk assessment and source diagnostics of polycyclic aromatic hydrocarbons in water column of the Yellow River Delta, one of the most plenty biodiversity zones in the world[J]. Journal of Hazardous Materials, 169: 460-465. DOI:10.1016/j.jhazmat.2009.03.125 |
| Wei C, Han Y, Bandowe B A M, et al. 2015. Occurrence, gas/particle partitioning and carcinogenic risk of polycyclic aromatic hydrocarbons and their oxygen and nitrogen containing derivatives in Xi'an, central China[J]. Science of the Total Environment, 505: 814-822. DOI:10.1016/j.scitotenv.2014.10.054 |
| Wu Y, Wang X, Ya M, et al. 2019. Seasonal variation and spatial transport of polycyclic aromatic hydrocarbons in water of the subtropical Jiulong River watershed and estuary, Southeast China[J]. Chemosphere, 234: 215-223. DOI:10.1016/j.chemosphere.2019.06.067 |
| Yunker M B, Macdonald R W, Vingarzan R, et al. 2002. PAHs in the Fraser River basin: a critical appraisal of PAH ratios as indicators of PAH source and composition[J]. Organic Geochemistry, 33: 489-515. DOI:10.1016/S0146-6380(02)00002-5 |
| Zhang D, Wang J J, Ni H G, et al. 2017. Spatial-temporal and multi-media variations of polycyclic aromatic hydrocarbons in a highly urbanized river from South China[J]. Science of the Total Environment, 581-582: 621-628. DOI:10.1016/j.scitotenv.2016.12.171 |
| Zhang L, Dong L, Ren L, et al. 2012. Concentration and source identification of polycyclic aromatic hydrocarbons and phthalic acid esters in the surface water of the Yangtze River Delta, China[J]. Journal of Environmental Sciences, 24: 335-342. DOI:10.1016/S1001-0742(11)60782-1 |
| Zhang Z, Huang J, Yu G, et al. 2004. Occurrence of PAHs, PCBs and organochlorine pesticides in the Tonghui River of Beijing, China[J]. Environmental Pollution, 130: 249-261. DOI:10.1016/j.envpol.2003.12.002 |
| Zhao Z H, Gong X H, Zhang L, et al. 2021. Riverine transport and water-sediment exchange of polycyclic aromatic hydrocarbons (PAHs) along the middle-lower Yangtze River, China[J]. Journal of Hazardous Materials, 403: 15. |
| 邹家素, 孙秀萍, 郑璇, 等. 2017. 三峡库区重庆段重点水域沉积物多环芳烃的污染特征及生态风险评价[J]. 安全与环境学报, 17(4): 1548-1553. |
