 , 王晓玲1, 王元涛1, 王晓敏2, 宋以萍2, 蒋莹莹2, 祝贵兵2

1. 吉林建筑大学市政与环境工程学院, 长春 130118;
2. 中国科学院生态环境研究中心饮用水科学与技术重点实验室, 北京 100085
收稿日期: 2019-09-02; 修回日期: 2019-11-08; 录用日期: 2019-11-08
基金项目: 国家自然科学基金(No.41671471,41322012和91851204);广东省"珠江人才计划"本土创新科研团队项目(No.2017BT01Z176);国家长江生态环境保护修复联合研究中心项目(No.2019-LHYJ-01-0103);中国科学院生态环境研究中心长江保护专项项目(No.RCEES-CJBH-2019-03);中国科学院前沿科学重点研究计划(No.QYZDJ-SSW-DQC013);中国科学院生态环境研究中心生态环境卓越创新项目(No.RCEES-EE1-2019-02)环境模拟与污染控制国家重点联合实验室专项资金(中国科学院生态环境研究中心)(No.18Z02ESPCR),中国科学院青年创新促进会项目
作者简介: 刘时光(1991-), 男, E-mail:lsg617553769@163.com
通讯作者(责任作者): 祝贵兵, E-mail:gbzhu@rcees.ac.cn
摘要:土壤中氧化亚氮(N2O)的释放量占全球N2O释放总量的60%.其中,稻田土壤是N2O最主要的释放源.反硝化过程是稻田土壤N2O生成的主要微生物过程之一.本研究选取广东韶关稻田垂向土壤(0~100 cm)为研究对象,通过乙炔抑制剂法测定了N2O产生潜势和反硝化潜势,并利用针对特异性功能基因的实时荧光定量和高通量测序技术分别分析反硝化功能基因丰度和反硝化微生物群落结构.结果显示:0~10 cm深度的土壤样品N2O产生潜势最高,可达(0.020±0.0035)μg·g-1·h-1.反硝化功能基因中,nirK基因的丰度峰值((1.51±0.0015)×108 copies·g-1)出现在0~10 cm深度,而nosZ和nirS基因的丰度峰值((4.29±0.0015)×107 copies·g-1和(8.86±0.0010)×107 copies·g-1)均出现在10~20 cm深度.稻田垂向土壤中N2O产生潜势和相关的反硝化功能基因(nosZ、nirK和nirS)丰度均随土壤深度的增加而逐渐降低.其中在所有深度的土壤样品中nirK基因的丰度均高于nirS.基于nirK基因的高通量测序结果发现慢生根瘤菌(Bradyrhizobium)的相对丰度最高(44.06%±6.14%,n=6).相关性分析表明,稻田土壤中N2O产生潜势与环境因子(TN、TC和含水率)、反硝化功能基因丰度以及慢生根瘤菌(Bradyrhizobium),罗河杆菌属(Rhodanobacter)和亚硝化螺菌属(Nitrosospira)的相对丰度呈正相关.上述结果表明稻田土壤中环境因子和反硝化功能基因丰度影响了N2O产生潜势的垂向分布.
关键词:稻田垂向土壤氧化亚氮反硝化细菌功能基因群落结构
The potential of nitrous oxide, denitrification function gene abundance, and vertical distribution of community structure in paddy soil
LIU Shiguang1,2
 , WANG Xiaoling1, WANG Yuantao1, WANG Xiaomin2, SONG Yiping2, JIANG Yingying2, ZHU Guibing2

1. School of Municipal Engineering and Environmental, Jilin Jianzhu University, Changchun 130118;
2. Key Laboratory of Drinking Water Science and Technology, Center for Ecological Environment Research, Chinese Academy of Sciences, Beijing 100085
Received 2 September 2019; received in revised from 8 November 2019; accepted 8 November 2019
Abstract: Nitrous oxide (N2O) emission from soil takes up to 60% among the total N2O emission amount worldwide, where N2O emission from the paddy soil plays a significant role. Denitrification is one of the main microbial processes of N2O production in paddy soil. In this study we analyzed the vertically distributed paddy soil (0~100 cm) from Shaoguan City, Guangdong Province, China, and measured the rate of N2O generation and denitrification by the means of the acetylene inhibition method, and also we analyzed the abundance of denitrification function genes via quantitative Real-time PCR and identified the denitrifying microbial community structure by high-throughput sequencing technology. The results show that soil samples at 0~10 cm demonstrated the highest N2O production potential, which reaches0.020±0.0035 μg·g-1·h-1. For the function genes, the peak abundance of nirK gene ((1.51±0.0015)×108 copies·g-1) appeared in the depth of 0~10 cm, while that of nosZ and nirS genes ((4.29±0.0015)×107 copies·g-1 and (8.86±0.0010)×107 copies·g-1) appeared in the depth of 10~20 cm. The potential N2O production decreased along with the increment of the vertical soil depth. The abundance of nirK gene in all soil samples was higher than that of nirS. Based on the high-throughput sequencing results of nirK gene, Bradyrhizobium had the highest relative abundance (44.06%±6.14%, n =6). The correlation analysis demonstrated that the potential of N2O production in paddy soil was positively correlated with the environmental factors (TN, TC and water content), the abundance of denitrification function genes, and the relative abundance of Bradyrhizobium, Rhodobacter and Nitrosospira. The above results show that the vertical distribution of the potential rate of N2O production could be by both environmental factors and the abundance of genes in paddy soil.
Keywords: vertical soil of paddy fieldnitrous oxidefunctional genes of denitrifying bacteriacommunity structure
1 引言(Introduction)氧化亚氮(N2O)是一种主要由土壤生态系统释放的温室气体(Davidson, 2009).作为第三重要的温室气体, N2O使全球变暖的潜势是二氧化碳(CO2)的296倍(Lashof et al., 1990), 其含量约占全球温室气体排放总量的8%(IPCC, 2013).因此, 近几十年来受到了土壤学家的广泛关注(Pathak, 1999; de Klein et al., 2001; Butterbachbahl et al., 2013).土壤中N2O排放占N2O排放全球总量的60%以上, 反硝化过程、硝化过程、硝化微生物的反硝化过程、硝酸盐异化还原成铵过程均能产生N2O, 其中农业土壤中的反硝化过程是N2O释放的最重要途径之一(Wrage et al., 2001; Hayatsu et al., 2008).因此探究农田土壤中反硝化过程的N2O排放机理及其相关影响因素至关重要.
微生物反硝化是陆地生态系统中主要的氮氧化物生成途径之一(ButterbachBahl et al. 2013).反硝化在厌氧条件下通过4个步骤依次将硝酸盐还原为氮气(NO3-→NO2-→NO→N2O→N2), 参与这4个步骤的还原酶分别是硝酸盐还原酶(基因narG)、亚硝酸盐还原酶(基因nirS、nirK)、一氧化氮还原酶(基因norB)、氧化亚氮还原酶(基因nosZ)(Zumft, 1997).而亚硝酸还原酶(Nir)将NO2-还原为NO这一过程是反硝化过程中至关重要的一步, 它将反硝化细菌与其他硝酸盐呼吸细菌区分开来.Nir酶有两种功能等效的形式:nirK基因编码的含铜亚硝酸盐还原酶和nirS基因编码的含细胞色素cd1的亚硝酸盐还原酶(Braker et al., 2000).这两种基因都可以在同一物种的不同菌株中找到.此外nosZ基因编码的氧化亚氮还原酶(Nos)将N2O还原为N2是产生N2作为最终气体的另一个关键步骤(Hoeren et al., 1993; Philippot et al., 2007).
在稻田土壤生态系统中, 反硝化过程将NO3-还原成N2不仅造成氮损失, 还会产生具有温室效应的中间产物N2O(Zhu et al., 2011).而土壤中氮肥的使用、作物类型、土壤pH、有机质、土壤水分、温度、微生物丰度和群落结构等因素会对N2O释放造成影响(朱永官等, 2014).此外, 在以往研究的稻田土壤中生物炭、灌溉制度、重金属污染、土地利用等会对反硝化菌群结构与N2O释放造成影响(Wu et al., 2107; Yang et al., 2018; Liu et al., 2018; He et al., 2019).
本研究采用定量PCR (real-time PCR, qPCR)、Illumina MiSeq测序技术和乙炔抑制等方法, 针对水稻垂向深度变化过程中, N2O产生潜势、反硝化潜势、反硝化细菌群落的丰度、菌群结构进行了研究.本研究的目标是①N2O产生潜势和反硝化细菌的丰度在稻田土壤的垂向分布.②当稻田土壤垂向深度变化时, 环境因子、反硝化细菌丰度和菌群结构对N2O产生潜势的影响.
2 材料与方法(Materials and methods)2.1 样品采集与环境因子测定采样点位于中国广东省韶关市附近的水稻田(24°33′37″ N, 113°31′0″ E), 所选取水稻田土壤有水淹, 种植方式为双季稻.在2018年7月对采样地进行深度1 m的柱状采集.柱状样品按每10 cm分层标记, (0~10) cm~(90~100) cm对应G1~G10.将土样品分为3部分:其中一部分用于确定N2O产生潜势和反硝化潜势, 将另一个部分冷冻(-80 ℃), 用于分子生物学实验; 最后一部分储存在4 ℃用于测量物理化学性质, 包括矿物氮(NH4+-N、NO3--N和NO2--N)、pH、总有机质(TOM)、TN、TC和含水率(鲍士旦, 2000).土壤样品用2 mol KCl按5:1(KCl:土壤样品)的比例振荡混合后浸提.用0.45 μm滤膜过滤并取上清液, 使用Tecan酶标仪(Infinite F50瑞士)测定三氮.按照1:5 (W/V)将土样与水混合, 使用pH分析仪(Mettler Toledo Delta 320瑞士)测定混悬浮液中悬浮合物.称取5 g新鲜土壤放置于105 ℃烘箱中, 烘至质量不变, 使用失水量来计算样品中的含水率, 然后将烘干土壤放置在550 ℃的马弗炉中5.5 h, 测量样品中的总有机质(TOM).风干的土样经研磨过筛后, 使用元素分析仪(Vario TOC)对总氮(TN)和总碳(TC)的含量进行测定.
2.2 活性测定采用乙炔抑制技术测定潜在的N2O产生潜势和反硝化潜势(Pell et al., 1996).称取8 g土壤样品置于100 mL血清瓶中, 用8 mL无菌蒸馏去离子水(ddH2O)润湿.然后在25 ℃, 180 r·min-1下孵育20 min去除土壤孔隙中的空气.然后通过抽换气装置抽空空气和填充氩气来保持无氧状态.每组样品制备6个平行的瓶子.其中3个用于测量N2O产生潜势, 在另外3个瓶子中加入乙炔(氧化亚氮还原酶的特异性抑制剂)以达到0.1大气分压, 用于测量反硝化潜势.随后, 用DEA溶液(最终浓度为3 mmol·L-1 KNO3、1.5 mmol·L-1 C4H4Na2O4、1 mmol·L-1 C6H12O6和3 mmol·L-1 CH3COONa)对每个样品的所有瓶子进行修正.将修正后样品放入25 ℃, 180 r·min-1的摇床中, 分别在0、0.5、1.5、3.5和6.5 h从各瓶顶部抽取20 mL气体样品导入labco瓶中, 使用气相色谱(安捷伦7890A)测定每个labco瓶中的N2O浓度.通过计算N2O的浓度变化趋势来计算N2O产生潜势和反硝化潜势.
2.3 DNA提取与定量PCR称取冷干土壤样品0.25 g, 使用Mobio试剂盒提取土壤样品中的DNA (PowerSoil? DNA Isolation Kit, 美国).使用NanoDrop 2000分光光度计检测提取的DNA纯度指数(A260/A280比值1.8~2.0).使用相应引物nosZ2F/nosZ2R (CGCRACGGCAAS AAGGTSMSSGT/CAKR-TGCAKSGCRTGGCAGAA), cd3aF/R3cd(GTSAACGTSAAGGARACSGG/GASTT CGGRTGS-GTCTTGA)和FlaCu/R3Cu (ATCATGGT SCTG-CCGCG/TTGGTGTTRGACTAGCTCCG)对nosZ、nirS和nirK功能基因进行qPCR扩增.使用SYBR Premix ExTaq TM试剂盒(TaKaRa, 大连, 中国)按照SYBR qPCR Mix(10 μL)、Primer-F(0.5 μL)、Primer-R(0.5 μL)、50×Rox (0.4 μL)、SBA(0.4 μL)、无菌水(6.2 μL)、DNA样品(2 μL)的体系.并由ABI 7500序列检测系统(应用生物系统, 加利福尼亚州, 美国)按照nosZ、nirS和nirK相应循环体系进行荧光定量PCR扩增反应(Henry et al., 2006; Throb?ck et al., 2004).样品反应设置3个平行.利用7500 SDS System配套软件进行分析计算, 通过标准曲线求得反硝化功能基因nosZ、nirS和nirK的丰度值.标准样品扩增效率介于94.2到98.4%, 标准曲线R2大于0.98.
2.4 高通量测序和处理利用PCR(聚合酶链式反应)从DNA提取物中扩增出nosZ、nirS和nirK功能基因, 按照Henry等(2006)和Throb?ck等(2004)中的方法扩增体系.使用Promega Agarose Gel DNA (Promega, Madison, WI)纯化试剂盒纯化PCR扩增产物, 再经NanoDrop 2000测定浓度.最后在Illumina MiSeq 2500平台上进行高通量测序(百迈客生物科技有限公司, 北京).测序得到的norZ、nirS和nirK序列经过质控处理后, 使用QIIME、Uchime、Mothur和Bioedit软件处理高通量序列, 将处理后序列上传至NCBI(National Center of Biotechnology Information)数据库中进行蛋白序列比对注释.
2.5 数据处理和分析方法本论文中主要利用Origin 9.0进行数据图表的绘制.利用R语言和Gephi软件进行物种或基因相互作用网络图的分析和绘制.用SPSS 21.0软件(Statistical Product and Service Solutions)进行相关性分析, 均采用Spearman相关性分析方法.利用CANOCO 4.5进行的相互作用关系的冗余性分析(Redundancy analysis, RDA)并制图.
3 结果(Results)3.1 稻田土壤垂向深度的环境因子韶关土壤样品中TN和TC数值分别为1.478~0.338 g·kg-1和20.85~2.14 g·kg-1, 最大值均在土壤0~10 cm范围上.TN和TC值随着深度增加而总体降低.韶关土壤样品氨氮(NH4+-N)最大值为5.924 mg·kg-1在0~10 cm范围上.样品硝态氮(NO3--N)的数值为8.23~29.36 mg·kg-1, 最高值为40~50 cm.韶关土壤样品中含水率(moisture)和总有机质(TOM)在0~10 cm区间上数值最大分别为51.8%和102.73 g·kg-1, 而10~100 cm范围上的数值变化不大.韶关土壤样品中的pH随深度的增加变化不大.
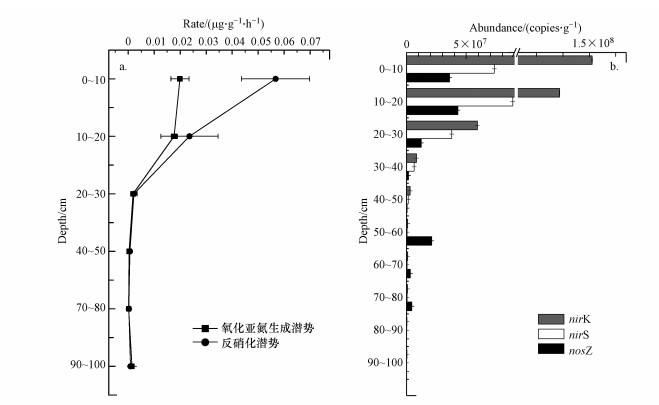
3.2 N2O产生潜势和反硝化潜势使用乙炔抑制法测得反硝化潜势和N2O产生潜势如图 1a所示, 在0~10 cm的区间上的反硝化潜势最高值是(0.057±0.013) μg·g-1·h-1, N2O产生潜势的最大值在0~10 cm范围时为(0.020±0.0035) μg·g-1·h-1.在垂向深度变化上反硝化潜势与N2O产生潜势的变化趋势是整体降低的, 0~20 cm区间上的反硝化潜势和N2O产生潜势比深层的高出1~2个数量级.通过Spearman相关性分析反硝化潜势与NO3- r=-0.640)呈显著负相关, 与TC和TN(r=0.818、r=0.818)呈显著正相关.N2O产生潜势与TN、TC(r=0.753、r=0.753)呈显著正相关.
图 1(Fig. 1)
 |
| 图 1 稻田土壤样品N2O产生潜势和反硝化潜势(a)及稻田土壤样品反硝化功能基因nosZ、nirS和nirK的丰度(b) Fig. 1Nitrogen oxide release rate and denitrification rate (a) and abundance of denitrifying functional genes nosZ, nirS and nirK in rice field soil samples (b)in rice field soil samples |
表 1(Table 1)
| 表 1 稻田土壤样品垂向各点理化性质 Table 1 Physical and chemical properties of paddy soil samples in vertical direction | |||||||||||||||||||||||||||||||||||||||||||||||||||||||||||||||||||||||||||||||||||||||||||||||||||
表 1 稻田土壤样品垂向各点理化性质 Table 1 Physical and chemical properties of paddy soil samples in vertical direction
| |||||||||||||||||||||||||||||||||||||||||||||||||||||||||||||||||||||||||||||||||||||||||||||||||||
表 2(Table 2)
| 表 2 稻田土壤样品反硝化潜势和N2O产生潜势与理化性质、细菌丰度和群落多样性的相关性分析 Table 2 Correlation analysis of denitrification potential and N2O production potential of paddy soil samples with physical and chemical properties, bacterial abundance and community diversity | ||||||||||||||||||||||||||||||||||||||||||||||||||||||||
表 2 稻田土壤样品反硝化潜势和N2O产生潜势与理化性质、细菌丰度和群落多样性的相关性分析 Table 2 Correlation analysis of denitrification potential and N2O production potential of paddy soil samples with physical and chemical properties, bacterial abundance and community diversity
| ||||||||||||||||||||||||||||||||||||||||||||||||||||||||
3.3 反硝化功能基因nosZ、nirS和nirK的丰度通过对稻田土壤样品qPCR得到图 1b各功能基因的丰度图, 其中样点反硝化功能基因nosZ的丰度值为(1.01±0.0011) ×105~(4.29±0.0015) ×107 copies·g-1, 反硝化功能基因nirS的丰度值为(2.00±0.0002)×105~(8.86±0.0010)×107 copies·g-1.反硝化功能基因nirK的丰度值(3.62±0.0013) ×105~(1.51±0.0015) ×108 copies·g-1.其中反硝化功能基因nosZ和nirS的丰度最高值在10~20 cm区间上分别为(4.29±0.0015) ×107 copies·g-1和(8.86±0.0010) ×107 copies·g-1.反硝化功能基因nirK的最大值为(1.51±0.0015) ×108在0~10 cm范围上.反硝化功能基因nosZ、nirS和nirK的丰度整体随着深度的增加而逐渐降低.在0~30 cm区间上反硝化功能基因nirS和nirK的丰度高于30~100 cm区间上1~3个数量级.而反硝化功能基因nosZ的丰度在0~30 cm范围上比30~50 cm和60~100 cm范围高出1~2个数量级, 但是在50~60 cm区间上反硝化功能基因nosZ的丰度与0~30 cm区间上相差不多.反硝化功能基因nosZ、nirS和nirK的丰度与N2O产生潜势(r=0.780、r = 0.732、r=0.837)呈显著正相关.反硝化功能基因nosZ、nirS和nirK的丰度与反硝化潜势(r=0.835、r=0.775、r=0.889)呈显著正相关.反硝化功能基因nosZ、nirS和nirK的丰度与TC和TN呈显著正相关.
3.4 NosZ、NirS和NirK型反硝化细菌的群落组成和微生物间相互作用通过定量结果选取G1 (0~10 cm)、G2 (10~20 cm)、G3 (20~30 cm)、G5 (40~50 cm)、G8 (70~80 cm)和G10 (90~100 cm)样点进行高通量分析.通过针对nosZ、nirS和nirK 3个功能基因在Illumina MiSeq PE250平台上进高通量测序, 并使用Qiime软件对高通量数据处理得到表 3中相应数据.nosZ型反硝化细菌的OTUs数值为219~1054, nirS型反硝化细菌的OTUs数值为1849~6030, nirK型反硝化细菌的OTUs数值为428~1983.覆盖度均在95%以上.随着序列数的增大, 样本中的OTUs数量增加趋势逐渐趋于平缓; 表明测序数据充足, 结果与覆盖率指数相符, 则说明本文用的高通量数据可用.
表 3(Table 3)
| 表 3 稻田土壤样品反硝化功能基因丰度与理化性质的相关性分析 Table 3 Correlation analysis between denitrification function gene abundance and physicochemical properties of paddy soil samples | ||||||||||||||||||||||||||||||||||||||||||||||||||
表 3 稻田土壤样品反硝化功能基因丰度与理化性质的相关性分析 Table 3 Correlation analysis between denitrification function gene abundance and physicochemical properties of paddy soil samples
| ||||||||||||||||||||||||||||||||||||||||||||||||||
α-多样性由mothur软件计算, 表 3中chao1指数代表着菌群的丰富度, shannon指数代表着菌群的多样性.nosZ型反硝化细菌的chao1指数最大在G8点为1176.06, shannon指数最大在G2点为4.90.nirS型反硝化细菌的chao1指数和shannon指数最大值分别为8337.07和6.91位于在G3点.nirK型反硝化细菌的chao1指数和shannon指数最大值分别为2467.65和5.66处于G2点.通过对比3个功能基因的chao1指数和shannon指数发现, nirS型反硝化的丰富度和多样性整体高于nosZ和nirK, nirS和nirK型反硝化细菌的chao1和shannon指数表层和亚表层(G1、G2、G3)总体高于深层(G5、G8、G10).
表 4(Table 4)
| 表 4 稻田土壤样品高通量测序样品描述和α-多样性指数 Table 4 High-throughput sequencing sample description and alpha-diversity index of paddy soil samples | |||||||||||||||||||||||||||||||||||||||||||||||||||||||||||||||||||||||||||||||||||||||||||||||||||||||||||
表 4 稻田土壤样品高通量测序样品描述和α-多样性指数 Table 4 High-throughput sequencing sample description and alpha-diversity index of paddy soil samples
| |||||||||||||||||||||||||||||||||||||||||||||||||||||||||||||||||||||||||||||||||||||||||||||||||||||||||||
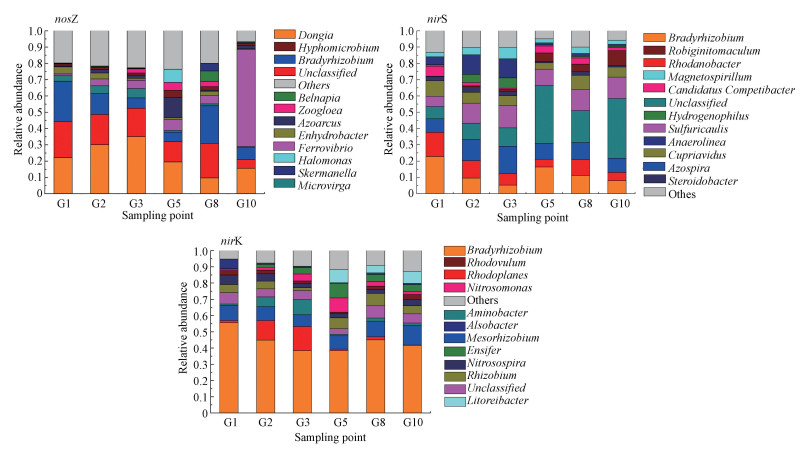
通过序列比对分析做出相应反硝化功能基因的相对丰度图, 如图 2所示.按门水平划分各样点中nosZ、nirS和nirK型反硝化细菌以变形菌门(Proteobacteria)占据着主导地位.按属水平分类; nosZ型反硝化细菌在G1和G8样点中慢生根瘤菌(Bradyrhizobium)占比最高分别为24.65%和23.03%, G2、G3和G5样点中Dongia菌属占比最高分别达到30.09%、35.05%和19.54%.G10样点中Ferrovibrio菌属占比最高为59.54%.当深度的增加慢生根瘤菌(Bradyrhizobium)在样点的占比率整体降低, 而Ferrovibrio菌属的占比率却逐渐增加.nirS型反硝化细菌在G1样点中慢生根瘤菌(Bradyrhizobium)占比最高为22.81%, G2和G3样点中固氮螺菌属(Azospira)占比最高分别达到13.04%、16.82%, 而在深层G5、G8和G10样点中未分类菌属(unclassified)占比最高分别为35.75%、19.63%和36.68%.随着深度的增加未分类菌属(unclassified)的占比率也整体随之增加.同时罗河杆菌属(Rhodanobacter)的占比率整体降低.nirK型反硝化细菌在垂向各样点均是慢生根瘤菌(Bradyrhizobium)占比最高(55.64%、44.88%、38.41%、38.36%、45.05%、41.77%).nirK型反硝化细菌中的慢生根瘤菌(Bradyrhizobium)、中慢生根瘤菌属(Mesorhizobium)、红游动菌属(Rhodoplanes)等属于根瘤菌目(Rhizobiales).
图 2(Fig. 2)
 |
| 图 2 稻田土壤样品nosZ、nirS和nirK型反硝化细菌的相对丰度 Fig. 2Relative abundance of nosZ nirS and nirK denitrifying bacteria in paddy soil samples |
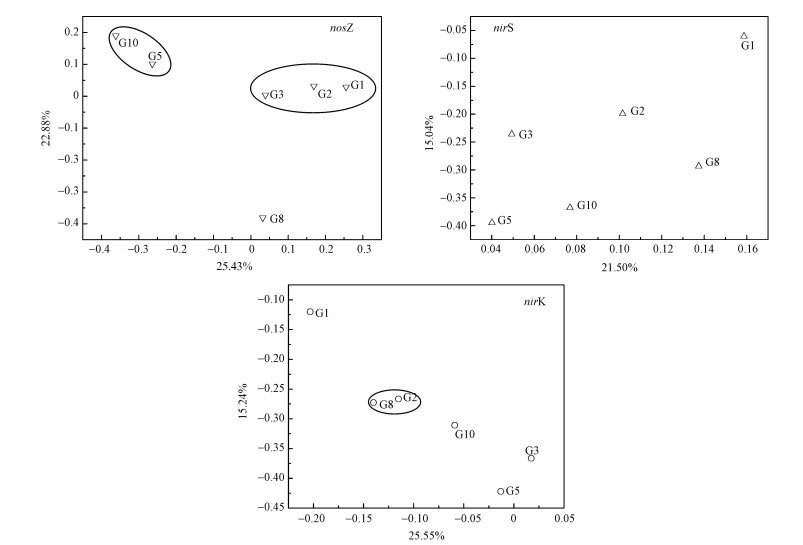
在OTUs水平计算稻田垂向土壤样品的Bray-Curtis差异度矩阵, 利用Qiime软件做主坐标轴图 3(Principal Coordinate Axis Analysis, PCoA).两轴总的解释度为48.31%、36.9%和40.79%的nosZ、nirS和nirK型反硝化细菌, 解释数值较低.表明样本之间的遗传亲缘度不高, nosZ、nirS和nirK型反硝化细菌群落依然显示出较大差异, 这说明深度并不是影响稻田垂向nosZ、nirS和nirK型反硝化细菌群落结构的重要因素.通过图中结果发现, nosZ型反硝化细菌在G1、G2和G3样点中聚在一起, G5和G10聚在一起.nirS型反硝化细菌在各点分散度较高, 而nirK型反硝化细菌G2和G8聚集一起, nirK和nirS型反硝化细菌G1点与其它样点分离程度较高.以上结果表明在G1~G3和G5、G10上nosZ型反硝化细菌分别具有相似的菌群结构, nirS型反硝化细菌的菌群结构在各点都有所不同, nirK型反硝化细菌在G2和G8有着相似的菌群结构.表层土壤影响了nirS和nirK型反硝化细菌菌群结构.
图 3(Fig. 3)
 |
| 图 3 稻田土壤样品nosZ、nirS和nirK型反硝化细菌的Pcoa图 Fig. 3Pcoa diagram of nosZ、nirS and nirK denitrifying bacteria in paddy soil samples |
利用Gephi软件绘制nirS与nirK型反硝化细菌网络分析图.如图 4所示, 按Modularity class分类共形成了4个模块, 分别为Module 1 (35.19%)、Module 2 (25.44%)、Module 3 (21.6%)、Module 4 (17.77%).图中有287个节点, 9102条边.模块中连接最紧密的节点被定义为hub.在微生物网络中关系紧密的一组微生物一般具有相同的生物学分类, 并划分至同一模块.同一个模块的物种通常有着相似的生态位.这些模块的hub分别是慢生根瘤菌(Bradyrhizobium)、未分类菌属(unclassified)、Litoreibacter菌属、Cupriavidus菌属和Sulfuricaulis菌属的连接度为99.图中红线(65.1%)代表正相关关系, 绿线(34.9%)代表负相关关系.
图 4(Fig. 4)
 |
| 图 4 稻田土壤样品nirS与nirK型反硝化细菌分子生态网络分析 Fig. 4Molecular ecological network analysis of nirS and nirK denitrifying bacteria in paddy soil samples |
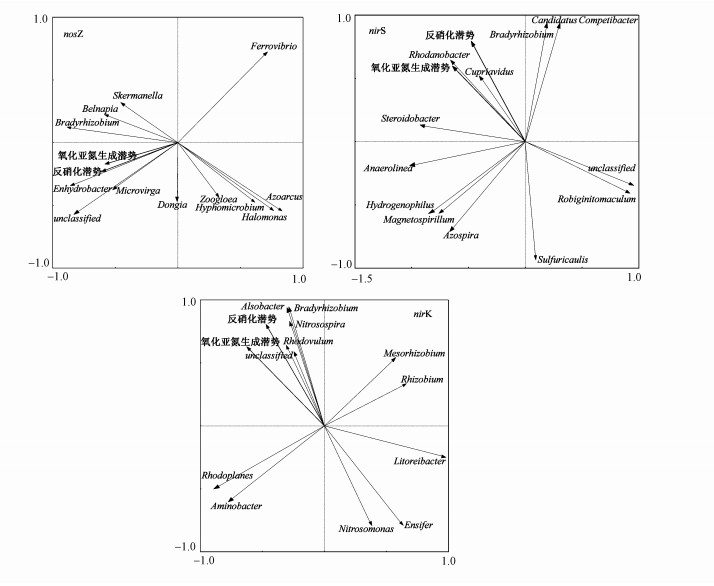
3.5 N2O产生潜势和反硝化潜势与nosZ、nirS和nirK型反硝化细菌的菌群结构相关性分析通过稻田垂向各层中反硝化细菌的nosZ、nirS和nirK功能基因的相对丰度与反硝化潜势和N2O产生潜势进行RDA分析, 通过图 5可以观察到nosZ型反硝化细菌中Enhydrobacter、Microvirga和unclassified菌属与反硝化潜势和N2O产生潜势具有正相关性, 而Ferrovibrio菌属与反硝化潜势和N2O产生潜势具有负相关性.nirS型反硝化细菌中Rhodanobacter和Cupriavidus菌属与反硝化潜势和N2O产生潜势具有正相关性, Robiginitomaculum菌属与反硝化潜势和N2O产生潜势具有负相关性.反硝化潜势和N2O产生潜势与nirK型反硝化细菌中Bradyrhizobium、Nitrosospira、Alsobacter和Rhodovulum菌属具有正相关性, 而与Nitrosomonas和Ensifer菌属具有负相关性.再通过使用SPSS软件对各基因的相对丰度与反硝化潜势和N2O产生潜势进行Spearman相关性分析得到反硝化潜势与Enhydrobacter和Microvirga菌属(r=0.859、r=0.574)具有显著正相关性, 而与Nitrosospira和Rhodanobacter菌属(r=0.756、r=0.599)具有显著正相关性.N2O产生潜势与Enhydrobacter和Microvirga菌属(r=0.884、r=0.512)具有显著正相关性.与而Nitrosospira和Rhodanobacter菌属(r=0.741、r=0.694)具有显著正相关性.
图 5(Fig. 5)
 |
| 图 5 稻田土壤样品反硝化细菌的RDA图 Fig. 5RDA map of denitrifying bacteria in paddy soil sample |
表 5(Table 5)
| 表 5 稻田土壤样品反硝化细菌与N2O产生潜势和反硝化潜势相关性分析 Table 5 Correlation analysis between denitrifying bacteria and nitrous oxide release rate and denitrification rate in paddy soil samples | ||||||||||||||||||||||||
表 5 稻田土壤样品反硝化细菌与N2O产生潜势和反硝化潜势相关性分析 Table 5 Correlation analysis between denitrifying bacteria and nitrous oxide release rate and denitrification rate in paddy soil samples
| ||||||||||||||||||||||||
4 讨论(Discussion)通过本文研究发现在稻田土壤随着垂向深度的增加N2O产生潜势和反硝化细菌丰度降低, 以往的研究也发现随着稻田土壤深度增加反硝化潜势、反硝化功能基因丰度和氧化亚氮释放也逐渐降低(刘平丽等2011; Zhu et al., 2011; Zhou et al., 2016;Wang et al., 2017).
4.1 环境因子、反硝化功能基因和菌群结构对稻田土壤N2O产生潜势垂向分布的影响环境因子的变化是影响N2O释放的重要因素之一.本研究通过对环境因子与N2O产生潜势和反硝化潜势进行的相关性分析发现, 随着稻田土壤垂向深度增加, TN和TC与N2O产生潜势和反硝化潜势具有显著正相关性.以往的研究也表明TN和TC影响了N2O的释放(S?vik et al., 2007; Liu et al., 2018).氮源和碳源作为异养反硝化细菌中营养物质, 有助于反硝化细菌的生长从而加强反硝化细菌中nirS和nirK的功能.土壤中C/N比也会影响氮素的转化过程, 从而影响N2O的排放(朱永官等, 2014).许多研究发现N2O释放程度取决于土壤含水量(Friedl et al., 2016; Hall et al., 2018).通过本研究结果发现N2O产生潜势与含水率为正相关, 同时在0~10 cm区间上含水率和N2O产生潜势数值最高.研究表明含水率对N2O产生有显著正相关性(Liu et al., 2018), 而通过水膜可以加快供应微生物所需的基质(Davidson et al., 1995).
反硝化细菌中的nirS和nirK功能基因对N2O释放具有着重要作用, 而反硝化细菌中nosZ功能基因具有还原N2O的功能.有研究认为N2O产量主要的影响因子是理化性质, 而不是功能群落的丰度或结构(Liu et al., 2013; Liu et al., 2018).同时也有研究发现反硝化细菌丰度对N2O释放存在影响(Zhao et al., 2019).通过Spearman相关性分析发现nosZ、nirS和nirK型反硝化细菌的多样性与N2O产生潜势未存在显著相关性, 而反硝化功能基因(nosZ、nirS和nirK)的丰度变化与N2O产生潜势两者具有显著正相关性.同时反硝化(nosZ、nirS和nirK)的丰度与环境因子(TN和TC)具有显著相关性.随着深度的增加N2O产生潜势与反硝化功能基因丰度nosZ、nirS和nirK都在逐渐降低.此外反硝化功能基因nirK的丰度与反硝化潜势也存在显著正相关性.通过本研究对环境因子、反硝化细菌丰度和N2O产生潜势之间的关系, 可以猜想其原因很可能是稻田土壤中环境因子和反硝化功能基因的丰度影响了N2O产生潜势的垂向分布.
反硝化细菌的相对丰度结果显示, 表层中nosZ、nirS和nirK型反硝化细菌中慢生根瘤菌(Bradyrhizobium)占比最高.nirK型反硝化细菌中慢生根瘤菌(Bradyrhizobium)在各层占比最多, 基于nirS与nirK型反硝化细菌的Network图可知, 连接最为紧密的菌属是慢生根瘤菌(Bradyrhizobium), 表明了其在稻田土壤反硝化过程中起到了重要作用.有研究表明慢生根瘤菌(Bradyrhizobium)在一定程度上促进了农田土壤的反硝化作用(Asakawa, 1993).而RDA结果表明nirK型反硝化细菌中慢生根瘤菌(Bradyrhizobium)与氧化亚氮产生潜势具有相关性, 此外慢生根瘤菌(Bradyrhizobium)具有增强N2O释放的能力(Obando et al., 2019).因此慢生根瘤菌(Bradyrhizobium)在稻田土壤中对N2O释放存在贡献率.罗河杆菌属(Rhodanobacter)是一种能在低pH值时进行反硝化的菌属(Van Den Heuvel et al., 2010), 而在本研究稻田土壤垂向深度增加中nirS型反硝化细菌的罗河杆菌属(Rhodanobacter)与N2O产生潜势有显著正相关性.亚硝化螺菌属(Nitrosospira)土壤中主要以AOB存在, 同时也有一部分属于反硝化细菌, 亚硝化螺菌属的优势地位与土壤pH值等具体条件有关.与此同时AOB和nirK型反硝化细菌是N2O排放的主要贡献者(Shi et al., 2019; Lourenco Késia et al., 2018).通过实验结果发现在稻田土壤垂向深度发生变化时nirK型反硝化细菌中的亚硝化螺菌属(Nitrosospira)与N2O产生潜势有显著正相关性.在稻田土壤中nirK型反硝化细菌中发现了亚硝化螺菌属(Nitrosospira)对N2O的释放具有贡献率.
4.2 稻田土壤nosZ、nirS和nirK型反硝化细菌丰度和菌群结构的垂向分布通过对各功能基因丰度变化观察发现, 反硝化功能基因nirK的丰度高于反硝化功能基因nirS的丰度, 此前有研究发现稻田土壤中反硝化功能基因nirK的丰度高于反硝化功能基因nirS的丰度(Yoshida et al., 2009).其它研究发现旱地中反硝化功能基因nirS的丰度高于反硝化功能基因nirK的丰度(zhao et al., 2019; Yin et al., 2015).Szukics等(2009)研究发现土壤中的水分对反硝化功能基因nirK的丰度存在影响, 土壤含水量的增加促进了亚硝酸盐还原酶(nirK)的生长(Wang et al., 2017).本次实验样品为7月稻田土壤, 而稻田土壤中的含水率普遍高于旱地土壤, 这也可能是稻田土壤中nirK的丰度高于nirS的丰度原因.在稻田土壤垂向深度的变化下明显发现随着深度的增加反硝化功能基因nosZ、nirS和nirK的丰度总体降低, 此前Liu等(2015)也有研究发现反硝化功能基因nirS和nirK的丰度也随着深度增加而降低.有研究表明深度增加降低了生物量(Fritze et al., 2000).因此, 当深度增加可能对反硝化细菌丰度有着一定的影响.通过β-多样性进行绘制Pcoa图, 垂向深度差异对nosZ、nirS和nirK型反硝化细菌的菌群结构有着不同的影响.造成此结果可能是环境温度、含水率、溶解氧等因素在稻田垂向深度的变化对nosZ、nirS和nirK型反硝化细菌的菌群结构在垂向上的分布造成了的潜在影响.
5 结论(Conclusions)1) 稻田土壤随着垂向深度的增加N2O产生潜势降低, N2O产生潜势受到土壤理化因素(TN、TC)、以及nosZ、nirS和nirK型反硝化细菌影响.nirS型反硝化细菌中的罗河杆菌属(Rhodanobacter)、nirK型反硝化细菌中的亚硝化螺菌属(Nitrosospira)和慢生根瘤菌(Bradyrhizobium)对N2O产生潜势具有较大贡献.
2) 在稻田土壤中反硝化功能基因nirK的丰度高于nirS的丰度.反硝化功能基因的丰度随稻田土壤深度的增加而降低.
参考文献
| Asakawa S. 1993. Denitrifying ability of indigenous strains of Bradyrhizobium japonicum isolated from fields under paddy-upland rotation[J]. Biology and Fertility of Soils, 15(3): 196-200. DOI:10.1007/BF00361611 |
| 鲍士旦. 2000. 土壤农化分析(第3版)[M]. 北京: 中国农业出版社. |
| Braker G, Zhou J, Wu L., et al. 2000. Nitrite reductase genes (nirK and nirS), as functional markers to investigate diversity of denitrifying bacteria in Pacific northwest marine sediment communities[J]. Applied and Environmental Microbiology, 66(5): 2096-2104. DOI:10.1128/AEM.66.5.2096-2104.2000 |
| Butterbachbahl K, Baggs E M, Dannenmann M, et al. 2013. Nitrous oxide emissions from soils:how well do we understand the processes and their controls[J]. Philosophical Transactions of the Royal Society B:Biological Sciences, 368(1621): 0122. |
| Davidson E A. 2009. The contribution of manure and fertilizer nitrogen to atmospheric nitrous oxide since 1860[J]. Nature Geoscience, 2: 659-662. DOI:10.1038/ngeo608 |
| de Klein C A M, Sherlock R R, Cameron K C, et al. 2001. Nitrous oxide emissions from agricultural soils in New Zealand-a review of current knowledge and directions for future research[J]. Journal of the Royal Society of New Zeland, 31: 543-574. DOI:10.1080/03014223.2001.9517667 |
| Friedl J, Scheer C, Rowlings D W, et al. 2016. Denitrification losses from an intensively managed sub-tropical pasture impact of soil moisture on the partitioning of N2 and N2O emissions[J]. Soil Biology and Biochemistry, 92: 58-66. DOI:10.1016/j.soilbio.2015.09.016 |
| Fritze H, Pietik?inen J, Pennanen T. 2000. Distribution of microbial biomass and phospholipid fatty acids in Podzol profiles under coniferous forest[J]. European Journal of Soil Science, 51: 565-573. DOI:10.1111/j.1365-2389.2000.00346.x |
| Hall S J, Reyes L, Huang W, et al. 2018. Wet spots as hotspots:Moisture responses of nitric and nitrous oxide emissions from poorly drained agricultural soils[J]. Journal of Geophysical Research:Biogeosciences, 123(12): 3589-3602. DOI:10.1029/2018JG004629 |
| Hayatsu M, Tago K, Saito M. 2008. Various players in the nitrogen cycle:Diversity and functions of the microorganisms involved in nitrification and denitrification[J]. Soil Science and Plant Nutrition, 54: 33-45. DOI:10.1111/j.1747-0765.2007.00195.x |
| He L, Shan J, Zhao X, et al. 2019. Variable responses of nitrification and denitrification in a paddy soil to long-term biochar amendment and short-term biochar addition[J]. Chemosphere, 234: 558-567. DOI:10.1016/j.chemosphere.2019.06.038 |
| Henry S, Bru D, Stres B, et al. 2006. Quantitative detection of the nosZ gene, encoding nitrous oxide reductase, and comparison of the abundances of 16S rRNA, narG, nirK, and nosZ genes in soils[J]. Applied and Environmental Microbiology, 72(8): 5181-5189. DOI:10.1128/AEM.00231-06 |
| Hoeren F U, Berks B C, Ferguson S J, et al. 1993. Sequence and expression of the gene encoding the respiratory nitrous-oxide reductase from Paracoccus denitrificans[J]. European Journal of Biochemistry, 218(1): 49-57. |
| IPCC. 2013. The physical science basis. Contribution of Working Group I to the fifth assessment report of the Intergovernmental Panel on Climate Change[M]. Cambridge University Press, Cambridge and New York |
| Lashof D A, Ahuja D R. 1990. Relative contributions of greenhouse gas emissions to global warming[J]. Nature, 344(6266): 529-531. DOI:10.1038/344529a0 |
| 刘平丽, 张啸林, 熊正琴, 等. 2011. 不同水旱轮作体系稻田土壤剖面N2O的分布特征[J]. 应用生态学报, 22(9): 2363-2369. |
| Liu W, Yao L, Jiang X, et al. 2018. Sediment denitrification in Yangtze lakes is mainly influenced by environmental conditions but not biological communities[J]. Science of the Total Environment, 616: 978-987. |
| Liu X, Chen C R, Wang W J, et al. 2013. Soil environmental factors rather than denitrification gene abundance control N2O fluxes in a wet sclerophyll forest with different burning frequency[J]. Soil Biology and Biochemistry, 57: 292-300. DOI:10.1016/j.soilbio.2012.10.009 |
| Liu X, Chen C, Wang W, et al. 2015. Vertical distribution of soil denitrifying communities in a wet sclerophyll forest under long-term repeated burning[J]. Microbial Ecology, 70(4): 993-1003. DOI:10.1007/s00248-015-0639-y |
| Liu Y, Shen K, Wu Y, et al. 2018. Abundance and structure composition of nirK and nosZ genes as well as denitrifying activity in heavy metal-polluted paddy soils[J]. Geomicrobiology Journal, 35(2): 100-107. DOI:10.1080/01490451.2017.1333175 |
| Louren?o K S, Cassman N A, Pijl A S, et al. 2018. Nitrosospira sp. govern nitrous oxide emissions in a tropical soil amended with residues of bioenergy crop[J]. Frontiers in microbiology, 9: 674. DOI:10.3389/fmicb.2018.00674 |
| Obando M, Correa-Galeote D, Castellano-Hinojosa A, et al. 2019. Analysis of the denitrification pathway and greenhouse gases emissions in Bradyrhizobium sp. strains used as biofertilizers in South America[J]. Journal of Applied Microbiology, 127: 739-749. DOI:10.1111/jam.14233 |
| Pathak H. 1999. Emissions of nitrous oxide from soil[J]. Current Science, 77: 359-369. |
| Pell M, Stenberg B, Stenstr?m J, et al. 1996. Potential denitrification activity assay in soil-with or without chloramphenicol[J]. Soil Biology and Biochemistry, 28: 393-398. DOI:10.1016/0038-0717(95)00149-2 |
| Philippot L, Hallin S, Schloter M. 2007. Ecology of denitrifying prokaryotes in agricultural soils[J]. Advances in Agronomy, 96: 249-305. DOI:10.1016/S0065-2113(07)96003-4 |
| Shi Y, Liu X, Zhang Q. 2019. Effects of combined biochar and organic fertilizer on nitrous oxide fluxes and the related nitrifier and denitrifier communities in a saline-alkali soil[J]. Science of the Total Environment, 686: 199-211. DOI:10.1016/j.scitotenv.2019.05.394 |
| S?vik A K, Kl?ve B. 2007. Emission of N2O and CH4 from a constructed wetland in southeastern Norway[J]. Science of the Total Environment, 380(1/3): 28-37. |
| Szukics U, Hackl E, Zechmeister-Boltenstern S, et al. 2009. Contrasting response of two forest soils to nitrogen input:rapidly altered NO and N2O emissions and nirK abundance[J]. Biology and Fertility of Soils, 45(8): 855-863. DOI:10.1007/s00374-009-0396-5 |
| Throb?ck I N, Enwall K, Jarvis ?, et al. 2004. Reassessing PCR primers targeting nirS, nirK and nosZ genes for community surveys of denitrifying bacteria with DGGE[J]. FEMS Microbiology Ecology, 49(3): 401-417. DOI:10.1016/j.femsec.2004.04.011 |
| Van Den Heuvel R N, Van Der Biezen E, Jetten M S M, et al. 2010. Denitrification at pH 4 by a soil-derived Rhodanobacter-dominated community[J]. Environmental Microbiology, 12(12): 3264-3271. DOI:10.1111/j.1462-2920.2010.02301.x |
| Wang H, Li X, Li X, et al. 2017. Changes of microbial population and N-cycling function genes with depth in three Chinese paddy soils[J]. PloS One, 12(12): e0189506. DOI:10.1371/journal.pone.0189506 |
| Wang Q, Liu Y R, Zhang C J, et al. 2017. Responses of soil nitrous oxide production and abundances and composition of associated microbial communities to nitrogen and water amendment[J]. Biology and Fertility of Soils, 53(6): 601-611. DOI:10.1007/s00374-017-1203-3 |
| Wrage N, Velthof G L, van Beusichem M L., et al. 2001. Role of nitrifier denitrification in the production of nitrous oxide[J]. Soil Biology and Biochemistry, 33: 1723-1732. DOI:10.1016/S0038-0717(01)00096-7 |
| Wu X, Liu H, Fu B, et al. 2017. Effects of land-use change and fertilization on N2O and NO fluxes, the abundance of nitrifying and denitrifying microbial communities in a hilly red soil region of southern China[J]. Applied Soil Ecology, 120: 111-120. DOI:10.1016/j.apsoil.2017.08.004 |
| Yang Y D, Hu Y G, Wang Z M, et al. 2018. Variations of the nirS, nirK, and nosZ-denitrifying bacterial communities in a northern Chinese soil as affected by different long-term irrigation regimes[J]. Environmental Science and Pollution Research, 25(14): 14057-14067. DOI:10.1007/s11356-018-1548-7 |
| Yin C, Fan F L, Song A L, et al. 2015. Denitrification potential under different fertilization regimes is closely coupled with changes in the denitrifying communities in a black soil[J]. Applied Microbiology and Biotechnology, 99(13): 5719-5729. DOI:10.1007/s00253-015-6461-0 |
| Yoshida M, Ishii S, Otsuka S, et al. 2009. Temporal shifts in diversity and quantity of nirS and nirK in a rice paddy field soil[J]. Soil Biology and Biochemistry, 41(10): 2044-2051. DOI:10.1016/j.soilbio.2009.07.012 |
| Zhao S, Zhou J, Yuan D, et al. 2019. NirS-type N2O-producers and nosZ Ⅱ-type N2O-reducers determine the N2O emission potential in farmland rhizosphere soils[J]. Journal of Soils and Sediments, https: //xs.scihub.ltd/https: //doi.org/10.1007/s11368-019-02395-3 |
| Zhou W, Xia L, Yan X. 2017. Vertical distribution of denitrification end-products in paddy soils[J]. Science of the Total Environment, 576: 462-471. DOI:10.1016/j.scitotenv.2016.10.135 |
| Zhu G, Wang S, Wang Y, et al. 2011. Anaerobic ammonia oxidation in a fertilized paddy soil[J]. The ISME Journal, 5(12): 1905. DOI:10.1038/ismej.2011.63 |
| 朱永官, 王晓辉, 杨小茹, 等. 2014. 农田土壤N2O产生的关键微生物过程及减排措施[J]. 环境科学, 1(2): 792-800. |
| Zumft W G. 1997. Cell biology and molecular basis of denitrification[J]. Microbiology and Molecular Biology Reviews, 61(4): 533-616. DOI:10.1128/.61.4.533-616.1997 |
