全文HTML
--> --> --> 自我国2013年《实行最严格水资源管理制度考核办法》以来,各地政府积极响应“三条红线”、“四项制度”,河湖长制下的水环境治理已初见成效[1]。然而,广大农村地区污染来源复杂,分布广泛,其治理难以有针对性[2-3]。在点源污染得到逐步削减管控的同时,非点源污染的管控治理问题显得尤为重要[4]。因此,量化分散型污染的分布特征对于未来水环境污染管控治理具有重要意义。目前,国内外对于水环境污染的量化手段主要分为野外监测法、排放系数法和水文水质模型法[5]。野外实地监测法劳动强度大、周期长、费用高,往往由于数据资料缺乏或可靠性差等原因,影响污染负荷的估算精度。输出系数法主要基于土地利用数据和社会经济统计数据进行负荷估算,在监测数据稀缺的地区具有一定优势[6]。李淼泉等[7]构建了流域非点源水污染排放清单估算系统,对全年及年内各分水期非点源水污染排放进行了估算。谭铭欣等[8]综合监测数据和统计数据,利用排放系数法估算了御河流域水污染负荷。近年来,水文水质模型发展迅速,包括SWAT、HSPF、SWMM模型等[9-10],能够综合水文过程、土壤侵蚀以及污染源输移过程模块从而全面真实地实现流域污染源的模拟与计算[11-12]。康峤[13]采用WASP-HSPF耦合模型模拟了第二松花江松林断面BOD5及氨氮浓度。姚焕玫等[14]基于SWMM模型构建了南宁市区地表径流及非点源污染精细化雨水径流模型。尽管以往研究很好地量化了点源和非点源污染,但考虑到经济成本和实施难度[15-16],对整个流域防控整治并不实际。在实际污染管控中,现有研究成果仍难以被应用于制定具有针对性的防治措施[17-18]。因此,未来应在污染负荷量化的基础上,识别其污染控制的关键源区并作为重点区域进行管控,从而提高流域污染管控效率[19]。
义乌江流域内存在大量农村生活污水和农业、畜禽养殖场为主的污染源,水环境污染管控已成为该流域水环境治理的重中之重,急切需要流域尺度的管控措施[20-21]。本研究应用SWAT模型对义乌江流域进行水环境污染模拟,量化了流域内水环境污染负荷,并鉴别污染关键源区,可为后续流域治理与水环境污染防控提供参考。
1.1. 研究区域
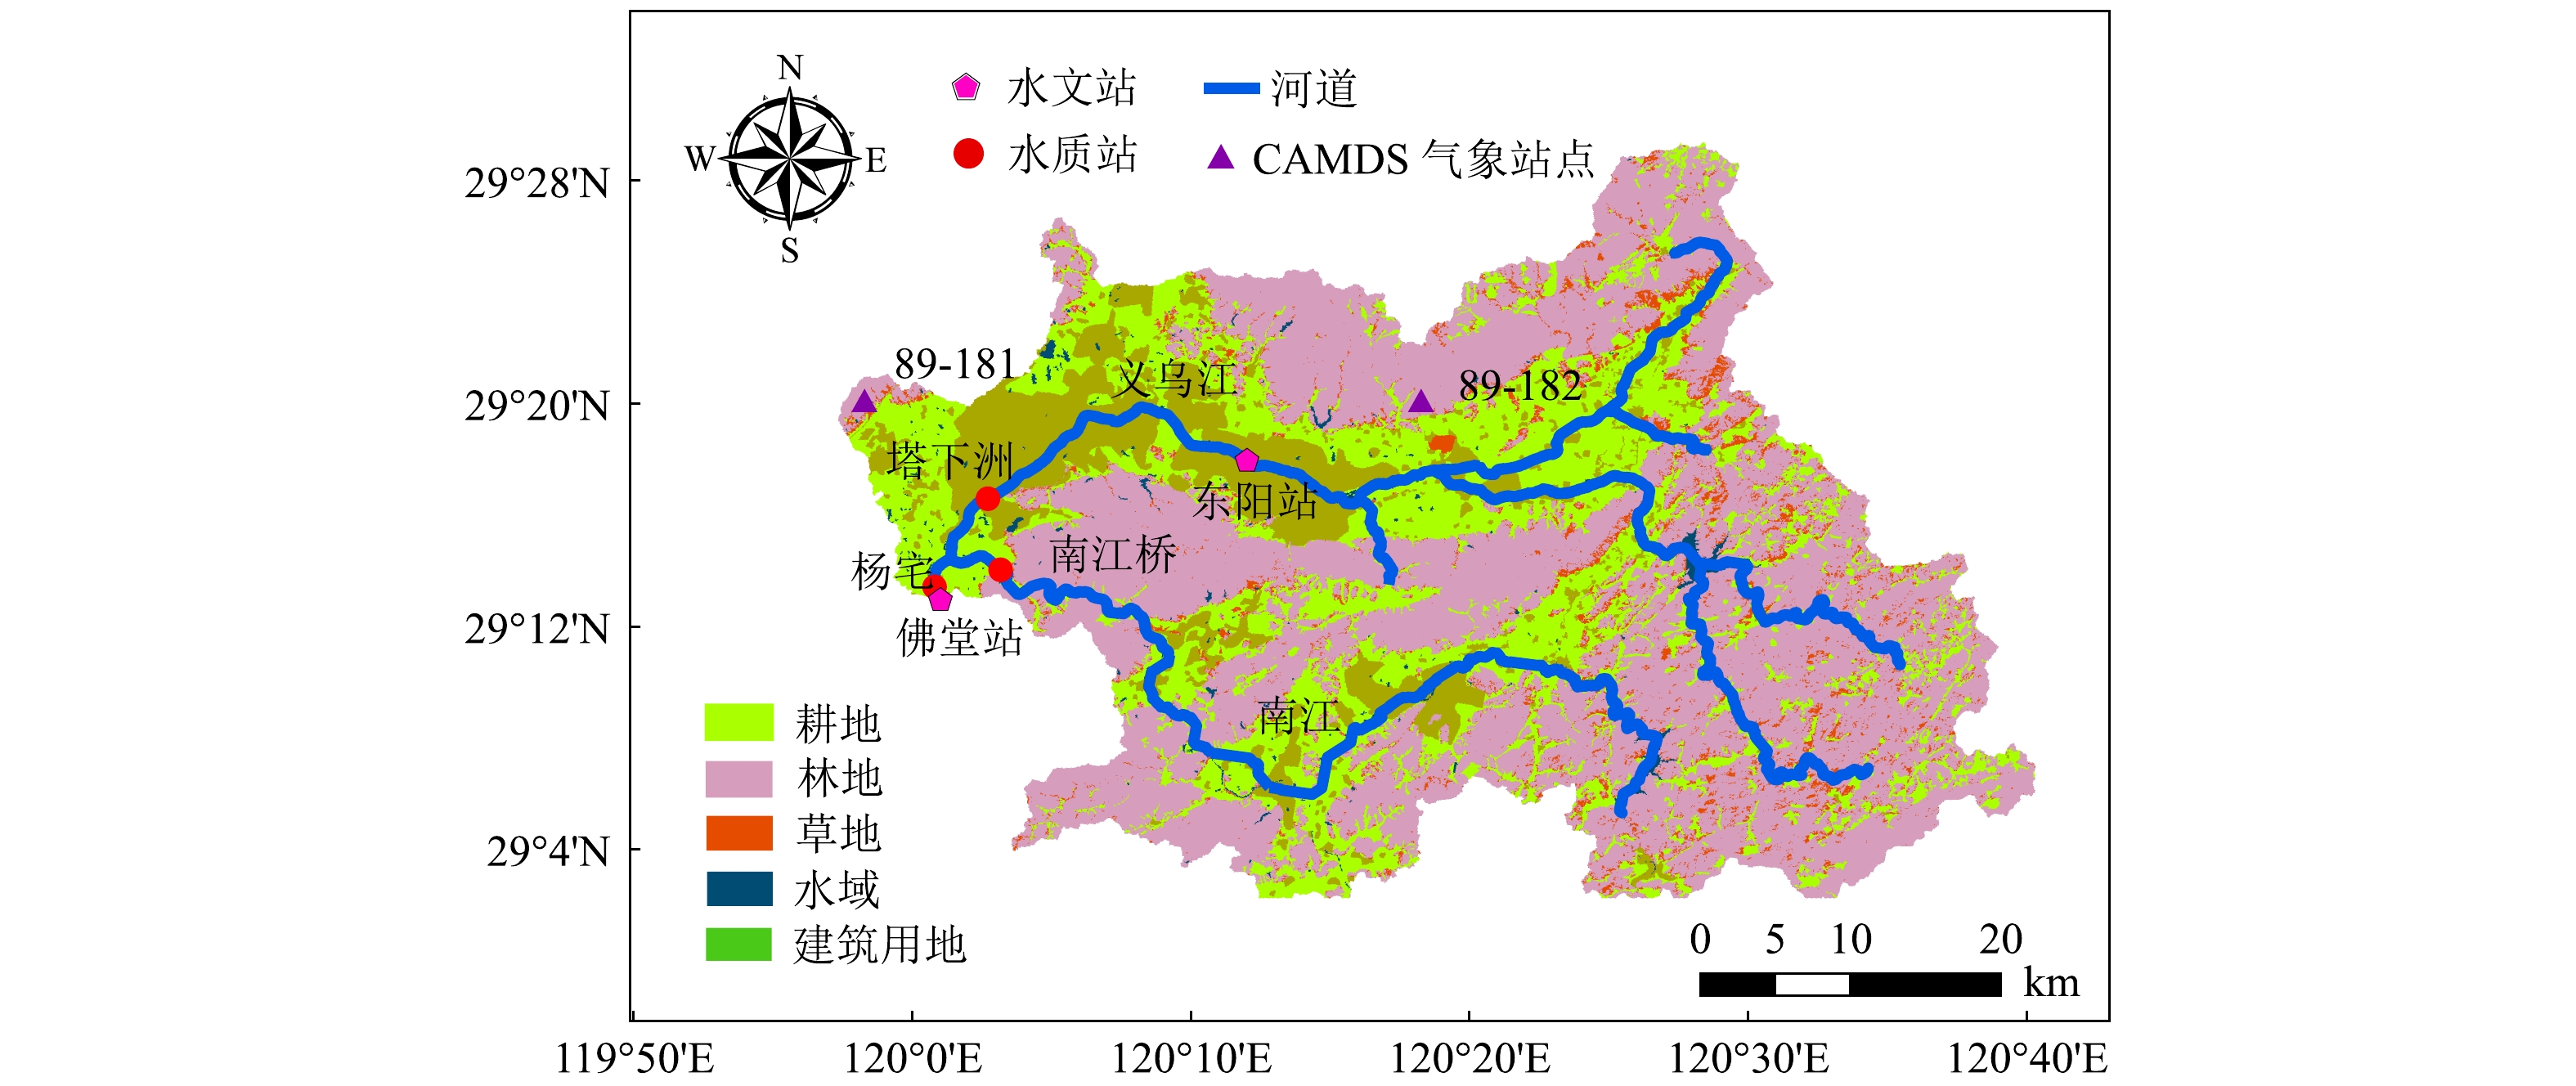
义乌江流域位于浙江省中部,流域流经义乌市、东阳市、永康市和磐安县,总人口约为76.7万,其中农业人口约为54.3万。该流域的主干流为义乌江,南江为其主要支流(见图1),流域面积为2 050.47 km2。流域内土地利用类型以耕地和林地为主,占流域总面积的70%,其次是居住用地、水域和水田。长期种植的经济作物主要为水稻、玉米、大豆和棉花。土壤类型主要为疏松岩性土(Regosols)和雏形土(Cambisols),质地相对疏松。义乌江流域污染源以非点源为主,其中119个村落氮磷排放超标[22]。2013—2016年各水质监测断面数据显示,塔下洲、杨宅断面水质以多为劣Ⅴ类,总氮和总磷浓度高达8 mg·L?1和0.25 mg·L?1,流域水环境问题日益严重。1.2. 模型与方法
本研究采用的水土评价模型(Soil Water and Assessment Tools,SWAT)是美国农业部(USDA)开发的一款半分布式流域水文模型[23],模型内嵌土壤侵蚀模块和污染物迁移转化模块,能在模拟水量的基础上模拟流域输沙量和水体中污染物的迁移转化过程[24-25]。由于其高效的计算能力、完整的模型结构以及参数改进性能,因而广泛应用于流域水文和污染负荷模拟[26]。1.2.1. 模型输入数据
模型需要的输入数据包括地形(DEM)、土地利用、土壤、气象以及污染源数据。其中,地形和土地利用数据均来自地理空间数据云,精度为30 m;土壤数据来自中国土壤数据库提供的1∶1 000 000土壤数据,并采用世界土壤数据库(Harmonized World Soil Database,HWSD)FAO90标准进行分类[27]。利用地形、土地利用以及土壤数据对流域进行概化,最终将义乌江流域划分了18个子流域和319个水文响应单元(见图2)。流域内气象数据采用中国大气同化驱动数据集(The China Meteorological Assimilation Driving Datasets for the SWAT model,CMADS)提供的高精度气象插值数据,共包含2个CMADS气象站点,时间范围为2010—2017年。用于率定验证的水文站、水质站数据来源于水文年鉴和环境监测总站。污染源数据来源于浙江省经济发展年鉴,包含了该流域2014—2017年的主要污染来源(生活污染、畜禽养殖污染与农业污染)。各类污染源多年平均排放量如表1所示。本研究涉及的义乌江流域农村人口占73%。在2016年以前,该流域农村和部分城镇地区尚无完备的污水处理系统。因此,这些年生活污染、农业畜禽养殖污染均未经过截污纳管,而是直接通过沿程衰减的面源形式汇入河道中,其对河道水质的贡献不容忽视。
1.2.2. 模型参数选取
本研究先将2010—2017年东阳站(子流域编号6)和佛堂站(子流域编号13)的月径流数据进行径流过程率定验证,再对2010—2017年佛堂站的月泥沙数据进行泥沙过程率定验证,最后以2014—2017年塔下洲(子流域编号8)、南江桥(子流域编号14)和杨宅(子流域编号13)的月总氮(TN)、总磷(TP)数据进行水质过程率定验证。运用SWAT-CUP模型进行敏感性分析后,选取了17个对径流、泥沙和水质(氮磷)影响显著的参数,其中编号1~8是水文参数,编号9~17是水质参数,参数意义及调整方式如表2所示。模型评价指标选择相关系数R2、Nash-Sutcliffe系数(NS)和相对偏差Pbias为模型评价指标,相关计算公式如式(1)~(3)。
式中:Oi为模拟值,
此外,本文采用单位面积负荷指数法(Load Per Unit Area Index, LPUAI)[30] 对污染负荷强度Pi进行计算,公式见式(4)。
式中:PTi表示子流域产生的污染负荷量,t;Ai表示子流域面积,km2。
1.2.3. 水文过程率定与验证
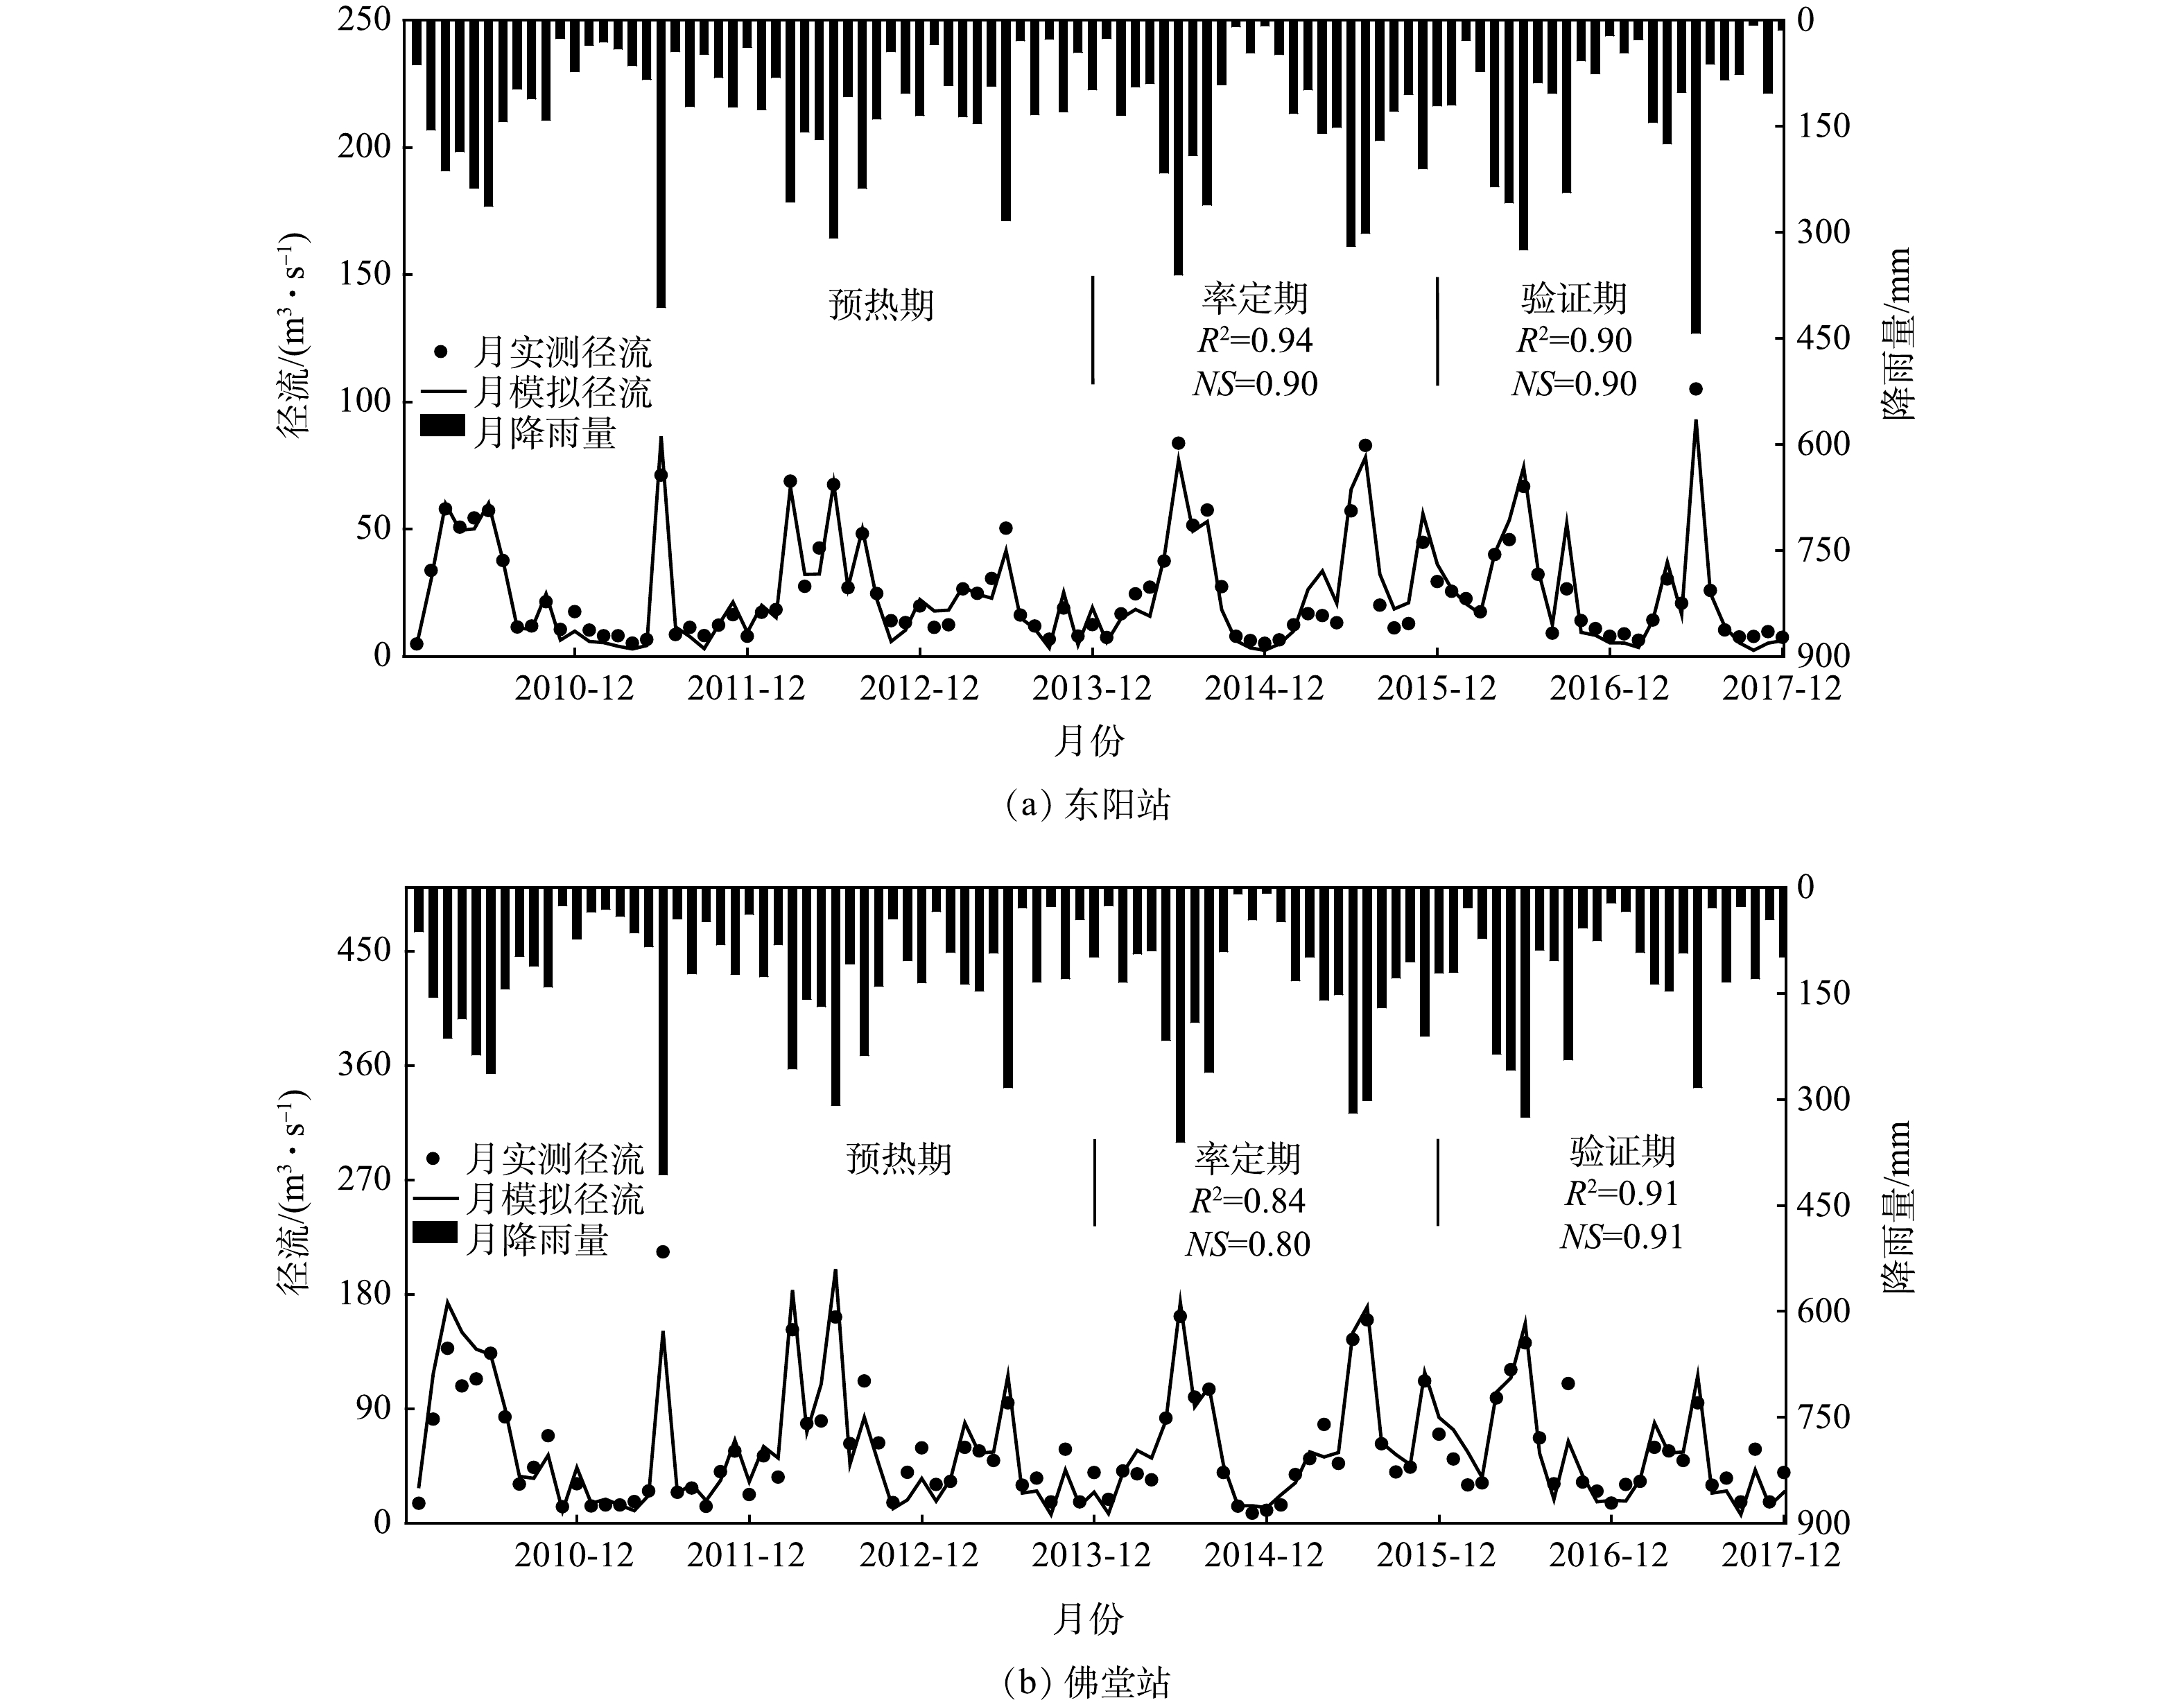
将统计的空间数据和气象数据输入模型,通过调整径流和泥沙参数,对2010—2017年义乌江流域的水文过程进行校核。图3是2010—2017年东阳站和佛堂站的月径流模拟结果。图4是2010—2017年佛堂站月泥沙负荷模拟结果。在径流的模拟中,率定期(2014—2015年)东阳站R2和NS系数分别为0.94和0.90;佛堂站R2和NS系数分别为0.90和0.90;验证期(2016—2017年)东阳站R2和NS系数分别为0.94和0.90;佛堂站R2和NS系数分别为0.90和0.90。在泥沙的模拟中,率定期佛堂站R2和NS系数分别为0.67和0.70,验证期R2和NS系数分别为0.65和0.67,径流和泥沙的模拟误差绝对值均在20%内。随着降雨峰值的出现,径流量和泥沙负荷均达到了峰值,说明模型不仅能准确刻画实际的水文过程,还能准确模拟峰值。1.2.4. 水质过程率定与验证
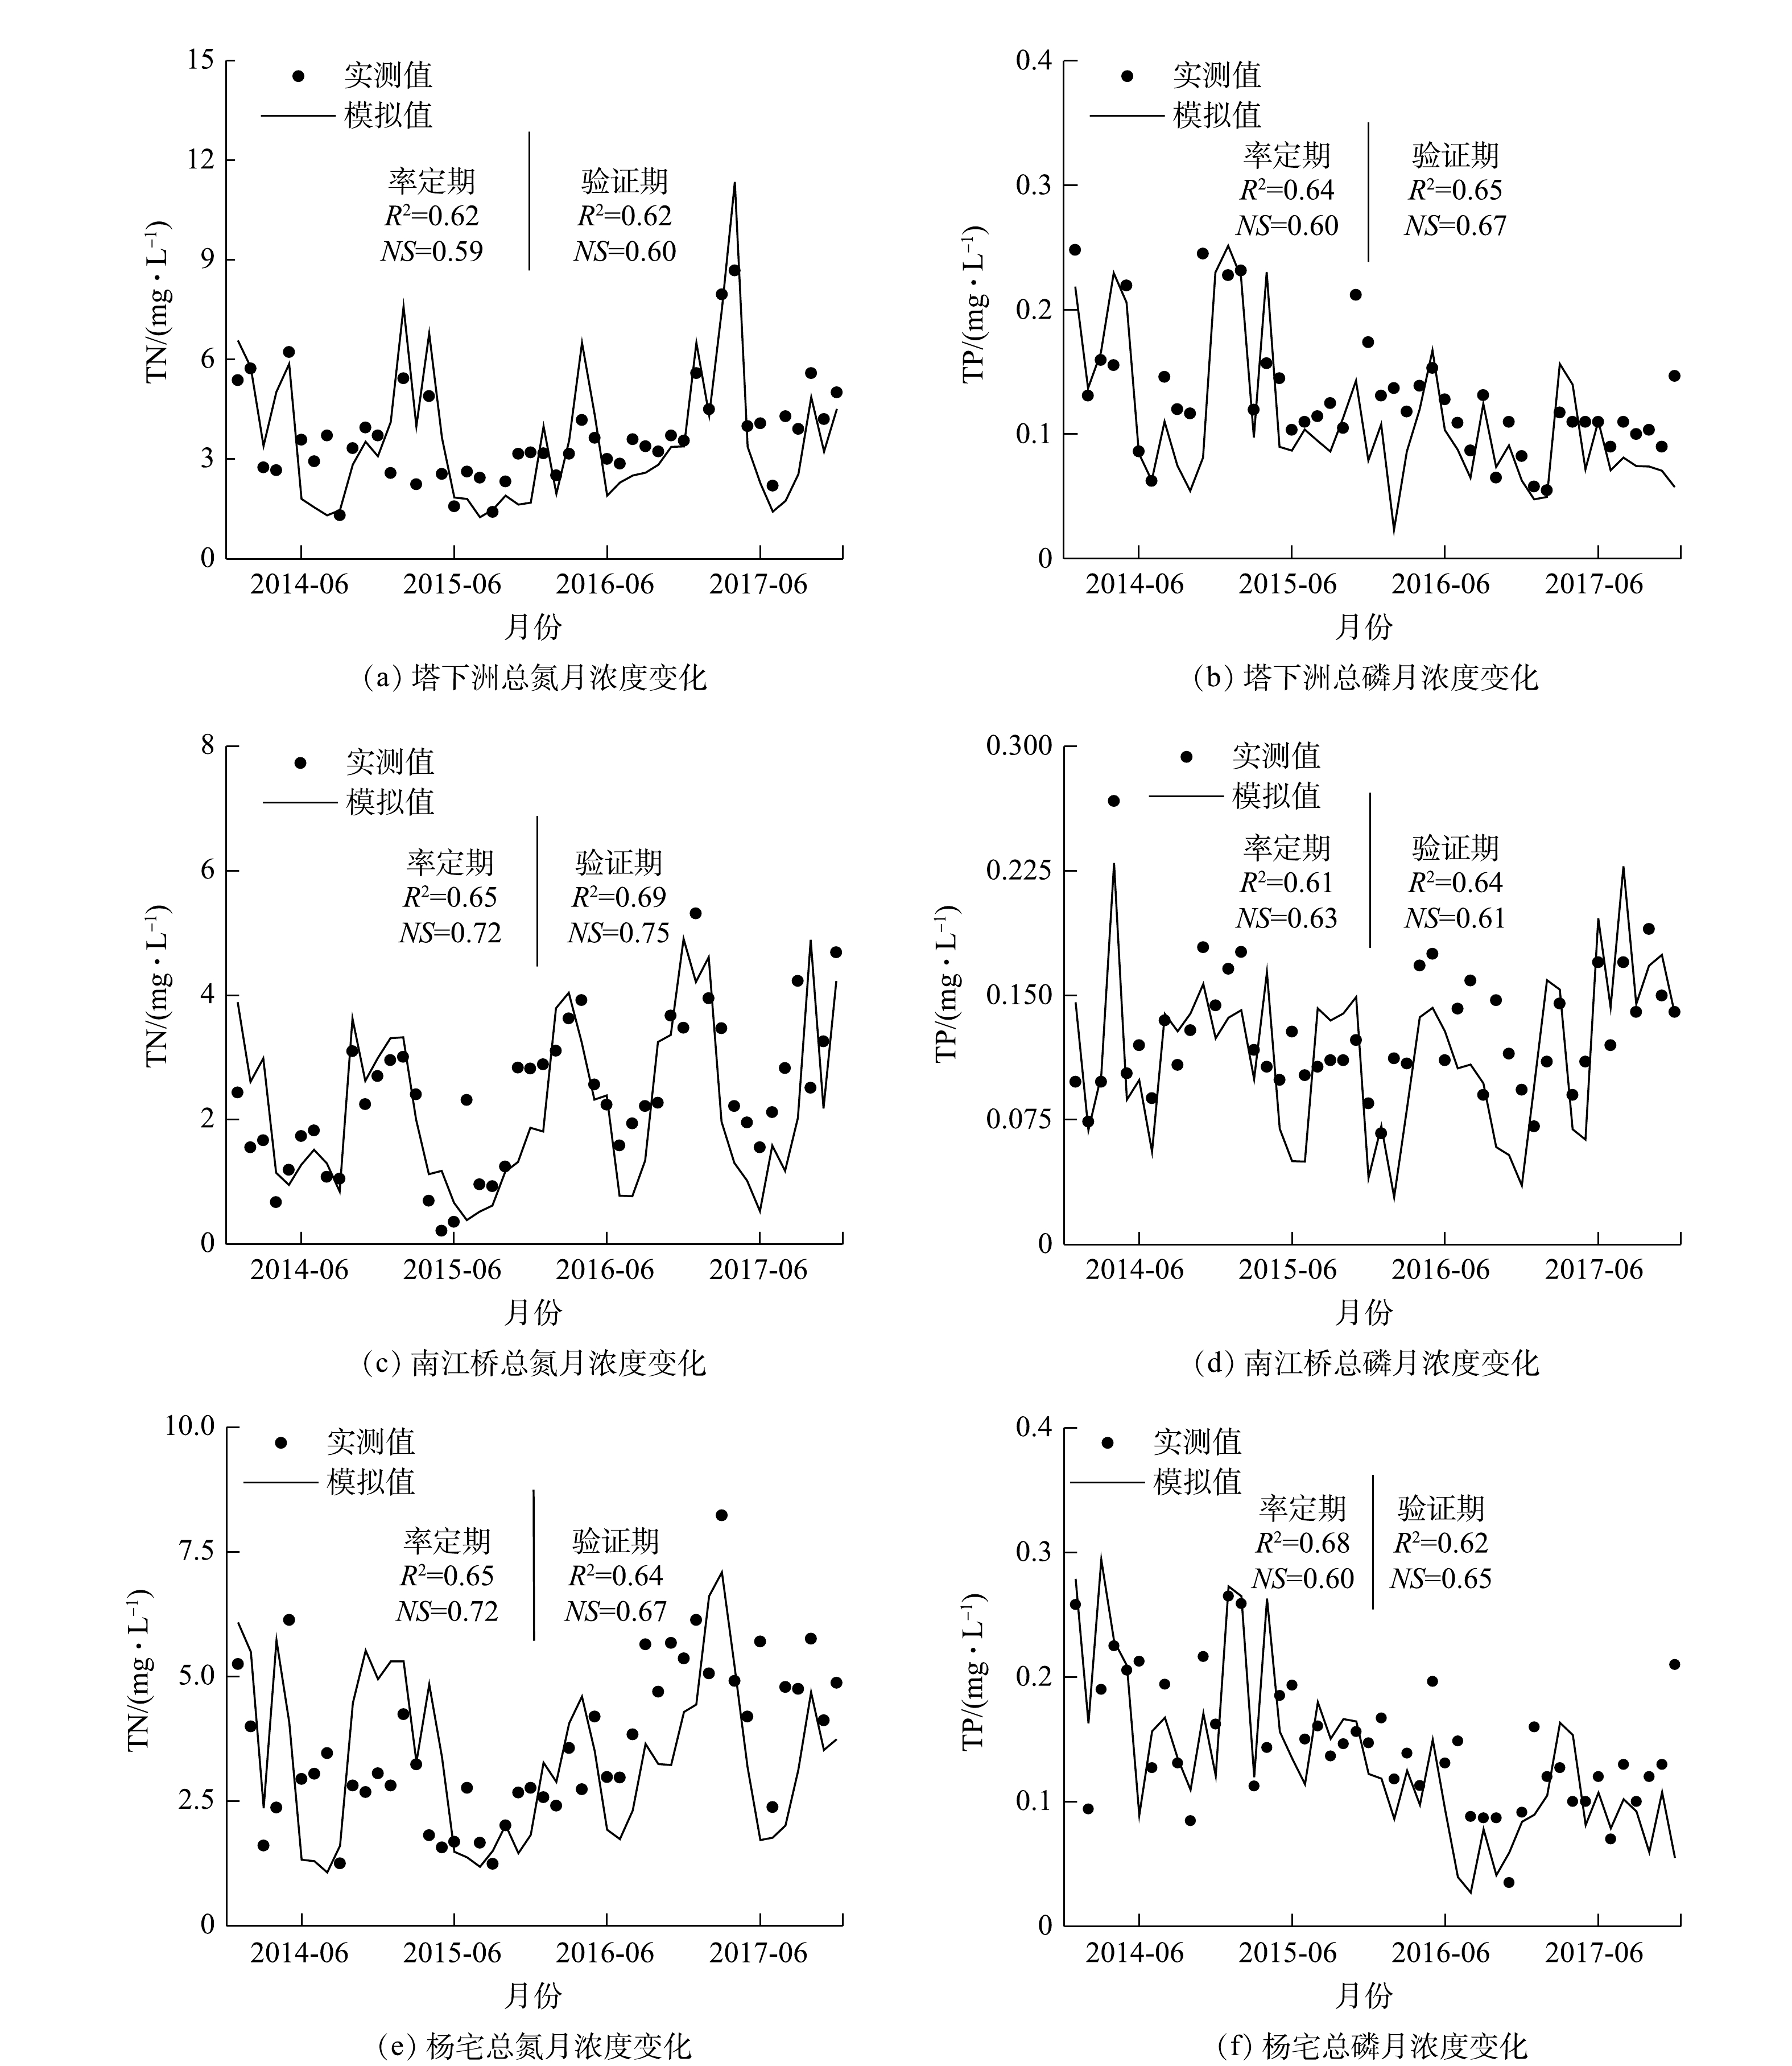
将统计的污染源数据输入水文率定后的SWAT模型,通过调整水质参数,对2014—2017年义乌江流域的总氮、总磷数据进行模拟。图5是3个水质断面的模型输出值与实测值拟合结果图。由图5可知,3个断面在率定期和验证期的模型输出值与实测值之间的R2与NS均在0.5以上,且平均误差绝对值均小于20%。这说明参数率定后的模型水质模块较好地反映了义乌江流域的水体污染情况,能够对流域污染源进行模拟和解析。2.1. 水文过程分析
根据图3义乌江流域多年降雨量计算可得,流域多年平均降水量1 447 mm,丰水期为3—7月,枯水期为1—2月,其余为平水期,其中丰水期降水量占年降水量的59%。根据图4义乌江流域多年泥沙负荷量图可知,2014—2017年流域年平均泥沙流失量在35.7×10⁴ t左右,并且流失量变化明显表现为洪季大枯季小的特征。泥沙流失量与径流量大小呈现较强的相关性,洪季3—7月上游来水流量较大,流速为0.5 ~1.5 m·s?1。由于义乌江流域土壤质地疏松,泥沙易被水体裹挟流失,流失量超过全年的60%以上,而在枯季由于流速小,泥沙流量也相应减小。2.2. 水质过程分析
2.2.1. 流域水污染时间特征
根据图5水质断面实测浓度流量核算,流域多年平均总氮总磷负荷分别为5 846.87 t和297.44 t。从年迹变化来看,2014—2017年南江桥上游来水水质相对较好,基本达Ⅲ类水标准;2014—2015年塔下洲断面水质相对较差,以劣Ⅴ类居多。2016年以来,基于当地杨宅水轮泵站工程和“五水共治”政策实施,农村生活污水逐步截管纳污,水质情况有了明显改善。从月尺度变化可以看出,3—7月河道中氮磷浓度较高。经核算,氮磷排放量分别为3 876.47 t和187.98 t,占全年的66%和63%,是流域氮磷污染源的集中排放期。流域径流强度直接影响河道内的污染负荷。随着丰水期降雨强度的增大,上游流量和含沙量较大,流速快,水体挟沙能力强,携带大量上游泥沙下泄导致汛期内流域氮、磷流失量明显增加,并达到全年峰值。2.2.2. 流域水污染空间特征
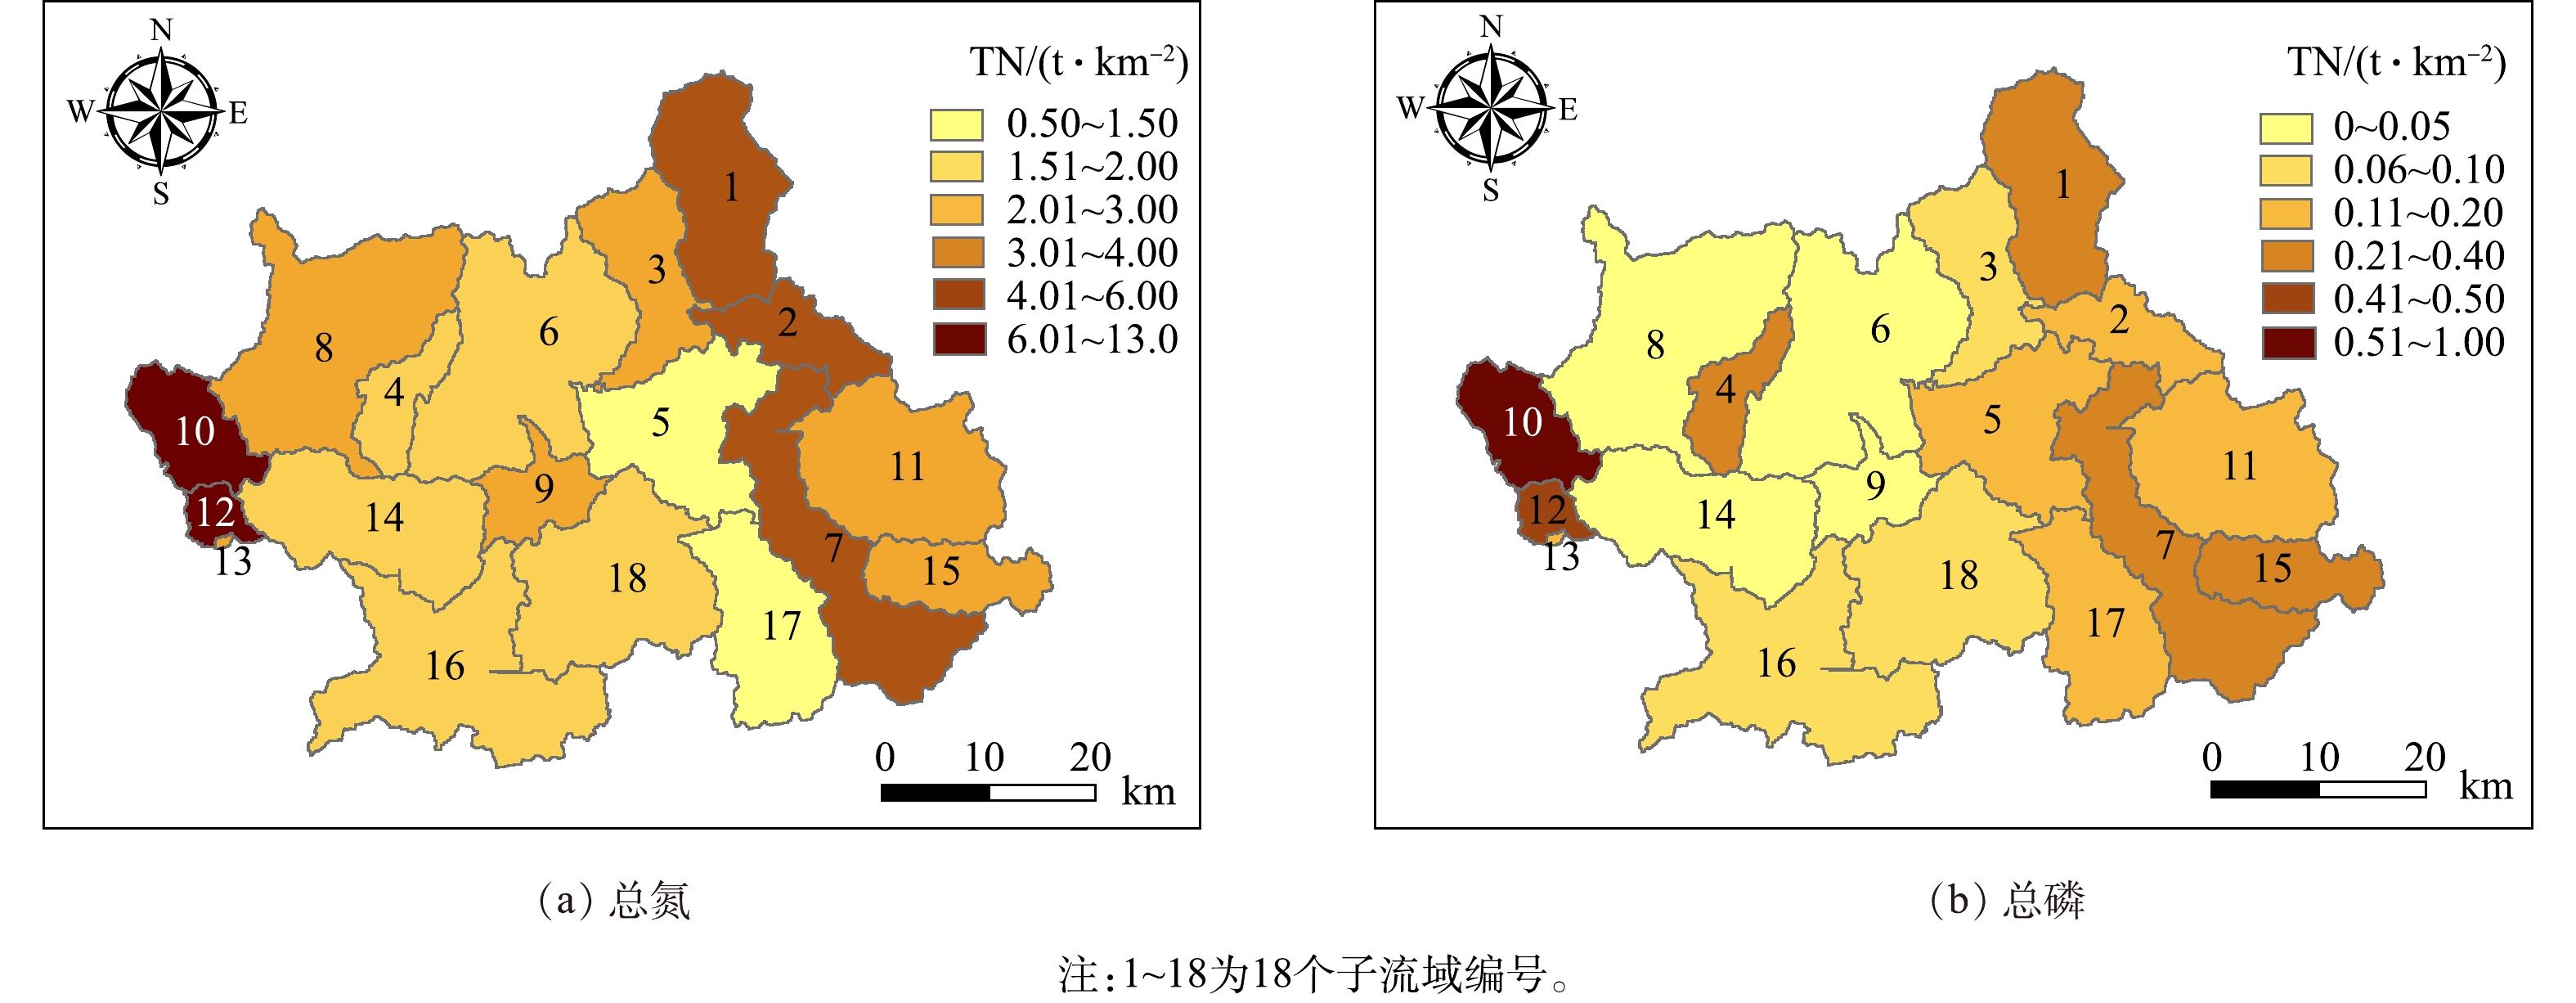
将率定好的模型按子流域氮磷负荷流失量输出,采用单位面积负荷指数法计算各子流域多年平均氮磷流失强度结果如图6所示。氮磷污染高负荷强度区主要集中在塔下洲断面至杨宅断面的人口密集区,主要包括:城西街道(子流域编号10)、佛堂镇(子流域编号12)、双溪乡和东阳江镇(子流域编号7)。这些区域村镇集中,并且受人为因素扰动较大,土地利用开发明显,多数天然植物被耕地、稻田及其他灌丛类型所代替。而在人为活动少、植被覆盖率高的地区,由于农村非点源排放量少,污染负荷水平相对较低。2.3. 关键源区识别
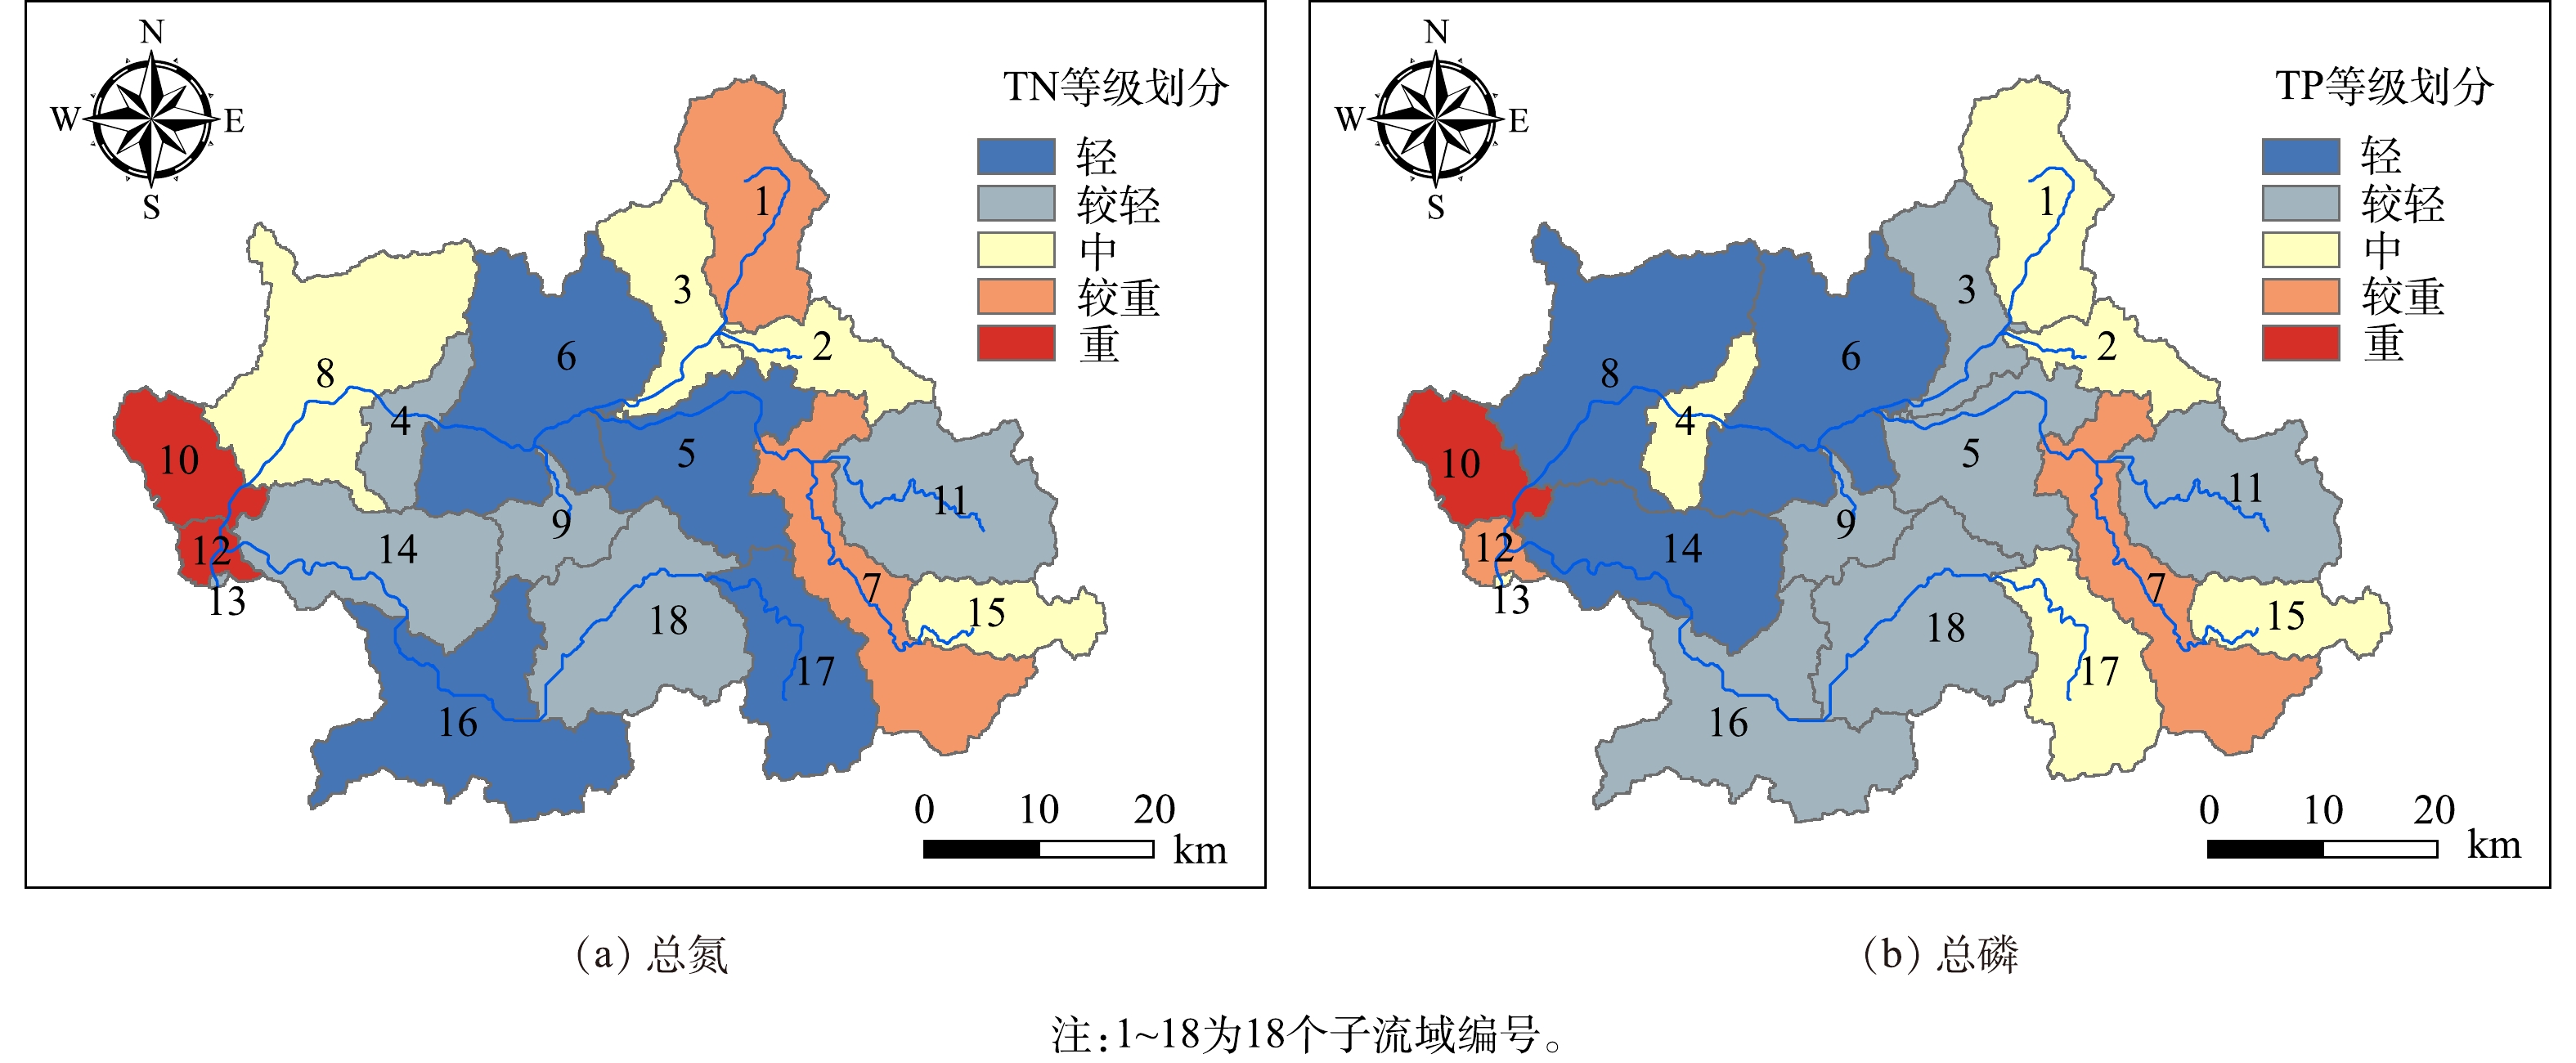
以18个子流域单位面积的污染负荷流失强度作为关键源区鉴别的评价指标,根据自然裂点分级法[31]针对TN和TP的流失强度划分为轻、较轻、中、较重、重5个等级,分级标准如表3所示。根据分级标准可知,义乌江流域关键源区的划分结果如图7所示。图7表明该流域TN和TP的流失强度等级分布趋势相对一致。TN流失强度等级重的子流域为10、12号子流域;流失强度较重的子流域为1、7号子流域。这4个子流域面积占流域总面积的18.1%,TN负荷的输出量占流域的45.7%。TP流失强度重的子流域为12号子流域,流失强度较重的子流域为7、12号子流域,这3个子流域面积占流域总面积的15.1%,TP负荷的输出量占流域的42.5%。将流失强度等级重和较重的子流域确定为关键源区,因此,识别出1、7、10、12为义乌江流域水环境污染的关键源区。从子流域分布来看,关键源区均为东阳江塔下洲至杨宅断面的村镇聚集地,农业人口密集,农村生活污染较为严重。
2.4. 讨论与展望
通过义乌江流域污染源统计结果可知,生活污染源是义乌江流域水环境污染的主要来源,氮磷输入占比均在50%以上。这也是流域内氮磷高污染负荷区均为村镇密集区的主要原因。在农村,生活污水未经处理直接排入河道,形成生活污染源。在城镇区域,仍存在大量管网布施不全导致生活污水未经污水处理厂处理的情况,这部分未截污纳管的城镇生活污水以面源的形式汇入河道中直接影响流域水质。因此,应切实健全区域的生活污水管网布施规模,加强污水处理厂治污能力。此外,在雨季,由于水土流失严重,水流和泥沙携带大量污染物进入受纳水体,相应造成的流域水环境污染也很严重。因此,还应提高对初期雨水的收集处置和农业非点源的防控整治力度,降低雨季农业非点源对义乌江流域环境的影响。考虑到经济成本和实施难度,针对义乌江流域水环境污染严重的问题,需考虑将部分子流域进行优先管控,即结合污染物的关键源区进行管控。比如着重就子流域1、7、10和12号进行氮磷控制。此外,针对关键源区,可进行工程措施防控,缓解水土流失和农业非点源污染问题。例如,在这些子流域的农耕区域中进行水草种植,增加田间水力停留时间,降沉悬浮物,减缓污染物的输移转化;在子流域的农耕区域两侧设置植被缓冲区域带,减少和净化周围沉积物和污染物的输送。而对于人口密集的村落集中的子流域,可结合经济效益与削减率,进行化肥农药的削减从而减少农业非点源的产生。
本研究的结果可为义乌江流域实现精准治污提供有力抓手,同时对其他区域湖泊水环境污染的关键源区解析和水环境调控治理提供参考。本研究还存在一些不足,如水质数据时间尺度较小,统计年鉴仍然在实际率定过程中有很大的误差等。未来应进一步提高水环境污染的输入量化工作,并且引入更长时间水质数据进行模型校准,以实现研究区模型输出的预测,再结合经济效益和管控成果对多种管理措施进行情景分析,制定最佳管理措施。
2)生活污染源是流域水环境污染的主要来源,氮磷的输入占比分别为52.7%和61.9%,因此,改善义乌江流域的水质状况,需重点控制生活污染源,健全区域的生活污水管网布施规模,加强污水处理厂治污能力。
3) 2014—2015年塔下洲和杨宅断面的水质在水质较差,自2016年以来得到较好改善。每年3—7月,流域水土流失严重,是流域氮磷负荷的高排放期,总氮和总磷流失量分别占全年的66%和63%。在空间上,南江桥断面上游来水水质相对较好,塔下洲断面水质相对较差,杨宅断面主要受塔下洲断面水质的影响呈现相同的趋势。其中,氮磷高负荷强度区域为城西街道、佛堂镇、东阳江镇和双溪乡。
4)通过单位单位面积负荷指数法(LPUAI)求得各子流域的氮磷流失强度并进行等级划分,将流失强度等级重和较重的子流域鉴定为关键源区,最终得到义乌江流域的关键源区为1、7、10和12号子流域,均为人口密集区以及农业聚集区。因此,要重点针对生活污染源和农业非点源进行治理,并将关键源区作为优先治理区。
参考文献

 下载:
下载: 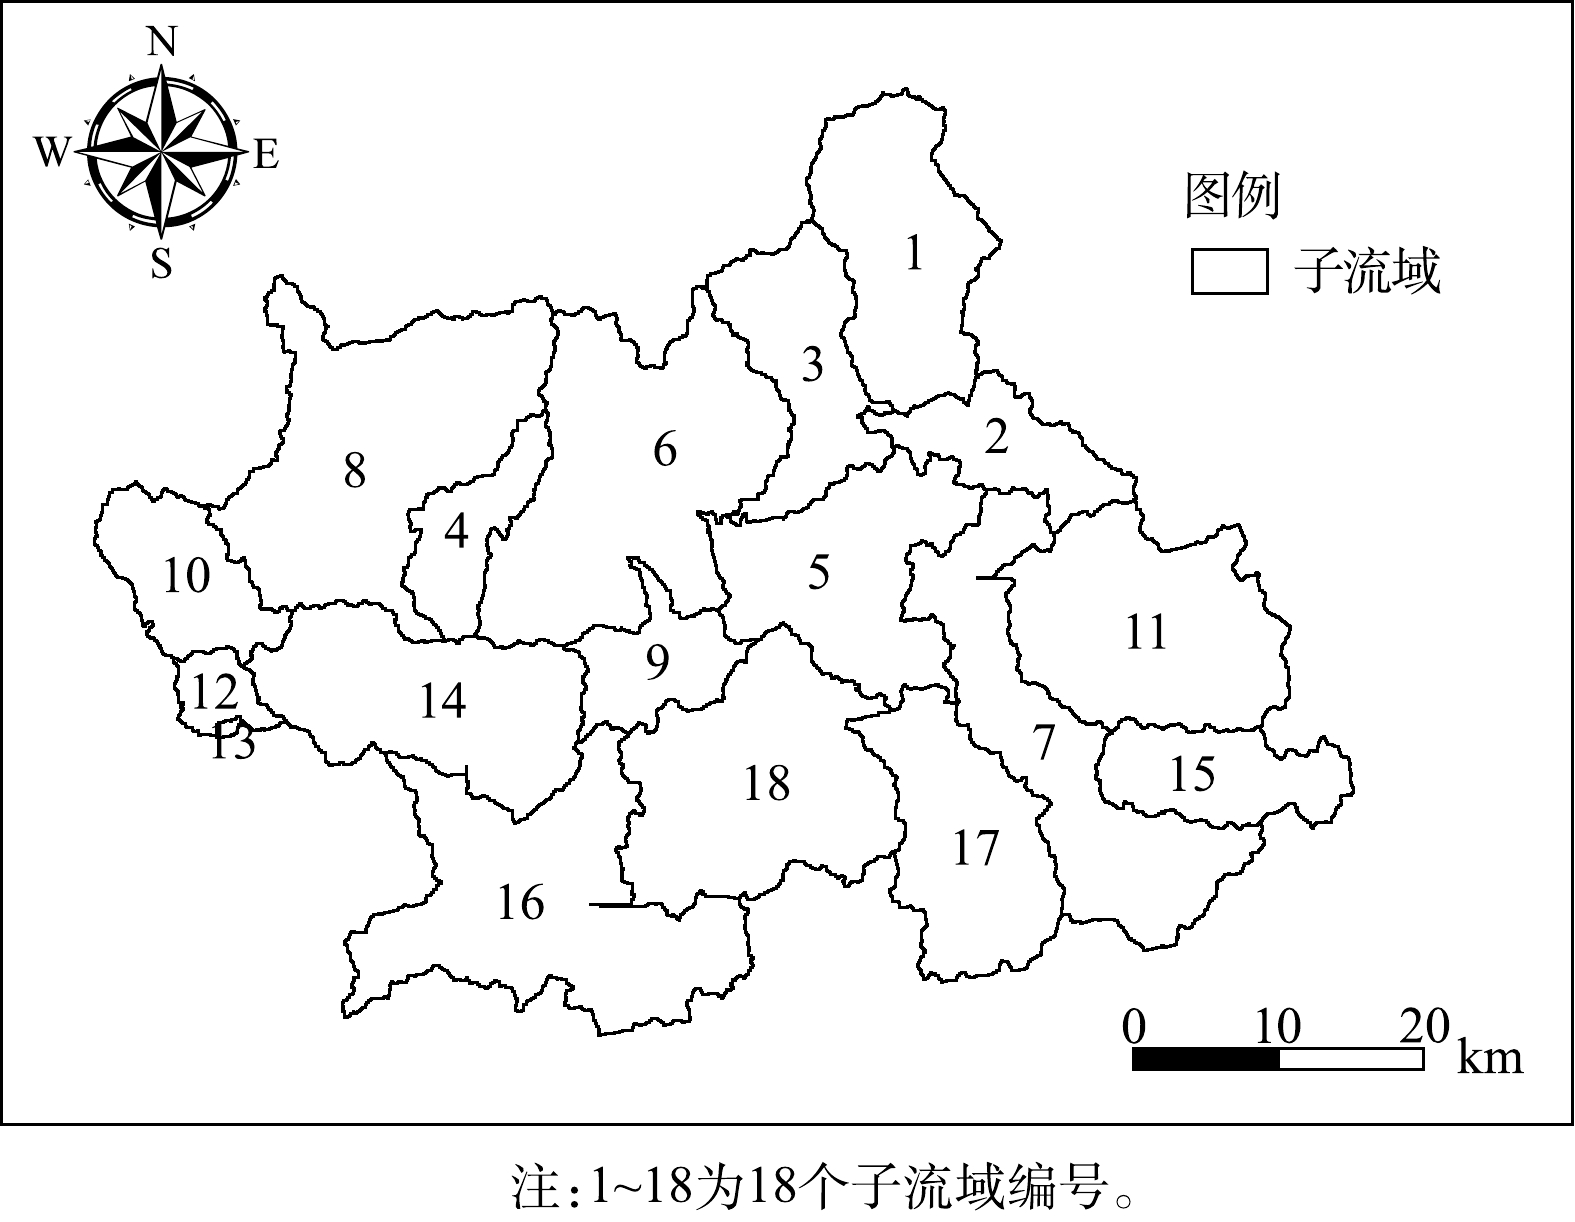

 点击查看大图