 ,∗, Zhi-Jie Tan,∗Department of Physics and Key Laboratory of Artificial Micro & Nano-Structures of Ministry of Education, School of Physics and Technology,
 First author contact:
Received:2021-03-31Revised:2021-04-13Accepted:2021-04-15Online:2021-05-20

Abstract
Keywords:
PDF (1870KB)MetadataMetricsRelated articlesExportEndNote|Ris|BibtexFavorite
Cite this article
Xiao-Wei Qiang, Hai-Long Dong, Kai-Xin Xiong, Wenbing Zhang, Zhi-Jie Tan. Understanding sequence effect in DNA bending elasticity by molecular dynamic simulations. Communications in Theoretical Physics, 2021, 73(7): 075601- doi:10.1088/1572-9494/abf825
1. Introduction
The mechanical elasticity of DNAs plays key roles in various biological processes, such as ligand-DNA binding, protein-DNA recognition, and DNA packaging [1–3]. The elasticities of genomic DNAs in different dimensions have been extensively characterized by single molecule techniques and theories [4–15]. For example, a DNA generally has a bending persistence length of ∼50 nm, a stretch modulus of ∼1000–1500 pN, a torsional persistence length of ∼90±20 nm [9, 16–18], and it would become overwound when stretched [17, 19]. Such elasticity of DNAs can also be influenced by salt conditions due to the polyanionic nature of DNAs [20–24].Importantly, recent experiments indicate that, base composition of DNAs could significantly influence their structure dynamics and the sequence-dependent conformational variations play a significant role in recognition processes with proteins [25–29]. For example, proteins generally recognize DNA sequences in two ways, including the direct readout mechanism where recognition is mediated by direct contacts between amino acids and bases, and the indirect readout mechanism where proteins recognize DNA sequence through their conformational properties. Thus, it is very important to characterize the sequence-dependence elasticity of DNAs [30].
In recent years, much attention has been focused on the sequence-dependent properties of DNAs [18, 31–36]. Shaban and Peters found that sequence compositions can greatly influence the bending stability of DNAs and the ability to form kinks, which can induce base-pair slide to form non-native contacts during bending [2, 37]. Ortiz and Pablo showed that the kink more likely happened in longer repeated sequence segments through a coarse-grained DNA structural model [38]. Scipioni et al studied the sequence-dependent DNA curvature and found that AT-rich sequences are more flexible than CG-rich sequence [39]. Olson et al performed the statistical analysis on x-ray crystal structures and found that DNAs of different sequences have distinct flexibilities, where the AA-TT step belongs to the rigid class while GG-CC and GC-GC dinucleotide are even more flexible [40]. Moreover, Srivastava et al reported that DNAs of poly(A)-poly(T) sequence condense in the presence of divalent ions but no condensation was observed for DNAs of poly(AT)-poly(TA) and generic sequences [41].
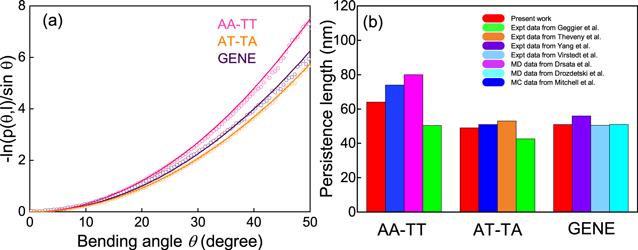
Furthermore, many different methods include experiments and theories were employed to determine the bending persistence lengths for DNAs of different sequences [42–45]. Geggier and Vologodskii quantified the persistence lengths of DNAs of 10 distinct dinucleotide steps through cyclization of short DNA fragments and found the persistence lengths vary from ∼43 to ∼55 nm for different dinucleotide sequences [43]. Recently, Chuang et al have shown that the DNA persistence length increases by almost 20% as the percent GC content increases for long genomic DNAs [46]. A recent coarse-grained simulation work for extensive distinct sequences showed that poly(A)-poly(T) has a high outlier persistence length of ∼73 nm and exhibits exceptionally straight and stiff, while poly(AT) has a lowest persistence length of ∼47 nm and appears tightly coiled and exceptionally soft [42]. However, until now, there is still lack of an energetic understanding on sequence effect in bending elasticity of DNAs.
In order to understand the sequence effect in bending elasticity of DNAs, we employed all-atom molecular dynamic simulations to quantify the persistence lengths for DNAs of typical sequences (namely, poly(A)-poly(T), poly(AT)-poly(TA) and generic one), and made the comparisons with the available experiments and simulations. Furthermore, we explored how sequences affect the DNA bending elasticity through calculating the bending energy and the electrostatic bending energy. Additionally, the role of electrostatic bending energy is furtherly illustrated through the electrostatic calculations for a grooved coarse-grained DNA model where minor groove width and other microscopic parameters can be artificially adjusted.
2. Methods
2.1. All-atom MD simulations
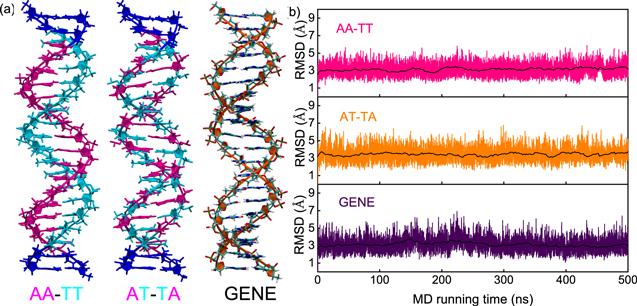
In this work, as shown in table 1, three 20-bp DNAs with two C-G base pairs at each end and central 16-bp poly(AA)-poly(TT), poly(AT)-poly(TA) and generic sequences were used in our all-atom MD simulations [14, 15, 47–50], and the three DNAs are named as AA-TT, AT-TA, and GENE respectively. The three sequences were selected according to previous experiments and simulations, corresponding to the upper value, the bottom value and generic one in persistence length for DNAs with different dinucleotides [41–43, 51, 52]. Here, the three DNAs are all capped by two C-G base pairs at each end to improve the end stability of the DNAs since C-G base pairs have higher thermal stability than A-T base pairs [53, 54]. The initial structures of the three DNAs were built in B-form with the Nucleic Acid Builder of AMBER [55]; see figure 1. The DNAs were immersed in rectangular boxes containing explicit water and ions. The counterions of Na+ and the salt of 150 mM NaCl [56] were added with the ion model from Joung and Cheatham [57] to ensure that our simulated systems are fully neutralized and the three DNAs are rather stable at room temperature [53, 58, 59]. The isothermic-isobaric ensemble was used in all MD simulations during the energy minimization, thermalized and equilibrated process. Afterwards, all of our MD simulations were performed for 500 ns at constant temperature (298 K) and constant pressure (1 atm), with the Particle Mesh Ewald method for long-range interactions and the periodic boundary conditions [60]. In each simulation, we used 2 fs as an integration step. The Gromacs 4.6 software package was used in the three simulations and the newly refined AMBER ff99bsc1 force field and TIP3P water model were chosen. As shown in figure 1(b), the systems quickly reach their equilibriums after ∼100 ns. The MD trajectories after 200 ns were used for our analyses. Please see the detailed information about our MD simulations in our previous works [52, 54, 61–63].Table 1.
Table 1.The DNA sequences used in the work.
| Name | Sequences | Cell size (nm3) | Tm |
|---|---|---|---|
| AA-TT | 5′-CGAAAAAAAAAAAAAAAAGC-3′ | 12×12×10 | 87.2 °C |
| GCTTTTTTTTTTTTTTTTCG | |||
| AT-TA | 5′-CGATATATATATATATATGC-3′ | 12×12×10 | 79.9 °C |
| GCTATATATATATATATACG | |||
| GENE | 5′-CGACTCTACGGCATCTGCGC-3′ | 12×12×10 | 104.2 °C |
| GCTGAGATGCCGTAGACGCG |
New window|CSV
Figure 1.
 New window|Download| PPT slide
Figure 1.(a) The initial three-dimensional DNA structures with typical sequences of poly(A)-poly(T) duplex (AA-TT), poly(AT)-poly(TA) duplex (AT-TA) and generic one (GENE) for our all-atom molecular dynamics simulations, respectively. The three sequences were chosen according to the recent experiments [41, 51] and coarse-grained simulations [42]. (b) The root mean square deviations (RMSD) versus MD running time (500 ns) for the central 14-bp segment of the DNAs with three typical sequences. The black lines represent the RMSD values averaged over every 2 ns. The DNAs are in 150 mM NaCl solutions.
2.2. Helical parameters and persistence length
To avoid the end effect of short duplexes, the three base pairs at each end were removed for all the analyses of the MD trajectories, and consequently the two C-G base pairs at each end have no influence on our calculations and analyses [54]. As shown in figure 1(b), all the MD simulations are nearly converged after ∼100 ns. In this work, helical and geometrical parameters were all obtained using the program Curves+[61, 62, 64]. Helical radius, as one of important helical parameters, is related to the radius of phosphate groups, helical rise and helical twist, and was calculated by [62, 65, 66]:In this work, to quantify persistence length P of DNAs, we calculated the probability distribution p(θ, l) based on the MD trajectories, where θ is the bending angle between average vectors of consecutive 10-bp helical repeats and l is the averaged contour length of the 10-bp helical repeats [52, 67]. Afterwards, the persistence length P for a DNA can be given through fitting p(θ, l) to [52, 67]
2.3. Electrostatic calculations
To reveal the underlying mechanism for the sequence effect in DNA bending elasticity, we calculated the electrostatic energy Eel for the conformations at different bending angle using the software of APBS, a well-established Poisson–Boltzmann solver for biomolecules [56, 68]. In the calculations, the radii of ions (Na+ and Cl-) were set as 2 Å, and the dielectric constants of the DNAs and solvent were taken as 2 and 78, respectively. For the conformations taken from the MD simulations, all the atom charges including H atoms were included in the electrostatic calculations according to the atom charge distributions from AMBER ff99bsc1 force field. Since hydrogen bond is essentially an electrostatic interaction between positively and negatively charged atoms at a close separation [69, 70], in principle, hydrogen bond opening/closing can be captured in the electrostatic calculations. Therefore, the electrostatic bending energy ΔEel(θ) is given by ΔEel(θ)= Eel(θ)− Eel(θ=0)[71].2.4. A grooved coarse-grained model for DNA
To examine the role of electrostatic bending energy in DNA bending elasticity, we also employed a grooved coarse-grained model for DNA structure where minor groove width and other helical parameters can be artificially adjusted; see appendix and [58, 71–73] for details. The grooved model can be used to minimally mimic a DNA structure [58, 59, 72, 73], and can be easily used to produce bent conformations [71]. In present work, the central six base pairs of a coarse-grained DNA are bent uniformly along the helical axis, and the two end helix parts keep straight (unbent) and are rotated according to the central bent axis, keeping the helical axis continuous; see [71] for details. Corresponding to the 14 central base pairs in all-atom MD simulations, we also calculated the electrostatic bending energy for 14-bp coarse-grained DNAs, with the software of APBS [68].3. Results and discussion
In the following, firstly, we calculated the bending persistence lengths for AA-TT, AT-TA and GENE sequences based on the MD trajectories and made the comparisons with the available experimental and simulation data. Afterwards, we calculated the bending energy and electrostatic bending energy to explore the underlying energetic mechanism. Moreover, we calculated the non-electrostatic persistence length of DNAs. Finally, we employed a minimal coarse-grained model with artificial adjustment on helical parameters to furtherly illustrate the energetic mechanism.3.1. Persistence length of AA-TT is apparently larger than those of AT-TA and GENE sequences
As shown in figure 2(a), the bending angle distribution –ln(p(θ, l)/sin(θ)) of the AA-TT sequence is apparently higher than that of GENE and AT-TA sequences, while that of AT-TA is only very slightly lower than that of GENE, suggesting AA-TT is apparently stiffer in bending than GENE and AT-TA, and AT-TA is only very slightly more bendable than GENE. The bending persistence length P can be calculated by fitting the data of –ln(p(θ, l)/sin(θ)) to equation (Figure 2.
 New window|Download| PPT slide
Figure 2.(a) The bending angle distributions p(θ, l) versus bending angle θ over 10 base steps for the central 14-bp segments of the DNAs with three sequences of AA-TT, AT-TA and GENE. The bending persistence lengths can be estimated by fitting the shown curves to equation (
Table 2.
Table 2.The helical parameters and persistence length for DNAs with different sequences
| AA-TT | AT-TA | GENE | |
|---|---|---|---|
| Helical rise (Å) | 3.34±0.08 | 3.29±0.08 | 3.33±0.09 |
| Helical twist (degree) | 34.32±0.83 | 34.94±0.90 | 34.62±1.10 |
| Helical radius (Å) | 10.17±0.17 | 10.07±0.16 | 10.14±0.24 |
| Major groove width (Å) | 13.36±0.84 | 12.34±0.72 | 11.92±0.64 |
| Minor groove width (Å) | 4.91±0.45 | 5.36±0.46 | 5.64±0.45 |
| Persistence length (nm) | 63 | 48 | 49 |
New window|CSV
3.2. Electrostatic energy makes the major contribution to sequence-dependent bending energy
To explore the underlying mechanism why AA-TT is apparently stiffer than GENE and AT-TA, we calculated the bending energy ΔEbend(θ) over the central 14 base pairs according to the bending angle distributions p(θ, l) and the worm-like chain model [74]:Figure 3.
 New window|Download| PPT slide
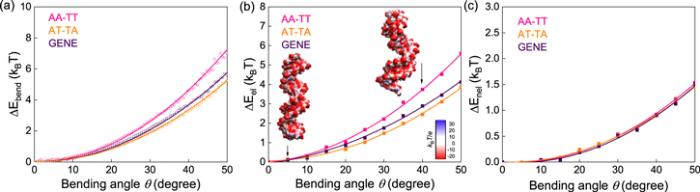
Figure 3.(a) The bending energy ΔEbend(θ) versus bending angle θ over the central 14 base pairs, for AA-TT, AT-TA and GENE. (b) The electrostatic bending energy ΔEel(θ) versus bending angle θ over the central 14 base pairs for AA-TT, AT-TA and GENE. Here, ΔEel(θ) was calculated directly with the APBS [68]. (c) The non-electrostatic bending energy ΔEnel(θ) versus bending angle θ over the central 14 base pairs for AA-TT, AT-TA and GENE. The electrostatic energies and the surface potentials in panels (b), (c) were calculated with the APBS [68].
Furthermore, we split bending energy ΔEbend(θ) into electrostatic contribution ΔEel(θ) and non-electrostatic one ΔEnel(θ). Here, electrostatic bending energy ΔEel(θ) were directly calculated using the software of APBS, a well-established Poisson–Bolztmann solver for calculating electrostatic energy of a biomolecule [68]; see Methods. Specifically, we randomly selected enough (∼100) conformations for each DNA at each bending angle and calculated their electrostatic energies Eel(θ) with the APBS, ensuring the convergence of Eel(θ). As shown in figure 3(b), the calculated ΔEel(θ) increases quadratically with the increase of bending angle θ and ΔEel(θ) of AA-TT increases more rapidly than those of GENE and AT-TA, in a very similar trend to the bending energy ΔEbend(θ). Subsequently, we calculated the non-electrostatic bending energy ΔEnel(θ) by ΔEnel(θ)=ΔEbend(θ)−ΔEel(θ) for AA-TT, AT-TA, and GENE. As shown in figure 3(c), it is surprising that the relationships of ΔEnel(θ) with bending angle θ emerge together and are indistinguishable for the three sequences, suggesting that the difference in bending energy is attributed to the difference in electrostatic bending energy for the three sequences. Thus, the apparently larger bending stiffness (persistence length) of AA-TT than those of AT-TA and GENE is attributed to the visibly higher electrostatic bending energy.
Here, it is also interesting to calculate the persistence length P0 of ‘neutral' DNAs based on the non-electrostatic bending energy ΔEnel(θ) and electrostatic persistence length Pel based on electrostatic bending energy ΔEel(θ), through ${\rm{\Delta }}{E}_{{\rm{bend}}}\left(\theta ,l\right)=\tfrac{1}{2}\,{k}_{B}T\tfrac{P}{l}{\theta }^{2}$ [52, 67]. We obtained that P0=∼17 nm for the three sequences, and Pel=∼46 nm, ∼31 nm and ∼32 nm for AA-TT, AT-TA, and GENE, respectively. Our calculated value of P0∼17 nm is between that from the counterion condensation-based modeling (P0∼7 nm) [75] and that from the MD simulations through adding protons to fully neutralize negatively charged phosphate groups (P0∼30 nm) [75, 76]. We note that our predicted P0 can be a reasonable value since our simulations involved the newly refined parmbsc1 force field and no artificial effect on DNA structures and the electrostatic calculations with the APBS were explicitly performed for extensive conformations from the MD simulations. In contrast, the treatment of adding protons to neutralize surfacial phosphate groups by Savelyev et al may naturally underestimate the electrostatic contribution to bending stiffness since the DNA interior electrostatic interactions were still reserved [73]. Therefore, for the DNA sequences studied here, our calculations indicate that the electrostatic interaction makes the major contribution to DNA bending stiffness.
3.3. Narrower minor groove width visibly increases electrostatic bending energy of AA-TT
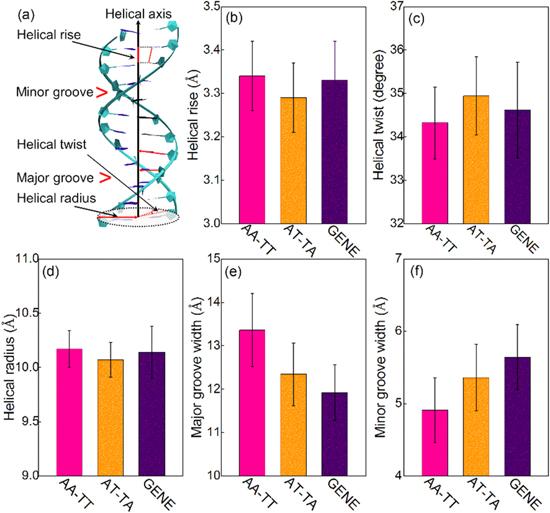
Since AA-TT is exceptionally stiffer than GENE and AT-TA and electrostatic interaction makes the major contribution to the sequence effect, we will emphasize exploring why the electrostatic bending energy is exceptionally high for AA-TT in the following. First, we calculated all helical (structural) parameters for the three DNAs with Curves+[64]. As shown in figure 4 and table 2, almost all parameters of AA-TT are close to those of GENE, including helical rise, helical radius, and helical twist, except for the minor and major groove widths. AA-TT has an apparently narrower minor groove while a wider major groove, compared with GENE and AT-TA. Thus, the apparently narrower minor groove should be the reason that AA-TT has exceptionally higher electrostatic bending energy especially than GENE.Figure 4.
 New window|Download| PPT slide
Figure 4.(a) An illustration for helical rise, helical twist, helical radius, major groove width and minor groove width for a DNA. The helical parameters for the central 14-bp segments of AA-TT, AT-TA and GENE including helical rise (b), helical twist (c), helical radius (d), major groove width (e), minor groove width (f). The error bars are the standard deviations to the respective mean values.
To explore the role of minor groove width in higher electrostatic bending energy for AA-TT, we employed a grooved coarse-grained DNA model where minor groove width (and other helical parameters) can be artificially adjusted; see Method and appendix for the details about the model [71]. First, we calculated the electrostatic energy for straight DNA models with different minor groove widths (i.e. bending angle =0), with the APBS [68]. As shown in figure 5(b), the electrostatic energy of DNA models increases visibly with the decrease of the minor groove width, due to the increased local charge density of DNA backbone. Afterwards, the central six base pairs of the DNA models with different minor groove widths are bent uniformly along the helical axis according to [71], and we calculated the electrostatic bending energy at different bending angle θ with the APBS [68]. As shown in figure 5(c), with the increase of bending angle θ, the electrostatic bending energy increases quadratically, which is in a similar trend with ΔEel(θ) from our MD simulations. Furthermore, for a DNA model with narrower minor groove, ΔEel(θ) increases with θ in a more rapid trend than that for a DNA with wider minor groove, suggesting that narrower minor groove causes a higher bending stiffness for a DNA. Thus, the calculations with the groove coarse-grained DNA model clearly illustrate that the exceptional bending stiffness of AA-TT is attributed to its narrower minor groove.
Figure 5.
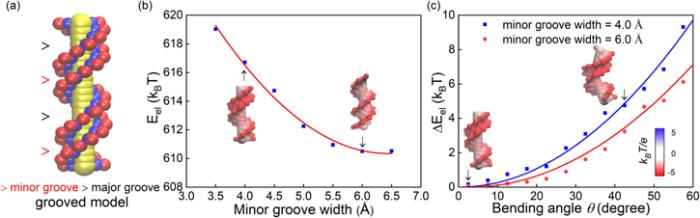 New window|Download| PPT slide
Figure 5.(a) A grooved coarse-grained model for DNA structure [71, 72], where every base pair is composed of two phosphate spheres (in red), two sugar spheres (in blue) and one big base sphere (in yellow); see details in the appendix. (b) The electrostatic energy for straight 14-bp DNAs (bending angle θ=0) with different minor groove widths from the grooved DNA model. (c) The electrostatic bending energy ΔEel(θ) for a 14-bp DNA versus bending angle θ over central 6 base pairs. The electrostatic energies and the surface potentials in panels (b), (c) were calculated with the APBS [68].
We also notice that AT-TA has a slightly narrower minor groove while very slightly electrostatic bending energy than GENE. This is because all the helical parameters between AT-TA and GENE almost differ slightly from each other, and the effects of the helical parameters on electrostatic bending energy can compensate each other. Specifically, as shown in figure 4 and table 2, helical rise (AT-TA)< helical rise (GENE), helical twist (AT-TA)> helical twist (GENE), helical radius (AT-TA)< helical radius (GENE), and major groove width (AT-TA)> major groove width (GENE). Table 3 shows that the different helical twist, helical radius and major groove width of AT-TA from GENE can decrease the electrostatic bending energy, which can certainly compensate (even over compensate) the increased the electrostatic bending energy by slightly narrower minor groove.
Table 3.
Table 3.Effects of helical parameters on electrostatic energy for the grooved DNA model
| Helical rise | Helical twist | Helical radius | Minor groove width | |
|---|---|---|---|---|
| 3.2→3.4 Å | 33.0→35.0° | 10.0→10.2Å | 4.0→6.0 Å | |
| Eel(θ=0°) (kBT) | 614 ↓ | 610 ↓ | 611 ↓ | 617 ↓ |
| 609 | 609 | 610 | 610 | |
| △Eel(θ=40°) (kBT) | 3.7 ↓ | 3.4 ↓ | 1.9 ↑ | 4.6 ↓ |
| 0.8 | 1.3 | 4.0 | 3.2 |
New window|CSV
Therefore, through the extensive electrostatic calculations for the structures from our MD simulations and the groove DNA models with adjustable helical parameters including minor groove width, we found that the sequence effect in bending stiffness of AA-TT, GENE and AT-TA is attributed to the different electrostatic bending energy, which is coupled to the backbone structures of AA-TT, GENE and AT-TA. Particularly, the exceptional bending stiffness of AA-TT is attributed to its narrow minor groove.
4. Conclusions
In this work, we employed all-atom MD simulations to quantify the bending persistence lengths for the DNAs with AA-TT, GENE and AT-TA sequences. Our calculations indicate that AA-TT has an exceptionally larger bending persistence length than AT-TA and GENE while AT-TA is only slightly smaller than that of GENE, which is in good agreement with the existing works. Our calculations on bending energy and electrostatic bending energy show that the sequence-dependent bending stiffness for the three typical sequences is attributed to the sequence-dependent electrostatic bending energy, which is coupled to their backbone structures. Particularly, the apparently stronger bending stiffness of AA-TT is attributed to its obviously narrower minor groove. Interestingly, our calculations predicted the non-electrostatic persistence length of ∼17 nm and consequently the electrostatic interaction makes the major contribution to the persistence length for the three typical sequences. Certainly, the universality of our conclusions is still required to be examined furtherly against more dinucleotide sequences and more generic sequences with different C-G contents. Nevertheless, our findings and analyses for the three typical sequences can be very important in understanding sequence effect in DNA bending elasticity and the ligand/protein recognitions with AT-rich DNAs.Acknowledgments
We are grateful to Professors Xinghua Zhang (Wuhan University), Xiangyun Qiu (George Washington University), and Shi-Jie Chen (University of Missouri) for helpful communications. This work was supported by grants from the National Science Foundation of China (Grant Nos. 11774272, and 12075171). Parts of the numerical calculations in this work are performed on the super computing system in the Super Computing Center of Wuhan University.Reference By original order
By published year
By cited within times
By Impact factor
DOI:10.1038/nature01595 [Cited within: 1]
DOI:10.1017/S0033583510000077 [Cited within: 1]
DOI:10.1038/s41596-020-0342-4 [Cited within: 1]
DOI:10.1073/pnas.1109824109 [Cited within: 1]
DOI:10.1073/pnas.1213740110
DOI:10.1021/jacs.9b11957
DOI:10.1103/PhysRevLett.109.218102
DOI:10.1103/PhysRevLett.93.108108
DOI:10.1146/annurev-biophys-083012-130412 [Cited within: 1]
DOI:10.1038/nmeth1044
DOI:10.1016/S0959-440X(00)00085-3
DOI:10.1103/PhysRevE.62.1045
DOI:10.1103/PhysRevLett.82.4560
DOI:10.1371/journal.pcbi.1003562 [Cited within: 1]
DOI:10.1016/j.physa.2018.05.011 [Cited within: 2]
DOI:10.1021/ja3054755 [Cited within: 1]
DOI:10.1038/nature04974 [Cited within: 1]
DOI:10.1038/nature01810 [Cited within: 2]
DOI:10.1073/pnas.1407197111 [Cited within: 1]
DOI:10.1146/annurev.biophys.37.032807.125957 [Cited within: 1]
DOI:10.1002/bip.22585
DOI:10.1103/PhysRevLett.106.028102
DOI:10.1016/j.bpj.2016.11.018
DOI:10.1146/annurev-biophys-070816-033920 [Cited within: 1]
DOI:10.1038/s41467-020-17531-8 [Cited within: 1]
DOI:10.1016/j.cplett.2020.137344
DOI:10.1093/nar/gkaa1099
DOI:10.1038/s41598-019-51036-9
DOI:10.1093/nar/gku338 [Cited within: 3]
DOI:10.1146/annurev.biophys.34.040204.144537 [Cited within: 1]
DOI:10.1006/jmbi.2000.3781 [Cited within: 1]
DOI:10.1146/annurev.biophys.29.1.497
DOI:10.1093/nar/gkm627
DOI:10.1007/s00335-017-9713-8
DOI:10.1103/PhysRevE.79.041926
DOI:10.1088/1674-1056/25/1/018703 [Cited within: 1]
DOI:10.1016/j.molliq.2019.111002 [Cited within: 1]
DOI:10.1103/PhysRevLett.106.238107 [Cited within: 1]
DOI:10.1016/S0006-3495(02)75254-5 [Cited within: 1]
DOI:10.1006/jmbi.1993.1409 [Cited within: 1]
DOI:10.1093/nar/gkaa499 [Cited within: 4]
DOI:10.1021/acs.jctc.6b00904 [Cited within: 6]
DOI:10.1073/pnas.1004809107 [Cited within: 4]
DOI:10.1146/annurev.bi.59.070190.003543
DOI:10.1006/jmbi.1995.0640 [Cited within: 1]
DOI:10.1103/PhysRevLett.119.227802 [Cited within: 1]
DOI:10.1021/ja1109425 [Cited within: 1]
DOI:10.1073/pnas.1517511113
DOI:10.1103/PhysRevE.92.062705
DOI:10.1103/PhysRevE.99.012420 [Cited within: 1]
DOI:10.1126/science.1158881 [Cited within: 3]
DOI:10.1103/PhysRevLett.124.058101 [Cited within: 5]
DOI:10.1073/pnas.95.4.1460 [Cited within: 3]
DOI:10.1063/1.4915539 [Cited within: 3]
DOI:10.1529/biophysj.106.097782 [Cited within: 1]
DOI:10.1016/j.bpj.2018.03.001 [Cited within: 2]
DOI:10.1021/jp8001614 [Cited within: 1]
DOI:10.1063/1.1842059 [Cited within: 4]
DOI:10.1529/biophysj.105.070904 [Cited within: 3]
DOI:10.1063/1.464397 [Cited within: 1]
DOI:10.1016/j.bpj.2017.02.022 [Cited within: 3]
DOI:10.1016/j.bpj.2019.05.018 [Cited within: 3]
DOI:10.1063/1.4991689 [Cited within: 1]
DOI:10.1093/nar/gkp608 [Cited within: 3]
DOI:10.1021/bi3013005 [Cited within: 1]
DOI:10.1073/pnas.1705642114 [Cited within: 1]
DOI:10.1103/PhysRevLett.117.028101 [Cited within: 4]
DOI:10.1073/pnas.181342398 [Cited within: 8]
DOI:10.1002/jcc.26068 [Cited within: 1]
DOI:10.1063/5.0026168 [Cited within: 1]
DOI:10.1529/biophysj.107.122366 [Cited within: 8]
DOI:10.1063/1.470191 [Cited within: 3]
DOI:10.1529/biophysj.106.100388 [Cited within: 4]
DOI:10.1103/PhysRevLett.98.218102 [Cited within: 1]
DOI:10.1529/biophysj.106.089029 [Cited within: 2]
DOI:10.1021/ja207984z [Cited within: 1]
