HTML
--> --> -->Exotic 11Li nuclei have attracted much theoretical and experimental interest as a typical case. Their first production was described by Postanzer et al. in 1966 [12], and some special properties such as their large matter radii were discovered by Tanihata et al. [1, 13]. The 11Li nucleus has numerous interesting properties. i) It consists of a core of three protons and six neutrons as well as a halo of two loosely bound neutrons; 11Li belongs to the three-body system (9Li+n+n), which is called a Borromean system [14, 15]. ii) The small separation energy (S2n) of the two-neutron halo is only S2n= 300 KeV [1], and in new research, it is found to be S2n= 378±5 KeV [15, 16]. This small separation energy leads to an increase in the matter radius of 11Li compared with other Li isotopes and forms a low-density halo, where nuclear radii increase with the mass number A of a nucleus as A1/3. Further, it has been found that the matter radius of a 11Li nucleus significantly deviates from the A1/3 law, whereas other Li isotopes follow this law exactly [16]. iii) The rms radius is quite large compared to that of 9Li (2.32±0.02) fm [13], which was found to be (3.12±0.16) fm [1, 13], and the latest measurements propose that it might be as large as (3.55±0.10) fm [2], where the size of the 11Li nucleus is approximately equal to the size of 41Ca and as large as 208Pb [16, 17], This means that two halo neutrons are mostly placed far from the 9Li core. iv) It cannot be used as a target because it has a very short half-life time of 8.2 ms [18] for β- decay. All these properties make the 11Li nucleus an interesting halo nucleus that can be used as a projectile on several targets for studying the structure.
In the last several decades, numerous studies have generated widespread interest in the interaction cross section of the 11Li nucleus as a projectile with several different targets [19-27]. The quasi-elastic scattering of 11Li on 12C was measured by Kolata et al. [20] at 60 MeV/n, and on 28Si at 29 MeV/n by Lewitowicz et al. [21]. They used the coupled-channels (CC) method to reproduce the data, where the energy resolution did not allow for the separation of the true elastic scattering from inelastic scattering. A recent experiment for 11Li scattering on 12C was performed by Peterson et al. [22] at 50 MeV/n. They successfully separated the elastic and inelastic reaction channels in the critical forward-angle region. All the previous experimental studies [20-22] of quasielastic scattering of the neutron-halo nucleus of 11Li with low-Z targets have reported and confirmed the strong refractive effect of this scattering process as first predicted by Satchler et al. [23]. This refractive effect has very long-range absorption due to 11Li breakup, which increases the reaction cross section and is required for reproducing the experimental data. Mermaz [24] showed that it is necessary to use a surface potential that peaked very far outside the nucleus in order to reproduce the forward interference minimum core. The necessity of adding this long tail, which was introduced by Mermaz to the real part of the optical model potential to fit 11Li scattering on 12C and 28Si, has been verified via S-matrix inversion techniques by Cooper and Mackintosh [25]. Several studies [19, 26, 27] treated the refractive long tail using the dynamic polarization potential (DPP) generated by the strong coupling of the breakup channels with the elastic one for 11Li scattering. Khalili [27] proposed a theoretical interpretation of the data using Faddeev three-body wave functions within a four-body Glauber model; however, the results were not sensitive to details of the 11Li wave function. The problem was that the required tail was much greater than that predicted by simple double folding (DF) model calculations, and the DPP corresponding to these models is repulsive in nature, rather than attractive.
Recently, the S?o Paulo potential (SPP) [28-31] has been used to successfully describe the elastic scattering and peripheral reaction channels for a large number of heavy-ion systems in a very wide energy region, as well as to describe the total reaction. In addition, it has been used for analyzing the elastic scattering of stable, weakly bound, and exotic nuclei on a variety of targets [32]. Khoa et al. [33] have generated the rearrangement term (RT) of the nucleon optical potential (OP) to modify the density and energy dependence of the CDM3Yn interactions, which succeeded in reproducing the Airy oscillation.
In this respect, we reanalyze the elastic scattering of 11Li within a two-body model (core+halo) on 28Si at 29 MeV/n and on 12C at 50 and 60 MeV/n in an attempt to obtain an interpretation for the strong refractive effect within the 11Li projectile structure. Our model is based on a semimicroscopic approach. The real part is calculated microscopically by folding several versions of M3Y effective nucleon-nucleon (NN) interaction (DDM3Y and CDM3Y6) in addition to the SPP. Three different densities for the 11Li nucleus in conjunction with one density for 12C and 28Si targets are used. The imaginary part is calculated in the phenomenological Wood-Saxon (WS) form. Moreover, the effect of the RT in cross section calculations is investigated. The present paper is organized as follows. A theoretical formalism is presented in Sec. II, while Sec. III shows the results of analysis and discussion. Finally, concluding remarks are summarized in Sec. IV.
$ U\left(R\right)={U}_{\rm C}\left(R\right)+{N}_{R}{V}_{\rm DF}\left(R\right)+{\rm i}{W}_{v}\left(R\right), $ | (1) |
$ {{\rm{V}}_{{\rm{DF}}}}\left( R \right) =\iint {\rho _{{P}}}\left( {\overrightarrow {{r_1}} } \right){\rho _{{T}}}\left( {\overrightarrow {{r_2}} } \right){v_{NN}}\left( S \right){\rm{d}}\overrightarrow {{r_1}} {\rm{d}}\overrightarrow {{r_2}}, $ | (2) |
$\begin{aligned}[b]{U_{\rm C}}\left( R \right) =& \frac{{{Z_1}{Z_2}{e^2}}}{{2{R_{\rm C}}}}\left( {3 - \frac{{{R^2}}}{{{R_{\rm C}}}}} \right)\;\;\;\;{\rm{for}}\;\;\;\;R \leqslant {R_{\rm C}},\\{\rm{or}}&\;\;\;\;\;\;\frac{{{Z_1}{Z_2}{e^2}}}{{{R_{\rm C}}}}\;\;\;\;{\rm{for}}\;\;\;\;R \geqslant {R_{\rm C}}\end{aligned}$  | (3) |
$ W\left(R\right)=\frac{{W}_{0}}{1+{\rm exp}\left[\dfrac{R-{R}_{i}}{{a}_{i}}\right]}, $ | (4) |
2
A.Nuclear matter density distributions
For the projectile nucleus, three different density distributions are used, all of which consider that the structure of the 11Li nucleus consists of 9Li as the core and two halo neutrons. The first one is the cluster-orbital shell model approximation (COSMA), which can be expressed as [34]$\begin{aligned}[b] \rho \left(r\right)=&{N}_{CX}\frac{\mathrm{e}\mathrm{x}\mathrm{p}\left(-{r}^{2}/{a}^{2}\right)}{{\pi }^{\frac{3}{2}}{a}^{3}}+{N}_{VX}\frac{2\mathrm{e}\mathrm{x}\mathrm{p}\left(-{r}^{2}/{a}^{2}\right)}{3{\pi }^{\frac{3}{2}}{b}^{5}}\\&\times\left[A{r}^{2}+\frac{B}{{b}^{2}}{\left({r}^{2}-\frac{3}{2}{b}^{2}\right)}^{2}\right], \;\; X=Z,N \end{aligned}$ | (5) |
The second density distribution is taken in the semi-phenomenological density (SPD) form, where the total matter density distribution can be taken as
$ \rho \left(r\right)={\rho }_{n}\left(r\right)+{\rho }_{p}\left(r\right) $ | (6) |
$ {\rho }_{n}\left(r\right)={\rho }_{\rm core}\left(r\right)+{\rho }_{\rm tail}\left(r\right). $ | (7) |
$\begin{aligned}[b] {\rho }_{i}\left(r\right)=&\frac{{\rho }_{i}^{0}}{1+{\left[\left(\frac{{1+\left(\dfrac{r}{R}\right)}^{2}}{2}\right)\right]}^{{\alpha }_{i}}\left[\mathrm{e}\mathrm{x}\mathrm{p}\left(\dfrac{\left(r-R\right)}{{a}_{i}}\right)+\mathrm{e}\mathrm{x}\mathrm{p}\left(\dfrac{-\left(r+R\right)}{{a}_{i}}\right)\right]},\\ i=&p,n \end{aligned}$ | (8) |
$ 4\pi \int {\rho }_{n}\left(r\right){r}^{2}{\rm d}r=N , $ | (9) |
$ 4\pi \int {\rho }_{p}\left(r\right){r}^{2}{\rm d}r=Z , $ | (10) |
$ {\rho }_{\rm tail}\left(r\right)={N}_{0}\left(\frac{{r}^{2}}{{\left({r}^{2}+{R}^{2}\right)}^{2}}\right)\mathrm{e}\mathrm{x}\mathrm{p}\left(\frac{-r}{{a}_{t}}\right), $ | (11) |
$ 4\pi \int {\rho }_{\rm tail}\left(r\right){r}^{2}{\rm d}r=2, $ | (12) |
For 12C and 28Si target nuclei, only the two-parameter Fermi model (FM) is used [38]
$ {\rho }_{T}^{^{12}{\rm C}\left(^{28}{\rm Si}\right)}=\frac{0.207\left(0.175\right)}{1+\mathrm{e}\mathrm{x}\mathrm{p}\left[\left(\dfrac{r-2.1545\left(3.15\right)}{0.425\left(0.475\right)}\right)\right]}, $ | (13) |
2
B.NN effective interactions
Based on the M3Y interaction, which is designed to reproduce the G-matrix elements for Paris and Reid [39, 40] effective NN interactions, two versions of the M3Y effective NN interaction are used. These versions depend on two different forms of the density and energy-dependence (DDM3Y and CDM3Y6). In addition to the SPP, the CDM3Y6 interaction, which was recently modified by the RT [33], is also used. The first method is the DDM3Y effective interaction, defined as [38]$ \upsilon \left(E, \rho ,S\right)=g\left(E, S\right)F\left(E, \rho \right), $ | (14) |
$ F\left(E, \rho \right)=C\left(E\right)\left[1+\alpha \left(E\right)\mathrm{e}\mathrm{x}\mathrm{p}(-\beta \left(E\right)\rho )\right], $ | (15) |
$ g\left(E, S\right)={\upsilon }_{D}\left(R\right)+{{\hat J}}\left(E\right)\delta \left(S\right), $ | (16) |
${{\hat J}}\left( E \right) = - 276\left[ {1 - 0.005\left( {E/A} \right)} \right]\;{\rm{MeV}}.{\rm{f}}{{\rm{m}}^3},$  | (17) |
${\upsilon _D}\left( R \right) = \left[ {11062\frac{{{\rm{exp}}( - 4R)}}{{4R}} - 2538\frac{{{\rm{exp}}( - 2.5R)}}{{2.5R}}} \right]\;{\rm{MeV.}}$  | (18) |
$ {\upsilon }_{D\left(Ex\right)}\left(\rho ,R\right)=g\left(E\right)F\left(\rho \right){\upsilon }_{D\left(Ex\right)}\left(R\right), $ | (19) |
$\begin{aligned}[b]{\upsilon }_{Ex}\left(R\right)=&\left[-1524\frac{\mathrm{e}\mathrm{x}\mathrm{p}(-4R)}{4R}-518.8\frac{\mathrm{e}\mathrm{x}\mathrm{p}(-2.5R)}{2.5R}\right.\\&\left.-7.847\frac{\mathrm{e}\mathrm{x}\mathrm{p}(-0.7072R)}{0.7072R}\right]\;{\rm{MeV}},\end{aligned}$  | (20) |
$ F\left(\rho \right)=0.2658\left[1+3.8033\mathrm{e}\mathrm{x}\mathrm{p}\left(-1.41\rho \right)-4.0 \rho \right], $ | (21) |
$g\left( E \right) = \left[ {1 - 0.003\left( {E/A} \right)} \right].$ | (22) |
$ \varDelta F\left(\rho \right)=1.5\left[\mathrm{e}\mathrm{x}\mathrm{p}\left(-0.833 \rho \right)-1\right]. $ | (23) |
$ V\left(R,E\right)={V}_{F}\left(R\right)\mathrm{e}\mathrm{x}\mathrm{p}\left(-4{\beta }^{2}\right), $ | (24) |
${\chi ^2} = \frac{1}{N}\sum\nolimits_{K = 1}^N {{{\left[ {\frac{{{\sigma _{\rm th}}\left( {{\theta _K}} \right) - {\sigma _{\rm ex}}\left( {{\theta _K}} \right)}}{{\Delta {\sigma _{\rm ex}}\left( {{\theta _k}} \right)}}} \right]}^2}}, $ | (25) |
A.Potentials and densities
The radial shapes of the considered different types of density distributions of 11Li are shown in Fig. 1, in linear and logarithmic scale. The corresponding calculated rms radii of protons, neutrons, and matter for all used density distributions of the 11Li nucleus are listed in Table 1, as compared with previous works and experimental data. The present results agree with the previous calculations that predict a long tail halo for the 11Li nucleus, in comparison with the experimental data, as summarized in Table 1. Further, our calculations agree well with the previous rms values; however, there is a slight difference compared with the experimental data. Moreover, previous studies have extracted these quantities [24, 48-51], which agree with the present calculations, but it is noticed that, in the important study of Mermaz [24], the value Figure1. (color online) The densities of 11Li with logarithmic and linear scales.
| density | Rp | Rn | Rrms | |||||
| calc. | Ref. | calc. | Ref. | calc. | Ref. | |||
| COSMA | 2.32 | 2.32 [35] | 3.62 | 3.318 | 3.21 [51] | |||
| SPD | 2.16 | 2.17 [36] | 3.67 | 3.67 [36] 3.21 [13] | 3.325 | 3.32 [36] 3.12 [1, 13] | ||
| HF | 2.24 | 3.08 | 2.872 | 2.846 [48] | ||||
| exp. | 2.88  | 3.21  | 3.12  | |||||
Table1.Calculated rms proton (Rp), neutron (Rn), and mass (Rrms) radii in fermis for the three NM densities of the 11Li nucleus.
The results of the considered density distributions are illustrated in Fig. 1. It can be seen that COSMA density has a larger value than those of the SPD and HF at small distances (r ≤ 1 fm), while the latter density has the smallest value. At large distances (r ≥ 10 fm), we can see that all the used densities have a long tail due to the structure of 11Li as a core with two valence neutrons. The SPD density has the longest tail, so it gives a successful description for the largest radius of 11Li. In contrast, investigation of the halo densities for the 11Li nucleus and the considered NN effective interaction effects is performed through the calculation of the DF potential of Eq. (2). The real parts of the OPs are calculated with the DDM3Y, CDM3Y6, and CDM3Y6-RT effective NN interactions in addition to the SPP folded with the considered three densities, COSMA, SPD, and HF, at energies of 50 and 60 MeV/n, for 11Li scattered by 12C, and at 29 MeV/n, for the 11Li+ 28Si system. The physical observations related to the resulted potentials for 12C at an energy of 60 MeV/n are presented in Table 2 and Fig. 2, as one case.
| E/(MeV/n) | density | -J/(MeV fm3) | Rrms/fm | |||||||
| CDM3Y6 | CDM3Y6-RT | SPP | DDM3Y | CDM3Y6 | CDM3Y6-RT | SPP | DDM3Y | |||
| 11Li + 12C | ||||||||||
| 50 | COSMA | 301.12 | 271.42 | 271.0 | 252.74 | 4.692 | 4.88 | 4.40 | 4.789 | |
| SPD | 300.84 | 271.28 | 275.5 | 251.99 | 4.691 | 4.86 | 4.45 | 4.772 | ||
| HF | 302.57 | 274.86 | 271.4 | 254.37 | 4.272 | 4.41 | 4.03 | 4.358 | ||
| 60 | COSMA | 281.71 | 256.50 | 254.5 | 235.63 | 4.694 | 4.89 | 4.39 | 4.799 | |
| SPD | 281.50 | 262.70 | 257.1 | 234.99 | 4.693 | 4.87 | 4.33 | 4.772 | ||
| HF | 283.31 | 259.91 | 253.2 | 237.43 | 4.278 | 4.42 | 3.90 | 4.360 | ||
| 11Li + 28Si | ||||||||||
| 29 | COSMA | 358.79 | 311.71 | 314.7 | 297.64 | 5.128 | 5.31 | 4.79 | 5.20 | |
| SPD | 358.07 | 311.30 | 309.4 | 296.43 | 5.127 | 5.29 | 4.65 | 5.18 | ||
| HF | 359.04 | 314.73 | 314.1 | 297.49 | 4.737 | 4.87 | 4.45 | 4.81 | ||
Table2.The calculated volume integrals and rms radii of the folded potentials for 11Li+12C, 28Si systems at 50 and 60 MeV/n for 12C and 29 MeV/n for 28Si, using the four NN effective interactions with the three densities without NR.
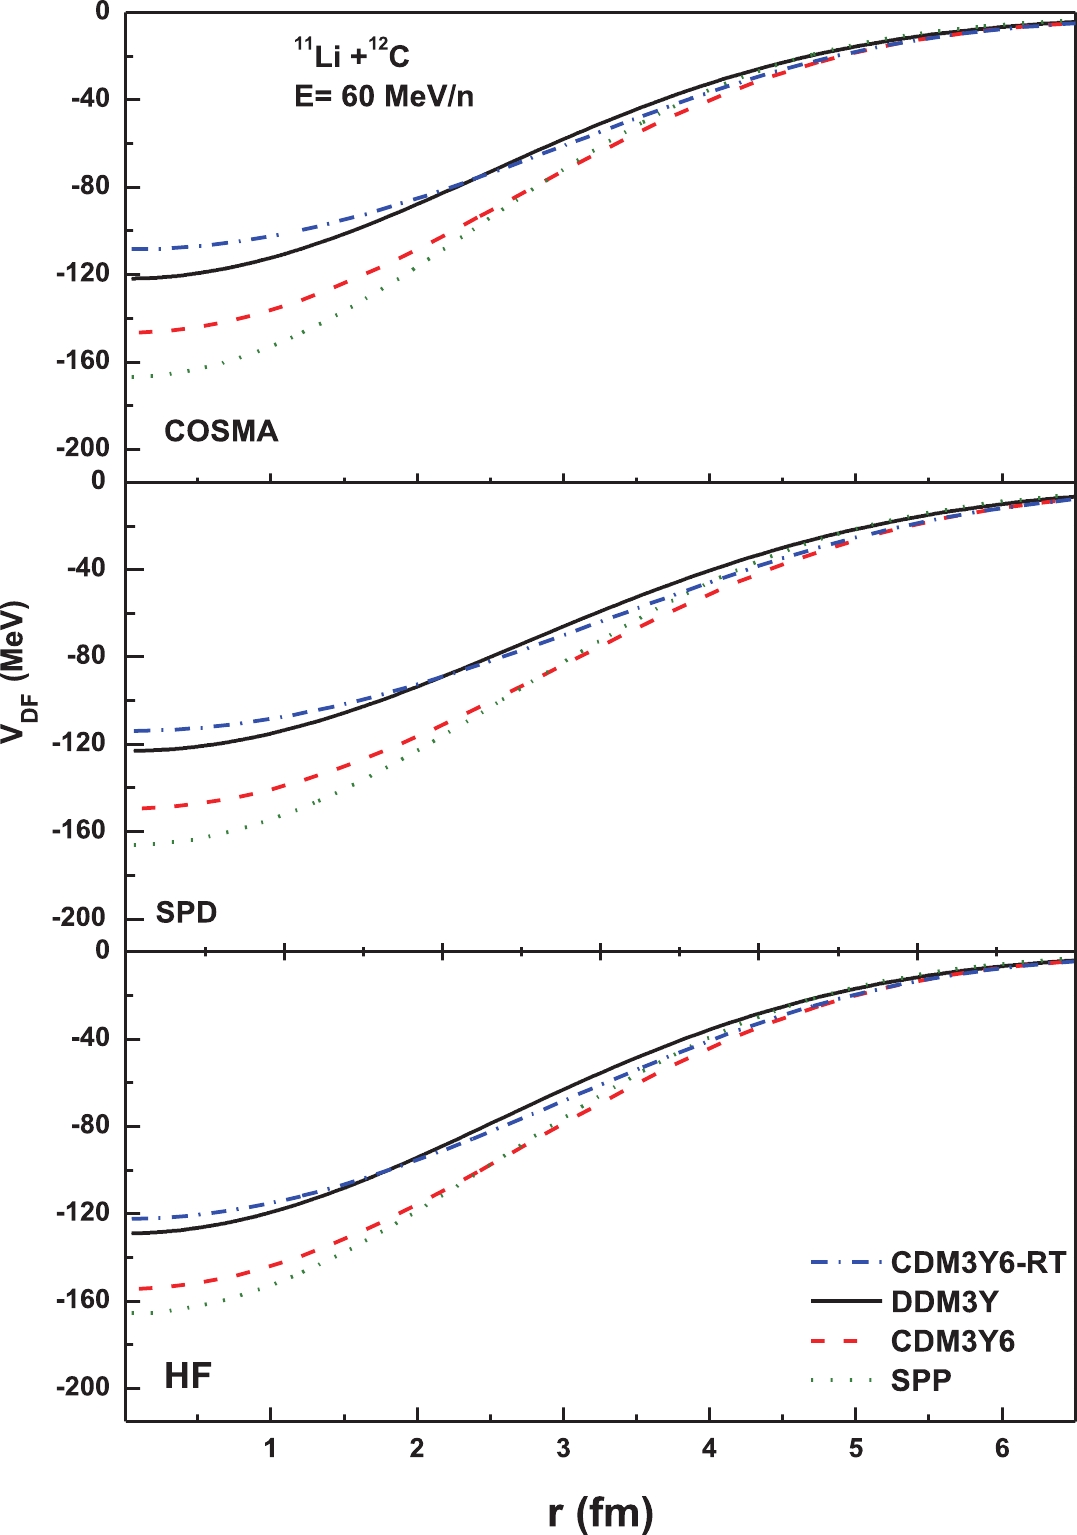 Figure2. (color online) The real DF for 11Li+12C at 60 MeV/n using the three densities with DDM3Y, CDM3Y6, and CDM3Y6-RT effective NN interactions and the SPP with NR=1.0 with a linear scale.
The folded potentials in the present work are calculated as a sum of two parts for projectile (11Li) density, and halo (neutrons) density plus core density is folded with target density and NN effective interaction. The effects of different densities of 11Li structure and the considered effective interaction on our potential model represent our focused study point.
Generally, as we have seen from Fig. 2 and Table 2, the folded potentials using the considered densities and effective interaction have approximately the same depths and behavior for the density-dependent effective NN interaction with a slight difference. From Table 2, we notice that the long potential rms is to be achieved with COSMA and SPD densities, CDM3Y6-RT, and DDM3Y effective interactions, while the smallest potential tail is to be achieved with HF density, SPP, and CDM3Y6 effective interactions. In addition, the energy dependence for the real potential volume integral of the 12C target is observed, where it decreases with increasing energy. Fig. 2 confirms these results, where the SPP gives the largest depth compared to those using the DDM3Y and CDM3Y6, while CDM3Y6-RT gives the smallest value among all; this arises in the interior region at r (r
2
B.Differential cross sections
Many attempts have been made to generate appropriate OPs for analyzing the angular distribution cross section of 11Li projectile reactions. The result drawn from all previous theoretical studies [19, 23-27] is that the nearside/farside interference minimum is missing or greatly attenuated in the elastic scattering of 11Li with low-Z targets at intermediate energies. The presence of a sharp minimum at 40 in the calculated angular distributions was due to the contamination by 9Li ions resulting from projectile breakup [22]. The successful theoretical work that explained this discrepancy at forward angles was proposed by Mermaz [24] using phenomenological potential with coupling for low excited inelastic channels and many adjusted free parameters.The same type of analysis as previously used has been presented, that is, the one with WS potential. To improve the agreement with the considered experimental data, we employ the widely used phenomenological WS potential with six parameters. More parameters in such a famous model means more flexibility in order to obtain the best fit that can be used later as a guide. The elastic scattering for the 11Li nucleus from 12C at the two energies, 50 and 60 MeV/n, and that from 28Si at 29 MeV/n have been analyzed in the framework of the conventional optical model by using the standard WS form, as in Eq. (4). Moreover, a semi-microscopic optical DF folding potential has been generated to study the sensitivity of NN interaction, as well as the form of the halo density distributions of 11Li on reaction differential cross sections. The obtained results are listed in Tables 3 to 5 and shown in Figs. 3 to 6.
| E/(MeV/n) | V/MeV | rv/fm | av/fm | W/MeV | ri/fm | ai/fm | -J/(MeV fm3) |   |   | |
| JR | JI | |||||||||
| 11Li + 12C | ||||||||||
| 50 | 116.4 | 0.83 | 0.81 | 2.83 | 2.19 | 0.057 | 286.03 | 86.68 | 13.0 | 2009 |
| 60 | 295.92 | 0.21 | 1.35 | 20.72 | 0.92 | 1.20 | 233.33 | 86.12 | 5.2 | 1400 |
| 11Li + 28Si | ||||||||||
| 29.0 | 261.91 | 0.41 | 1.78 | 7.029 | 2.29 | 0.362 | 201.57 | 33.05 | 2.96 | 1495 |
Table3.Best fit OP parameters of the WS model.
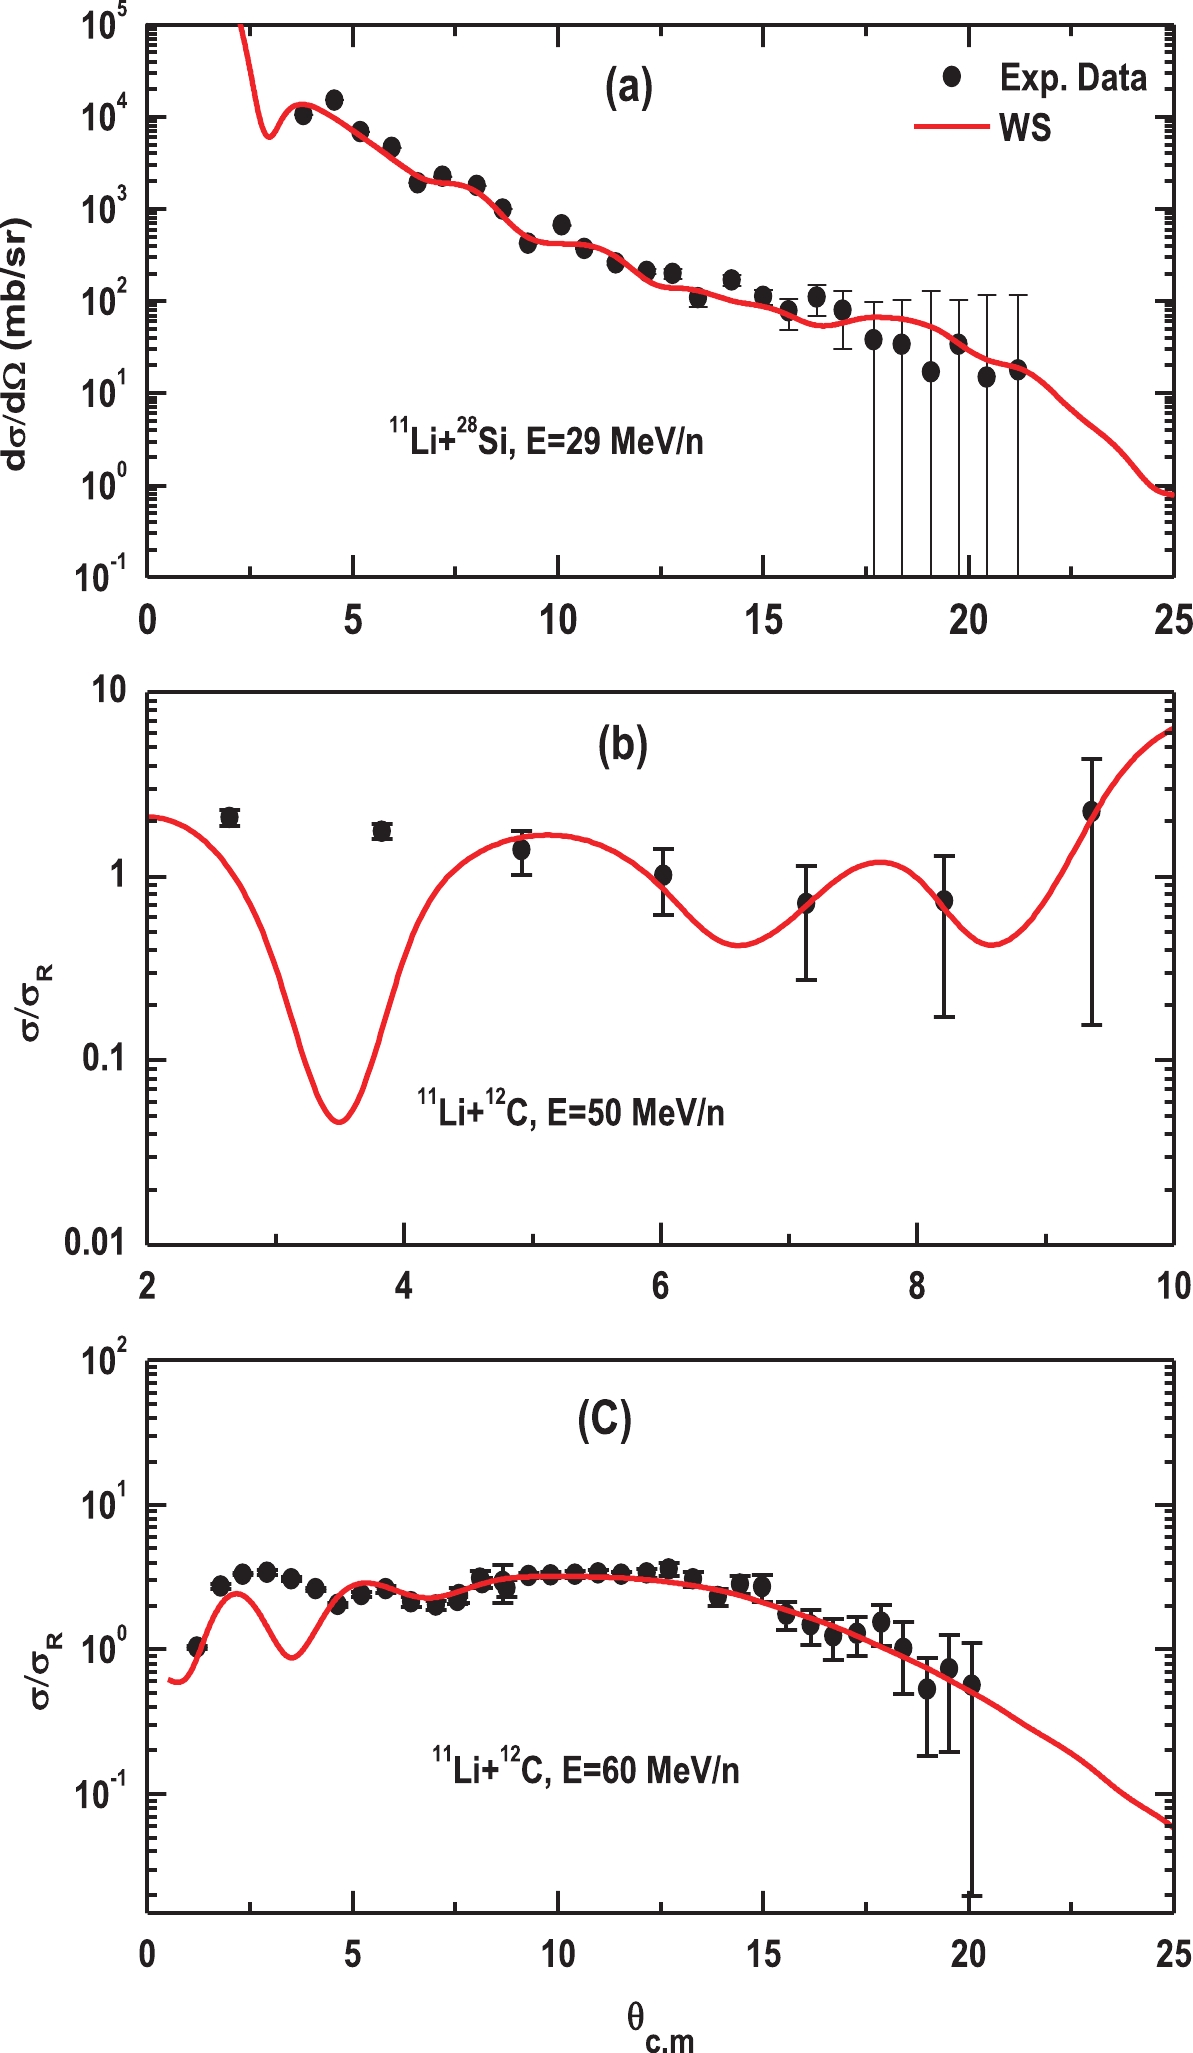 Figure3. (color online) The best fit angular distribution of 11Li scattered elastically from 12C and 28Si calculated with the WS potential model. The symbol represents the experimental data taken from Refs. [20-22].
| E/(MeV/n) | density | potential | NR | -J/(MeV fm3) | W/MeV | ri/fm | ai/fm |   |   | |
| JR | JI | |||||||||
| 29 | COSMA | CDM3Y6-RT | 0.64 | 198.76 | 45.12 | 14.69 | 2.188 | 0.767 | 4.53 | 1460 |
| DDM3Y | 0.82 | 242.49 | 52.12 | 15.65 | 2.235 | 0.709 | 4.53 | 1528 | ||
| CDM3Y6 | 0.69 | 247.20 | 50.45 | 15.40 | 2.227 | 0.728 | 4.60 | 1518 | ||
| SPP | 0.899 | 282.99 | 46.04 | 14.79 | 2.198 | 0.772 | 5.00 | 1485 | ||
| SPD | CDM3Y6-RT | 0.62 | 193.58 | 45.23 | 15.73 | 2.174 | 0.795 | 5.31 | 1457 | |
| DDM3Y | 0.81 | 238.51 | 51.81 | 15.61 | 2.234 | 0.718 | 5.01 | 1527 | ||
| CDM3Y6 | 0.68 | 243.41 | 50.53 | 15.60 | 2.220 | 0.740 | 5.34 | 1516 | ||
| SPP | 0.896 | 277.11 | 46.15 | 14.82 | 2.198 | 0.770 | 5.85 | 1483 | ||
| HF | CDM3Y6-RT | 0.58 | 181.83 | 45.95 | 16.60 | 2.128 | 0.849 | 6.37 | 1442 | |
| DDM3Y | 0.77 | 229.06 | 52.00 | 16.11 | 2.218 | 0.736 | 5.62 | 1517 | ||
| CDM3Y6 | 0.64 | 233.83 | 50.95 | 16.16 | 2.204 | 0.750 | 6.22 | 1504 | ||
| SPP | 0.87 | 273.86 | 51.08 | 17.76 | 2.148 | 0.803 | 7.17 | 1481 | ||
Table5.The best fit parameters for the elastic scattering data for the 11Li+28Si system at an energy of 29 MeV/n using NN interaction (DDM3Y, CDM3Y6, CDM3Y6-RT, and SPP) with the considered three densities (COSMA, SPD, and HF).
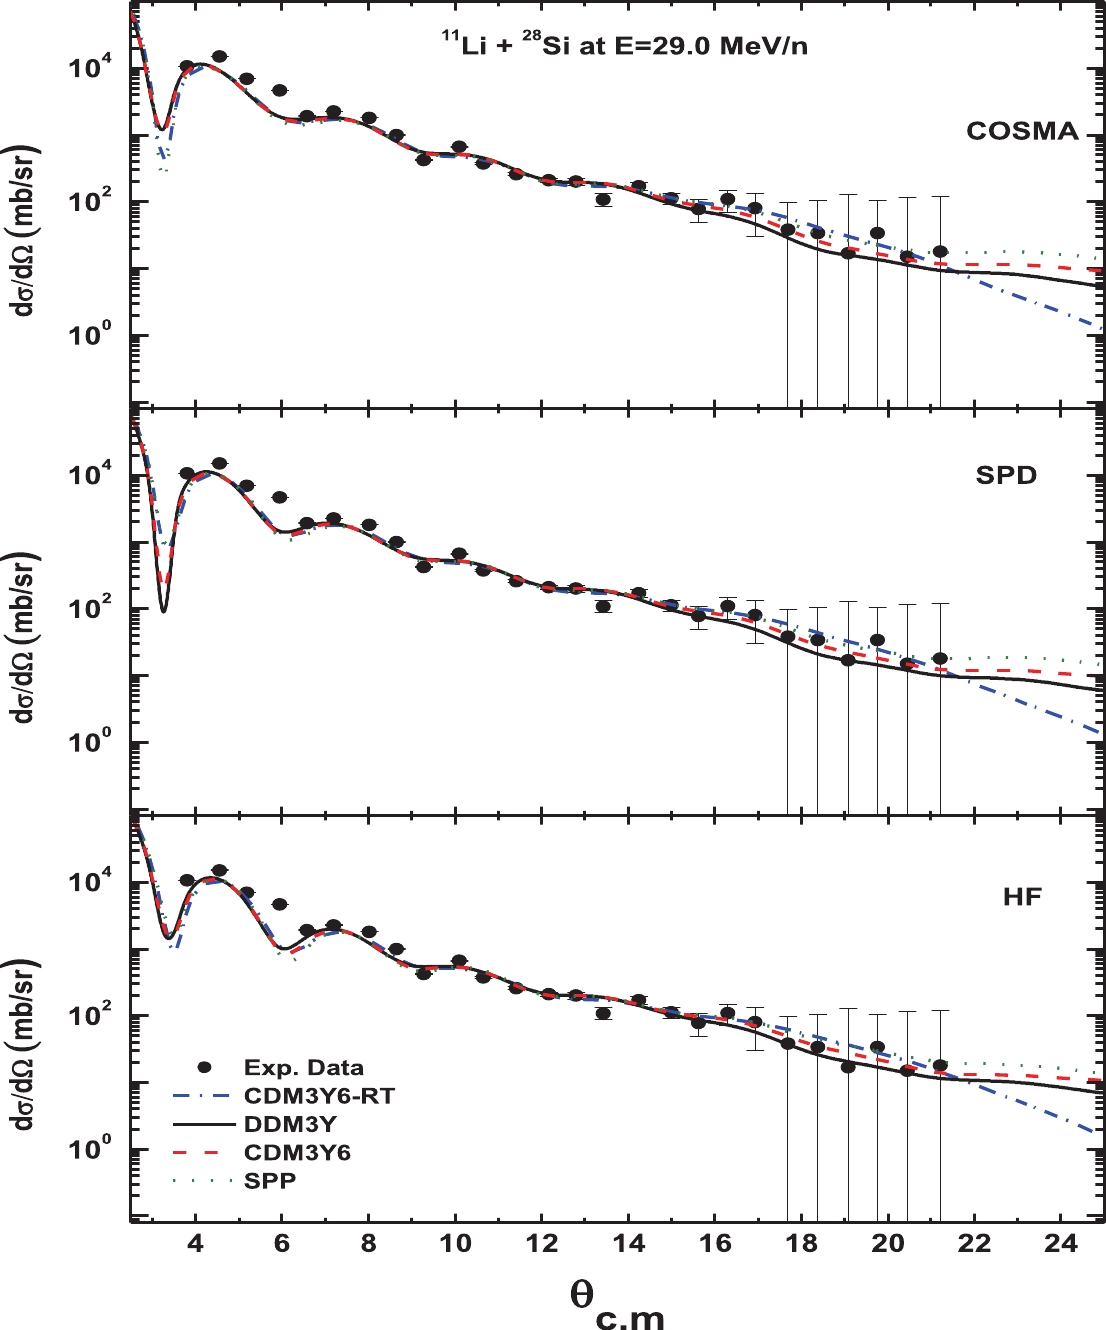 Figure6. (color online) Same as Fig. 4, but for the elastic scattering of 11Li from 28Si at energy 29 MeV/n. The experimental data are taken from Ref. [21].
The results of angular distributions obtained using the WS optical model are compared with experimental data in Fig. 3, and their potential parameters are listed in Table 3. As shown in Fig. 3(a), the best fit with experimental data has been achieved for the 28Si target without an anomaly at near or far angles. The results are more successful than those of previous studies that used a combination of elastic and inelastic parts to achieve a reasonable result [21]. In contrast, a reasonable fit with data has been obtained for the 12C target at the two energies, 50 and 60 MeV/n, as shown in Fig. 3(b, c), but with a sharp minimum between
The results displayed in Tables 4 and 5 as well as Figs. 4 to 6 have been obtained using the semi-microscopic potentials. Firstly, it is noticed that the NR coefficients are close to one, i.e., 1.0±0.01 for energies 50 and 60 MeV/n for the 12C target and 0.8±0.01 for the 28Si target, providing a satisfactory agreement with experimental data. These results are more successful than those achieved in previous studies that used the CC model [21], quasielastic potential [26], Glauber of four body model [27], the breakup effect [51], and the JLM potential [53].
| E/(MeV/n) | density | potential | NR | -J/(MeV fm3) | W/MeV | ri/fm | ai/fm |   |   | |
| JR | JI | |||||||||
| 50 | COSMA | CDM3Y6-RT | 1.18 | 320.27 | 104.23 | 4.529 | 1.889 | 1.122 | 11.17 | 2300 |
| DDM3Y | 1.15 | 289.27 | 105.71 | 4.926 | 1.840 | 1.124 | 14.60 | 2273 | ||
| CDM3Y6 | 0.92 | 278.36 | 95.06 | 4.393 | 1.852 | 1.092 | 12.96 | 2146 | ||
| SPP | 0.86 | 233.51 | 80.11 | 4.727 | 1.675 | 1.169 | 14.72 | 1872 | ||
| SPD | CDM3Y6-RT | 1.16 | 314.55 | 105.07 | 4.217 | 1.959 | 1.041 | 13.97 | 2324 | |
| DDM3Y | 1.13 | 283.91 | 110.30 | 4.724 | 1.905 | 1.086 | 17.36 | 2356 | ||
| CDM3Y6 | 0.91 | 274.07 | 99.950 | 4.219 | 1.925 | 1.031 | 15.68 | 2229 | ||
| SPP | 0.93 | 257.02 | 100.27 | 4.818 | 1.799 | 1.225 | 16.45 | 2236 | ||
| HF | CDM3Y6-RT | 1.06 | 291.83 | 103.05 | 3.900 | 2.019 | 0.918 | 14.57 | 2290 | |
| DDM3Y | 1.06 | 270.07 | 111.37 | 4.382 | 1.977 | 1.012 | 17.85 | 2389 | ||
| CDM3Y6 | 0.87 | 261.79 | 101.15 | 3.946 | 1.994 | 0.946 | 16.20 | 2258 | ||
| SPP | 0.85 | 229.75 | 94.16 | 4.150 | 1.867 | 1.188 | 18.21 | 2190 | ||
| 60 | COSMA | CDM3Y6-RT | 1.18 | 303.45 | 136.83 | 50.00 | 0.674 | 1.371 | 6.21 | 1737 |
| DDM3Y | 1.20 | 283.39 | 124.32 | 49.57 | 0.650 | 1.342 | 6.03 | 1625 | ||
| CDM3Y6 | 0.94 | 264.15 | 116.92 | 44.16 | 0.725 | 1.214 | 5.82 | 1484 | ||
| SPP | 0.85 | 215.98 | 92.40 | 39.03 | 0.750 | 1.032 | 6.61 | 1187 | ||
| SPD | CDM3Y6-RT | 1.12 | 293.94 | 140.90 | 60.06 | 0.569 | 1.459 | 7.19 | 1811 | |
| DDM3Y | 1.18 | 276.33 | 126.92 | 53.02 | 0.607 | 1.400 | 6.76 | 1678 | ||
| CDM3Y6 | 0.92 | 258.60 | 120.01 | 47.52 | 0.684 | 1.269 | 6.50 | 1536 | ||
| SPP | 0.85 | 213.14 | 95.12 | 39.81 | 0.742 | 1.066 | 6.74 | 1228 | ||
| HF | CDM3Y6-RT | 1.05 | 272.94 | 137.63 | 50.00 | 0.676 | 1.373 | 7.73 | 1741 | |
| DDM3Y | 1.07 | 254.89 | 131.36 | 84.24 | 0.384 | 1.490 | 7.33 | 1720 | ||
| CDM3Y6 | 0.84 | 238.26 | 124.09 | 67.91 | 0.517 | 1.355 | 7.11 | 1572 | ||
| SPP | 0.80 | 204.70 | 101.33 | 50.90 | 0.628 | 1.182 | 7.24 | 1313 | ||
Table4.The best fit parameters obtained for elastic scattering data for the 11Li+12C system at energies of 50 and 60 MeV/n using NN interaction (DDM3Y, CDM3Y6, CDM3Y6-RT, and SPP) with the considered three densities (COSMA, SPD, and HF).
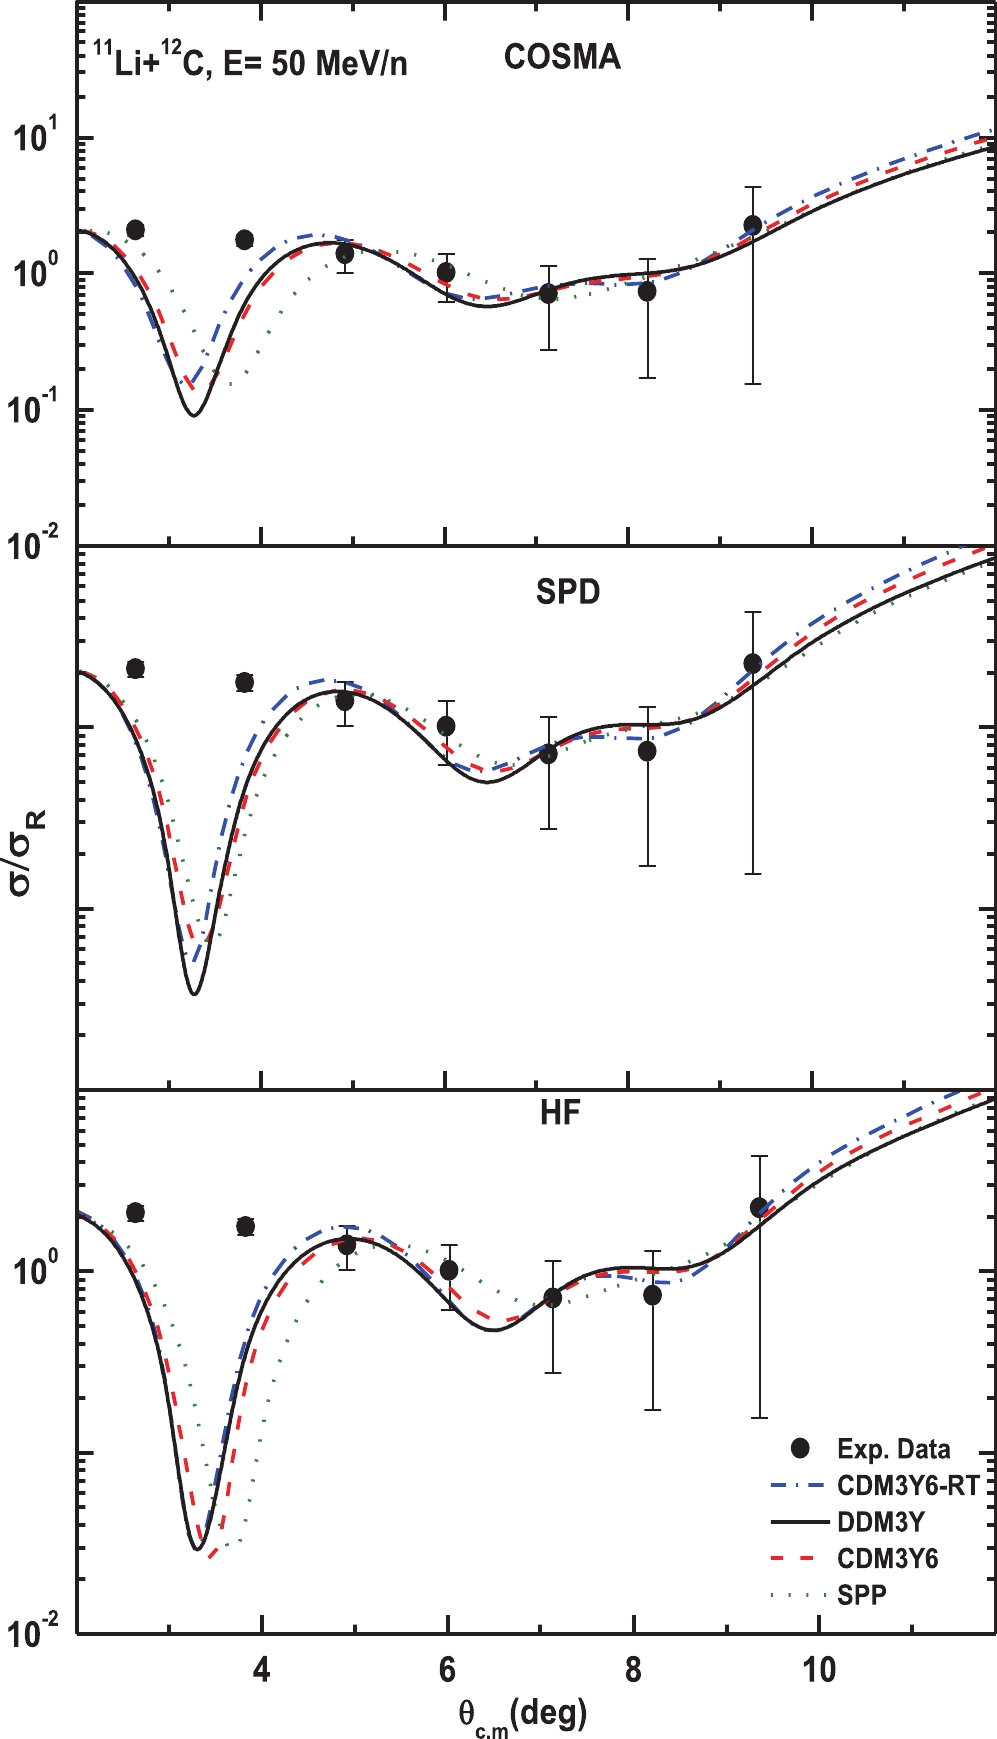 Figure4. (color online) The best fit angular distributions of elastic scattering of 11Li from 12C at 50 MeV/n calculated with the semi-microscopic real DF potentials, CDM3Y6-RT (dashed-dotted line), DDM3Y (sold line), CDM3Y6 (dashed line), and SPP (dotted line). The symbol is a representation of the experimental data from Ref. [22]. Upper panel for COSMA density, middle panel for SPD density, and bottom panel for HF density.
Generally, the results corresponding to Figs. 4 to 6 show that the considered effective interactions and densities predict the best agreement with the experimental results. It is clear that the three angular distributions resulting from DDM3Y, DDM3Y6, and DDM3Y6-RT are very similar to each other; however, a small shift in the forward angle between (2.5)0 and 40 for SPP is noticed.
Figure 4 shows the results in comparison with the measured experimental data for the 12C target at an energy of 50 MeV/n, where the agreement with the data is reasonable and is of higher quality than that obtained from the quasielastic calculation of Peterson et al. [22]. Likewise, Fig. 5 shows the good agreement of the predictions of our calculations with the experimental data for the 12C target at an energy of 60 MeV/n, in comparison with those from previous attempts by many authors [26, 27, 52, 53]. Meanwhile, the same results for the 28Si target at an energy of 29 MeV/n, which agree more with the experimental data than the results of [21, 48, 53, 54], have been obtained, as shown in Fig. 6. Despite the success achieved in the data analysis for practical data, anomalies at small angles still exist. In this angular range, the optical model amplitude is insensitive to the potential used due to a breakdown of the optical model in the explanation of the small-angle cross section for the halo nucleus, which could be attributed to the extreme peripheral nature of these reactions at intermediate energies due to the surface transparent potential.
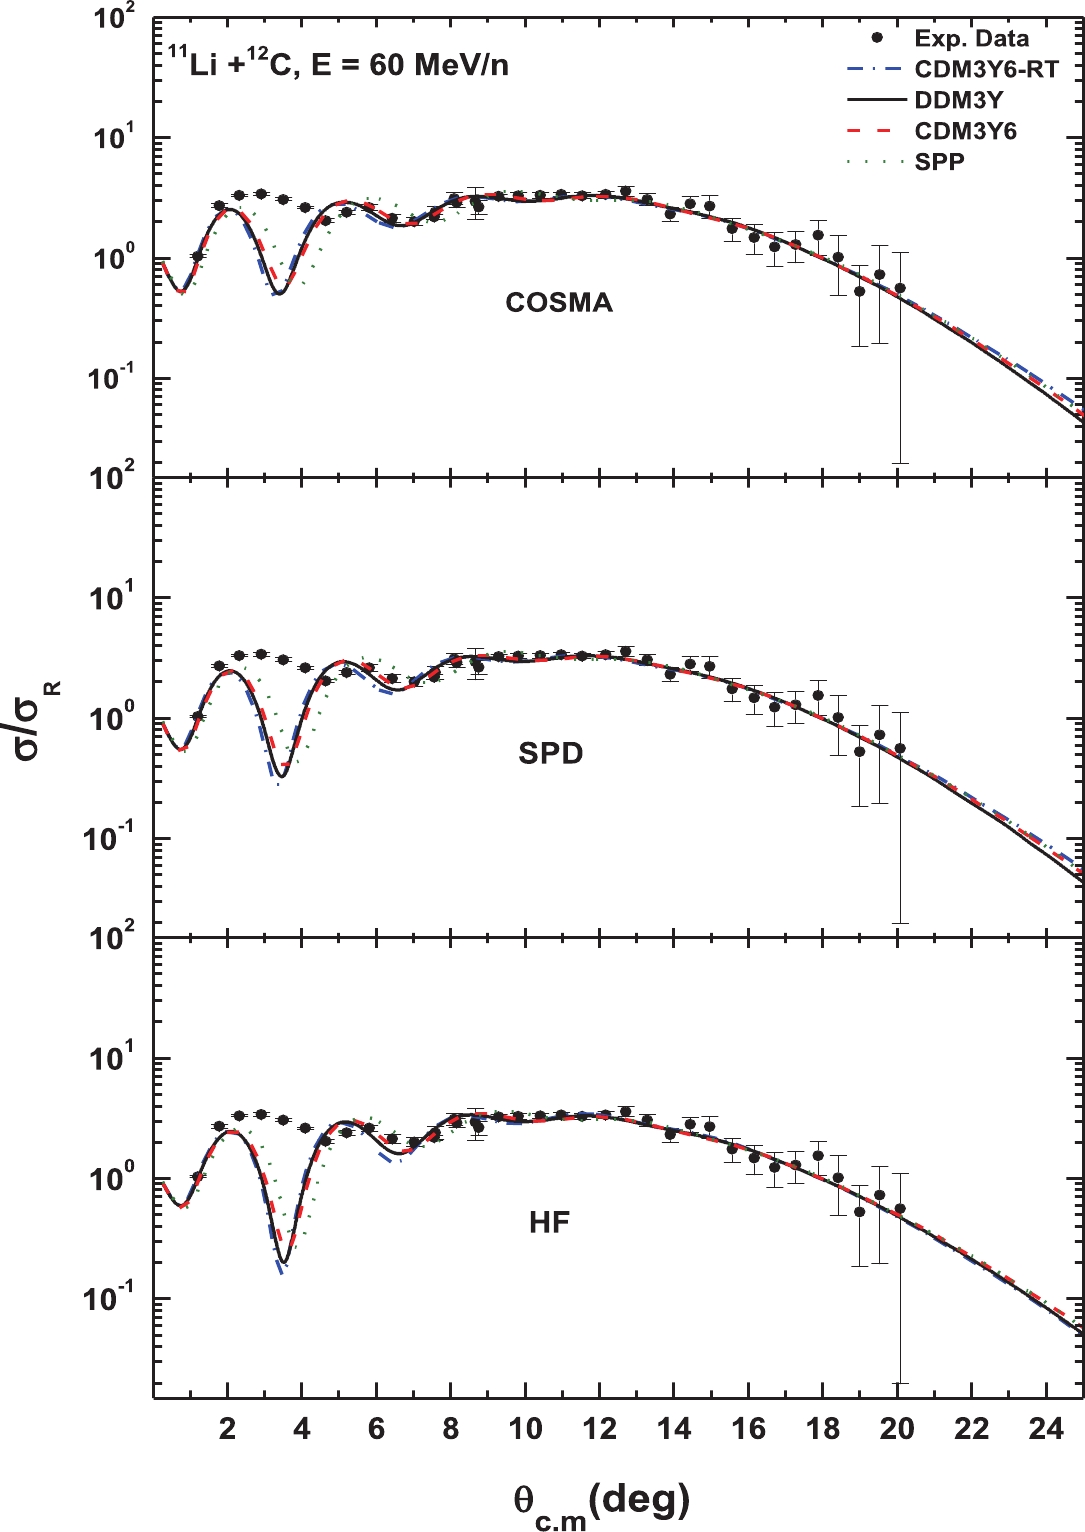 Figure5. (color online) Same as Fig. 4, but for energy 60 MeV/n. The experimental data are taken from Ref. [20].
2
C.Total reaction cross sections
In order to understand the formation of a halo around the core of radioactive nuclei, which is very difficult, it is useful to study the reaction cross section (RCS) in addition to differential cross sections of the exotic nucleus 11Li from targets. The RCS| target | E/A | present cal. | previous | |
| cal. | exp. | |||
| 12C | 30 | 2942 ±2 | 1710 [23] | 2947 [55] |
| 50 | 2238.58±10.68 | ? | ? | |
| 60 | 1552.67±16.79 | 1274±30 [26] 1391±35 [19] 1520 [52] | 1500±50 [56, 57] | |
| 75 | 1449±3 | 1401 [26] | 1430±60 [56] | |
| 87.0 | 1264 ±2 | 1264 [26] | 1260±40 [57] | |
| 28Si | 29 | 1493.17±2.45 | 1402 [21] 1970 [48] 1520 [52] | 2947±386a [48] |
| a Measured at 25.5 MeV/n. | ||||
Table6.The calculated mean value and the previous calculations comparable to the experimental results of the reaction cross section
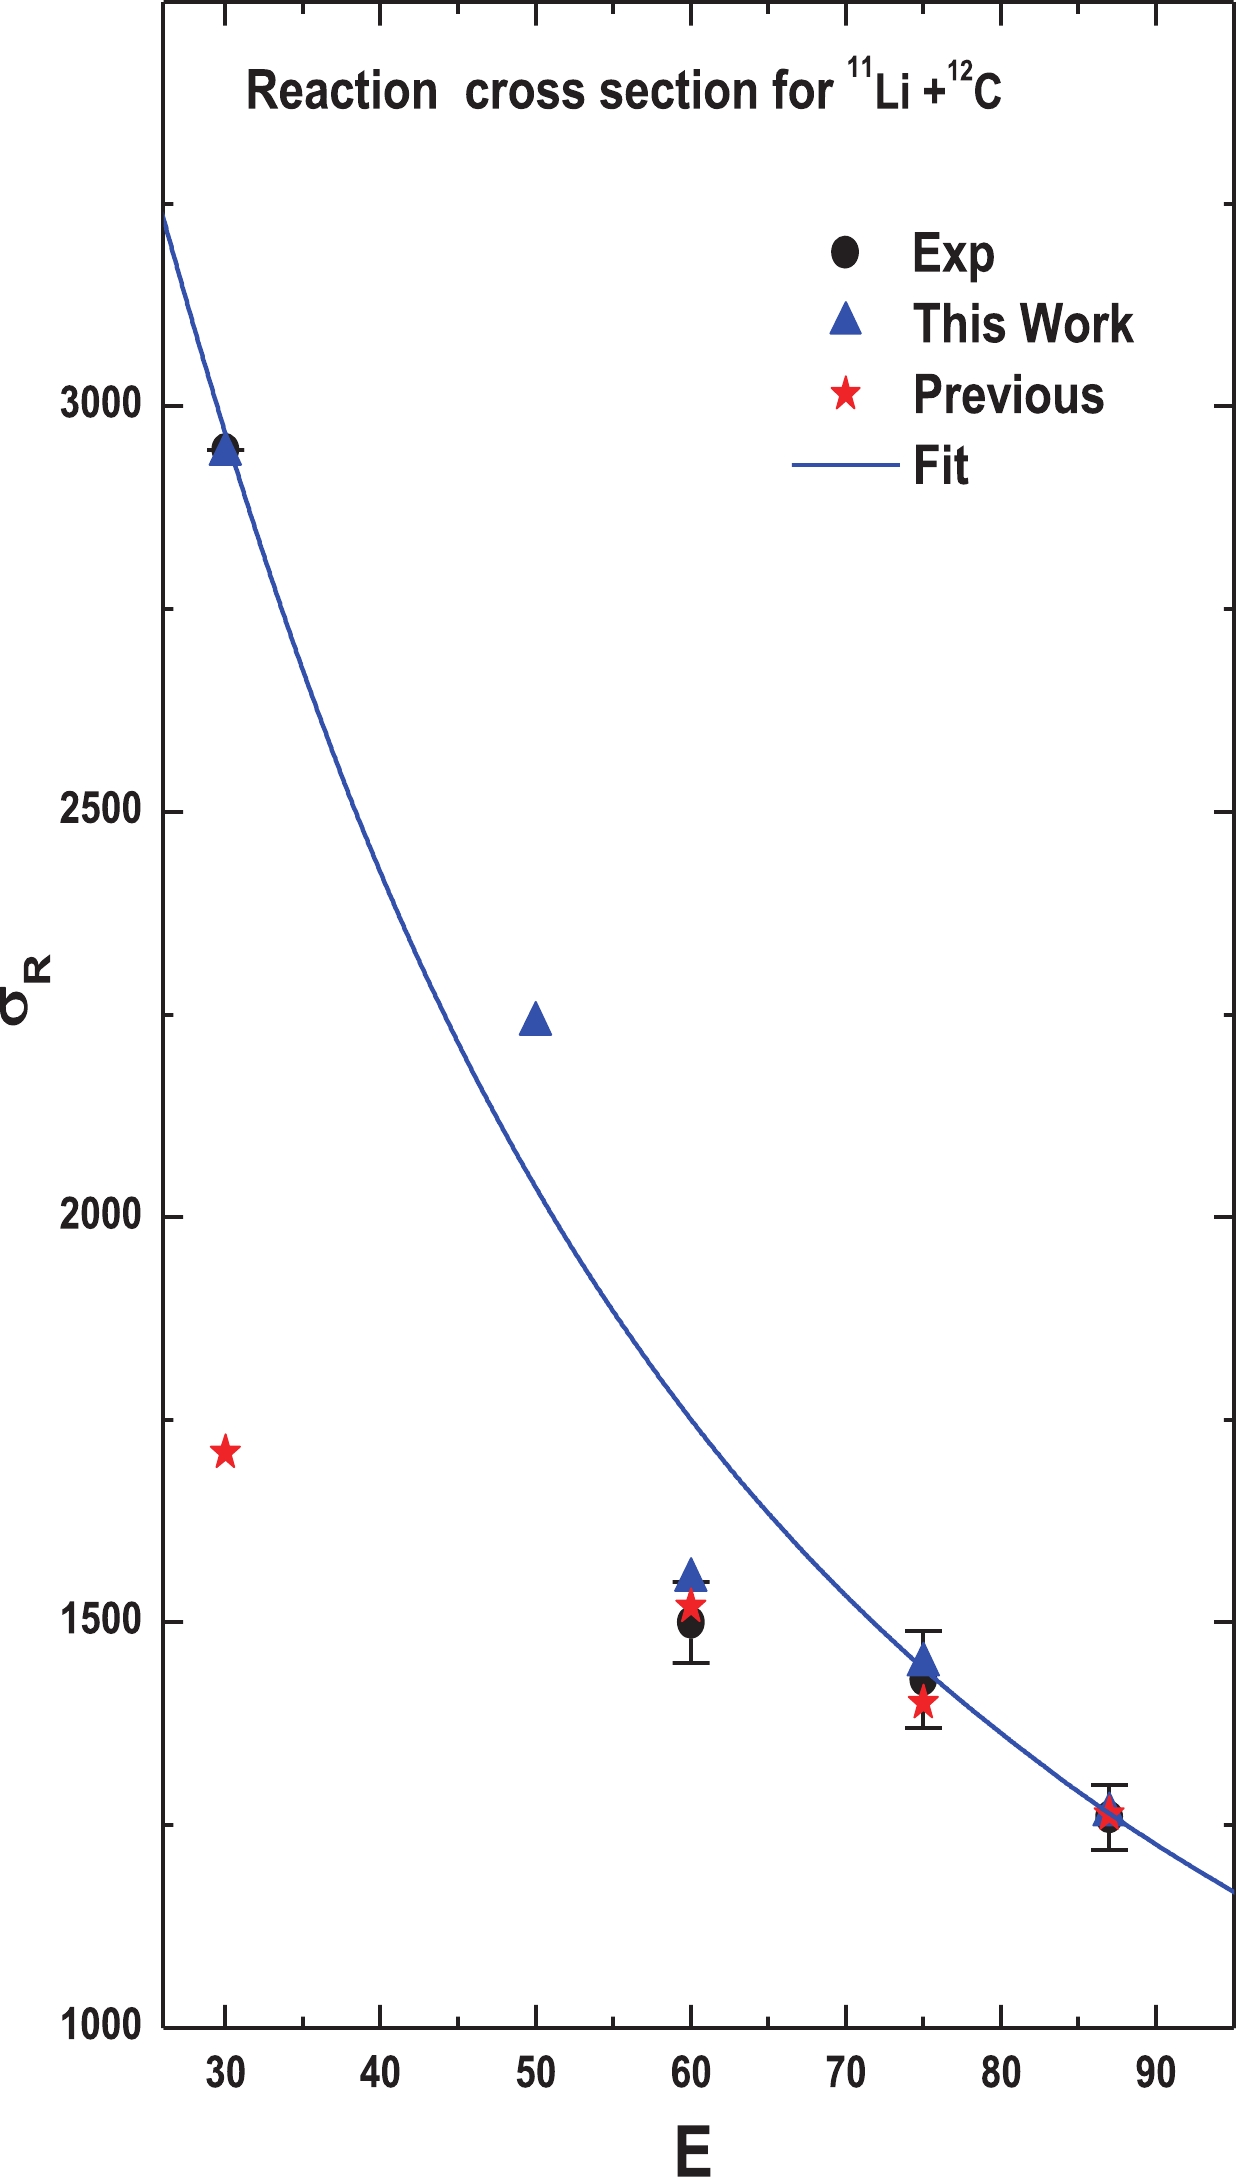 Figure7. (color online) Energy dependence of the reaction cross section in the optical limit of the DF model using the present model for 11L+12C. The triangles denote the mean obtained results with considered potentials, the star shapes denote the previous calculations, and the circles denote the experimental data taken from Refs. [48, 55-57].
As seen in Table 6, the present calculated
$ {\sigma }_{R}^{\rm cal.}\left(E\right)=1.3 \pi {\left({A}_{p}^{\frac{1}{3}}+{A}_{T}^{\frac{1}{3}}\right)}^{2}\left(\frac{1459.4}{E}-\frac{11621.4}{{E}^{2}} \right),$  | (i26) |
In the context of the DF optical model potential and as an extension of our studies [58-60], the elastic scattering of 11Li+12C and 11Li+28Si has been reanalyzed. The nucleus-nucleus interaction potential has been constructed microscopically from folding the density-dependent effective NN interactions DDM3Y, CDM3Y6, and SPP over the NM distributions of the interacting nuclei. The resulting potentials are used as the real part of the OP, while the imaginary component is treated phenomenologically through the WS form to calculate the angular distributions of the elastic scattering differential cross sections. Successful predictions were obtained by using our potentials generated for different energies within the measured angular ranges. The results indicate that using a unified energy dependent real potential is adequate to successfully fit the data in the considered energy range. Looking at the chi-square values mentioned in the above tables, we found that, with different versions for the NM density of the lithium nucleus, the smallest values at energies 50 and 60 MeV were obtained using CDM3Y6-RT and CDM3Y6, respectively.
Due to the repulsive contribution of the RT to the real folding potential, especially at a small internuclear distance, this contribution has been shown to be vital in the application of the folding model to the study of elastic 11Li+12C and 11Li+28Si scattering in order to obtain the realistic shape and strength of the real potentials. The prediction capability of the folding model for 11Li+12C and 11Li+28Si is good. For this type of foldingpotential, systematic folding model studies of the elastic and inelastic nucleus-nucleus scattering over a wide range of energies are encouraged.
In contrast, the total reaction cross sections for the considered reactions together with extended energies are investigated. It is observed that the RCS increases linearly with rising energy at lower energies. It is also noted that both the observed data and those theoretically obtained from previous elastic scattering studies are in good agreement with the values generated by the current elastic scattering calculations.
Finally, we can argue that the simple calculated semi-microscopic potential of the DF model is considered as an advanced result and is more accurate compared with those from the previous complicated studies. The present results encourage us to modify the present potential calculation approach for full microscopic analysis to explain the discrepancy of the interaction of 11Li with low-Z targets at intermediate energies and to extend the analysis to other halo reactions.
