1.Department of Physics, College of Basic Medical Sciences, Army Medical University, Chongqing 400038, China 2.CAS Key Laboratory of Theoretical Physics, Institute of Theoretical Physics, Chinese Academy of Sciences, Beijing 100190, China 3.Institute of High Energy Physics, Chinese Academy of Sciences, P.O.Box 918(4), Beijing 100049, China 4.School of Physical Sciences, University of Chinese Academy of Sciences, Beijing 100190, China Received Date:2020-09-08 Available Online:2021-01-15 Abstract:By applying the nonrelativistic quantum chromodynamics factorization formalism to $ \Upsilon(1S,2S,3S) $ hadroproduction, a complete analysis of the polarization parameters $ \lambda_{\theta} $, $ \lambda_{\theta\phi} $, and $ \lambda_{\phi} $ for the production is presented at QCD next-to-leading order. With the long-distance matrix elements extracted from experimental data for the production rate and polarization parameter $ \lambda_{\theta} $ of $ \Upsilon $ hadroproduction, our results provide a good description of the measured parameters $ \lambda_{\theta\phi} $ and $ \lambda_{\phi} $ in both the helicity and Collins-Soper frames. In our calculations, the frame invariant parameter $ \tilde{\lambda} $ is consistent in the two frames. Finally, we mention that there are discrepancies between the available experimental data and corresponding theoretical predictions for $ \tilde{\lambda} $ .
HTML
--> --> -->
I.INTRODUCTIONHeavy quarkonia present the most important laboratory for accessing the properties of quantum chromodynamics (QCD). Due to the large masses of heavy quarks, perturbative QCD is applicable to the related heavy quarkonia at the parton level. However, to approach heavy quarkonium production properly, the factorization method is crucial for involving the nonperturbative hadronization from the quark pair to the quarkonium. Non-relativistic quantum chromodynamics (NRQCD) [1] may be the most successful effective theory for dealing with the perturbative and nonperturbative factors in the decay and production of heavy quarkonia. With short-distance coefficients (SDCs) and long-distance matrix elements (LDMEs), NRQCD reveals how to organize the perturbative effects as double expansions in the coupling constant $ \alpha_s $ and the heavy quark relative velocity v. In recent years, great improvements have been made at the next-to-leading order (NLO) within the NRQCD framework [2-10]. The first evaluations of the QCD corrections to the color-singlet hadroproduction of $ J/\psi $ and $ \Upsilon $ were introduced in Refs. [2,3], where the transverse momentum $ p_t $ distribution was found to be enhanced by 2-3 orders of magnitude in the high $ p_t $ region, and the $ J/\psi $ polarization changed from transverse to longitudinal at NLO [3]. Gong et al. [4,5] then presented $ J/\psi $ [4] and $ \Upsilon $ [5] production up to QCD NLO via the S-wave octet states $ ^1S_0^{[8]} $ and $ ^3S_1^{[8]} $. Analyses of complete NLO corrections within the NRQCD framework were reported later in Refs. [6-9] to study the $ J/\psi $ hadroproduction for the available experimental measurements independently. Despite these achievements, NRQCD has encountered challenges in the transverse momentum distribution of polarization for $ J/\psi $ and $ \Upsilon $ hadroproduction, for which the theoretical predictions cannot describe the experimental data at QCD leading order (LO) or, in some sense, at NLO. Three groups [11-13] have made great efforts to study the $ J/\psi $ polarization parameter $ \lambda_{\theta} $ at QCD NLO, but none of their color-octet (CO) LDMEs have been able to reproduce the experimental measurements for $ J/\psi $ production from the LHC [14,15] with good precision in the low and high $ p_t $ regions simultaneously. The $ \eta_c $ hadroproduction measured by the LHCb Collaboration [16] then presented another laboratory for testing NRQCD. Ref. [17] considered it a challenge to NRQCD, whereas Refs. [18,19] found that the data were consistent with the $ J/\psi $ hadroproduction data. This complicated situation shows that further studies and tests of NRQCD are necessary. As regards the $ \Upsilon $ production, similar progresses are achieved [2,3,5,10] as those for$ J/\psi $ production. In comparison with those of $ J/\psi $production, the theoretical predictions are expected to have better convergence in the NRQCD expansions for $ \Upsilon $ production due to the heavier mass and smaller v. Consequently, $ \Upsilon $ production may provide an additional venue for testing NRQCD. The first complete NLO QCD corrections on the yield and polarization of $ \Upsilon(1S,2S,3S) $ were presented in Ref. [20], the results of which provide a good description of the polarization of $ \Upsilon(1S,2S) $ and yield data at CMS. However, without considering the $ \chi_{bJ}(3P) $ feed-down, the polarization of $ \Upsilon(3S) $ remained a problem. Therefore, two groups [21,22] updated our understanding of $ \Upsilon(3S) $ polarization by considering the $ \chi_{bJ}(3P) $ feed-down contribution after the discovery of $ \chi_{bJ}(3P) $ in the experimental measurements [23,24]. The results describe the $ \Upsilon $ polarization data well. The polarization of $ \Upsilon $ can be measured through analysis of the angular distribution of $ \mu^+ $ and $ \mu^- $ from $ \Upsilon $ decay ([25,26]):
where $ \theta $ and $ \phi $ respectively refer to the polar and azimuthal angles of $ \mu^+ $ in the $ \Upsilon $ rest frame. The three coefficients $ \lambda_{\theta} $, $ \lambda_{\theta\phi} $, and $ \lambda_{\phi} $, which depend on the choice of reference system, contain the polarization information. Although all three coefficients provide independent information, most theoretical studies on heavy quarkonium polarization are restricted to $ \lambda_{\theta} $. The parameter $ \lambda_{\phi} $ of $ J/\psi $ was studied at QCD NLO in Ref. [11], with a few experimental data points measured by ALICE [27]. Complete predictions for $ J/\psi $ polarization have recently been released by our group [28] and the PKU group [29]; these predictions reconcile the data on $ \lambda_{\theta\phi} $ and $ \lambda_{\phi} $ quite well. Nevertheless, for $ \Upsilon $ polarization, although the three coefficients have been measured by CMS [30], theoretical predictions of $ \lambda_{\theta\phi} $ and $ \lambda_{\phi} $ are still lacking. Furthermore, new measurements of $ \Upsilon $ polarization have also been published by LHCb [31]. A complete analysis of $ \Upsilon $ polarization therefore seems urgent, especially to predict the parameters $ \lambda_{\theta\phi} $ and $ \lambda_{\phi} $. In this paper, we analyze the polarization of $ \Upsilon(1S,2S,3S) $ in the so-called helicity and Collins-Soper (CS) frames (see, e.g., Ref. [25] for more details on the polarization frames). In addition, the value of the frame-invariant quantity $ \widetilde{\lambda} $, which is defined as
is computed and compared with experimental data. A brief description of the framework and LDME strategy is introduced in Sec. II. Numerical results of $ \Upsilon(nS) $ polarization are presented in Sec. III, and the summary and conclusion are given in Sec. IV.
II.THEORY DESCRIPTION2A.General setup -->
A.General setup
The three polarization parameters $ \lambda_{\theta} $, $ \lambda_{\theta\phi} $, and $ \lambda_{\phi} $ in Eq. (1) are defined as [25]
Here, $ {\rm d}\sigma_{\lambda \lambda'} $($ \lambda, \lambda' $ = $ 0,\pm1 $) are the spin density matrix elements of $ \Upsilon $ hadroproduction and depend on the choice of polarization frames. Following the NRQCD factorization [1], the spin density matrix elements can be expressed as
where p is the proton; the indices a, b run over all possible partons; and n denotes the color, spin, and angular momentum states of the $ b\overline{b} $ intermediate states, which can be $ ^3S_1^{[1]} $, $ ^1S_0^{[8]} $, $ ^3S_1^{[8]} $, or $ ^3P_J^{[8]} $ for $ \Upsilon $ and $ ^3P_J^{[1]} $ or $ ^3S_1^{[8]} $ for $ \chi_{bJ} $. The functions $ f_{a/p}(x_1) $ and $ f_{b/p}(x_2) $ are the parton distribution functions for the incoming protons for parton types a and b, respectively. The short-distance coefficients $ {\rm d}\hat{\sigma} $ can be calculated perturbatively, and the LDMEs $ \langle{\cal O}^{H}_n \rangle $ are governed by nonperturbative QCD effects. To include the feed-down contributions from higher excited states to $ \Upsilon $, we follow the treatment in Ref. [13],
where $ C^{\lambda,J_z-\lambda}_{J,J_z} $ is the Clebsch-Gordan coefficient, and $ {\cal B}[X\rightarrow Y] $ denotes the branching ratio of X decaying into Y. To calculate the NRQCD prediction for the transverse momentum $ p_t $ distribution of the yield and polarization of heavy quarkonium hadroproduction at QCD NLO, we use the FDCHQHP package [32], which is based on 1) a collection of Fortran code for all 87 parton level sub-processes generated using the FDC package [33] and 2) an implementation tool for job submission and numerical precision control. For the soft and collinear divergence treatment involving the P-wave quarkonium state, the authors of Ref. [34] recently found that there is a mistake in the usual treatment of the tensor decomposition. This mistake has been corrected in our FDC package [33], and the related Fortran source was regenerated. In fact, we found that this mistake only affects numerical results by a few percent. 2B.LDME Strategy -->
B.LDME Strategy
The color-singlet LDMEs are estimated through wave functions at the origin:
where the wave functions and their derivatives at the origin can be calculated via the potential model [35]. For convenience, the related values are presented in Table 1.
The color-octet LDMEs can only be extracted from experimental data. In our previous study [21], three sets of LDMEs were obtained by fitting the experimental measurements of the yield and polarization parameter $ \lambda_{\theta} $ as well as the fractions of $ \chi_{bJ}(mP) $ to the $ \Upsilon(nP) $ production. Among the fitting schemes, different $ \chi_{bJ}(mP) $ feed-down ratios and NRQCD factorization scales were used, which only led to small differences in the production and polarization results but sizable differences in the values of the LDMEs. Considering the fact that the branching ratios $ {\cal B}[\chi_{bJ}(3P)\rightarrow\Upsilon(1S,2S,3S)] $ are still unavailable in the experimental data, in this paper, we use the color-octet LDMEs obtained by the default fitting scheme in Ref. [21], where a naive estimation of the branching ratios $ {\cal B}[\chi_{bJ}(3P)\rightarrow\Upsilon(3S)] \simeq {\cal B}[\chi_{bJ}(2P)\rightarrow\Upsilon(2S)] $ and $ {\cal B}[\chi_{bJ}(3P)\rightarrow\Upsilon(1S,2S)] = 0 $ is used. For convenience, we list the values of the color-octet LDMEs in Table 2. The branching ratios of $ \chi_{bJ}(mP)\rightarrow\Upsilon(nS)\gamma $ are taken from PDG data [36], which can also be found in Table 1 of Ref. [20].
Table2.Color-octet LDMEs for bottomonia production (in units of 10$ ^{-2} $ GeV$ ^3 $) [21].
2C.Uncertainty Estimation -->
C.Uncertainty Estimation
Only the uncertainty from the LDMEs is considered in this work. To express the uncertainty from the CO LDMEs properly, we use a covariance-matrix method [9,13], in which we fix the CO LDMEs of $ \chi_{bJ}(mP) $ and rotate $ \langle{\cal O}^{\Upsilon(nS)}(^{1}S^{[8]}_{0})\rangle $, $ \langle{\cal O}^{\Upsilon(nS)}(^{3}S^{[8]}_{1})\rangle $, and $ \langle{\cal O}^{\Upsilon(nS)}(^{3}P^{[8]}_{0})\rangle/ m_b^2 $ (in Table 2), which are the CO LDMEs of $ \Upsilon(1S,2S,3S) $. To illustrate this strategy in detail, we denote the three direct LDMEs in a convenient way as
The rotation matrix $ V_{\Upsilon(nS)} $ , discussed in Ref. [9], is used to make the fitting variables independent. We introduce the variables $ \Lambda^{\Upsilon(nS)}\equiv\mathcal{O}^{\Upsilon(nS)}V_{\Upsilon(nS)} $ for $ \Upsilon(1S) $, $ \Upsilon(2S) $ , and $ \Upsilon(3S) $, respectively. They are obtained with only independent error for each $ \Lambda_i $ in the fit. The differential cross section $ {\rm d}\sigma $ is then obtained as
where $ {\rm d}\hat{\sigma}_i $ are the corresponding short-distance coefficients, and $ \Upsilon(nS) $ has been omitted from the notation for convenience. The values of $ \Lambda^{\Upsilon(nS)}_i $ are presented in Table 3, and the corresponding rotation matrices are
State
$ \Lambda^{\Upsilon(nS)}_1 $
$ \Lambda^{\Upsilon(nS)}_2 $
$ \Lambda^{\Upsilon(nS)}_3 $
$ \Upsilon(1S) $
13.4±2.45
1.12±0.13
2.34±0.07
$ \Upsilon(2S) $
0.38±1.99
?1.43±0.11
1.77±0.05
$ \Upsilon(3S) $
1.35±0.00
?1.14±0.07
0.89±0.03
Table3.Rotated LDMEs for direct $ \Upsilon(1S,2S,3S) $ production (in units of 10$ ^{-2} $ GeV$ ^3 $).
where f is a physical observable that can be any one of the polarization parameters -$ \lambda_{\theta} $, $ \lambda_{\theta\phi} $, $ \lambda_{\phi} $, or $ \tilde{\lambda} $ - in this paper. $ \Lambda_i $ are the rotated LDMEs in Table 3. The variables with $ \Delta $ are the corresponding uncertainties, and "$ \cdots $" denotes the uncertainties from feed-down contributions. III.NUMERICAL RESULTSIn the numerical calculations, the CTEQ6M parton distribution functions [37] and corresponding two-loop QCD coupling constants $ \alpha_s $ are used. We adopt the approximation $ m_b = M_H/2 $ for the b-quark mass, where the masses of the relevant bottomonia are taken from PDG [36]: $ M_{\Upsilon(nS)} = $ 9.5, 10.023, 10.355 GeV for $ n = $ 1, 2, 3 and $ M_{\chi_{bJ}(mP)} = $ 9.9, 10.252, 10.512 GeV for $ m = $ 1, 2, 3, respectively. The factorization, renormalization, and NRQCD scales are chosen as $ \mu_f $ = $ \mu_r $ = $ \sqrt{4m^2_b+p^2_t} $ and $ \mu_{\Lambda} $=$ m_b v \approx $1.5 GeV, respectively. A shift of $ p^H_t\approx p^{H'}_t \times (M_H/M_{H'}) $ is used when considering the kinematics effect in the feed-down from higher excited states. 2A.Polarization related to CMS measurements -->
A.Polarization related to CMS measurements
The predictions of the $ \Upsilon(1S,2S,3S) $ polarization parameters in the rapidity region $ |y| \leq 0.6 $ related to the CMS measurements are computed and presented in Figs. 1 and 2 for ($ \lambda_{\theta} $, $ \lambda_{\theta\phi} $, $ \lambda_{\phi} $) and $ \widetilde{\lambda} $, respectively. In Fig. 1, $ \lambda_{\theta} $ is renewed in the helicity frame, which is found to be the same as that in Fig. 2 of Ref. [21], from which the corresponding data were used to extract the LDMEs in Table 2. The predictions of $ \lambda_{\theta} $ in the CS frame, denoted by the blue-dotted lines, are consistent with all the data for $ \Upsilon(1S,2S,3S) $. $ \lambda_{\theta\phi} $, which was investigated for $ J/\psi $ in Ref. [28], is exactly zero in the symmetric rapidity region in the helicity frame. Here, $ \lambda_{\theta\phi} $ is also zero in the CS frame. Figure1. (color online) Polarization parameters $ \lambda_{\theta} $(top), $ \lambda_{\theta\phi} $(middle), and $ \lambda_{\phi} $(bottom) for $ \Upsilon $ hadroproduction in the rapidity region $ |y| \leqslant 0.6 $. From left to right: $ \Upsilon(1S) $, $ \Upsilon(2S) $, and $ \Upsilon(3S) $. The CMS data are from Ref. [30].
Figure2. (color online) The frame-invariant quantity $ \widetilde{\lambda} $ as a function of the transverse momentum pt of $ \Upsilon(1S,2S,3S) $. The CMS data are from Ref. [30].
$ \lambda_{\phi} $ of $ \Upsilon(nS) $ behaves in a similar way in both the helicity and CS frames. The theoretical results in the helicity frame almost describe all the data for $ \Upsilon(2S,3S) $, whereas for $ \Upsilon(1S) $, the theory and the experimental data deviate from each other. The prediction is much better in the CS frame although there are still small deviations between the theoretical curves and the corresponding experimental data. In Fig. 2, we present the results for the frame invariant quantity $ \widetilde{\lambda} $ defined in Eq. (2). The figure clearly shows that our theoretical results in the helicity and CS frames coincide with each other, but there are small differences between the theoretical results and the corresponding experimental data. The prediction of $ \widetilde{\lambda} $ covers approximately two data points in the lower $ p_t $ region ($ p_t < 15 $ GeV) for the three states $ \Upsilon(1S,2S,3S) $, whereas in the higher $ p_t $ region, the theoretical results exceed the experimental data but are still within 2$ \sigma $ accuracy. In particular, note that the theoretical predictions and experimental data for $ \Upsilon(2S) $ behave in opposite ways as the transverse momentum $ p_t $increases. The $ \Upsilon(nS) $ polarization in the $ 0.6 \leqslant |y| \leqslant 1.2 $ rapidity region is similar to that in the $ |y| \leqslant 0.6 $ region. We thus omit detailed descriptions here and present the plots in Figs. 3 and 4. Figure3. (color online) The same as Fig. 1 for the rapidity region $ 0.6 \leqslant |y| \leqslant 1.2 $. The CMS data are from Ref. [30].
Figure4. (color online) The frame-invariant quantity $ \widetilde{\lambda} $ for $ \Upsilon(1S,2S,3S) $ hadroproduction in the rapidity region $ 0.6 \leqslant |y| \leqslant 1.2 $. The CMS data are from Ref. [30].
2B.Polarization related to LHCb measurements -->
B.Polarization related to LHCb measurements
Predictions for the $ \Upsilon $ polarization in the kinematic region related to LHCb measurements are computed and presented in Figs. 5 and 6. For $ \lambda_{\theta} $, our results provide a good description of the experimental measurements for $ \Upsilon(1S,3S) $ in both the helicity and CS frames. For $ \Upsilon(2S) $, the results are consistent with the experimental data in the CS frame, but they are slightly greater than the experimental data in the helicity frame. Moreover, the uncertainty of $ \Upsilon(2S) $ is obviously larger in the low $ p_t $ region. The discrepancy between theory and experiment for lower $ p_t $ is not surprising since the convergence of the perturbative expansion is thought to be worse in this kinematic region, and the data points with $ p_t<8 $ GeV were excluded when extracting the LDMEs in Ref. [21]. Figure5. (color online) Polarization parameters $ \lambda_{\theta} $(top), $ \lambda_{\theta\phi} $(middle), and $ \lambda_{\phi} $(bottom) for $ \Upsilon $ hadroproduction in the forward rapidity region. From left to right: $ \Upsilon(1S) $, $ \Upsilon(2S) $, and $ \Upsilon(3S) $. The LHCb data are from Ref. [31].
Figure6. (color online) Polarization parameter $ \widetilde{\lambda} $ for $ \Upsilon $ hadroproduction in the forward rapidity region. From left to right: $ \Upsilon(1S) $, $ \Upsilon(2S) $ , and $ \Upsilon(3S) $. The LHCb data are from Ref. [31].
For $ \lambda_{\theta\phi} $, our results provide a beautiful description of the data for $ \Upsilon(3S) $ in both polarization frames. For $ \Upsilon(2S) $, the theory covers most measurements within the uncertainty, but the agreement is worse for $ \Upsilon(1S) $ since for $ \Upsilon(1S) $, less amount of the data can be covered by the predictions. Nevertheless, within 2$ \sigma $ accuracy, all the measurements are within the theoretical band. For $ \lambda_{\phi} $, our results are in good agreement with the experimental data for $ \Upsilon(3S) $ and $ \Upsilon(2S) $ and bad agreement for $ \Upsilon(1S) $. Specifically, for $ \lambda_{\phi} $, our results are in good agreement with the available data for $ \Upsilon(2S) $. For $ \Upsilon(1S) $ and $ \Upsilon(3S) $, the predictions are slightly higher than the measurements in the low $ p_t $ region, but in the higher $ p_t $ region ($ p_t>15 $GeV), the theory and experimental data are consistent. In Fig. 6, values of the frame-invariant quantity $ \widetilde{\lambda} $ of $ \Upsilon(nS) $ are compared with LHCb data [31]. Although the theoretical results of the two polarization frames are again consistent with each other, only one or two of the experimental data points in the higher $ p_t $ region can be matched to theoretical predictions. 2C.The ratios of feed-down contributions -->
C.The ratios of feed-down contributions
Here, as a complement, we present the ratios of the feed-down contribution to $ \Upsilon(1S,2S,3S) $ hadroproduction. The ratios of all the feed-down channels are plotted in Fig. 7, where it is evident that the feed-down contributions are critical for the $ \Upsilon $ production. It can be seen that, in the $ \Upsilon(3S) $ production, the feed-down from $ \chi_{bJ}(3P) $ contributes more than 30% over the whole $ p_t $ region at CMS, while at LHCb, its contribution can be even higher in the lower $ p_t $ region. For $ \Upsilon(2S) $ production, the $ \Upsilon(3S) $ feed-down contributes approximately 5%, while the $ \chi_{bJ}(2P) $ feed-down contributes approximately 30% consistently across the whole $ p_t $ region considered here. For the $ \Upsilon(1S) $ production, multiple feed-down contributions are presented in the plots; the feed-down contributions increase from 20% to 60% as the transverse momentum $ p_t $ increases for both the LHCb and CMS windows. The feed-down contribution from $ \Upsilon(3S) $ to $ \Upsilon(1S) $ ($ \Upsilon(2S) $) production is less than 2% (5%), which seems to be negligible, whereas the contributions from $ \chi_{bJ}(nP) $ decay dominate the feed-down contributions to the corresponding $ \Upsilon(nS) $ production. Figure7. (color online) The ratios of contributions to the $ \Upsilon(1S) $(left),$ \Upsilon(2S) $(middle), and $ \Upsilon(3S) $(right) hadroproduction at the LHC.
To investigate the uncertainty of the ratios of the feed-down contributions from the different sets of LDMEs, the other two LDMEs sets in Ref. [21] are used to compute the ratios. To avoid confusion, we only present the ratios of direct $ \Upsilon $ production. For comparison, the ratios for the three LDME sets are presented in Fig. 8, where the differences among the three curves are small for the $ \Upsilon(1S,2S,3S) $ production. Figure8. The ratios of the direct production over $ \Upsilon(1S) $(left),$ \Upsilon(2S) $(middle), and $ \Upsilon(3S) $(right) in three LDME schemes.
IV.SUMMARY AND CONCLUSIONIn this paper, a complete analysis of $ \Upsilon(1S,2S,3S) $ polarization is conducted. All three polarization parameters, $ \lambda_{\theta} $, $ \lambda_{\theta\phi} $, and $ \lambda_{\phi} $ , for $ \Upsilon(1S,2S,3S) $ hadroproduction are calculated at QCD NLO within the NRQCD framework. The frame-invariant quantity $ \widetilde{\lambda} $ at CMS and LHCb is also investigated. As a complement, we present the ratios of the feed-down contributions to $ \Upsilon(1S,2S,3S) $ hadroproduction. Before comparing our results with the experimental data, it is important to mention that in the helicity frame, $ \lambda_{\theta\phi} $, as investigated in Ref. [28], should be exactly zero in the symmetric rapidity region. Although most of the data from CMS are consistent with this within 1$ \sigma $ , there are several data points that are consistent within 2$ \sigma $. In fact, in the case of $ 0.6\leqslant |y| \leqslant 1.2 $ for $ \Upsilon(3S) $, there is one point that is outside the $ 2\sigma $ range. We therefore suggest that, in order to improve the experimental measurement at CMS (in the symmetric rapidity region), $ \lambda_{\theta\phi} $ should be constrained to zero in the helicity frame. Thus, when comparing our results to the experimental measurements, we use the evaluations "very good," "good," "acceptable," and "bad" if the theoretical results and experimental data are consistent with each other within $ 1\sigma $, $ 2\sigma $, $ 3\sigma $ , and $ >3\sigma $ , respectively. For $ \lambda_\theta $ and $ \lambda_{\theta\phi} $, our results describe the CMS data quite well in both the helicity and CS frames, as shown in Figs. 1 and 3. However for the LHCb data, although most data are described well, there are some points that are inconsistent with the theoretical predictions within $ 3\sigma $ . The results are worse for $ \lambda_\phi $. Regarding all the data from CMS and LHCb in both the helicity and CS frames, it is found that approximately $ 1/3 $ of the points are described within 1$ \sigma $ , another $ 1/4 $ of the points are within 2$ \sigma $ , and approximately $ 1/6 $ of the points are inconsistent with the theoretical predictions within 3$ \sigma $ . For this reason, for the frame independent parameter $ \tilde{\lambda} $, only approximately 60% of the experimental data points can be described by the theoretical predictions within 2$ \sigma $. Nevertheless, the theoretical results for the two frames agree quite well with each other. The ratios of the feed-down contributions to $ \Upsilon(1S,2S,3S) $ hadroproduction are also presented with different LDME schemes. The results indicate that the feed-down contributes more than 30% to $ \Upsilon(1S,2S,3S) $ hadroproduction, emphasizing the importance of feed-down contributions. ACKNOWLEDGMENTSY.F. would like to thank CAS Key Laboratory of Theoretical Physics, Institute of Theoretical Physics (ITP), CAS, for the very kind invitation and hospitality.


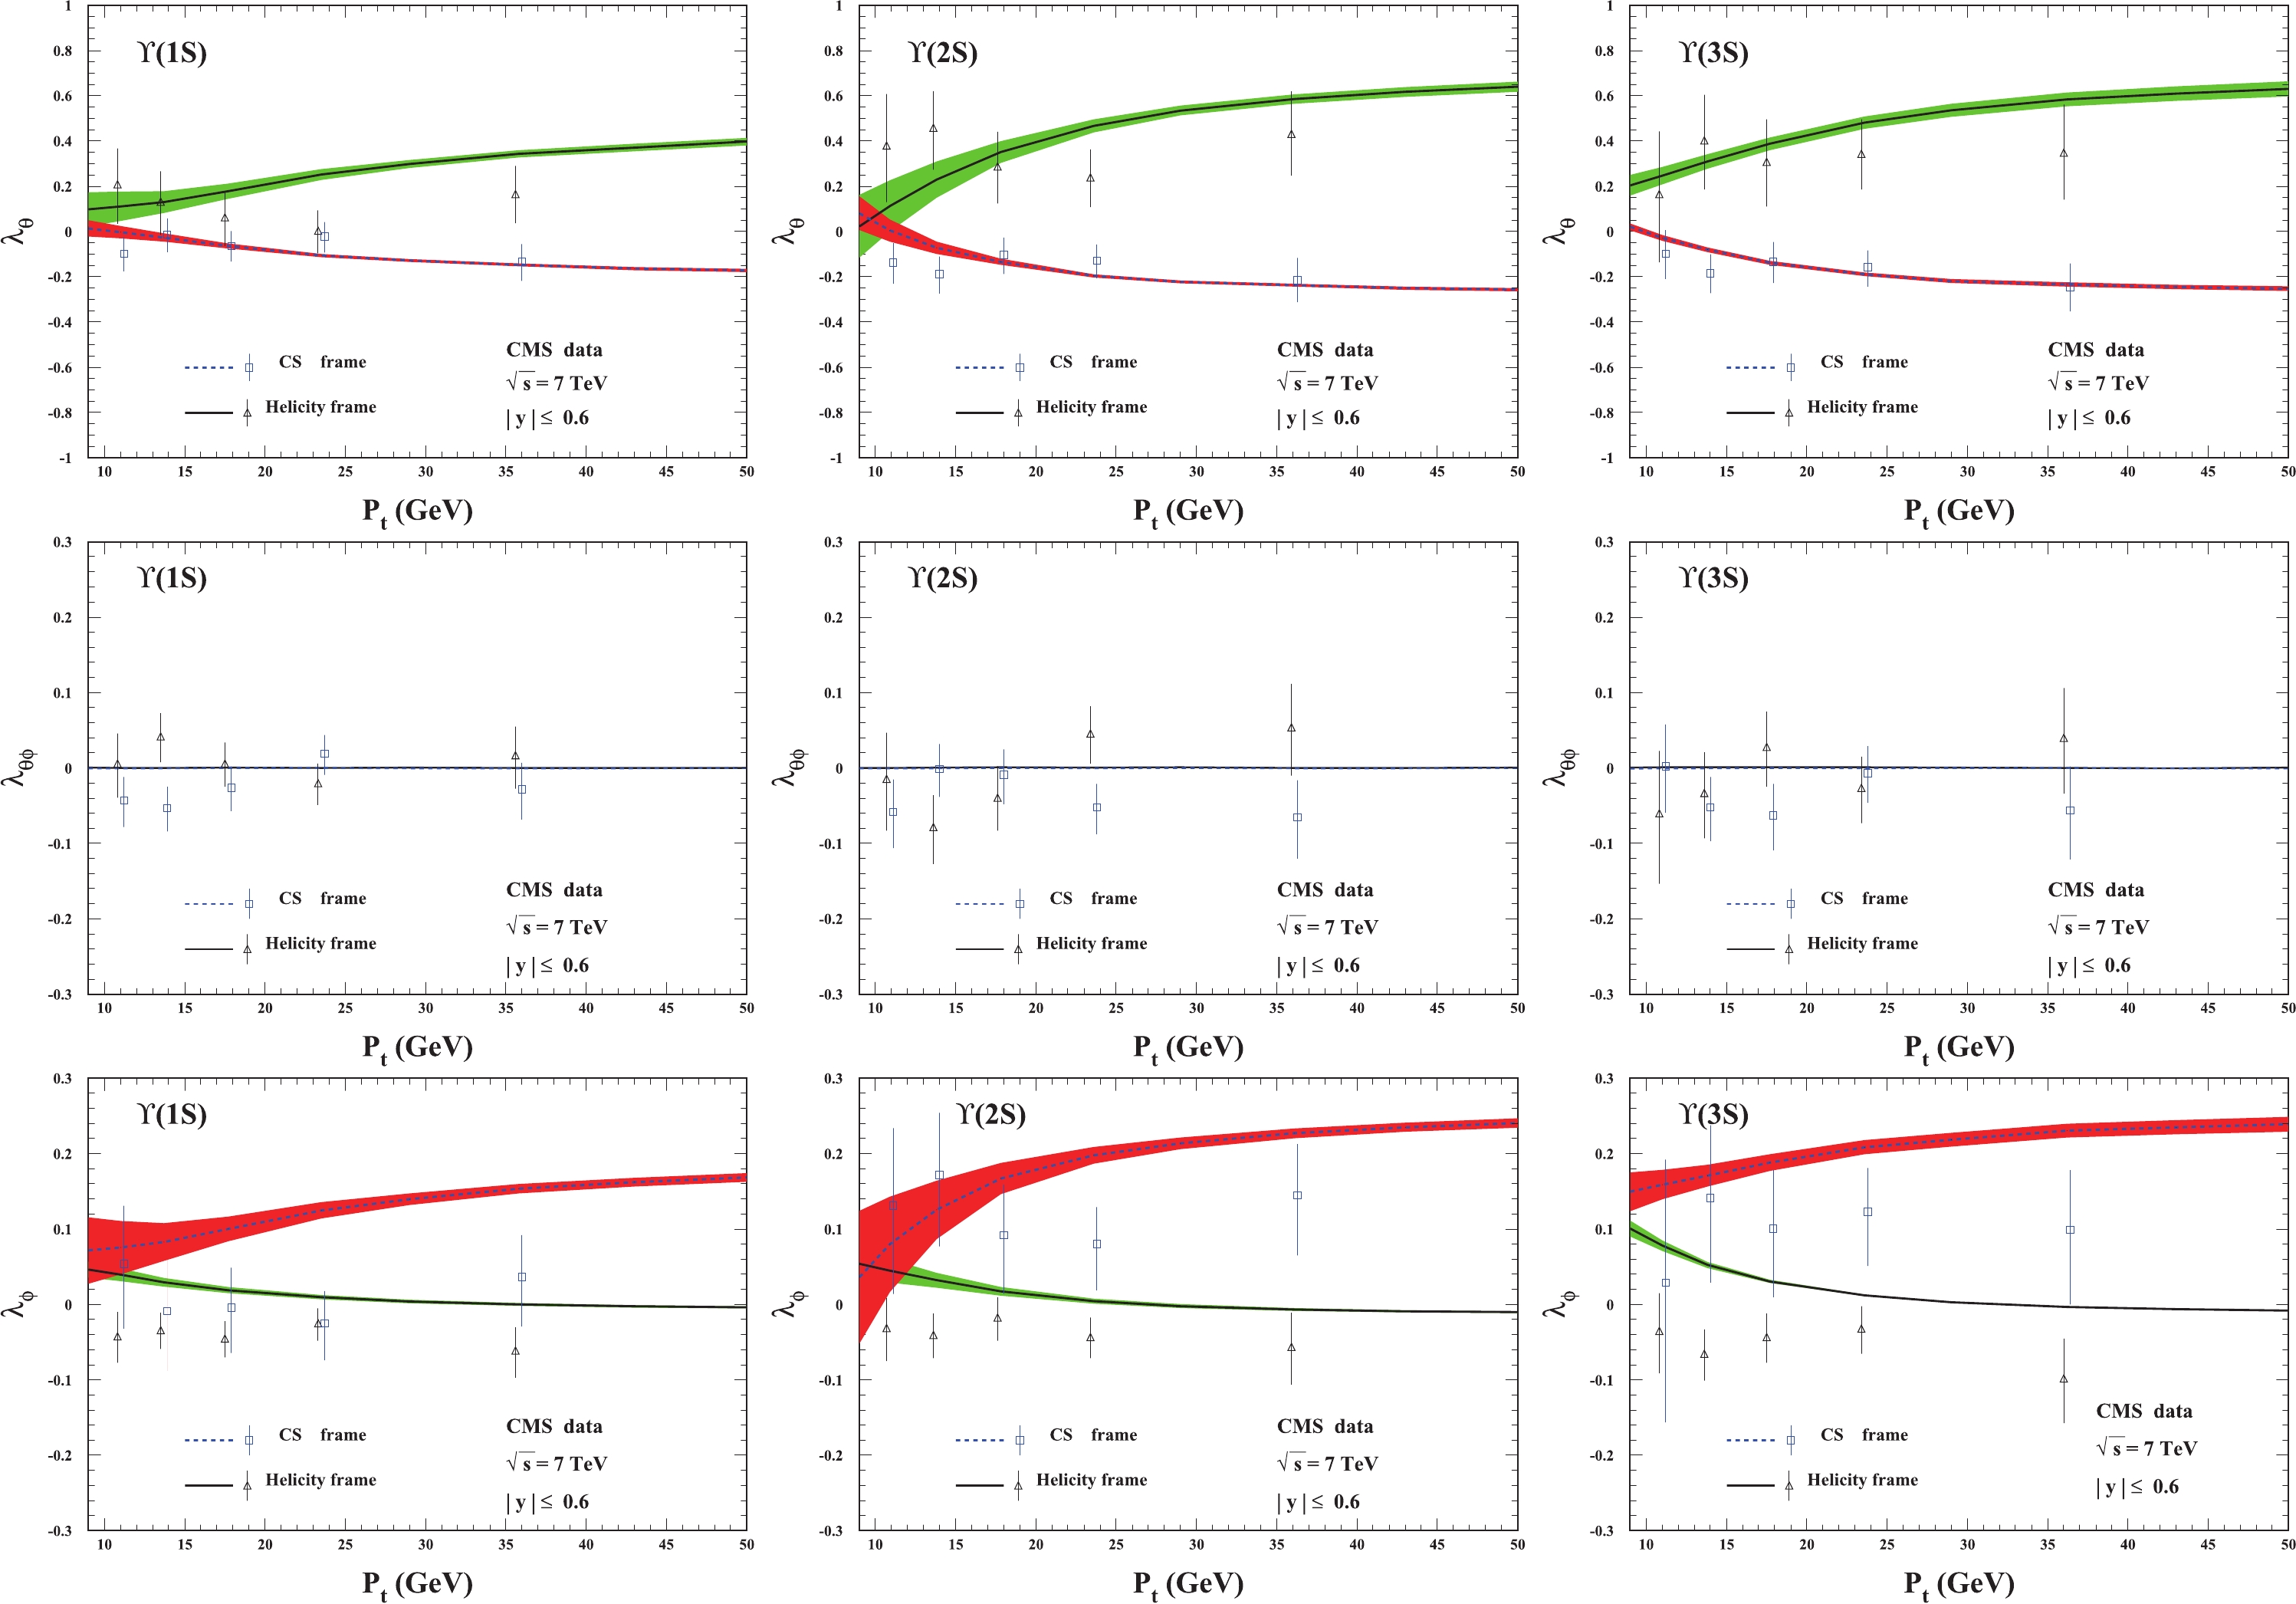 Figure1. (color online) Polarization parameters
 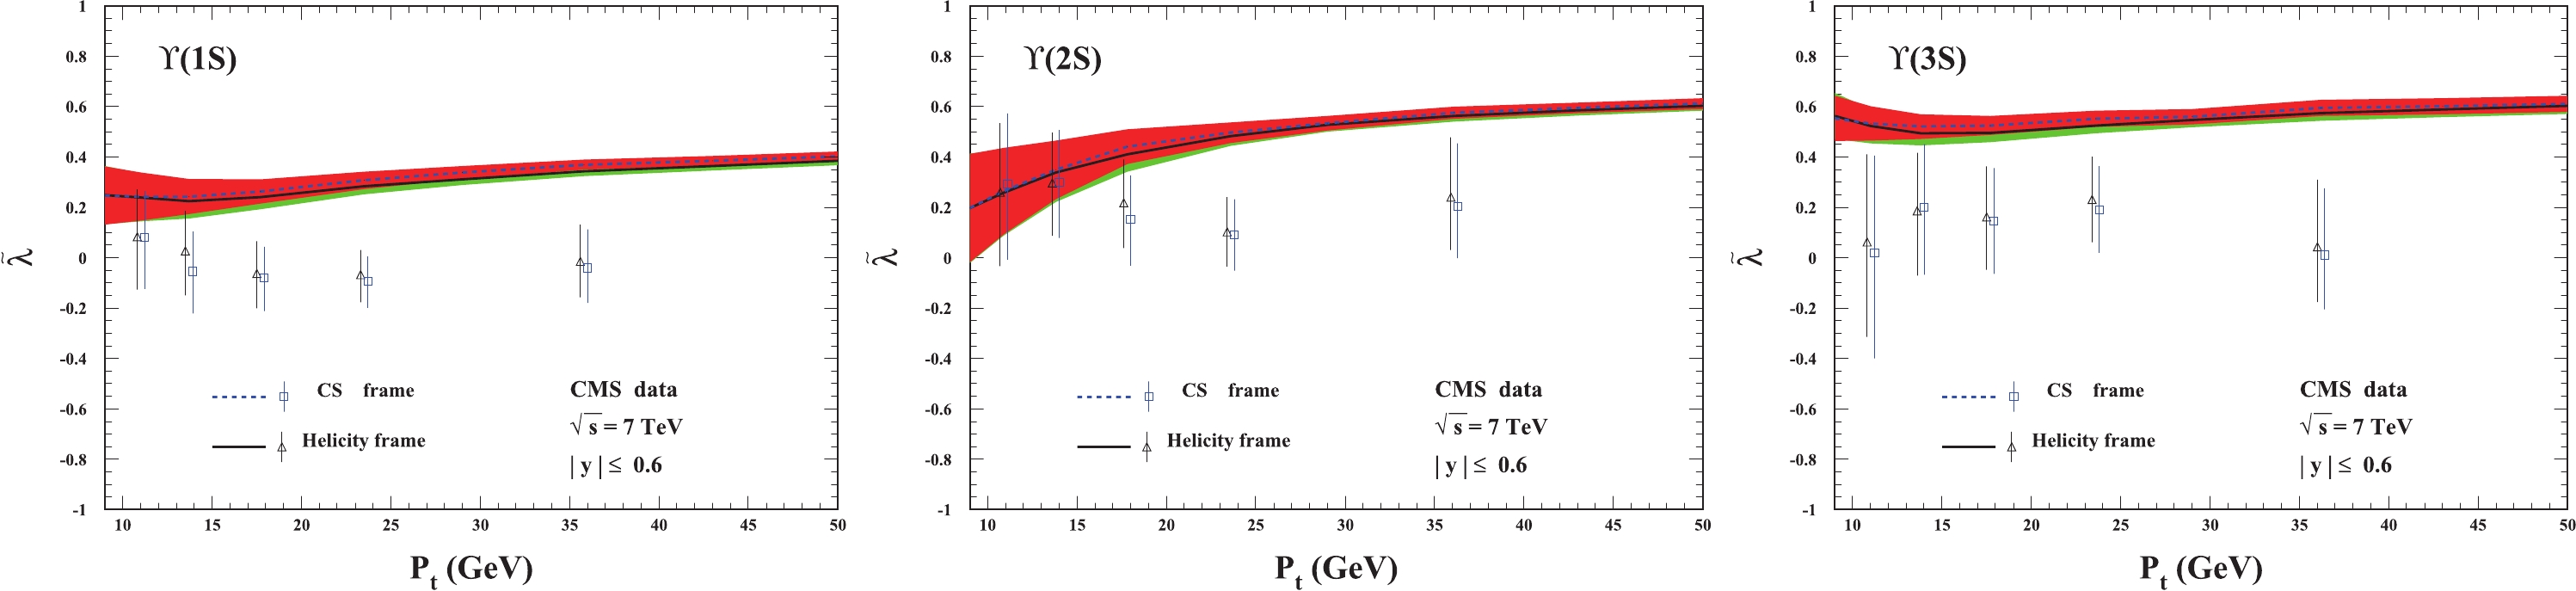 Figure2. (color online) The frame-invariant quantity
  Figure3. (color online) The same as Fig. 1 for the rapidity region
 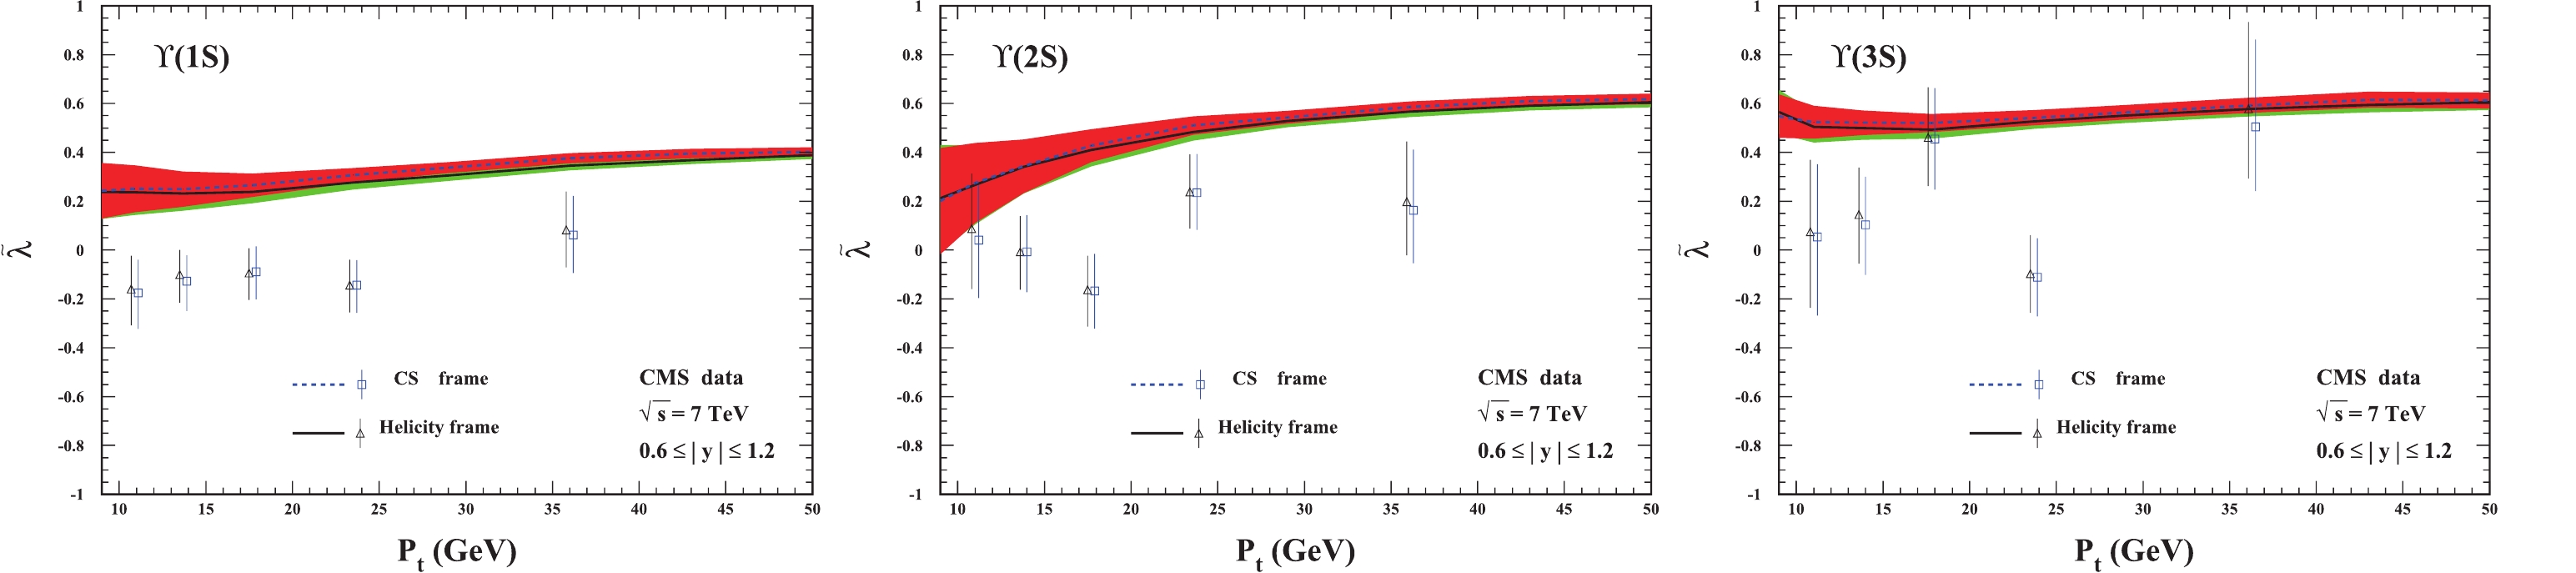 Figure4. (color online) The frame-invariant quantity
 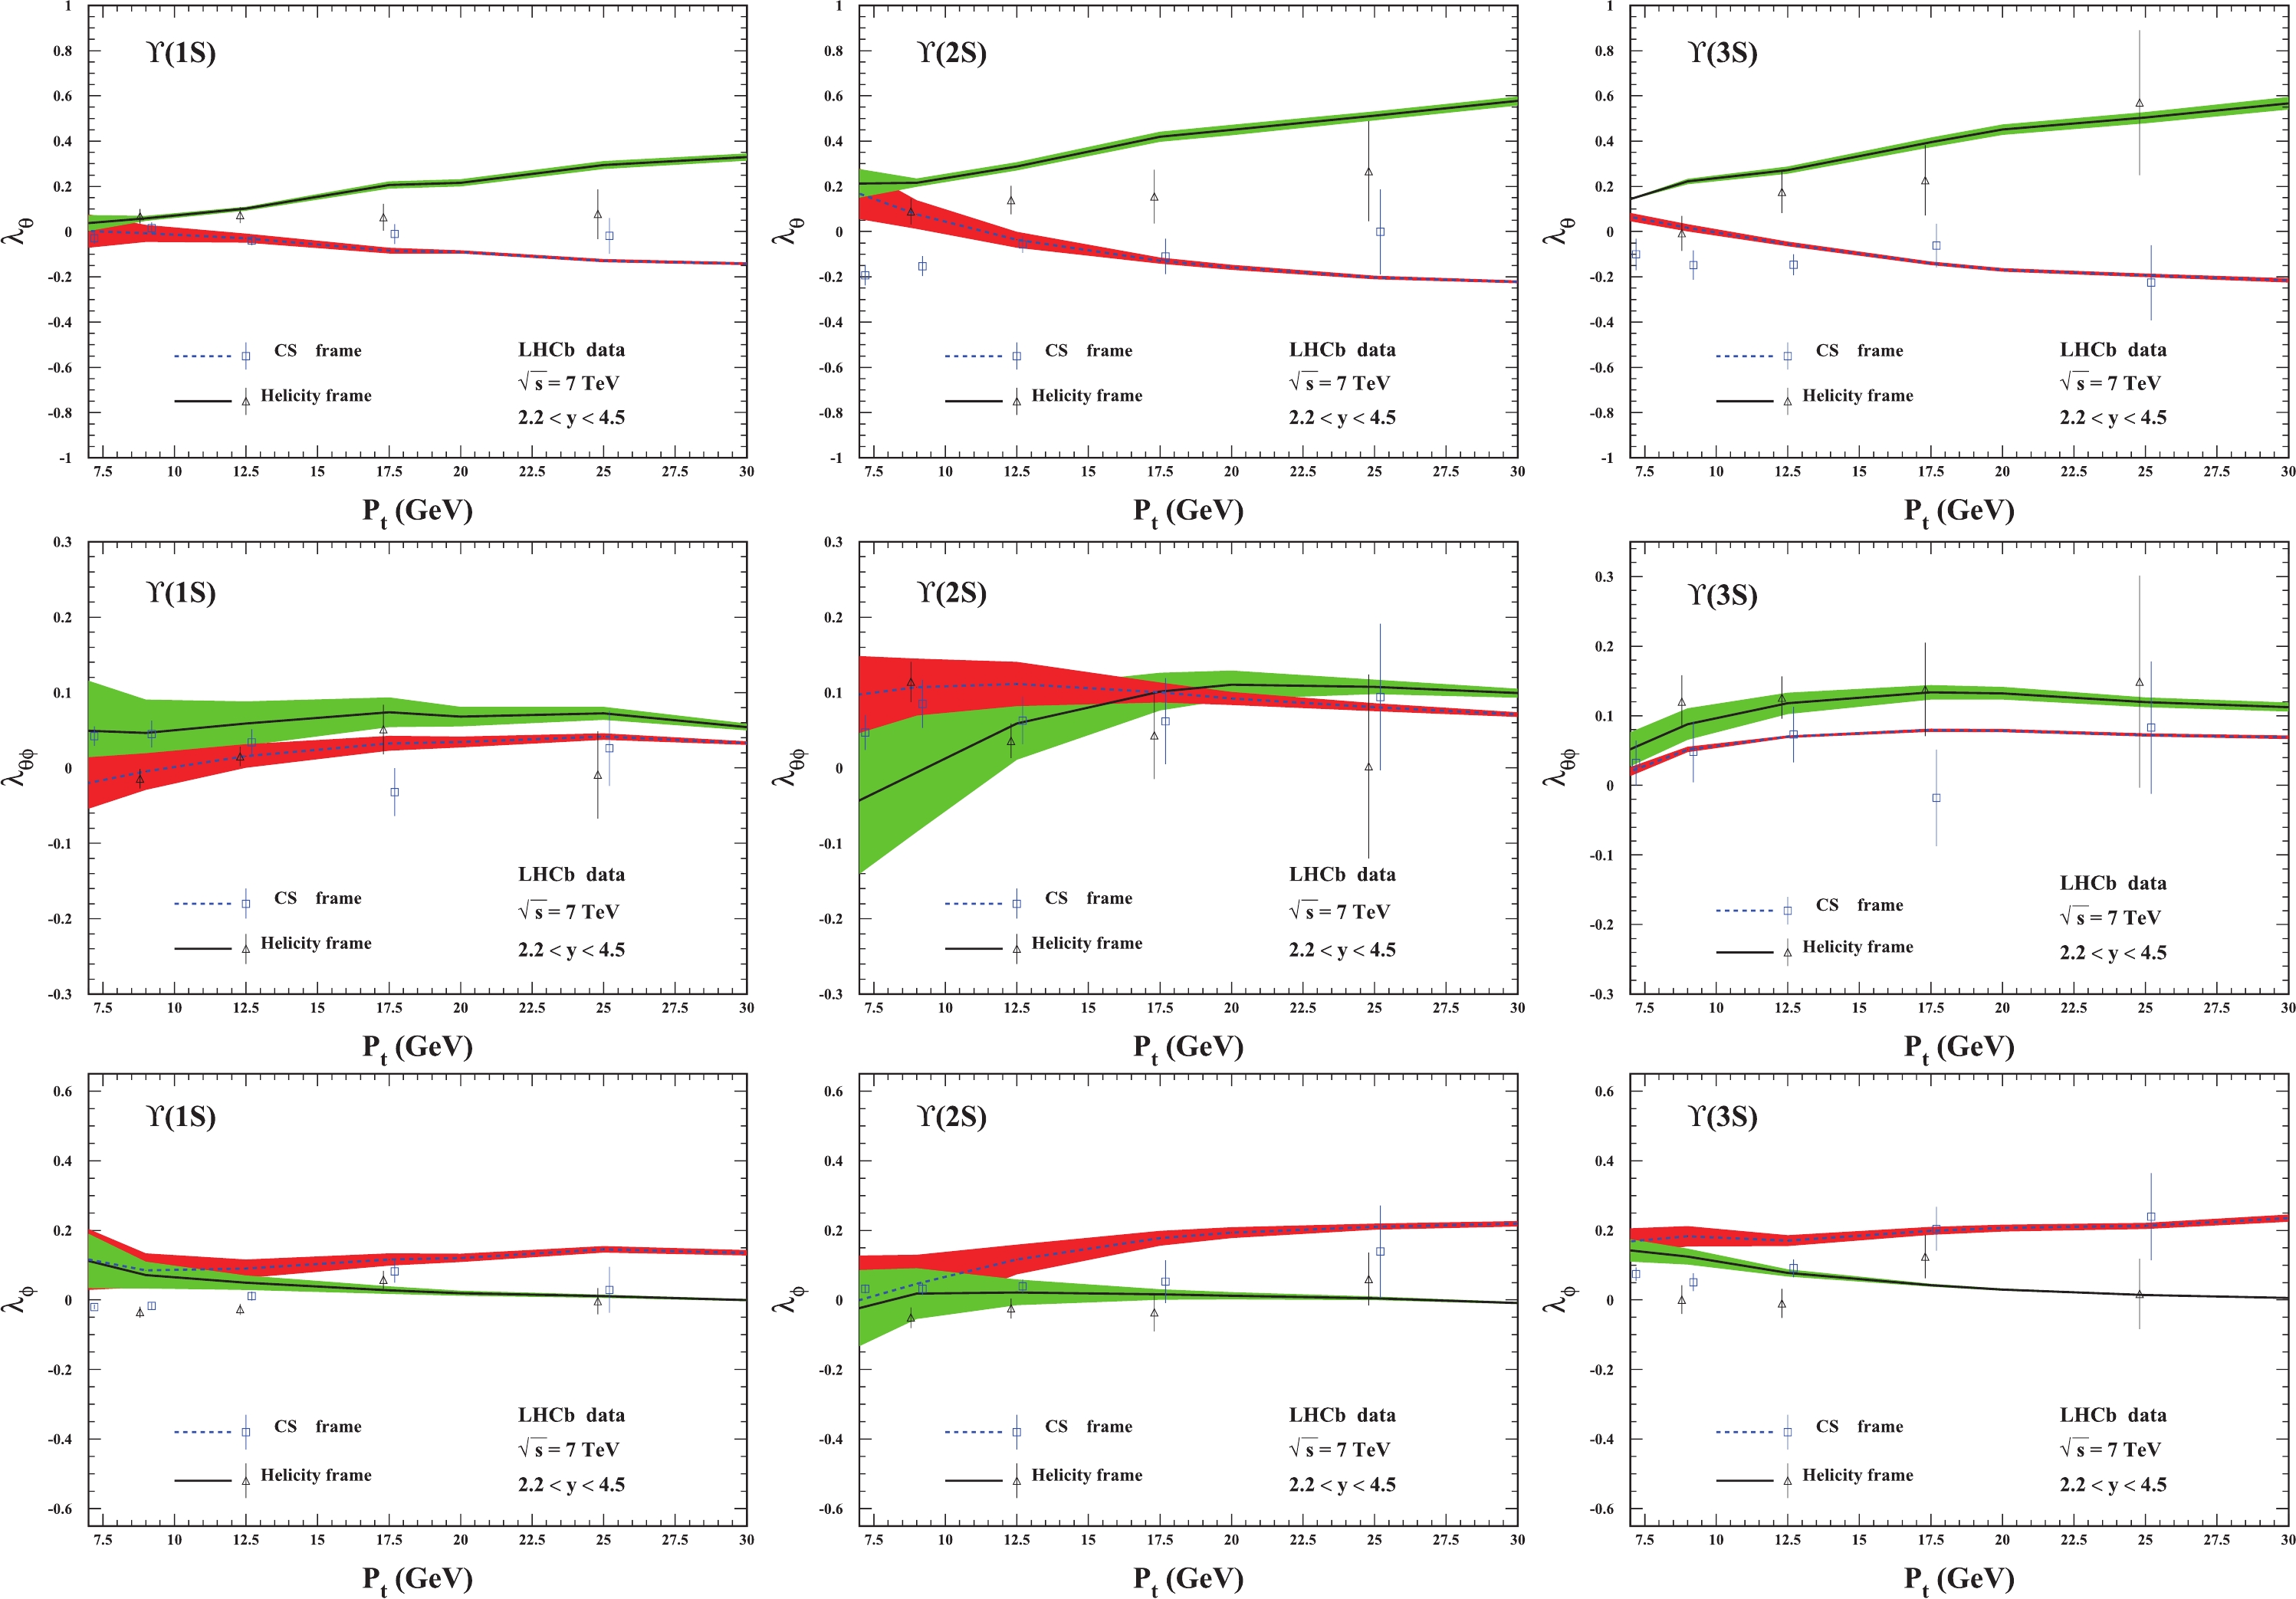 Figure5. (color online) Polarization parameters
 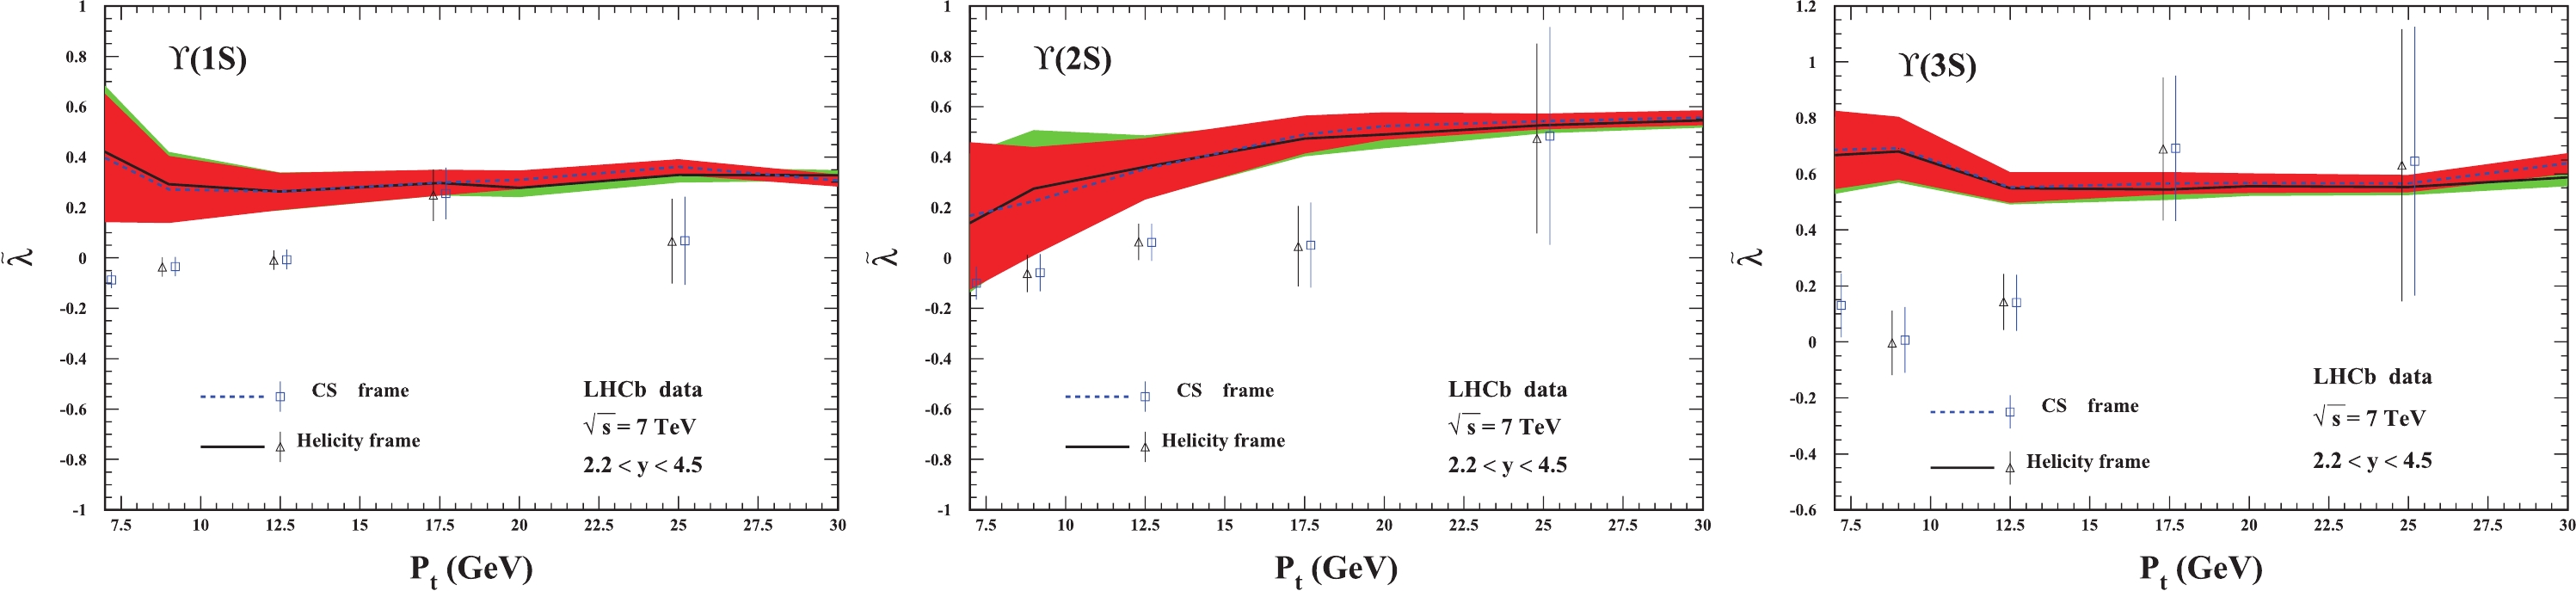 Figure6. (color online) Polarization parameter
 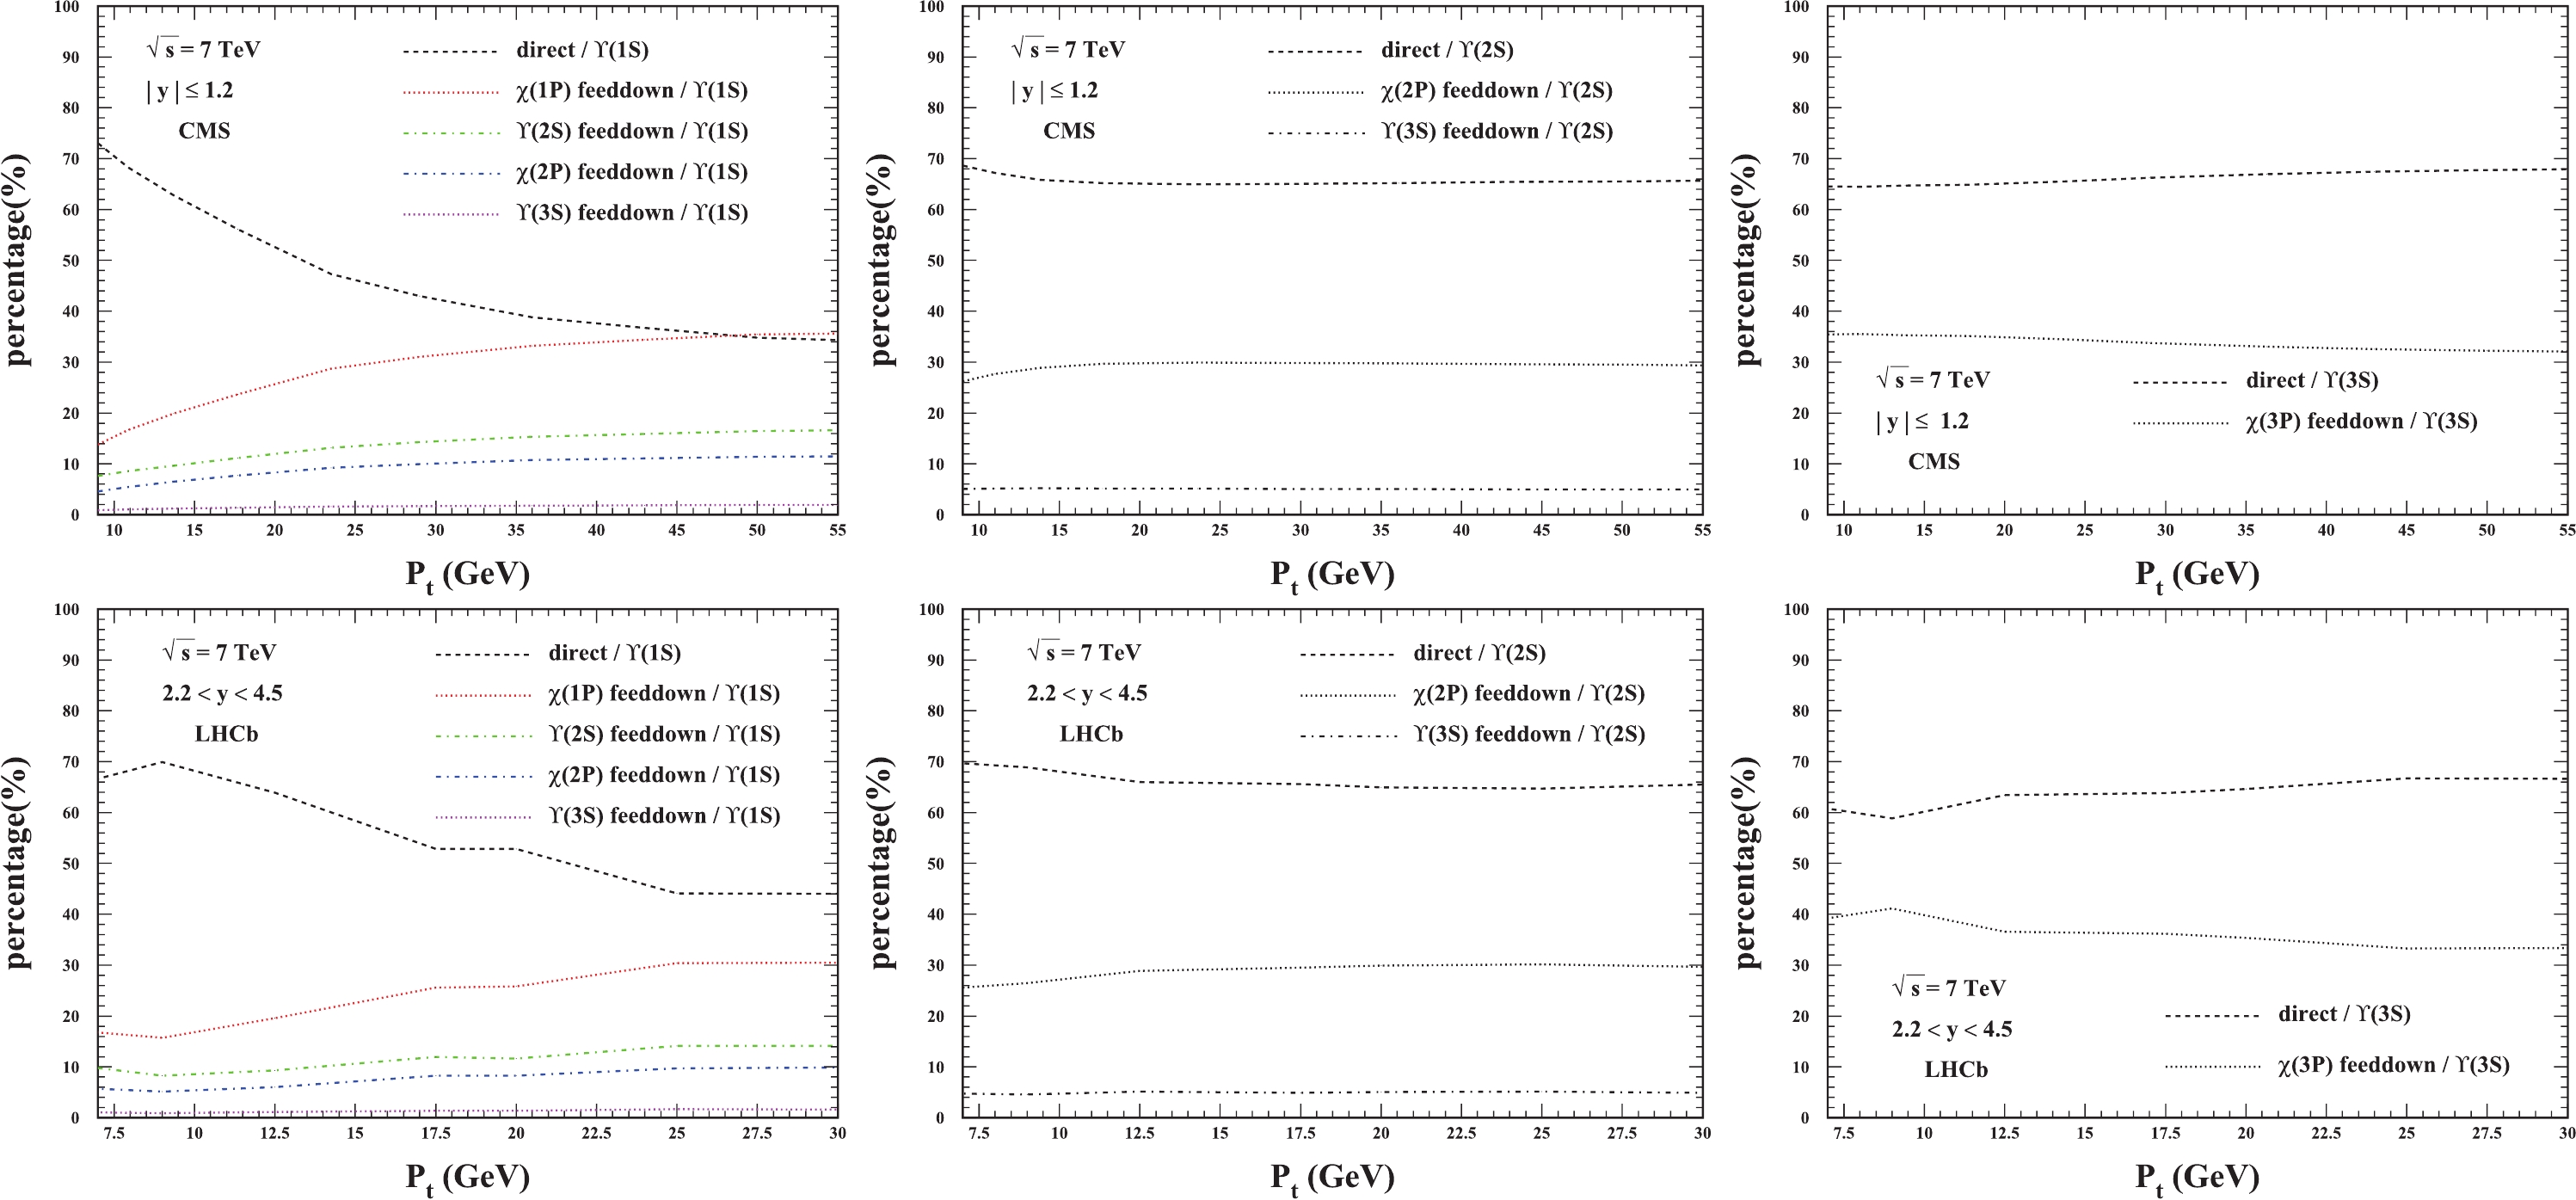 Figure7. (color online) The ratios of contributions to the
 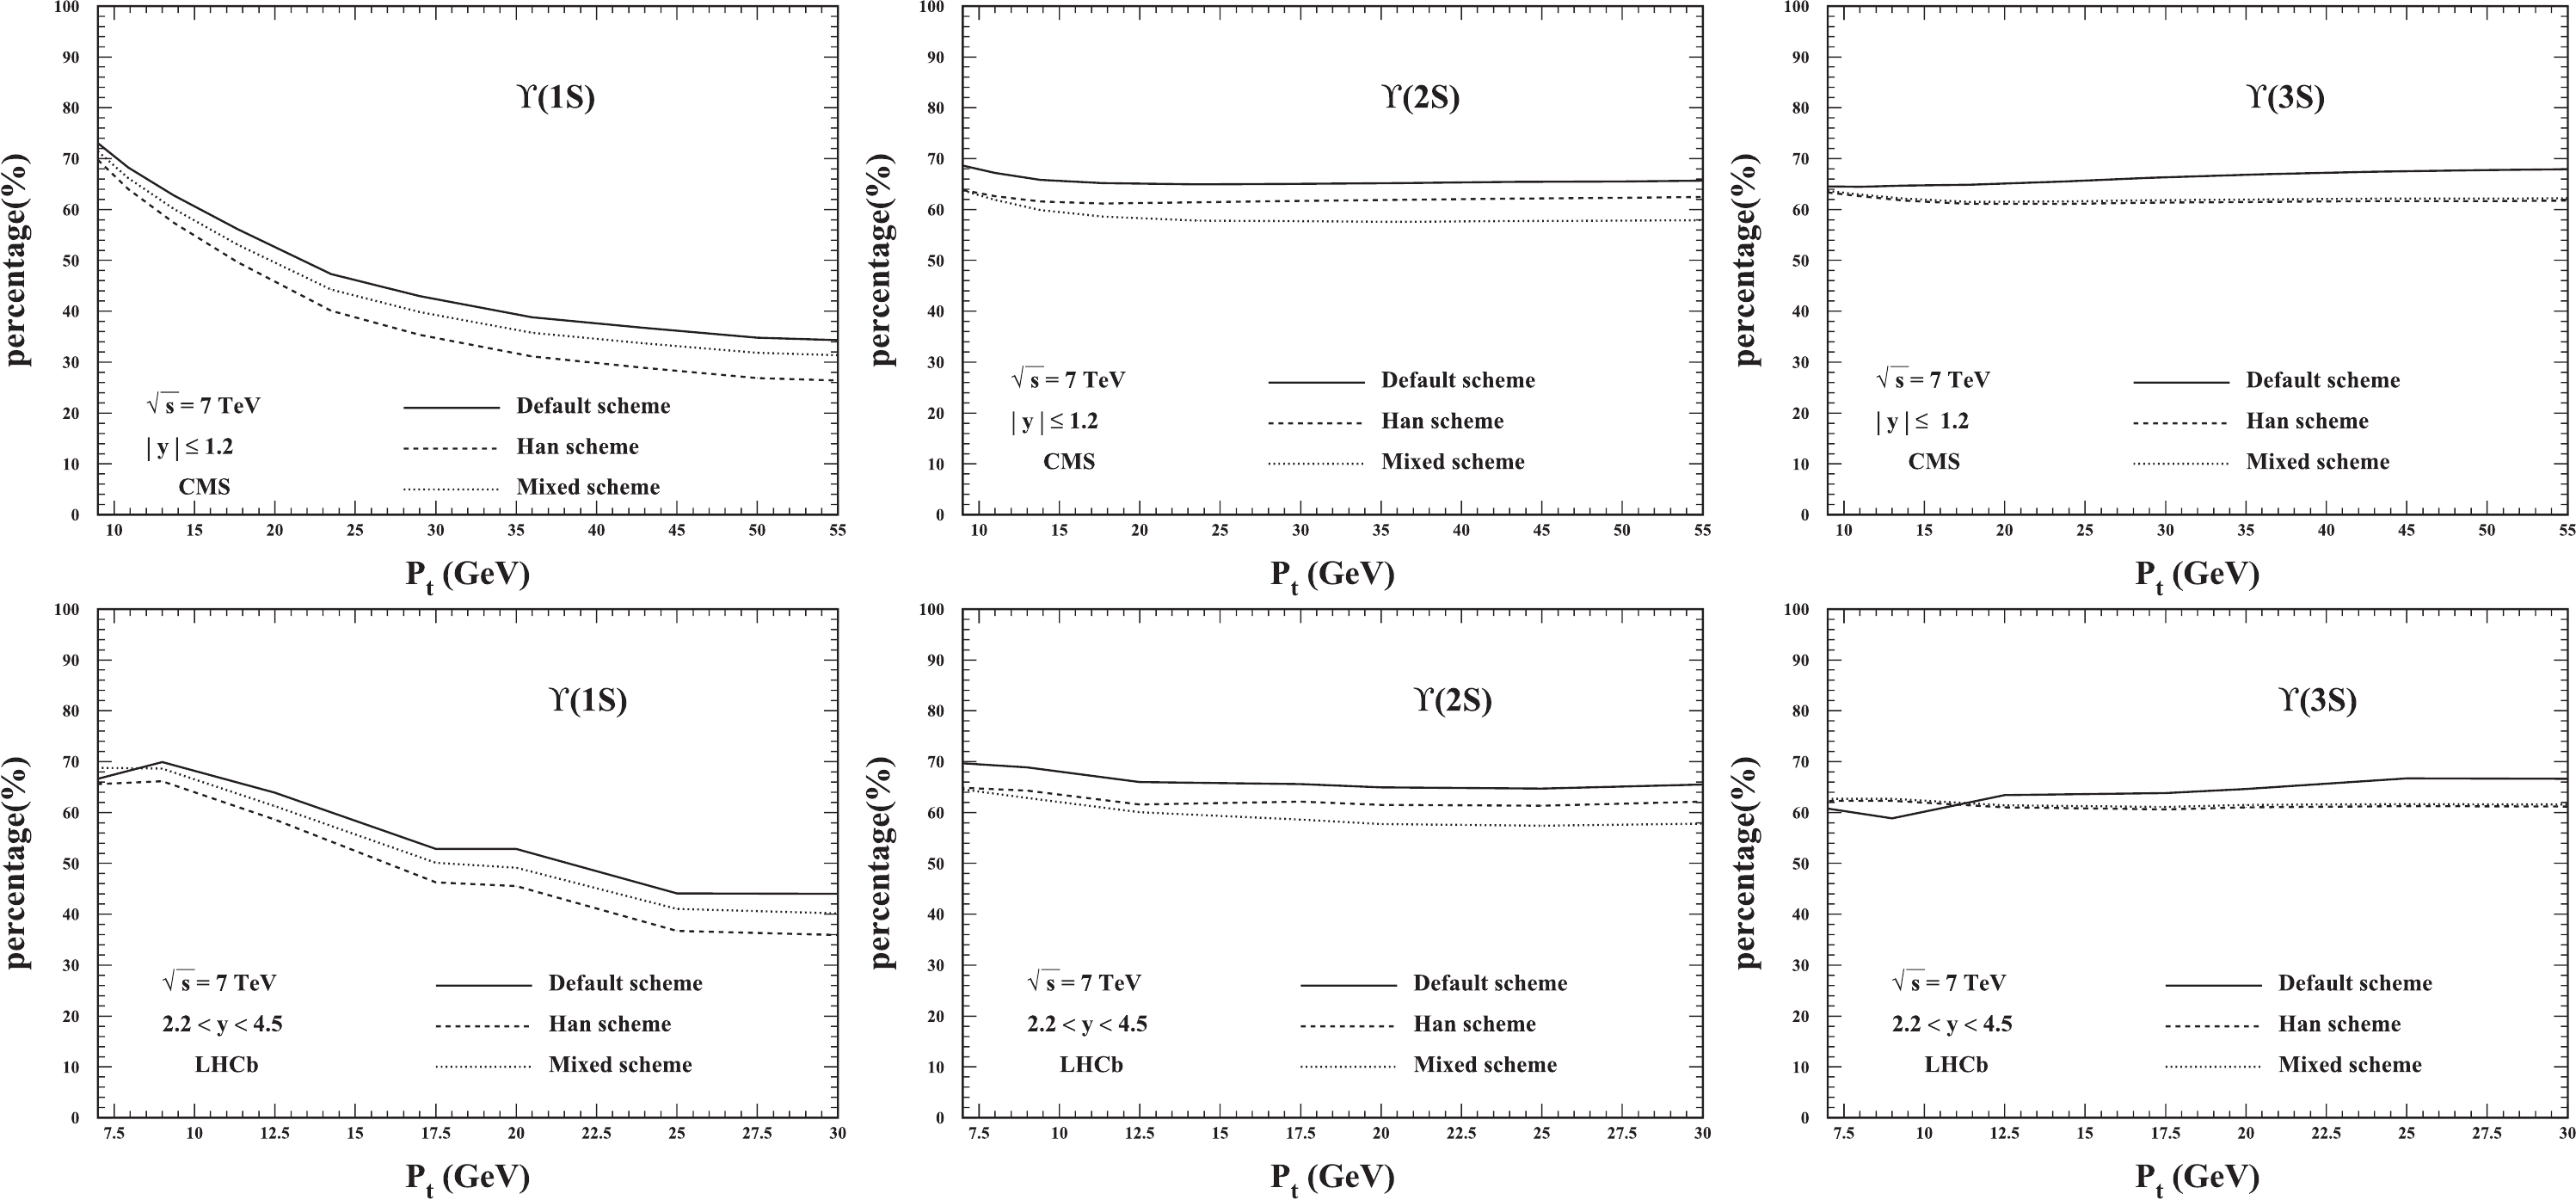 Figure8. The ratios of the direct production over