 ,1, 郭嘉欣2, 冯凌2, 罗艳华3, 张宪洲1, 范玉枝1, 成升魁1
The structure and characteristics of resident food consumption in rural areas of the Tibetan Plateau: Taking Three-Rivers Region in Tibet as an example
WANG Ling'en,1, GUO Jiaxin2, FENG Ling2, LUO Yanhua3, ZHANG Xianzhou1, FAN Yuzhi1, CHENG Shengkui1通讯作者:
收稿日期:2020-12-7修回日期:2021-08-20
| 基金资助: |
Received:2020-12-7Revised:2021-08-20
| Fund supported: |

摘要
关键词:
Abstract
Keywords:
PDF (1715KB)元数据多维度评价相关文章导出EndNote|Ris|Bibtex收藏本文
本文引用格式
王灵恩, 郭嘉欣, 冯凌, 罗艳华, 张宪洲, 范玉枝, 成升魁. 青藏高原“一江两河”农区居民食物消费结构与特征. 地理学报, 2021, 76(9): 2104-2117 doi:10.11821/dlxb202109005
WANG Ling'en, GUO Jiaxin, FENG Ling, LUO Yanhua, ZHANG Xianzhou, FAN Yuzhi, CHENG Shengkui.
1 引言
“民以食为天”,食物作为国计民生的根本,是人类社会可持续发展的基本保障,不仅关系到农牧产业经济的发展,更关系到社会的稳定,历来是各国政府和****关注的焦点[1,2]。从20世纪70年代爆发食物危机以来,食物安全日益成为国际社会广泛关注的问题[3]。尤其是新冠肺炎疫情之后,口岸封锁导致食物市场、供应链和贸易阻断,全球食物供给风险尚无法估量,“食物安全”问题再次被推上风口浪尖[4]。特别是对于中国这一人口大国,粮食供需紧平衡、浪费形势严峻等食物安全问题长期存在[5],关注食物消费问题不容懈怠。受自然地理条件的限制,青藏高原地区粮食自给能力差,粮食安全问题长期受到各方高度重视[6,7]。特别是西藏自治区,食物安全不仅事关居民生活,在经济发展、民族团结、边境安全等方面也具有特殊意义[8,9]。1978年改革开放以来,西藏农牧业生产能力得到大幅提升[10],但与全国水平相比,全区性和局部性的食物短缺尚未得到根本解决[11]。同时,随着城镇化和现代化进程的加速推进,西藏与内地的物流逐步加强,藏区农牧民的消费方式和饮食习惯变化显著,食物消费结构逐渐朝着多元化的方向发展[6, 12],对西藏自治区的食物供给和区域资源环境提出了新的要求和挑战。在此背景下,揭示该地区居民食物消费结构和特征,探究其消费差异影响因素,不仅能够引导居民培养绿色健康食物消费模式,同时对推动西藏农牧业耦合发展、重新理解西藏食物安全战略具有重要意义。
面对食物消费需求和结构的快速变化,国内外****在食物消费模式、特征[13,14]及影响因素[15,16,17]等方面开展了系统研究,并取得丰硕成果。Law研究了印度居民食物消费结构的变化,指出贸易改革是驱动印度居民食物消费结构变化的重要因素,促使当地谷物性食物消费减少、动物性食物消费增加[18]。辛良杰等基于CHNS数据分析了中国不同年龄阶段居民的食物消费特征,发现人口年龄结构对中国食物消费总量具有显著影响[19]。总体来看,居民食物消费模式变化影响因素可归结为经济因素[20,21]、社会因素[22,23]、家庭因素[24]和个体因素[25,26]4个方面。然而,以往的研究多集中于自上而下视角对国家、地区等大尺度层面进行分析,缺少采用自下而上方法对特殊主体功能地区进行研究。虽然少数****对西藏的食物消费进行了初略探索,如刘键等分析了西藏居民食物消费结构,并在此基础上研究了西藏的粮食供求关系[27];高利伟等运用农户调研数据研究了西藏不同地区农牧民食物消费结构特征和膳食营养状况[28]。但这些研究仅初步证实了西藏农牧民之间的食物消费模式变化及差异,并未对差异背后的驱动因素进行深入研究,立足宏观视角的西藏农区居民食物消费模式的演变机制尚不清晰。
鉴于此,本文以青藏高原“一江两河”地区为例,通过入户调查的方式获取居民全年家庭食物消费数据,深入剖析农牧民的食物消费特征、差异及影响因素。与其他文献相比,本文的创新之处在于:第一,采用入户调查的全年消费数据进行分析,比以往研究常用的数据更加系统、全面;第二,采用居民食物消费综合差异指标衡量居民食物消费模式,探究其影响因素,比已有文献常用的食物消费总量、食物消费支出更能体现居民食物消费模式的差异程度。此外,“一江两河”地区是西藏自治区主要的农业种植区和粮食主产区,以此为研究区,不仅能客观反映青藏高原农区居民的食物消费情况,同时能够补充现有研究中对特殊主体功能区域居民食物消费研究的不足。本文的研究结果可为西藏农村居民食物消费结构改善、膳食营养提升以及农牧业耦合发展提供科学基础和指导建议,并为高原食物消费的相关研究提供借鉴。
2 数据获取与研究方法
2.1 研究区概况
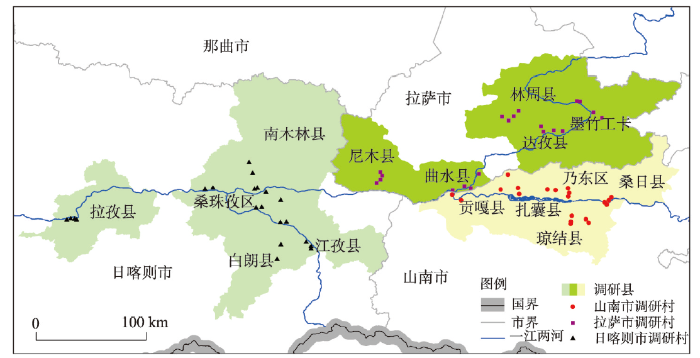
“一江两河”地区是指雅鲁藏布江、拉萨河、年楚河的中部流域地区,位于西藏自治区的南部,面积约6.67万km2,占西藏自治区总面积的5.48%。该区域共包括拉萨市、山南市、日喀则市3个地级市的18个县(区),各市发展情况如表1所示;区域总人口约为自治区总人口的1/3,社会经济发展水平相对较高。“一江两河”位于西藏自治区的腹心地带,不仅是青藏高原地区重要的粮食产区,同时也是该区域政治、经济和文化中心。Tab. 1
表1
表12018年西藏“一江两河”地区各市发展情况
Tab. 1
| 地级市 | 行政区域 | 地区生产 总值(亿元) | 人口 (万人) | 区域面积 (万km2) | 种植面积 (万hm2) |
|---|---|---|---|---|---|
| 拉萨 | 城关区、曲水、墨竹工卡、林周、堆龙德庆、达孜、尼木 | 436.67 | 49.94 | 1.95 | 4.64 |
| 日喀则 | 桑珠孜区、江孜、拉孜、白朗、谢通门、南木林 | 152.87 | 44.27 | 3.78 | 5.69 |
| 山南 | 乃东、扎囊、桑日、贡嘎、琼结 | 105.21 | 18.64 | 1.04 | 1.96 |
新窗口打开|下载CSV
2.2 数据获取
本文调研组自2019年8月1—31日在“一江两河”地区开展了为期31 d的入户调查,共计12人参与。调查采用多阶段抽样调查的方式,为了确保抽样到的农户具有代表性,调研团队在正式调研前进行了大量的走访调查,并在当地政府工作人员的帮助下熟悉了各个调研目的地的发展情况。随后,分3步完成抽样工作:① 结合当地的经济发展水平、产业结构,在拉萨、日喀则、山南各选取5个县进行调研,共计15个县城,分别为拉萨市的达孜县、林周县、墨竹工卡县、尼木县、曲水县,日喀则市的白朗县、江孜县、拉孜县、南木林县、桑珠孜区,山南市的贡嘎县、乃东区、琼结县、桑日县、扎囊县。② 根据距离县城的相对位置(近郊、普通、远郊),在每个县城抽样3~5个村,共涉及到61个村(图1)。③ 每个村子根据家庭规模、收入水平选择5户左右农户家庭进行入户访谈。县和村的抽样在当地自治区、市、县相关政府部门的帮助下完成,调研户抽样在村负责人的帮助下完成。访谈通过回顾性调查的方式获取居民家庭上年度一整年的消费数据。其中,食物消费自产量结合农牧民的种植养殖情况和消耗情况计算得出,购买量则通过回忆的方式获取。在经过多次检查核对后,本次调研共入户调查306户,获得有效样本262份,有效率达85.62%。图1
 新窗口打开|下载原图ZIP|生成PPT
图1样本调研区域分布情况
注:基于自然资源部标准地图服务网站GS(2019)1822号标准地图制作,底图边界无修改。
Fig. 1Distribution of sample sites in the survey area
考虑到西藏自治区的粮食主要依靠本地生产[28],居民的种植养殖情况与食物消费密切相关,因此本次问卷调查主要从以下3个方面开展:① 家庭种植养殖信息,包括种植(养殖)种类、产量、消费量等信息;② 家庭食物消费信息,包括居民家庭对各类食物的年消费总量、自产量和购买量。其中,自产量是指自家生产或亲朋好友赠送食物的重量,购买量指市场购买食物的重量;③ 家庭基本信息,包括人口规模、收入情况、务工情况以及家庭成员信息。本次调研仅包含居家食物消费量,外出就餐数据暂不统计在内。
2.3 研究方法
2.3.1 食物种类划分 本次调研的食物种类主要包括蔬菜(包含土豆)、水果、蛋类、奶类(包括液体奶、酥油、奶粉、奶渣)、肉类(包括牛肉、羊肉、猪肉、禽肉)、大米、面粉(包括面粉、面条、馒头等面食)、青稞(糌粑、青稞酒)、啤酒、食用油十大类。其中,所有的食物消费量均为生食的重量,如酥油、奶粉、奶渣均通过转换系数转化为原材料液体奶的重量,面条、馒头等面食则转化为原材料面粉的重量,转化系数由农户调研所得。由于“一江两河”农区居民的食用油多为菜籽油,因此在研究食物分类时将其划分为植物性食物。2.3.2 食物消费量核算
(1)食物消费总量
食物消费总量包括食物消费自产量和食物消费购买量两部分,即:
式中:FCTotal为一年之内食物消费的总量;FCP为食物消费自产量;FCB为食物消费购买量;
(2)食物人均消费量
为评估“一江两河”农区居民的食物消费水平和消费结构,以户为单位,计算人均年食物消费量,即:
式中:PFC为人均食物消费量;N为实际家庭人数。
(3)食物消费自给率
食物消费自给率是指食物消费自产量占食物消费总量的比率,通常可以衡量和比较不同地区的食物供给情况。其计算公式为:
式中:W为食物消费自给率。
(4)食物消费综合差异
为探究不同家庭间食物消费差异及其影响因素,选择单个家庭的人均食物消费与地区人均食物消费之间的差异为研究对象。由于食物消费差异具有综合效应,单一的食物消费差异无法全面反映总体食物消费差异,因此选择各类食物消费量绝对差值的平均值作为消费差异的衡量指标[29]。其计算公式如下:
式中:
2.3.3 模型选择 为比较案例区不同家庭间食物消费结构差异,本文选用单因素方差分析对各类食物的消费量进行对比。为进一步明确影响居民食物消费差异的因素,选用多元线性回归模型对可能的影响因素变量进行回归分析。其模型公式如下:
式中:
Tab. 2
表2
表2食物消费综合差异影响因素模型变量及其定义
Tab. 2
| 变量类别 | 变量 | 变量符号 | 变量定义 |
|---|---|---|---|
| 因变量: | |||
| 家庭人均食物消费综合差异 | 各类食物家庭人均食物消费量和地区人均食物消费量差值绝对值的均值 | ||
| 自变量: | |||
| 家庭信息 特征 | 区域 | ||
| 拉萨市 | Lhasa | 居民家庭所在城市为拉萨取值为1,否则为0 | |
| 日喀则市 | Rikaze | 居民家庭所在城市为日喀则取值为1,否则为0 | |
| 山南市 | Shannan | 居民家庭所在城市为山南取值为1,否则为0 | |
| 家庭规模类型 | |||
| 小型家庭(1~4人) | small family | 居民家庭人数为1~4人取值为1,否则为0 | |
| 中型家庭(5~7人) | medium family | 居民家庭人数为5~7人取值为1,否则为0 | |
| 大型家庭(8人以上) | large family | 居民家庭人数在8人以上取值为1,否则为0 | |
| 家庭务工规模 | migrant workers | 居民家庭中外出务工人数占总人数的比例 | |
| 家庭年均收入 | income | 居民家庭年均总收入 | |
| 家庭平均年龄 | age | 居民家庭成员平均年龄大小 | |
| 家庭种植 养殖情况 | 家庭种植面积 | planting area | 居民家庭实际种植面积总和 |
| 食物消费自给率 | proportion of self- produced food | 居民家庭自产食物消费量占食物消费总量的比例 | |
| 牲畜饲养情况 | livestock | 若家中饲养牲畜取值为1,否则为0 | |
| 家禽饲养情况 | poultry | 若家中饲养家禽取值为1,否则为0 |
新窗口打开|下载CSV
3 结果分析
3.1 样本概况
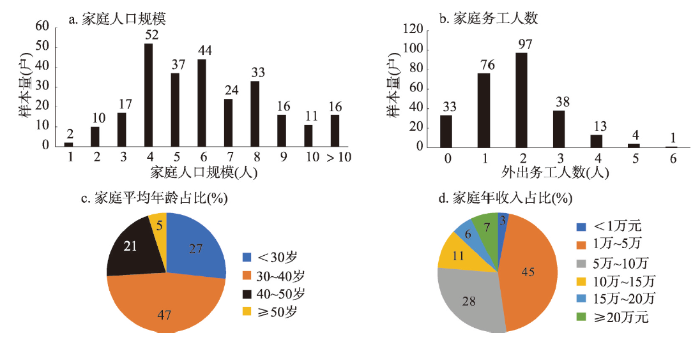
调研样本262户家庭中,人口规模在1~15人之间,家庭平均人口为6人,以4口家庭(19.85%)、6口家庭(16.79%)居多(图2a)。其中,87.40%的家庭中有外出务工人员,务工人数在1~6人之间,以2人居多,户均外出务工人数1.8人(图2b)。从年龄结构来看,户均平均年龄35.58岁,一半左右的家庭平均年龄为30~40岁(47%)(图2c)。家庭收入方面,绝大多数家庭的年收入在1万~5万元之间(45%),年收入1万元以下的家庭最少,占样本总量的3%(图2d)。图2
 新窗口打开|下载原图ZIP|生成PPT
图2调研户家庭人口规模、务工人数、家庭平均年龄和家庭年收入分布
Fig. 2Distribution of size, migrant workers, age, and income of investigated households
3.2 居民家庭食物消费总体特征
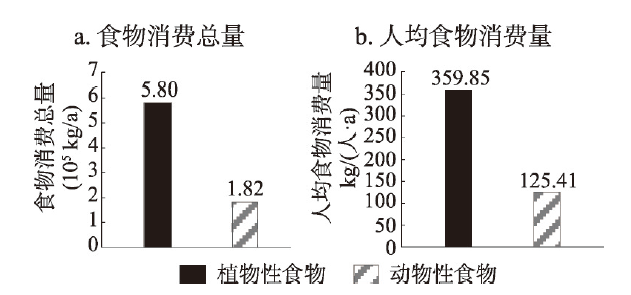
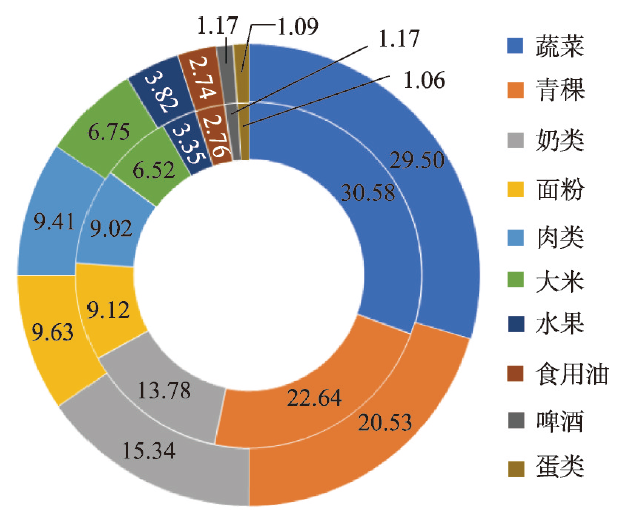
分析显示,无论是总量还是人均消费量,“一江两河”居民植物性食物消费量远多于动物性食物。2018年,262户家庭的食物消费总量为761646.79 kg。其中,植物性食物占比76.15%,约是动物性食物(23.85%)的3.19倍(图3a);人均食物消费总量为485.26 kg/(人·a),植物性食物消费占比(74.16%)约是动物性食物(25.84%)的2.87倍(图3b)。总体上,当地居民的食物消费结构比较单一,蔬菜消费占比最高(30.58%),其次是青稞(22.64%)。青稞作为青藏高原地区特色粮食作物,长期以来都是藏民的主要食物。约有50.33%的青稞用于制作糌粑直接食用,49.67%的青稞用于酿造青稞酒。青稞(糌粑)的消费量占食物消费总量的比例为11.40%,略高于面粉(9.12%)、大米(6.52%)等其他粮食种类。此外,得益于西藏稳定发展的畜牧业,奶类(13.78%)和肉类(9.02%)的消费量也相对较高,而水果(3.35%)、食用油(2.76%)、啤酒(1.17%)、蛋类(1.06%)的消费占比则相对较低。图3
 新窗口打开|下载原图ZIP|生成PPT
图3植物性食物和动物性食物消费量分布
注:青稞酒中青稞与水的比例为1:4,计算植物性食物消费总量及人均消费量时仅计算青稞酒所需青稞消费量。
Fig. 3Consumption of plant food and animal food
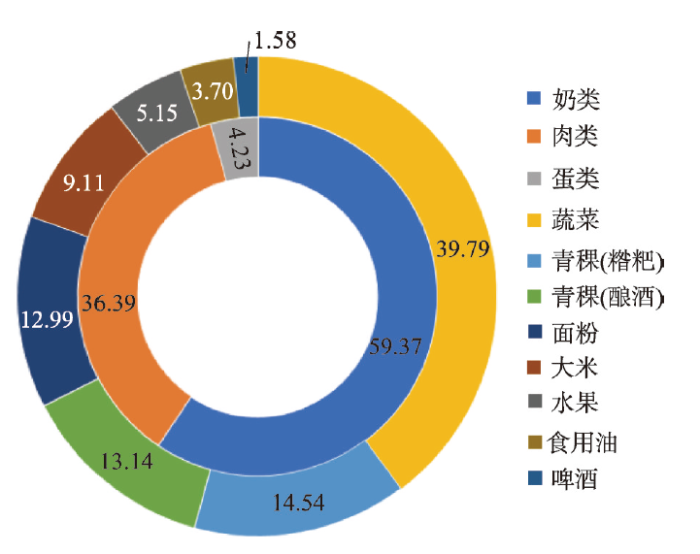
人均食物消费结构比例与食物消费总量类似(图4)。在植物性食物人均消费中,蔬菜(39.79%)消费占比最高,其次为青稞,青稞(糌粑)、青稞(酿酒)合计占比为27.68%,而水果、食用油、啤酒的消费量则相对较少,合计占比仅10%左右(表3、图5)。在粮食消费中,青稞(糌粑)和面粉是藏民主要消费的粮食作物,两者的消费量分别为52.31 kg/(人·a)、46.74 kg/(人·a),约是大米消费量的1.5倍左右。在动物性食物人均消费中,奶类和肉类是主要的消费食物,但消费结构单一。其中,当地居民的肉类消费以牛肉为主,羊肉为辅,猪肉、禽肉消费较少。而蛋类的消费占比则不足5%(表3、图5)。
图4
 新窗口打开|下载原图ZIP|生成PPT
图4各类食物消费量占家庭食物消费量占比(%)
注:内圈食物消费总量为761646.79 kg/a;外圈人均食物消费总量为485.26 kg/(人∙a)。
Fig. 4Proportion of various food consumptions (%)
Tab. 3
表3
表3居民家庭食物消费总量和人均消费量
Tab. 3
| 食物分类 | 消费总量(kg/a) | 自产量(kg/a) | 购买量(kg/a) | 自给率(%) | 人均消费量(kg/(人·a)) | |
|---|---|---|---|---|---|---|
| 植物性 食物 | 蔬菜 | 232910.71 | 139328.50 | 93582.21 | 59.82 | 143.17 |
| 大米 | 49632.00 | 0.00 | 49632.00 | 0 | 32.77 | |
| 面粉 | 69496.71 | 50473.37 | 19023.34 | 72.63 | 46.74 | |
| 青稞 | 172446.75 | 169909.75 | 2537.00 | 98.53 | 99.64 | |
| 青稞(糌粑) | 86796.50 | 84946.50 | 1850.00 | 97.87 | 52.31 | |
| 青稞酒 | 428251.25 | 424816.25 | 3435.00 | 99.20 | 236.46 | |
| 水果 | 25528.90 | 425.00 | 25103.90 | 1.66 | 18.53 | |
| 食用油 | 21027.44 | 19469.80 | 1557.64 | 92.59 | 13.30 | |
| 啤酒 | 8919.00 | 0.00 | 8919.00 | 0 | 5.70 | |
| 动物性 食物 | 奶类 | 104964.31 | 89283.74 | 15680.57 | 85.06 | 74.46 |
| 肉类 | 68677.28 | 44343.75 | 24333.53 | 64.57 | 45.64 | |
| 蛋类 | 8043.69 | 1944.63 | 6099.06 | 24.18 | 5.31 |
新窗口打开|下载CSV
图5
 新窗口打开|下载原图ZIP|生成PPT
图5各类植物性食物和动物性食物消费占比(%)
注:内圈动物性食物人均消费量125.41 kg/(人·a);外圈植物性食物人均消费量359.85 kg/(人·a)。
Fig. 5Proportion of various food consumptions by plant food and animal food (%)
从各类食物的自给率分析,消费的食物主要依靠自家生产,自给自足特征显著。青稞的自给率最高(98.53%),且青稞酒的自给率略高于糌粑。其次是食用油,当地农村居民的食用油主要为菜籽油,来自西藏主要农作物之一油菜,自给率可高达92.59%(表3)。其余自给率较高的食物有奶类、面粉、肉类和蔬菜,自给率均在50%以上;而水果、蛋类的自给率则相对较低,大米和啤酒则完全依靠市场购买。
3.3 家庭食物消费结构差异对比分析
城市化水平是影响居民食物消费结构和消费水平的重要因素[30]。研究结果显示,不同地区的居民家庭在大米(P < 0.1)、面粉(P < 0.05)、青稞(P < 0.01)、水果(P < 0.01)、食用油(P < 0.01)以及动物性食物(P < 0.01)的消费上存在明显差异(表4)。其中,经济发展水平较高的拉萨、日喀则地区的居民家庭在大米、面粉和水果的消费量上要低于发展水平较低的山南地区;青稞消费上,日喀则地区的家庭人均消费量最高,山南地区最少,且3个地区的青稞消费量差异较大。这主要是由当地种植结构决定的,调研中发现,拉萨和日喀则地区的青稞人均种植面积分别为1720 m2、1786.67 m2,而山南地区青稞人均种植面积仅533.33 m2。此外,在食用油和动物性食物消费上,日喀则地区的居民食用油消费量最多,而动物性食物消费量最少,拉萨则与之相反。Tab. 4
表4
表4不同居民家庭食物人均消费差异比较(kg/(人·a))
Tab. 4
| 组别 | 分类 | 蔬菜 | 大米 | 面粉 | 青稞 | 水果 | 食用油 | 啤酒 | |||||||||||||
|---|---|---|---|---|---|---|---|---|---|---|---|---|---|---|---|---|---|---|---|---|---|
| 均值 | F值 | 均值 | F值 | 均值 | F值 | 均值 | F值 | 均值 | F值 | 均值 | F值 | 均值 | F值 | ||||||||
| 地区 | 拉萨 | 143.65 | 0.176 | 30.31 | 2.35* | 42.78 | 4.467** | 103.36 | 34.201*** | 18.65 | 10.191*** | 11.15 | 8.882*** | 5.83 | 0.118 | ||||||
| 日喀则 | 148.43 | 31.67 | 41.53 | 157.31 | 11.62 | 16.78 | 3.08 | ||||||||||||||
| 山南 | 138.36 | 36.72 | 55.87 | 48.73 | 23.90 | 13.16 | 7.63 | ||||||||||||||
| 家庭 规模(人) | 1~4 | 156.01 | 1.179 | 38.75 | 6.886*** | 60.70 | 10.199*** | 79.62 | 5.309*** | 26.08 | 6.360*** | 15.53 | 4.364** | 4.22 | 2.502* | ||||||
| 5~7 | 132.23 | 32.70 | 42.12 | 95.67 | 18.42 | 11.69 | 7.99 | ||||||||||||||
| ≥ 8 | 144.61 | 26.49 | 38.28 | 126.46 | 10.61 | 13.13 | 4.11 | ||||||||||||||
| 务工 规模 | <0.2 | 148.20 | 0.152 | 34.29 | 0.330 | 48.14 | 0.164 | 104.39 | 2.066 | 16.54 | 8.056*** | 13.45 | 0.23 | 4.93 | 0.415 | ||||||
| 0.2~0.4 | 140.07 | 32.11 | 45.39 | 107.09 | 14.53 | 13.18 | 5.58 | ||||||||||||||
| ≥ 0.4 | 141.97 | 31.87 | 47.38 | 78.42 | 29.09 | 13.28 | 7.01 | ||||||||||||||
| 家庭 年均 收入(万元) | <3 | 137.18 | 0.630 | 35.35 | 0.937 | 51.41 | 2.569* | 81.34 | 2.028 | 16.60 | 0.391 | 13.05 | 1.345 | 4.83 | 0.649 | ||||||
| 3~6 | 146.19 | 31.93 | 47.46 | 108.05 | 20.89 | 12.73 | 6.93 | ||||||||||||||
| 6~10 | 132.52 | 33.76 | 49.69 | 94.92 | 16.78 | 12.49 | 6.50 | ||||||||||||||
| ≥ 10 | 159.13 | 28.94 | 34.28 | 119.68 | 19.15 | 15.65 | 3.95 | ||||||||||||||
| 家庭 平均 年龄(岁) | <30 | 137.72 | 0.619 | 30.15 | 0.768 | 38.09 | 5.342*** | 89.02 | 1.137 | 15.97 | 2.266* | 11.96 | 0.857 | 6.45 | 0.761 | ||||||
| 30~35 | 139.13 | 32.38 | 41.24 | 106.17 | 14.70 | 13.32 | 4.00 | ||||||||||||||
| 35~40 | 137.19 | 33.45 | 50.40 | 115.62 | 18.17 | 13.98 | 5.07 | ||||||||||||||
| ≥ 40 | 158.58 | 35.55 | 59.47 | 91.13 | 25.87 | 14.19 | 7.26 | ||||||||||||||
| 组别 | 分类 | 奶类 | 肉类 | 蛋类 | 植物性食物 | 动物性食物 | 食物消费总量 | ||||||||||||||
| 均值 | F值 | 均值 | F值 | 均值 | F值 | 均值 | F值 | 均值 | F值 | 均值 | F值 | ||||||||||
| 地区 | 拉萨 | 88.45 | 2.147 | 41.69 | 0.887 | 5.06 | 0.396 | 355.73 | 1.729 | 135.21 | 5.202*** | 490.94 | 1.417 | ||||||||
| 日喀则 | 50.76 | 44.90 | 6.18 | 410.42 | 101.84 | 512.26 | |||||||||||||||
| 山南 | 76.06 | 51.15 | 4.90 | 324.38 | 132.11 | 456.49 | |||||||||||||||
| 家庭 规模(人) | 1~4 | 105.53 | 4.830*** | 53.21 | 2.483* | 5.67 | 0.742 | 380.90 | 1.323 | 164.41 | 7.534*** | 545.30 | 4.956** | ||||||||
| 5~7 | 69.25 | 45.60 | 5.84 | 340.82 | 120.69 | 461.51 | |||||||||||||||
| ≥ 8 | 48.53 | 37.64 | 4.18 | 363.68 | 90.35 | 454.03 | |||||||||||||||
| 务工 规模 | <0.2 | 62.24 | 0.979 | 45.51 | 0.301 | 4.56 | 0.440 | 369.94 | 0.732 | 112.31 | 0.173 | 482.25 | 0.027 | ||||||||
| 0.2~0.4 | 80.59 | 44.24 | 5.84 | 357.95 | 130.66 | 488.61 | |||||||||||||||
| ≥ 0.4 | 80.11 | 48.55 | 5.34 | 349.02 | 134.00 | 483.02 | |||||||||||||||
| 家庭 年均 收入 | <3 | 75.63 | 0.044 | 50.70 | 0.103 | 5.13 | 0.660 | 339.76 | 0.919 | 131.45 | 0.149 | 471.22 | 0.576 | ||||||||
| 3~6 | 73.94 | 43.83 | 5.44 | 374.18 | 123.21 | 497.40 | |||||||||||||||
| 6~10 | 69.93 | 40.76 | 6.63 | 346.65 | 117.32 | 463.97 | |||||||||||||||
| ≥ 10 | 78.38 | 45.84 | 3.90 | 380.79 | 128.12 | 508.91 | |||||||||||||||
| 家庭 平均 年龄(岁) | <30 | 81.41 | 0.210 | 42.55 | 2.793* | 5.74 | 0.257 | 329.36 | 1.780 | 129.69 | 0.546 | 459.05 | 1.573 | ||||||||
| 30~35 | 72.56 | 38.84 | 5.81 | 350.93 | 117.21 | 468.14 | |||||||||||||||
| 35~40 | 64.85 | 44.33 | 4.81 | 373.88 | 113.99 | 487.87 | |||||||||||||||
| <40 | 76.69 | 57.68 | 4.66 | 392.04 | 139.03 | 531.07 | |||||||||||||||
新窗口打开|下载CSV
通过对不同规模家庭人均食物消费量的对比可以发现,总体上家庭规模越小,居民人均食物消费量越大,尤其是在大米(P < 0.01)、面粉(P < 0.01)、食用油(P < 0.05)、水果(P < 0.01)、奶类(P < 0.01)、肉类(P < 0.1)等食物的消费上(表4)。此外,西藏农区居民的动物性食物消费量(P < 0.01)和食物消费总量(P < 0.05)也呈现随家庭规模扩大而减少的趋势,这与山东农村居民的食物消费规律相一致[31]。一方面,1~4人的家庭多为青壮年家庭,其家庭平均年龄为39.04岁,家中成员大多为劳动人口,食物消费量较高;而5~7人、8人以上的家庭中多包含老人和儿童,相比于劳动人口,食物消费较少。另一方面,这也与家庭的食物浪费程度有关,Li等在研究山东农村居民食物浪费特征时发现,与人口较多的大家庭相比,人口较少的单身家庭食物浪费现象更严重,这无疑增加了小规模家庭的食物消费整体水平[32]。不同家庭规模的居民在青稞(P < 0.01)和啤酒(P < 0.1)的消费上也存在差异(表4)。其中,青稞的消费量随家庭规模的扩大而增加,8人以上家庭的青稞消费量最多,且远高于其他家庭;而啤酒的消费量则表现为5~7人家庭消费最多,8人以上家庭消费最少。8人以上的家庭通常老人、未成年人较多,一方面受传统文化习俗的影响,老年人对藏族传统饮食习惯的保留和继承更为完整,对藏族传统食物青稞的消费量更多;另一方面受年龄限制,老年人和未成年人无法饮酒,导致8人以上家庭啤酒人均消费量最少。不同务工规模和收入水平下的居民家庭食物消费结构同样存在差异。外出务工不仅能为家庭带来经济收入,也可以带来外界开放的信息和经验,改善家庭食物消费习惯。其中,不同务工规模的家庭主要在水果(P < 0.01)消费上呈现差异(表4),务工规模超过0.4的家庭消费量最高,务工规模在0.2~0.4之间的家庭消费量最少。而不同收入水平家庭之间的消费差异则主要体现在面粉(P < 0.1)上,呈现出消费量随收入增加而递减的趋势(表4)。然而,不同务工规模和收入水平下的家庭在食物消费总量上的差异并不显著,这与已有的研究结果有所差异[33]。调研发现,虽然该地区居民外出打工比例较高,但是不少居民选择在村内或周边地区务工,在饮食习惯上依然保持着传统的饮食方式,这在一定程度上造成了不同务工规模家庭之间消费差异较小。另一方面,受西藏特殊地理环境的影响,当地食物市场化供应不足,自给自足的消费特征显著,供给的不足削弱了居民的食物购买消费能力,从而缩小了不同收入家庭之间的食物消费差异。不同年龄阶段家庭的食物消费差异主要体现在面粉(P < 0.01)、水果(P < 0.1)、肉类(P < 0.1)等食物的消费上(表4),并且在一定范围内呈现人均食物消费量随着家庭年龄的上升而不断增加的特征。
3.4 家庭食物消费差异影响因素分析
根据模型分析要求,最终有231份样本数据纳入到多元线性回归分析模型中,平均家庭种植面积达1.45万m2,平均食物消费自给率为63%,96.54%的居民家中饲养牲畜,21.21%的居民家中饲养家禽,居民家庭食物消费综合差异的均值为32.01 kg/(人·a)(表5)。根据所构建的模型,运用spss软件进行回归,各变量间不存在高度共线性。回归结果显示,区域差异、家庭规模类型、家庭务工规模3个因素对居民家庭食物消费综合差异影响显著(表6)。具体来看:① 不同区域之间居民食物消费差异不同,相比于拉萨地区,日喀则地区农区居民的人均食物消费综合差异更大,消费结构更加不同;② 家庭规模类型对居民的食物消费综合差异产生显著影响,中型家庭(5~7人)和大型家庭(8人以上)的食物消费结构差异均小于家庭人数在1~4人之间的小型家庭;③ 家庭务工规模对食物消费综合差异具有正向的影响。家庭务工规模越高,其食物消费综合差异越大。可见,随着藏区居民外出务工比例的增大,与外界的沟通交流频繁,其家庭饮食消费结构越容易受到影响。Tab. 5
表5
表5影响居民家庭食物消费综合差异的主要变量描述性统计
Tab. 5
| 变量名称 | 变量符号 | 样本量 | 最大值 | 最小值 | 均值 | 标准差 |
|---|---|---|---|---|---|---|
| 家庭人均食物消费综合差异 | 231 | 122.78 | 10.86 | 32.01 | 15.721 | |
| 拉萨市 | Lhasa | 231 | 1 | 0 | 0.38 | 0.486 |
| 日喀则市 | Rikaze | 231 | 1 | 0 | 0.25 | 0.435 |
| 山南市 | Shannan | 231 | 1 | 0 | 0.37 | 0.484 |
| 小型家庭(1~4人) | small family | 231 | 1 | 0 | 0.33 | 0.472 |
| 中型家庭(5~7人) | medium family | 231 | 1 | 0 | 0.40 | 0.491 |
| 大型家庭(8人以上) | large family | 231 | 1 | 0 | 0.27 | 0.444 |
| 家庭务工规模 | migrant workers | 231 | 1 | 0 | 0.29 | 0.192 |
| 家庭年均收入 | income | 231 | 180 | 0 | 8.30 | 14.904 |
| 家庭平均年龄 | age | 231 | 67.50 | 15.38 | 35.71 | 8.308 |
| 家庭种植面积 | planting area | 231 | 130 | 0 | 21.72 | 19.698 |
| 食物消费自给率 | proportion of self-produced food | 231 | 0.93 | 0.09 | 0.63 | 0.195 |
| 牲畜饲养情况 | livestock | 231 | 1 | 0 | 0.97 | 0.183 |
| 家禽饲养情况 | poultry | 231 | 1 | 0 | 0.21 | 0.410 |
新窗口打开|下载CSV
Tab. 6
表6
表6居民家庭食物消费综合差异影响因素回归结果
Tab. 6
| 变量名称 | 变量符号 | 系数 | 标准误 | t值 |
|---|---|---|---|---|
| 日喀则市 | Rikaze | 7.708 | 2.898 | 2.659*** |
| 山南市 | Shannan | 2.33 | 2.551 | 0.913 |
| 中型家庭(5~7人) | medium family | -6.352 | 2.53 | -2.511** |
| 大型家庭(8人以上) | large family | -6.565 | 3.229 | -2.033** |
| 家庭务工规模 | migrant workers | 11.069 | 5.495 | 2.014** |
| 家庭年均收入 | income | -0.052 | 0.075 | -0.702 |
| 家庭平均年龄 | age | 0.101 | 0.133 | 0.76 |
| 家庭种植面积 | planting area | -0.016 | 0.061 | -0.262 |
| 食物消费自给率 | proportion of self-produced food | 7.024 | 5.597 | 1.255 |
| 牲畜饲养情况 | livestock | -3.631 | 5.65 | -0.643 |
| 家禽饲养情况 | poultry | 1.787 | 2.561 | 0.698 |
| 常数 | constant | 26.098 | 8.782 | 2.972*** |
新窗口打开|下载CSV
4 结论与讨论
立足青藏高原绿色发展和乡村振兴战略背景,运用实地入户调查数据,对青藏高原“一江两河”地区农区居民家庭食物消费结构、特征及影响因素进行了实证研究,得出如下结论:(1)西藏农区居民植物性食物消费量高于动物性食物,是动物性食物的3.19倍。其中,蔬菜和粮食在家庭食物消费中占有主要地位,蔬菜消费占比最高,粮食则以青稞和面粉为主,这与广大农村地区的居民食物消费结构一致[31]。但同时也体现了典型的牧区消费特征和藏族饮食特色:奶类和肉类消费并重,肉类消费以牛羊肉为主,猪肉、禽肉消费较少;对水果和蛋类的消费较少,低于全国农村平均消费水平。此外,青稞酒作为藏族传统特色食品,在藏民饮食消费中仍然占据重要地位,居民每年消费的青稞约有一半用于酿造青稞酒。
(2)从西藏农区居民食物消费自给率来看,青稞、食用油、奶类3种食物的自给率较高,水果、蛋类的自给率较低,大米和啤酒则完全依靠市场购买。西藏农区居民对食用油、奶类、肉类等自给率较高食物的消费量均高于全国农村平均消费水平;对水果、蛋类等自给率较低食物的消费量则低于后者,整体上呈现出自给自足的食物消费特征。
(3)不同地区、家庭规模、务工规模、收入水平及家庭年龄之间,居民家庭食物消费结构均有所差异。其中,不同地区居民家庭在大米、面粉、青稞、水果、食用油以及动物性食物消费量上存在明显差异;由于家庭规模导致的食物消费差异最为显著,体现在大米、面粉、水果、奶类、肉类、青稞、啤酒、食用油以及动物性食物消费量和食物消费总量上;家庭平均年龄不同,居民对面粉、水果和肉类等食物的消费量不同;务工规模和收入水平则分别使居民的水果和面粉消费产生差异。综合来看,面粉和水果是不同居民家庭之间消费差异最显著的2种食物。
(4)区域差异、家庭规模类型和家庭务工规模是导致西藏农区居民食物消费差异的主要因素。居民家庭所在的区域不同,其经济发展水平、食物生产资源、种植养殖结构以及食物消费习惯等均有所差异,这些因素都会直接或间接影响到居民的食物消费水平,形成不同的食物消费结构。家庭规模类型则可能通过影响家庭经济水平间接影响居民食物消费情况,人口规模较大的家庭,尤其是老年人和未成年人较多的家庭,其所承受的经济负担更重,家庭膳食质量会相对较差 [34],在食物消费种类和消费量上与其他家庭形成差异。家庭务工规模则与之相反,务工规模越大,居民的收入来源越丰富,接触到的外来食物消费信息增多,逐渐形成新的消费习惯,改变传统的食物消费结构。
谷树忠[35]、高利伟等[28]分别研究了20世纪90年代及2010年西藏居民食物消费特征,将其与本文结果相对比,从食物消费结构来看,西藏农村居民依然保持着传统的饮食习惯,自给自足的食物消费特征显著,粮食消费粗粮以青稞为主,细粮以小麦为主;肉类消费较高,而水果、蔬菜等其他食物消费不足。但是,从食物消费量来看,不同食物之间的变化有所差异。其中,粮食的消费量先增加后减少,由1998年的232.92 kg/(人·a),增加到2010年的246.37 kg/(人·a),随后下降到2018年的179.15 kg/(人·a),与中国农村粮食消费变化趋势相一致[36];蔬菜消费量则显著增加,从1998年的33.67 kg/(人·a)增加到2010年的128.26 kg/(人·a)、2018年的143.17 kg/(人·a),食物消费结构朝着合理化多样化的方向发展。
与现阶段中国居民平衡膳食营养宝塔相比[37],青藏高原“一江两河”农区居民饮食消费仅蔬菜类符合合理膳食标准,油、畜禽肉、谷物类3项高于推荐标准,奶及奶制品、蛋类、水果类3项低于推荐标准。其中,畜禽肉类消费量远超推荐摄入量,是推荐摄入量的1.67~3.13倍,而对蛋类和水果的摄入量严重不足,仅为推荐摄入量的1/3、1/4。总体来看,该地区饮食消费口味偏重,且以高蛋白、高脂肪食物为主,饮食搭配不均,与均衡营养膳食仍有一定差距。从营养学的角度来看,长期过量摄入高蛋白、高脂肪容易引起系列疾病,如胆结石等,这也导致藏民的胆囊结石发病率远高于其他民族[38]。
综合来看,尽管西藏农区居民的饮食消费结构逐渐优化,但仍然存在膳食多样性较低、营养消费不均衡等问题,需要对其进行精准化引导和干预。从食物供给角度来看,一方面西藏现有的粮食产量充足,居民粮食消费得到保障,在此基础上未来可适当减少粮食种植面积,加快优质牧草、大棚蔬菜、设施农业等新型种养殖产业的发展,提升西藏自治区蔬菜、瓜果等食物的自给能力,促进农牧业供给侧结构性改革,助推高原绿色食物消费体系建设;另一方面,政府要加快完善西藏自治区内外部交通设施,加快发展冷链物流、保鲜仓储等技术,提升食物流通能力,丰富食物市场供给。另外,针对当地居民不均衡的食物消费结构,未来要持续加强对高原地区居民的营养宣传教育,培养居民的平衡膳食理念,科学合理调整饮食行为,进一步优化当地的饮食消费结构。
参考文献 原文顺序
文献年度倒序
文中引用次数倒序
被引期刊影响因子
DOI:10.18306/dlkxjz.2019.07.008 [本文引用: 1]

Food is related to the national economy and people's livelihood. China's food system is facing many challenges. The reduction of cultivated land resources, criticality of environmental pressures, loss of agricultural workforce, and rapid transformation of consumer demand have placed higher demands on food system functions. At the present in China, food system research is insufficient and the research content is fragmented, which cannot meet the needs and challenges of the society today. This article provides an in-depth analysis of the evolving concept of food system, summarizing the conceptual issues and types and characteristics of food systems. It then examines the progress of food system research, which evolved from concepts to methods, from a linear to a systematic recognition of the concept, from economic activities to food landscapes, from phenomenon descriptions to spatiotemporal analysis, among others, to consolidate the core connotation of the food system. Under the guidance of the human-environmental relationship paradigm, the spatial paradigm, the philosophy of science paradigms, and the systematic science paradigm, and following the path of "pattern-structure-process-mechanism," the spatial and temporal patterns, factor structure, evolution process, and development mechanism of food systems are further explored. The aim of this study is to construct a geographical paradigm of food system research. It intends to provide some references for promoting basic research and practical applications of a food system perspective.
[本文引用: 1]
DOI:10.11821/dlxb202002009 [本文引用: 1]
Food security is the basic foundation in accomplishing of the overall Sustainable Development Goals (SDGs). As the objective in SDGs of "halving the proportion of hungry people by 2015" has not been achieved as scheduled, it will become more challenging to realize its final goal of zero hunger by 2030. So exploring the underlying causes of global food security pattern from perspectives of spatio-temporal evolution is badly needed. In this paper, a comprehensive evaluation method with multi-indices was applied to evaluate the food security level of 172 countries in 2000-2014 based on an established global database with country-specific time series data. Then the spatial pattern and changing characteristics of global food security by country was conducted through the spatial autocorrelation analysis. Upon this basis, the underlying factors affecting the food security pattern were further identified and analyzed with a multiple nonlinear regression method. The findings and results show that: (1) The global food security pattern can be summarized as "high-high and low-low agglomerations" of socio-economic status and food security level. The most food secure countries are mainly distributed in the regions with more advanced economy such as North America, Oceania, parts of East Asia, and Western Europe. On the contrary, the least food secure countries are mainly distributed in sub-Saharan Africa, South Asia, West Asia, and parts of Southeast Asia. (2) At 99% confidence level, Western Europe and sub-Saharan Africa are respectively the hot and cold spots in global food security landscape, while in non-aggregation areas such as Haiti and North Korea, there exist long-term food insecurity problems. (3) The spatio-temporal pattern of global food security is generally stable, but the internal changes in the extremely insecure groups are significant. The countries with the most changeable levels of food security are also the countries with the most food insecurity. (4) Annual mean temperature, per capita GDP, the proportion of people who have access to clean water, and political stability are the key factors affecting the global food security pattern. The study indicates that while the global food security situation has improved since 2000, there was a reverse sign or omen in 2013. Affected by climate change, residents' purchasing power, infrastructure condition, and political and economic stability, global food security has in fact been volatile and some areas in the world are still facing acute food security problems. In addressing this challenge, a food security strategy based on the four dimensions, i.e. food supply, food access, food use and political stability, and a worldwide rural revitalization approach, is highly recommended. Meanwhile, it is necessary to progressively introduce some diversified modes of production such as urban agriculture to build a more resilient food system in those fully urbanized regions.
[本文引用: 1]
[本文引用: 1]
[本文引用: 1]
[本文引用: 1]
[本文引用: 1]
[本文引用: 1]
[本文引用: 1]
DOI:10.31497/zrzyxb.20190401URL [本文引用: 2]
[本文引用: 2]
[本文引用: 1]
[本文引用: 1]
[本文引用: 1]
[本文引用: 1]
[本文引用: 1]
[本文引用: 1]
[本文引用: 1]
[本文引用: 1]
[本文引用: 1]
[本文引用: 1]
[本文引用: 1]
[本文引用: 1]
[本文引用: 1]
[本文引用: 1]
[本文引用: 1]
[本文引用: 1]
[本文引用: 1]
[本文引用: 1]
DOI:10.1080/10971475.2017.1297653URL [本文引用: 1]
[本文引用: 1]
DOI:10.1016/j.worlddev.2018.09.014URL [本文引用: 1]
[本文引用: 1]
[本文引用: 1]
[本文引用: 1]
[本文引用: 1]
[本文引用: 1]
URL [本文引用: 1]
PMID:29903192 [本文引用: 1]
To study the differences in food consumption among rural residents in various regions of China, and to analyze the climatic factors that affect the food consumption of rural residents.Based on the consumption data of 13 kinds of food of rural residents including wheat, rice, other grain, fresh vegetables, pork, beef and mutton, poultry, eggs and related products, milk and related products, aquatic products, edible oil, sugar and liquor collected from the China Statistical Yearbook and China's Economic and social data research platform during 2000 to 2012, cluster analysis was conducted to partition the dietary structure and compare the differences in food consumption in each geographical area. Selecting the average temperature, annual temperature difference, daily temperature difference, average air pressure, average daily precipitation, average wind speed, average relative humidity, average sunshine duration, 8 climatic factors as independent variables from the "Dataset of daily surface observations values in individual years( 1981-2010) in China "and "Dataset of annual values of climate data from Chinese surface stations for global exchange " released by China Meteorological Data Service Center to establish a multivariate linear regression model to study the correlation between food consumption and climate.The geographical partition of dietary structure of rural residents in China was as follows: Beijing-Tianjin region, northeast region, upstream and downstream parts of the Yellow River region, southeast coastal area, the part middle and lower reaches of the Yangtze River region, Lingnan area, southwest region, Inner Mongolia, Tibet, Qing-Xin( Qinghai and Xinjiang)region. In the comparison of annual per capita food consumption in various regions: the consumption of eggs and related products( 12. 96 kg) and edible oil( 10. 18 kg) in BeijingTianjin region, vegetable( 128. 20 kg) in northeastern region, aquatic products( 15. 81 kg) and liquor( 19. 04 kg) in the southeastern coastal areas, rice( 189. 36 kg) and poultry( 10. 17 kg) in Lingnan area, pork( 26. 46 kg) in southwest China, other food( 126. 31 kg), milk and related products( 32. 38 kg), beef and mutton( 12. 87 kg) and sugar( 2. 65 kg) in Tibet, and wheat( 184. 63 kg) in Qingxin region was the highest in China. While the consumption of sugar( 0. 79 kg) in northeastern region, other food( 10. 64 kg) in the southeastern coastal areas, wheat( 0. 60 kg) and milk and related products( 0. 33 kg) in Lingnan area, beef and mutton( 0. 43 kg) in southwest China, edible oil( 4. 21 kg) in Inner Mongolia, vegetables( 19. 21 kg), eggs and related products( 0. 60 kg), aquatic products( 0. 01 kg), pork( 2. 23 kg) and poultry( 0. 03 kg) in Tibet, and rice( 13. 00 kg)and liquor( 2. 25 kg) in Qing-Xin regions was the lowest in China. The result of multiple linear regression analysis of climate and food consumption showed that consumption of wheat in staple foods was negatively correlated with average daily precipitation( P < 0. 01, Adj. R~2= 0. 632); and there was a positive correlation between rice consumption and average daily precipitation, and a negative correlation with average temperature and daily temperature difference( P < 0. 01, Adj. R~2= 0. 839). There was a positive correlation between vegetable consumption and annual temperature difference, and negative correlation with average sunshine duration( P < 0. 01, Adj. R~2= 0. 450). The pork consumption was negatively correlated with the average sunshine duration( P < 0. 01, Adj. R~2= 0. 386).The dietary structure of rural residents in China can bedivided into 10 kinds of geographical partitions. Average daily precipitation is negatively and positively correlated with consumption of wheat and rice, respectively. Average sunshine duration has negative impact on vegetable and pork consumption. Average temperature and daily temperature difference are negatively correlated with rice consumption. And annual temperature difference has positive impact on vegetable consumption.
PMID:29903192 [本文引用: 1]
DOI:10.1177/0973703017698899URL [本文引用: 1]
DOI:10.1007/BF02982614URL [本文引用: 1]
[本文引用: 1]
[本文引用: 1]
[本文引用: 1]
[本文引用: 1]
[本文引用: 3]
[本文引用: 3]
[本文引用: 1]
[本文引用: 1]
[本文引用: 1]
[本文引用: 1]
DOI:10.31497/zrzyxb.20180216URL [本文引用: 2]
[本文引用: 2]
URL [本文引用: 1]
[本文引用: 1]
[本文引用: 1]
[本文引用: 1]
[本文引用: 1]
[本文引用: 1]
[本文引用: 1]
[本文引用: 1]
[本文引用: 1]
http://dg.cnsoc.org/article/04/8a2389fd5520b4f30155be1475e02741.html, 2020.
URL [本文引用: 1]
http://dg.cnsoc.org/article/04/8a2389fd5520b4f30155be1475e02741.html, 2020.]
URL [本文引用: 1]
[本文引用: 1]
[本文引用: 1]
