 ,1, 李正茂1, 张珂1,2, 江涛1
Spatio-temporal dynamic analysis of phytoplankton biomass in Chinese lakes based on Google Earth Engine
HUANG Jue,1, LI Zhengmao1, ZHANG Ke1,2, JIANG Tao1收稿日期:2020-06-30修回日期:2021-04-7
| 基金资助: |
Received:2020-06-30Revised:2021-04-7
| Fund supported: |
作者简介 About authors
黄珏(1987-), 女, 湖南韶山人, 副教授, 研究方向为水环境遥感。E-mail:

摘要
关键词:
Abstract
Keywords:
PDF (3883KB)元数据多维度评价相关文章导出EndNote|Ris|Bibtex收藏本文
本文引用格式
黄珏, 李正茂, 张珂, 江涛. 基于GEE的中国湖泊浮游植物生物量时空动态分析. 地理学报[J], 2021, 76(7): 1693-1707 doi:10.11821/dlxb202107009
HUANG Jue, LI Zhengmao, ZHANG Ke, JIANG Tao.
1 引言
湖泊不仅是气候的指示器,还能对区域气候与环境变化做出响应,在全球碳和养分循环中起着至关重要的作用[1,2]。湖泊的chl-a浓度经常被用来评价湖泊水质及生态环境状况,成为了评估湖泊浮游植物生物量以及湖泊营养状态的重要指标。监测与研究湖泊chl-a浓度的时空分布、动态变化以及对其主要影响因素,对内陆湖泊的生态保护与湖泊各类资源的合理利用等工作具有十分重要的意义。大量研究证实了气候变化对水生生态系统的影响[3,4,5]。中国湖泊的营养状态呈现区域性和时空性差异[6],全国范围内湖泊chl-a浓度变化的影响因素尚不明确。部分湖泊全湖或局部湖区chl-a浓度逐年升高,而部分湖泊chl-a浓度保持稳定或逐年降低。其中,2012—2013年洪泽湖东部湖区3月和8月达到峰值,北部和西部湖区春季变化平缓夏季达到峰值,chl-a浓度变化主要与营养盐的输入有关[7]。2000—2013年巢湖藻类表面水华的覆盖率、频率和持续时间都有所增加,伴有较早的水华形成趋势,气象条件,特别是风速和温度在湖泊的富营养化中起着重要作用[8]。云南九大湖泊的chl-a浓度变化有所差异,其中阳宗海呈现减少趋势,抚仙湖等四湖表现比较稳定,而洱海等四湖表现出较为剧烈的变化[9]。中国十大湖泊的水色指数研究表明,色林错、呼伦湖以及青海湖有变浑浊趋势,而纳木错、兴凯湖、洞庭湖以及洪泽湖有变清澈趋势,湖泊水质和营养状态的变化对水色指数空间分布具有影响[10]。对中国大型湖泊富营养化的现场水质调查结果表明,氮磷盐度、人类活动[11]及气候变化[3]对湖泊富营养化具有重要影响。Benjamin研究全球188个大型湖泊chl-a浓度和湖表面温度之间的年际关联发现,湖表面温度和chl-a浓度相关性的正负和强弱取决于湖泊的营养状态[12]。
多数研究****对于湖泊chl-a浓度的研究多集中于大型湖泊、大洋与其近岸水体,由于实测数据获取的困难性,对于大范围的内陆湖泊群的相关研究较少。同时,对于长时序中国内陆湖泊群的chl-a浓度以及其各项影响因素的研究鲜有发表。此外,在对湖泊chl-a浓度及影响因素进行分析研究时普遍采用的是线性回归分析等多元统计方法,但当多个自变量存在共线性问题或者自变量与因变量关系更为复杂时这些方法常常难以使用,因为这会增大计算误差,同时对于得到的结果也难以解释。为了解决上述问题,本文拟基于遥感定量反演结果进行增强回归树分析,以揭示大范围内陆湖泊浮游植物生物量分布特征及其影响因素。
Google Earth Engine(GEE)是由Google提供的对海量卫星数据进行在线可视化计算分析处理的平台。该平台由Google大规模存储全球尺度地球科学资料,尤其是公开的遥感影像等,同时结合大型数据的云端处理分析服务。GEE拥有海量数据计算能力[13],已经广泛应用于红树林识别[14]、长时序的植被和地球表面水资源变化监测[15,16,17,18]、生态环境监测[19]、森林面积变化[20,21]、耕地提取[22]、区域干旱监测[23]以及洪涝监测[24]等各项研究。增强回归树(Boosted Regression Tress, BRT)是在分类回归树算法(CART)基础上发展的一种自学习算法,BRT不仅可以处理不同类型的预测变量并适应缺失的数据,还可以自动处理预测值之间的交互作用,BRT在应用于地表水污染[25]、城市扩展[26]时,与传统统计学相比,能够更加直观形象地展示各个影响因子作用的强弱。但与此同时,BRT模型也存在一定的局限性,对于数据量较少的小型数据集存在一定的不适用性。
综上,本文使用MODIS等遥感卫星数据以及相关辅助数据,借助GEE云处理平台,对2003—2018年中国湖泊的chl-a浓度进行监测,分析中国湖泊chl-a浓度的分布特征及时空变化情况。同时基于增强回归树方法研究气象因子、社会经济及湖泊基本特征对中国湖泊chla浓度的影响,并分析湖泊中浮游植物生物量全国范围上的时空变化特征。
2 研究区概况与研究方法
2.1 研究区概况
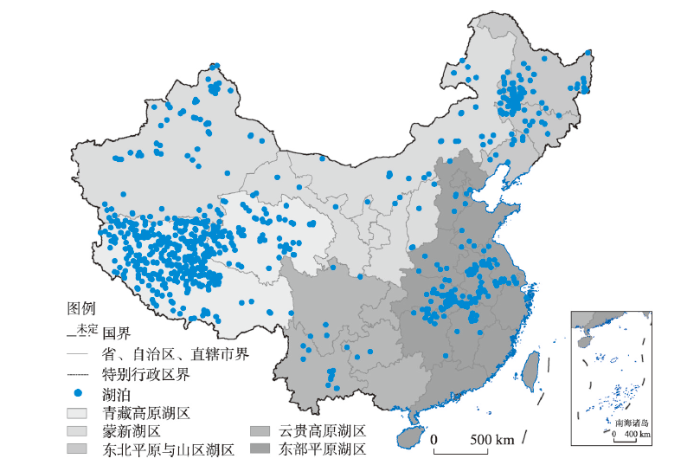
中国幅员辽阔,地势西高东低呈三大阶梯状分布,这使得各地气候变化多样,各个湖泊的形成与变化都与其地理环境紧密相连,因此湖泊受到了地形地貌及气候等因素的影响。中国东北和东部部分湖泊由于水深、悬浮物和藻类丰度高而透明度较低,而云贵高原、内蒙古和新疆自治区部分湖泊表现出中等的净度,西藏高原部分湖泊则显示出较高的透明度[27]。目前中国有1.0 km2以上的自然湖泊2693个,分布在28个省(自治区、直辖市),总面积81414.6 km2,约占中国国土面积的0.9%[28]。其中西藏自治区内湖泊数量最多,湖泊表面积最大,江苏省湖泊拥有率(湖泊总面积/本省国土面积×100%)最高,达到了6.4%,中国前三大湖泊为青海湖、鄱阳湖、洞庭湖[28]。中国湖泊按照地理位置划分为东北平原与山区湖区、蒙新湖区、东部平原湖区、云贵高原湖区、青藏高原湖区[29],如图1所示。图1
 新窗口打开|下载原图ZIP|生成PPT
图1中国湖泊及湖区分布
注:基于自然资源部标准地图服务网站GS(2016)1569号的标准地图制作,底图无修改。
Fig. 1Distribution of lakes and the lake regions in China
2.2 数据来源及处理
研究数据主要包括海洋反射率数据、降水与湖表面温度数据、湖泊基本特征数据、人口数据、地表覆盖类型占比数据以及气候带与气象数据等,数据来源及获取方法如下:(1)chl-a浓度数据。MODIS海洋反射率数据(MYDOCGA)为2级海洋反射率产品,已针对大气条件(如气体、气溶胶和瑞利散射)进行了校正,空间分辨率为1 km,时间分辨率为1 d;本文在GEE平台上利用MODIS海洋反射率产品数据,根据质量控制波段掩膜掉含云像元,反演得到2003—2018年中国湖泊的表层chl-a浓度,并对其进行统计,得到中国湖泊chl-a浓度的年均、月均以及各季节的chl-a浓度值。
(2)降水数据。采用CHIRPS全球降水数据集,空间分辨率为0.05 rad,时间分辨率为1 d,本文选取了自2003—2018年湖泊的日均值降水数据,并对其进行年均值、季均值及月均值统计。
(3)湖表面温度数据(Lake Surface Temperature, LST)。采用MODIS/MOD11A2产品数据,空间分辨率为1 km,时间分辨率为8 d,并获取2003—2018年中国湖泊的月均值数据,同样对其季均值与年均值进行统计;
(4)湖泊基本特征数据。其中湖泊表面积、中心经纬度、湖泊周长数据由ArcGIS计算导出,平均海拔数据由SRTM V3数据集计算得到,空间分辨率为1arcsec。
(5)人口数据与地表覆盖类型占比数据。人口数据为World Pop全球投影人口数据,数据来源为WorldPop网站(www.worldpop.org),数据集包含了2000年以来逐年逐网格单元内居住人数的估计值;地表覆盖类型数据为MODIS的MCD12Q1产品,选用LC_Type1分类标准,其空间分辨率为500 m,时间分辨率为1 a。为了更加科学合理的对社会经济因素进行分析,本文通过建立适当的湖泊缓冲区来对人口与地表覆盖类型数据进行提取分析。通过使用ArcGIS计算湖泊缓冲区扩充长度并生成缓冲区,使得缓冲区面积大小为湖泊原来面积的两倍。将17类地表覆盖类型重新分类为9类,并计算各类的面积在缓冲区所占比例,9种地表覆盖类型为农业用地、水体、建筑用地、冰雪覆盖、草地、林地、灌木丛、湿地和低植被覆盖区。使用同样的统计方法,得到2003—2018年湖泊缓冲区内人口总量年均值。
(6)气候带与气象数据。在中国气象数据网(http://www.nmic.cn/)获取了2003—2018年包含了中国31个省自治区和直辖市(暂无澳门、香港和台湾数据)的气象站数据,其中包含了气温、风速、降水量、日照时数和日照率,共计613个气象站点;由中国科学院资源环境科学数据中心网站(http://www.resdc.cn/)获取中国气候区划数据,该数据由中国国家气象局编绘,将中国划分为南热带、中热带、北热带、南亚热带、中亚热带、北亚热带、南温带、中温带、北温带以及高原气候区。
2.3 研究方法
2.3.1 湖泊矢量提取 本文以MODIS的MOD44W产品为基础,提取其水体掩膜数据,转换为矢量数据,筛选出其中的河流与水库[30,31,32],通过对比谷歌地球高分辨率图像对其进行剔除,如图1所示,最终确定了中国10 km2以上的湖泊756个。其中青藏高原湖区中湖泊共389个,东部平原湖区中湖泊共136个,蒙新湖区中湖泊共119个,东北平原与山区湖区中湖泊共93个,云贵高原湖区中湖泊共19个。2.3.2 chl-a反演 chl-a浓度反演选用基于全球近千个海洋观测站原位chl-a测量数据的NASA OC3M标准经验算法[33,34],然后建立起与卫星传感器蓝绿光波段遥感反射率(Rrs)的经验公式,进而反演得到表层水体的chl-a浓度。OC3M算法公式如下:
式中:a0~a4是与传感器相关的经验参数(表1),λblue和λgreen分别是最接近443 nm和547 nm波长的MODIS波段,Rrs为MODIS对应波段的遥感反射率。
Tab. 1
表1
表1基于MODIS传感器的OC3M算法参数选择
Tab. 1
| 参数名称 | a0 | a1 | a2 | a3 | a4 |
|---|---|---|---|---|---|
| 数值 | 0.2424 | -2.7423 | 1.8017 | 0.0015 | -1.2280 |
新窗口打开|下载CSV
2.3.3 增强回归树 增强回归树是一种结合了Boosting方法与回归树的机器算法,通过在计算时多次随机抽取一定量的数据,对自变量的影响程度进行分析,最后使用剩余数据检验拟合结果,然后输出多重回归均值[35,36,37]。本文在RStudio编译环境下,下载导入gbm包进行建模使用,并对gbm函数中的参数进行选取设置,其中包括了迭代回归树的数量(n.trees)、学习效率(shrinkage)、交叉验证次数(cv.folds)、树终节点的最小个数(n.minobsinnode)以及训练样本数量比例(train.fraction)。
3 结果分析
3.1 湖泊营养状态分析
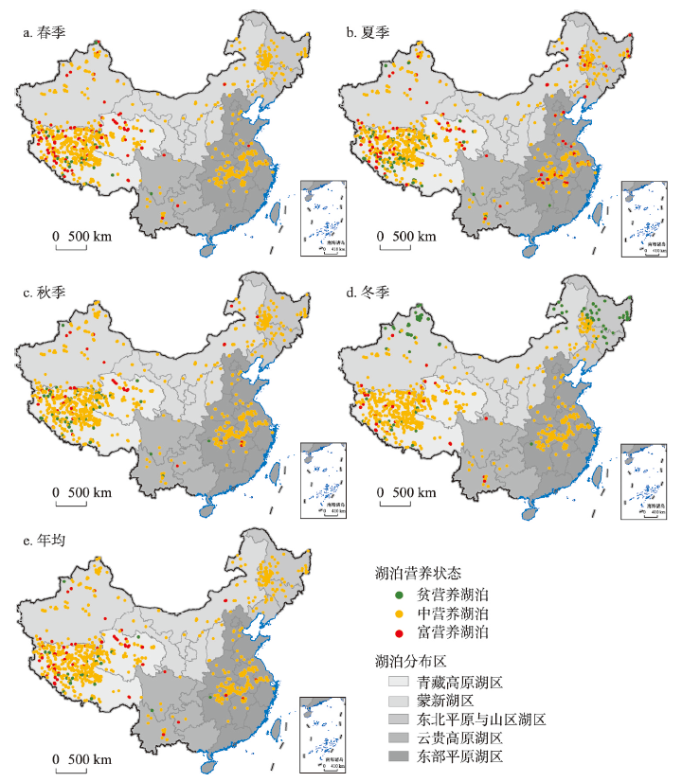
“营养状态”代表湖泊中浮游植物生物量情况,依据湖泊chl-a浓度可以将湖泊划分为贫营养湖泊(chl-a < 3 μg/L)、中营养湖泊(3 μg/L ≤ chl-a <20 μg/L)和富营养湖泊(chl-a ≥ 20 μg/L)3大类[12]。本文利用计算得到的2003—2018年chl-a浓度季节均值与年均值进行中国湖泊营养状态的划分,获得中国湖泊4个季节和年营养状态(图2)。从图2中可以看出,中国湖泊的营养状态存在明显的季节变化和空间变化,整体表现为冬季湖泊的chl-a浓度普遍偏低,贫营养湖泊较多,主要出现在中国北部。这主要受到北部冬季气温较低,湖泊多呈现冰封状态的影响。而春季与夏季富营养状态湖泊相对较多,秋季与冬季富营养状态湖泊数量较少。从湖泊的年际营养状态图(图2e)可以看出,约3%的湖泊表现出贫营养状态,约90%的湖泊表现为中营养状态,约7%的湖泊表现为富营养状态。
图2
 新窗口打开|下载原图ZIP|生成PPT
图2中国湖泊季节与年营养状态
注:基于自然资源部标准地图服务网站GS(2016)1569号的标准地图制作,底图无修改。
Fig. 2Seasonal and annual trophic status of Chinese lakes
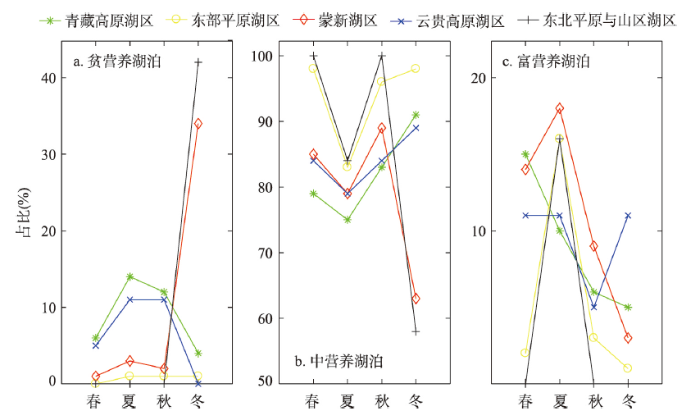
由图3可以看出,在不同季节,各个湖区内不同营养状态的湖泊数量所占比例有较大不同。由图3a可以看出,在冬季时,东北平原与山区湖区和蒙新湖区约有40%的湖泊为贫营养状态,但其他季节的贫营养湖泊数量较少;云贵高原湖区和青藏高原湖区(简称青云湖区)的贫营养湖泊数量夏季最多而冬季最少,整体呈现出先升高后降低的趋势;东部平原湖区内的贫营养湖泊在一年四季当中数量占比都比较低。各湖区中营养湖泊的占比变化规律在春、夏、秋3个季节中国基本一致,均呈现波动变化的趋势,见图3b。而冬季东部平原湖区中营养状态的湖泊占比最高,青云湖区次之,蒙新湖区与东北平原及山区湖区最低。如图3c可知,青云湖区富营养湖泊数量在春季达到峰值,而非青云湖区富营养湖泊数量峰值均出现在夏季。这表明不同湖区的湖泊营养状态在时间和空间上具有明显特征,贫营养状态的湖泊较多出现在东北平原与山区湖区和蒙新湖区的冬季,中营养湖泊在各湖区的占比均较高,而富营养湖泊的分布在青云湖区与非青云湖区有较大区别。气候变暖影响湖泊从中营养到富营养的转换[12],因此富营养湖泊分布的不均衡性可能还受到气候变化的影响。
图3
 新窗口打开|下载原图ZIP|生成PPT
图3各湖区湖泊营养状态季节分布图
Fig. 3Seasonal distribution of lake trophic status in each lake region
3.2 湖泊chl-a浓度变化分析
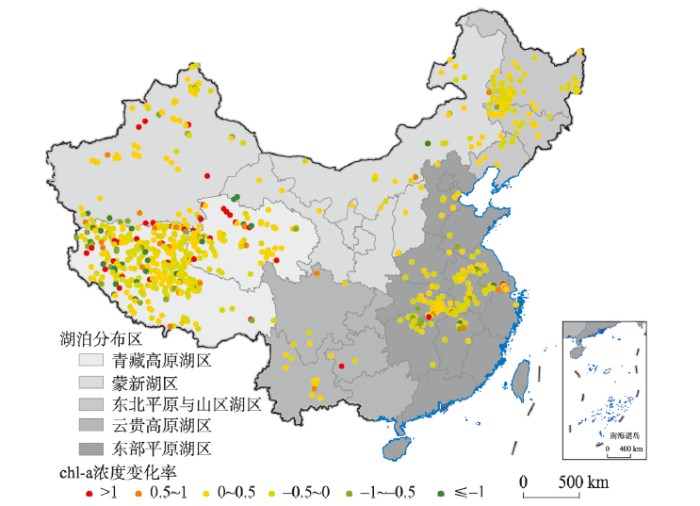
年均chl-a浓度线性回归斜率可代表湖泊的chl-a浓度年变化率(图4)。通过统计可知2003—2018年中国约46%的湖泊chl-a浓度整体为上升趋势,约54%的湖泊整体呈现下降趋势。有82%的湖泊chl-a浓度年变化率的绝对值小于0.5μg/(L a),其中约52%的湖泊chl-a变化率绝对值低于0.1μg/(L a),由此可以看出中国大部分湖泊的chl-a浓度年际变化不大。而18%的湖泊chl-a浓度年变化率的绝对值大于0.5μg/(L a),变化较为剧烈,这些湖泊多位于青藏高原湖区(62%)和蒙新湖区(19%),其他湖区分布较少。图4
 新窗口打开|下载原图ZIP|生成PPT
图42003—2018年中国湖泊chl-a浓度反演值年变化率
注:基于自然资源部标准地图服务网站GS(2016)1569号的标准地图制作,底图无修改。
Fig. 4Distribution of annual change rate of retrieved chl-a concentration of lakes in China from 2003 to 2018
3.3 湖泊chl-a浓度分布影响因素分析
3.3.1 基于增强回归树的影响因素分析 湖泊富营养化受到人类活动、气象、地理地质条件等多因素影响[11]。本文利用增强回归树方法对中国湖泊chl-a浓度时空分布特征的影响因素进行分析:将湖泊的周长、湖表面积、经纬度、海拔、湖表温度、降水量以及湖泊缓冲区内的地表覆盖类型占比和人口数量作为chl-a浓度的影响因子,然后利用增强回归树计算各个影响因子的贡献率,从而确定湖泊chl-a浓度时空分布的主要影响因素。本文将五大湖区分为青云湖区与非青云湖区,并在中国湖泊、青云湖泊与非青云湖泊3个尺度范围上进行增强回归树的分析。由表2~表4可以看出,中国湖泊的chl-a浓度都主要受到降水与湖表温度的影响。与此同时,青云湖区外的湖泊,chl-a浓度还与湖泊缓冲区的草地面积占比有关;通过计算发现,中国湖泊的年均chl-a浓度与年均草地占比呈负相关关系(相关系数为-0.18)。草地的面积占比对中国范围湖泊chl-a浓度的贡献率为14%,对非青云湖区湖泊的贡献率为33%。有研究表明草地生态系统在流域内处于氮磷营养盐的亏损状态,能够在一定程度上对氮磷营养盐排入湖泊起到削减作用[11],而氮磷营养盐可以促使湖泊浮游植物生物量上升。与此同时,海拔、地理位置和人口数量也会对非青云湖泊的chl-a浓度产生影响。青云湖区冬季chl-a浓度受湖泊位置影响较大(经度的贡献率为29%),而其他季节主要受湖表面温度与降水的影响。
Tab. 2
表2
表2中国湖泊影响因素分析(%)
Tab. 2
| 全国湖泊 | 影响因素1 | 影响因素2 | 影响因素3 |
|---|---|---|---|
| 年均 | 秋季降水(22) | 草地占比(14) | - |
| 春季 | 秋季降水(41) | 草地占比(15) | 春季降水(10) |
| 夏季 | 夏季湖表温度(30) | 夏季降水(16) | 年均降水(13) |
| 秋季 | 夏季湖表温度(28) | 草地占比(21) | 年均降水(17) |
| 冬季 | 海拔(24) | 经度(21) | 秋季降水(20) |
新窗口打开|下载CSV
Tab. 3
表3
表3非青云湖区影响因素分析(%)
Tab. 3
| 非青云湖区 | 影响因素1 | 影响因素2 | 影响因素3 |
|---|---|---|---|
| 年均 | 草地占比(33) | 海拔(19) | 经度(15) |
| 春季 | 人口(23) | 海拔(21) | 冬季降水(18) |
| 夏季 | 草地占比(42) | 经度(14) | 海拔(12) |
| 秋季 | 春季降水(32) | 经度(25) | 海拔(13) |
| 冬季 | 人口(29) | 海拔(19) | 春季湖表温度(16) |
新窗口打开|下载CSV
Tab. 4
表4
表4青云湖区影响因素分析(%)
Tab. 4
| 青云湖区 | 影响因素1 | 影响因素2 | 影响因素3 |
|---|---|---|---|
| 年均 | 夏季湖表温度(36) | 秋季降水(18) | 年均降水(13) |
| 春季 | 秋季降水(38) | 夏季湖表温度(16) | — |
| 夏季 | 夏季湖表温度(34) | 年均降水(21) | — |
| 秋季 | 夏季湖表温度(54) | 年均降水(13) | 湖泊面积(13) |
| 冬季 | 经度(29) | 夏季湖表温度(16) | 春季湖表温度(14) |
新窗口打开|下载CSV
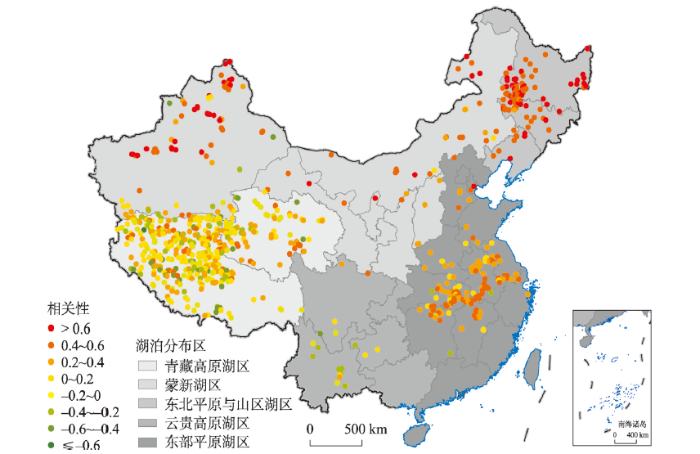
3.3.2 湖泊chl-a浓度与湖表面温度、降水的相关性分析 由3.3.1节的分析可知,在中国范围内湖表面温度和降水是影响湖泊chl-a时空分布的主要因素。因此本文通过计算肯德尔系数,来分析各个年份的chl-a浓度与降水和湖表温度之间的相关性。
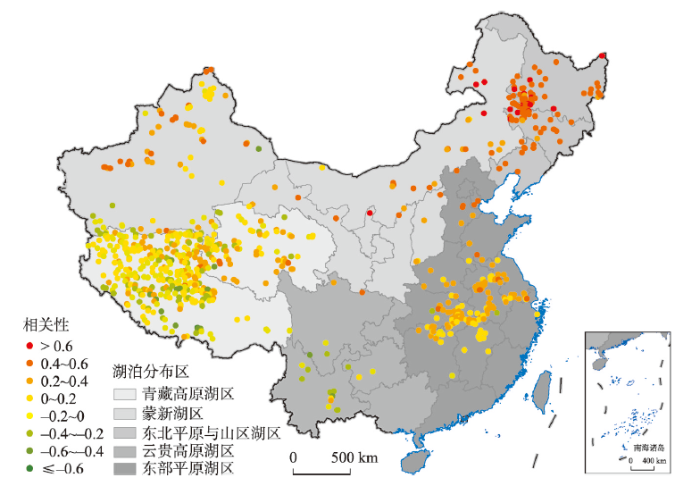
由图5和图6可知,中国约有73%的湖泊chl-a浓度与降水呈现正相关,尤其在非青云湖区湖泊正相关性较强,在呈现正相关的湖泊中约14%的湖泊相关性大于0.5,最大值为0.67。约有75%的湖泊chl-a浓度与湖表面温度之间呈现正相关,集中于中国北部与东部,其中相关性大于0.5的湖泊约占正相关湖泊的26%,正相关性最大约为0.75。因而可以看出,湖表温度与chl-a浓度之间的相关性要高于降水与chl-a浓度的相关性。对比呈现正相关的湖泊后发现,呈现负相关的湖泊大多位于青云湖泊,但其负相关性较弱。此外,本文也利用2003—2018年湖泊chl-a浓度、降水与湖表面温度年均值数据进行了类似分析,总体规律相似但相关性更低,说明在不同的时间尺度上,湖表面温度和降水的变化对湖泊富营养化程度的影响都具有明显的地域性差异。在中国东部及北部,湖表面温度升高与降水增多加剧了湖泊的富营养化,而在青云湖区,湖泊chl-a浓度湖表温度和降水主要表现为负相关。为进一步明确地域差异的影响,本文使用增强回归树模型对影响chl-a浓度与湖表温度和降水相关性的因素进行了分析。分析结果表明,对湖泊chl-a浓度与温度相关性影响较大的因子为海拔(贡献率为38%)和纬度(贡献率为36%)。但对湖泊chl-a浓度与降水相关性影响较大的因子分别为经度(贡献率为62%)和海拔(贡献率为21%)。所以,由于湖泊地域位置存在差异,湖泊温度升高和降雨量的增多对湖泊浮游植物生物量影响的强弱也会存在差异。
图5
 新窗口打开|下载原图ZIP|生成PPT
图5湖表温度与湖泊chl-a浓度的相关关系分布
注:基于自然资源部标准地图服务网站GS(2016)1569号的标准地图制作,底图无修改。
Fig. 5Distribution of correlationship between lake surface temperature and chl-a concentration
图6
 新窗口打开|下载原图ZIP|生成PPT
图6降水与湖泊chl-a浓度的相关关系分布图
注:基于自然资源部标准地图服务网站GS(2016)1569号的标准地图制作,底图无修改。
Fig. 6Distribution of correlationship between precipitation and chl-a concentration
3.4 气候带湖泊chl-a浓度分布影响因素分析
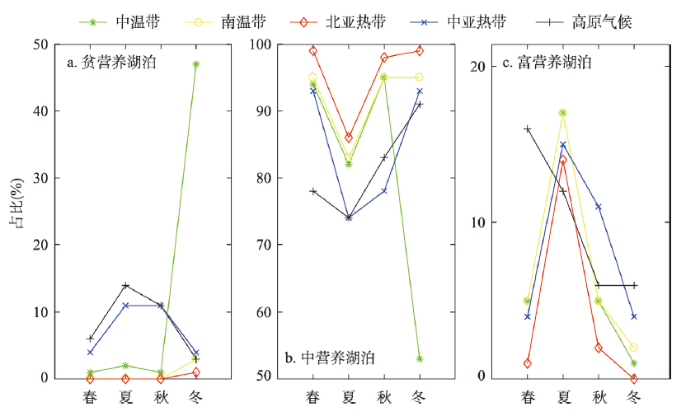
本文756个湖泊共位于7个气候带内,其中412个位于高原气候区,169个位于中温带,104个位于北亚热带,41个位于南温带,27个位于中亚热带,2个位于南亚热带,1个位于北热带。在对各湖泊营养状态分季节进行分析研究时发现,位于北热带和南亚热带的湖泊全年都呈现中营养状态,在夏季时出现chl-a浓度的最低值,其平均气温分别为27.2 ℃和27.4 ℃,而冬季时出现chl-a浓度最高值,其平均气温分别为17.3 ℃和14.3 ℃。由此可以看出,温度升高并不一定会引起湖泊浮游植物的生物量增加,生态学研究表明当温度高于一定范围后,反而破坏了湖泊内生态,使得浮游植物减少[12]。因此,当湖泊所处地理位置和气候环境不同时,温度的上升对湖泊浮游植物生物量的提高会有明显差异。不同气候带3类营养状态湖泊的季节分布如图7所示,由该图可以看出在各季节中3类营养状态的湖泊数量在5个气候带的占比情况。由于冬季中温带平均气温较低导致湖面结冰,致使中温带内的湖泊大多表现为贫营养状态,随着温度的上升春秋季多表现为中营养状态,夏季多表现为富营养状态。位于南温带、北亚热带和中亚热带的湖泊与中温带湖泊具有相似的现象,都是在夏季大多为富营养状态,而春季、秋季和冬季大多呈现中营养状态。因此,位于中温带、南温带、北亚热带和中亚热带内的湖泊,温度上升时会促进湖泊浮游植物生物量的增加。而对于高原气候区的湖泊来说,富营养状态夏季占比最高,中营养状态多出现在冬季。
图7
 新窗口打开|下载原图ZIP|生成PPT
图7不同气候带3类营养状态湖泊的季节分布图
Fig. 7Seasonal distribution of three types of lake trophic status in different climate zones
为进一步研究各气候带湖泊chl-a浓度对气候变化的响应,本文依据所处气候带对中国气象站点进行分组,获得了2003—2018年共计192个月的各气候带月均气温、降水和风速数据,并与同时段内各气候带湖泊chl-a浓度月均值数据进行相关性分析(表5)。研究表明中温带湖泊chl-a浓度与气温和降水的相关性最强,而南温带与北亚热带湖泊chl-a浓度也受到气温与降水的较大影响。与此不同的是,北热带与南亚热带内的湖泊chl-a浓度与气温和降水的相关性为负相关,因此气温和降水对湖泊chl-a浓度的影响也与湖泊所处的气候区有密切联系。除此以外,对于所有气候带来说,风速对湖泊chl-a浓度影响都比较小,整体呈现抑制作用。在中温带、南温带、中亚热带和北热带,风速对湖泊chl-a浓度的增大起到了一定的抑制作用。高原气候区各气象因素的影响较为接近。
Tab. 5
表5
表5各气候带气象因素对chl-a的影响
Tab. 5
| 气候带 | 气温 | 降水 | 风速 |
|---|---|---|---|
| 中温带 | 0.91 | 0.88 | -0.03 |
| 南温带 | 0.60 | 0.58 | -0.10 |
| 北亚热带 | 0.72 | 0.50 | 0.08 |
| 中亚热带 | 0.38 | 0.29 | -0.27 |
| 南亚热带 | -0.41 | -0.26 | 0.22 |
| 北热带 | -0.30 | -0.23 | -0.05 |
| 高原气候 | 0.38 | 0.30 | 0.42 |
新窗口打开|下载CSV
3.5 典型湖泊chl-a浓度分布影响因素分析
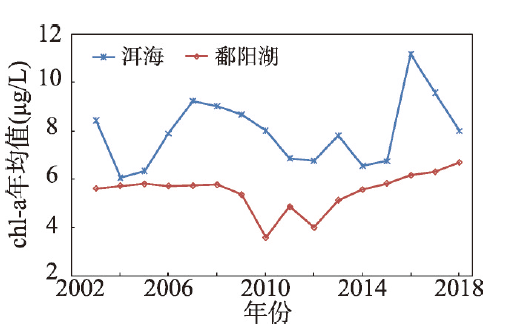
对鄱阳湖与洱海2003—2018年均chl-a浓度进行了统计分析(图8)。计算得到鄱阳湖年均chl-a浓度变化率仅为0.031(μg/L a),由此可见,鄱阳湖在这15 a内浮游植物生物量变化较小,比较稳定。此外,2010年chl-a浓度达到较低值,这是由于鄱阳湖在2010年受持续强降雨影响,引发洪水所致。近年来,由于鄱阳湖流域内工业农业发展较快,人口数量不断上升,流入湖内的工业废水与生活污水增多,这使得湖内氮磷等无机盐含量增加,从而使湖水中的浮游植物生物量上升,致使鄱阳湖chl-a浓度有上升趋势[38]。图8
 新窗口打开|下载原图ZIP|生成PPT
图82003—2018年鄱阳湖及洱海chl-a浓度年均值变化
Fig. 8Inter-annual variation trend of chl-a concentration in Poyang Lake and Erhai Lake from 2003 to 2018
洱海是高原内陆湖泊,所处环境其光照充足、气候温和,为浮游藻类大量繁殖提供了有利条件[39]。图8可看出洱海年均chl-a浓度波动较大,在2003年、2013年和2016年出现水华[40]。这可能是由于在2003年之后洱海流域经济高速发展,其中畜牧业、农业及种植业的发展对洱海内chl-a的影响最大,流域内化肥施用量近年来直线上升[39],致使洱海流域水华频发。
4 讨论与结论
4.1 讨论
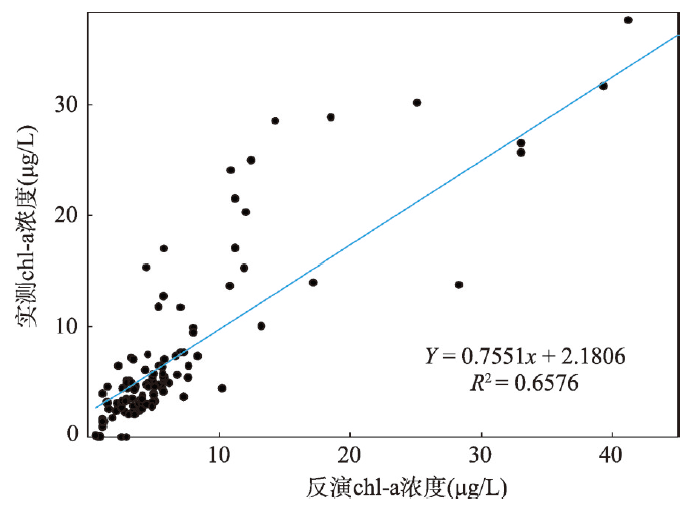
本文利用GEE平台的海量遥感数据进行中国湖泊长时序的chl-a浓度反演,首次得到了中国面积大于10 km2的湖泊chl-a浓度时空分布情况,进而分析中国湖泊chl-a浓度的时空分布特征及其影响因素。本文选用2004—2011年4个湖区17湖的实测chl-a数据与对应点位的chl-a反演数据对研究中使用的chl-a反演方法验证本文chl-a反演算法对于中国湖泊的适用性。实测数据来源于国家科技资源共享服务平台—国家地球系统科学数据中心湖泊—流域分中心(http://lake.geodata.cn)。其中17湖分别选自东部平原湖区:泊湖、巢湖、洞庭湖、洪湖、微山湖、衡水湖、洪泽湖、鄱阳湖、芭蕉湖、赤东湖、昆承湖、太湖,东北平原与山区湖区:查干湖,青藏高原湖区:希门错、苦海、冬给措纳,云贵高原湖区:抚仙湖。为了保证反演结果验证的可靠性,本文选取了与实测数据时间间隔小于1 d的chl-a浓度遥感产品进行验证分析,同时为了减弱水陆交界对验证的影响,将近岸实测点数据剔除后总共得到与卫星同步的113次观测数据。由图9可知二者具有较好的相关性(P < 0.001)。此外,已有****使用MODIS chl-a浓度2级产品对全球188个大型湖泊的营养状况进行研究,并利用北美五大湖实测chl-a数据对遥感产品进行了验证,单个湖泊R2在0.110~0.613之间变化,5个湖泊的R2 = 0.783[12]。综上,由于MODIS chl-a浓度产品的空间分辨率较低,同时中国湖泊chl-a浓度分布较为复杂以及长时序监测的困难性,本文采用的遥感算法来获取chl-a浓度可行。图9
 新窗口打开|下载原图ZIP|生成PPT
图9反演chl-a浓度反演值与实测值散点图
Fig. 9Scatter plot of retrieved and measured chl-a concentration
同时,chl-a的获取方式也是本文主要的误差来源之一。由于湖泊实测数据获取困难,本文仅使用来自17湖的113组实测数据对chl-a浓度反演算法进行了验证,说明对于类似湖泊该算法精度较高。但是,由于中国湖泊类型繁多,且分布在不同的气候环境中,还没有一种算法可以完备的反演中国湖泊的chl-a浓度。尤其是青藏高原湖区,目前对该湖区湖泊chl-a反演的相关文献研究较少。青藏高原地区作为世界的“第三极”,与南极高原相比具有空气密度小、水汽和气溶胶含量少、空气透明度高、多狂风暴雪和降水稀少等气候特点[41],这使得该湖区chl-a浓度反演更为困难。因此,本文所使用的反演算法在应用于中国不同类型湖泊时,其误差水平仍需进一步研究。此外,在丰水期与枯水期湖泊面积也会存在很大的差异,一些湖泊也随着人类活动或者气候变化发生面积上的增加或减少,很有必要在今后的研究中考虑湖泊表面积变化对长时序湖泊研究的影响。
为研究不同类型湖泊chl-a浓度季节与年际变化影响机理的差异,本文选取了青藏高原湖区36个咸水湖和24个淡水湖[29],分析了咸水湖和淡水湖季节与年均chl-a浓度与降水、湖表面温度、缓冲区人口及地表覆盖类型、海拔、经纬度、面积、周长之间的相关性。研究发现淡水湖秋冬季和年均chl-a浓度主要受湖表面温度的影响(表6),而年均和春季chl-a浓度主要受降水影响。相比之下,咸水湖季节与年均chl-a浓度主要受到湖表温度与海拔影响。对比淡水湖与咸水湖季节chl-a浓度影响因素可以看出,两类湖泊均受到湖表温度的影响,除此之外,淡水湖chl-a浓度还受到了降水的影响,而咸水湖chl-a浓度还受到了海拔的影响。
Tab. 6
表6
表6咸水湖与淡水湖chl-a浓度影响因素分析
Tab. 6
| 淡水湖 | 咸水湖 | ||||
|---|---|---|---|---|---|
| 相关系数1 | 相关系数2 | 相关系数1 | 相关系数2 | ||
| 春季 | 年均降水0.488 | 冬季降水0.476 | 夏季湖表温度0.557 | 海拔-0.523 | |
| 夏季 | 经度0.593 | 春季湖表温度0.588 | 夏季湖表温度0.537 | 海拔-0.426 | |
| 秋季 | 夏季湖表温度0.651 | 春季湖表温度0.594 | 夏季湖表温度0.678 | 春季湖表温度0.556 | |
| 冬季 | 春季湖表温度0.254 | 夏季湖表温度0.221 | 夏季湖表温度0.551 | 春季湖表温度0.453 | |
| 年均 | 年均降水0.462 | 春季降水0.430 | 夏季湖表温度0.662 | 海拔-0.564 | |
新窗口打开|下载CSV
4.2 结论
本文对中国面积大于10 km2的湖泊chl-a浓度进行了时空分布特征分析,并以五大湖区和气候带进行区域划分,旨在研究在不同尺度下中国湖泊的营养状态和chl-a浓度时空分布变化及其影响因素。本文利用GEE云平台的云端数据处理功能,获得了中国范围内湖泊的chl-a浓度、降水、湖表面温度、缓冲区地表覆盖类型及人口等数据,并以湖泊特征要素、气象数据以及社会经济要素等因素作为影响因子,建立增强回归树模型对chl-a浓度的影响因素进行分析,主要得到以下结论:(1)中国湖泊营养状态的时空分布具有明显的差异,2003—2018年中国约90%的湖泊呈现中营养状态,少量湖泊呈现富营养和贫营养状态。春季中国北部受气温影响,湖面冰封,贫营养湖泊较多。中国东北和东部2个湖区的富营养化湖泊较多出现在夏季,但青云湖区较多出现在春季。中国82%的湖泊chl-a浓度年际变化幅度较小(年变化率绝对值小于0.5),小部分增长趋势较为剧烈,中国东北和东部2个湖区的富营养化湖泊较多出现在夏季,但青云湖区较多出现在春季。
(2)湖表温度和降水对于湖泊chl-a浓度的影响与湖泊所处的地理空间位置有密切的关系,中国东部与北部的湖泊湖表温度和降水与chl-a浓度主要呈现正相关性,而青云湖区湖泊则呈现负相关性。湖表面温度、降水与湖泊chl-a浓度呈现正相关,缓冲区草地面积占比与湖泊chl-a浓度呈负相关。地理位置和平均海拔也对chl-a浓度与湖表温度和降水的相关性产生很大影响。
(3)鄱阳湖内chl-a浓度年际变化趋势较为平稳,同时也受到了人为活动影响。洱海内chl-a浓度变化波动较大,同样受人为活动影响造成水华频发;本文分析了青藏高原湖区咸水湖和淡水湖chl-a浓度影响因素的差异,发现两类湖泊均受到湖表温度的影响,此外淡水湖chl-a浓度还受到了降水的影响,而咸水湖chl-a浓度还受到了海拔的影响;
综上所述,对于中国大部分湖泊来说,其营养状态情况未能表现出良好趋势,不同地理位置与气候环境下湖泊的浮游植物生物量受到各因素的影响不同,因而对于湖泊浮游植物生物量影响要素的分析要充分考虑其地理位置与气候环境状况。
参考文献 原文顺序
文献年度倒序
文中引用次数倒序
被引期刊影响因子
DOI:http://www.geog.com.cn/article/2021/0375-5444/10.1126/science.1196808URLPMID:21212349 [本文引用: 1]

Inland waters (lakes, reservoirs, streams, and rivers) are often substantial methane (CH(4)) sources in the terrestrial landscape. They are, however, not yet well integrated in global greenhouse gas (GHG) budgets. Data from 474 freshwater ecosystems and the most recent global water area estimates indicate that freshwaters emit at least 103 teragrams of CH(4) year(-1), corresponding to 0.65 petagrams of C as carbon dioxide (CO(2)) equivalents year(-1), offsetting 25% of the estimated land carbon sink. Thus, the continental GHG sink may be considerably overestimated, and freshwaters need to be recognized as important in the global carbon cycle.
[本文引用: 1]
[本文引用: 1]
DOI:10.1007/s10452-005-9008-0URL [本文引用: 2]
DOI:10.3390/w10070917URL [本文引用: 1]
PMID:11809962 [本文引用: 1]
[本文引用: 1]
[本文引用: 1]
DOI:10.18307/2016.0314URL [本文引用: 1]
[本文引用: 1]
DOI:10.3390/rs70810523URL [本文引用: 1]
[本文引用: 1]
[本文引用: 1]
DOI:10.1080/17538947.2016.1139637URL [本文引用: 1]
[本文引用: 3]
[本文引用: 3]
DOI:10.1038/s41598-017-11167-3URL [本文引用: 5]
DOI:10.1016/j.isprsjprs.2020.04.001URL [本文引用: 1]
DOI:10.1016/j.isprsjprs.2017.07.011URL [本文引用: 1]
[本文引用: 1]
[本文引用: 1]
[本文引用: 1]
[本文引用: 1]
DOI:10.3390/rs10101635URL [本文引用: 1]
DOI:10.3390/rs11192213URL [本文引用: 1]
[本文引用: 1]
[本文引用: 1]
[本文引用: 1]
[本文引用: 1]
[本文引用: 1]
DOI:10.1016/j.jag.2018.11.014URL [本文引用: 1]
DOI:10.3390/rs10081265URL [本文引用: 1]
DOI:10.1016/j.rse.2019.02.011 [本文引用: 1]
River ice breakup and resulting flood risk is a nearly annual concern for communities along the five major rivers draining to the James and Hudson Bay Coasts in Ontario (Moose, Albany, Attawapiskat, Winisk and Severn Rivers). Ice breakup within this region has historically been monitored using flight reconnaissance supplemented by assessment of hydrometric data. More recently, remote sensed imagery have been used to monitor near real-time ice breakup and flood risk. However, the near real-time remotely sensed breakup information was found to have limited utility in the absence of a broader spatial and temporal understanding of breakup progression. The primary purpose of this study was to develop a method for generating a dataset of breakup dates. A secondary objective was to calculate statistics from this dataset that can be used to provide context to operational near real-time imagery analysis and improve understanding of ice processes in the study area. An automated method for detecting river ice breakup dates from 2000 to 2017 using MODIS imagery was developed. This method uses a threshold-based technique that aims to maximize river coverage and minimize effects of cloud obstruction. Image processing was completed in the high-performance Google Earth Engine application which enabled iterative classification and model calibration. The breakup date dataset was used to calculate statistics on breakup timing, duration, annual variability and breakup order. An assessment of patterns within these data is discussed, relationships between breakup timing, duration and highwater years is explored and the operational utility of these statistics is described. The classification compared well with Water Survey of Canada derived breakup dates with mean bias ranging from -2.0 days to 6.7 days and mean absolute error of 3.4 days to 6.9 days across the rivers. Latitude and distance upstream were found to be primary controls on breakup timing with drainage network configuration and reach morphology also having an influence. No relationships between highwater years and calculated breakup statistics were found. It is recommended that future studies use the dataset developed in this study in combination with hydrometric and remotely sensed data to improve prediction of highwater and understanding of breakup processes within these rivers.
DOI:10.13287/j.1001-9332.201603.020PMID:29726198 [本文引用: 1]
Non-point source (NPS) pollution has become a key water pollution problem under the condition of point source pollution was controlled. The complexity and uncertainty research of NPS pollution influential factors has always been important and difficult. This paper simulated NPS pollution of the Fanhe River watershed in 2003-2012 by the soil and water assessment tool (SWAT) and analyzed its spatial distribution. Meanwhile, the boosted regression tree (BRT) method was proposed to quantitatively analyze the corresponding influential factors including land use, soil, elevation and slope. The results showed that NPS pollution in the Fanhe River watershed had high spatial heterogeneity. The spatial distribution of total nitrogen (TN) had greater difference than that of total phosphorus (TP). The three pollutants, TN, TP and sediment, were all positively related to slope gradients (P<0.01). The slope gradients played the strongest role in determining the sediment and TP output with the contribution rate of 46.5% and 38.2%, respectively. Land use had important influence on sediment and TP loads, with the contribution rate of 27.2% and 35.3%, respectively. TN was produced abundantly in low-elevation and steep-slope locations and with cultivated land use. Cinnamon soil was most vulnerable to the TN load while meadow soil took the second place in terms of soil erosion and TP load. The paper overcame the complexity of influential factors for NPS pollution by BRT, and deepened the understanding of NPS pollution mechanism.
PMID:29726198 [本文引用: 1]
[本文引用: 1]
[本文引用: 1]
DOI:10.1016/j.rse.2020.111800URL [本文引用: 1]
DOI:10.1360/zd-2011-41-3-394URL [本文引用: 2]
[本文引用: 2]
[本文引用: 2]
[本文引用: 2]
DOI:10.1016/j.chnaes.2017.06.001URL [本文引用: 1]
[本文引用: 1]
DOI:10.11821/dlxb201907015 [本文引用: 1]
Lake bathymetry can provide abundant information for basin planning and governance, watershed erosion and siltation management, water resource utilization, as well as environmental protection. In particular, lake bathymetry is essential for lake development and conservation, and is also closely related to sediment deposition and removal. A number of sounding techniques, such as single-beam sonar sounding, multi-beam sonar sounding, and unmanned ship sounding, have been applied to extract underwater topography of lakes. These techniques, albeit with high measurement accuracy, are time-consuming and costly. Therefore, it is of great need to develop a simple and cost-effective method. To reach this goal, recent advances of remote sensing technologies provide an alternative means of accurately measuring lake bathymetry information. Taking Dongting Lake as the study area, this paper estimated the lake bathymetry through extracting the boundaries of lake areas using multi-temporal Landsat and MODIS image series. In particular, the water level corresponding to each reference point of the lake boundary is retrieved based on trend surface analysis and kriging interpolation technology. Then the water levels of these points are regarded as the elevation points to retrieve the landform of the lakebed of the Dongting Lake. The reliability and accuracy of the developed methods were assessed through the comparsion with the actual measurements. Results indicate that the kriging interpolation technology performs well, with the average of cross-validated error target less than 0.2 meter, and the retrieval error of lake boundary with more reference points less than 1 meter. This paper suggests that an improved method for accurately and rapidly extracting lake bathymetry information can be achieved through examining the changes of water levels. This method might be of great significance for further study on lake evolution, lake development planning, and water ecological protection.
[本文引用: 1]
[本文引用: 1]
[本文引用: 1]
DOI:10.1109/JSEN.2013.2239638URL [本文引用: 1]
[本文引用: 1]
DOI:10.13287/j.1001-9332.201603.020PMID:29726198 [本文引用: 1]
Non-point source (NPS) pollution has become a key water pollution problem under the condition of point source pollution was controlled. The complexity and uncertainty research of NPS pollution influential factors has always been important and difficult. This paper simulated NPS pollution of the Fanhe River watershed in 2003-2012 by the soil and water assessment tool (SWAT) and analyzed its spatial distribution. Meanwhile, the boosted regression tree (BRT) method was proposed to quantitatively analyze the corresponding influential factors including land use, soil, elevation and slope. The results showed that NPS pollution in the Fanhe River watershed had high spatial heterogeneity. The spatial distribution of total nitrogen (TN) had greater difference than that of total phosphorus (TP). The three pollutants, TN, TP and sediment, were all positively related to slope gradients (P<0.01). The slope gradients played the strongest role in determining the sediment and TP output with the contribution rate of 46.5% and 38.2%, respectively. Land use had important influence on sediment and TP loads, with the contribution rate of 27.2% and 35.3%, respectively. TN was produced abundantly in low-elevation and steep-slope locations and with cultivated land use. Cinnamon soil was most vulnerable to the TN load while meadow soil took the second place in terms of soil erosion and TP load. The paper overcame the complexity of influential factors for NPS pollution by BRT, and deepened the understanding of NPS pollution mechanism.
PMID:29726198 [本文引用: 1]
[本文引用: 1]
[本文引用: 1]
DOI:10.11821/dlxb201701009 [本文引用: 1]
Due to its rapid economic development in recent years, China is becoming ever more urbanized. With this background of urbanization, land use and land cover change are complex in urban-rural continuum where the land is characterized by both town and country usages. The urban-rural continuum of Harbin City, Heilongjiang Province was chosen as the study area. Impervious surface from the Harbin urban-rural continuum was extracted by a linear spectral mixture analysis method based on the Landsat TM image acquired in the years of 1984, 1993, 2002 and 2010. The temporal and spatial variations of the urban impervious surface were examined. A boosted regression tree was employed to identify the most important factor that has been affecting the expansion of the impervious surface since 1984 from among eight factors, i.e. slope, aspect, DEM, distance to river, distance to expressway, distance to railway, distance to main road, and distance to the central city in 1984. The results indicate that the proportion of impervious surfaces in the Harbin rural-urban continuum was 3.9% in 1984, 6.6% in 1993, 9.0% in 2002, and 16.52% in 2010. The distribution patterns of impervious surface coverage from 1984 to 2010 showed obvious spatial variations. Traffic factors, including expressways, railways, and main roads, have been propelling the development of surrounding area, and inducing the rapid expansion of cities along the roads.
[本文引用: 1]
DOI:10.3390/rs70100275URL [本文引用: 1]
DOI:10.18307/2018.0107URL [本文引用: 2]
[本文引用: 2]
DOI:10.3390/rs9121265URL [本文引用: 1]
[本文引用: 1]
[本文引用: 1]
