 ,1,2, 何凡能1, 吴致蕾2, 郑景云,1,3
General characteristics of the agricultural area and fractional cropland cover changes in China for the past 2000 years
FANG Xiuqi,1,2, HE Fanneng1, WU Zhilei2, ZHENG Jingyun,1,3通讯作者:
收稿日期:2020-01-19修回日期:2020-12-20网络出版日期:2021-07-25
| 基金资助: |
Received:2020-01-19Revised:2020-12-20Online:2021-07-25
| Fund supported: |
作者简介 About authors
方修琦(1962-), 男, 吉林前郭人, 教授, 主要从事环境变化研究。E-mail:

摘要
关键词:
Abstract
Keywords:
PDF (2374KB)元数据多维度评价相关文章导出EndNote|Ris|Bibtex收藏本文
本文引用格式
方修琦, 何凡能, 吴致蕾, 郑景云. 过去2000年中国农耕区拓展与垦殖率变化基本特征. 地理学报[J], 2021, 76(7): 1732-1746 doi:10.11821/dlxb202107012
FANG Xiuqi, HE Fanneng, WU Zhilei, ZHENG Jingyun.
1 引言
过去2000年,作为地球系统从受自然驱动到受自然与人类活动共同影响的衔接时段,备受国际全球变化研究关注[1]。有研究表明,在这一时段中人类活动对地表环境的扰动不断增强[2,3],并对地球系统的“自然”演变产生了深刻影响[3,4]。因此,揭示土地利用/覆盖变化(Land Use and Cover Change, LUCC)一直是国际全球变化研究的核心任务[5,6,7]。其中,耕地变化不仅直接改变了地表景观和陆地生态系统,而且还通过这些变化影响地表粗糙度、反照率和生物地球化学循环,进而影响区域的、甚至全球尺度的气候环境变化[7,8]。因而定量重建耕地变化一直是国际LUCC研究的最核心问题,全面重建LUCC不但对深入理解地球系统变化规律具有重要科学价值[5-6, 9-10],而且对保障景观管理、土地资源利用的可持续性及应对全球变暖等也具有重要借鉴作用[6,7]。中国农耕历史悠久,考古资料和文献记述丰富,各类农业史著数不胜数[11,12,13,14,15,16,17,18,19,20],研究论文不胜枚举[21,22]。特别在全球变化科学这一前沿研究领域的引领与推动下,又针对历史时期(特别是过去300年)耕地变化开展了定量重建研究,取得了许多新成果[23,24,25,26,27,28];但至今未对过去2000年中国耕地的时空变化特征进行系统总结。因此,本文拟以这些研究成果为基础,综合分析过去2000年中国主要农耕区拓展的阶段性及其间全国耕地面积和其中近千年垦殖率变化的主要特征。
2 资料与方法
本文所用的资料均取自已公开发表的文献。主要方法是:先通过检索、查阅历史时期中国农耕区拓展、历朝耕地面积重建及垦殖率格网化重建等主题的研究成果,然后借鉴政府间气候变化专门委员会(International Panel on Climate Change, IPCC)的评估思路[7],对不同研究者的结果进行梳理、比较和评估,从中遴选被学界常引的经典文献和对同一问题研究有新结果或新认识的文献。在此基础上,按时序对不同时段、不同区域、不同研究者的研究认识进行列举和归纳,并对其中的耕地面积与垦殖率定量重建结果进行集成制图。本文中耕地面积以亩为单位计量,1亩≈ 667 m2。需要说明的是,中国有具体田亩数量的记载首见于《汉书·地理志》[29],此后大多数朝代的正史、政书均载有田亩数据;且距今越近,记载越多、越详细[30]。但由于这些田亩记载数据实质上是一种纳税单位[29,30],且不同朝代的亩制有一定差异,也存在田亩内涵及统计标准不完全一致、折亩、甚至隐匿等诸多问题[25-29, 31],使得其与实际耕地面积存在偏差;需考订和校准后才能使用。因此,本文所用历史耕地数据,均为经研究者对原始记录所存在问题进行仔细分析、考订后,针对各种问题采用定量重建方法进行校准和亩制换算后的公开发表数据,主要包括:历代全国耕地估算或重建结果[29, 31-40]以及清代18行省[41,42]和边疆主要农区(如东北、热察绥① (①清代热河、察哈尔八旗、归绥六厅的总称,1928年分别设置为热河、察哈尔、绥远3个省,包括今内蒙古自治区中南部、河北省北部及辽宁省西部的部分地区,总面积约2.24×10⁵ km2。)、新疆、青藏高原等)[43,44,45,46]的耕地估算或重建结果;同时在遴选全国耕地面积时将覆盖范围大致统一为今疆域。历史耕地垦殖率格网化数据是以不同尺度政区单元的耕地面积重建数据为基础,在政区耕地面积总量控制下,以地形、气候、水文等自然条件和耕作技术、人口密度的空间差异等因素作为限制耕垦的主要依据,通过建立空间格网化模型[47,48,49,50]分配获得,用于指示耕地空间分布变化特征。
3 过去2000年主要农耕区的拓展过程与耕地面积变化
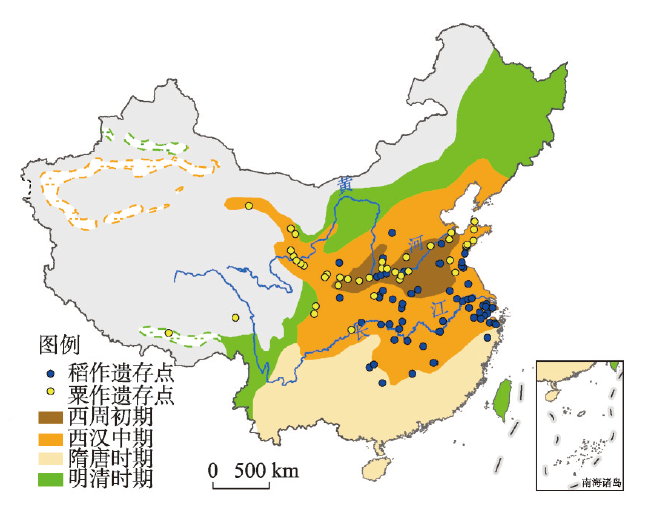
中国是世界上最早的农作物栽培起源区之一,距今7000—4000年前粟作和稻作就已散布于今黄河和长江流域(图1)[51],甚至在今青藏高原东南部也有零星作物栽培[52],但这一时期农作尚处于“游耕”阶段,真正持续利用的固定耕地较少[51, 53]。此后黄河流域的农耕得到较快发展,而其他地区则显著衰落[51, 54-55],使得至西周初期(约公元前1000年前后)中国耕地主要集中在黄河中下游地区,但其间未见任何耕地数量记载。约在公元前500年前后,随着社会组织制度变革和铁器、牛耕、人工施肥及其他细作等技术的逐步应用与推广,中国农耕进入了对土地循环利用的传统农业阶段,主要农耕区出现了3次大规模拓展(图1)[56,57,58]。其中第一次盛于汉代,主要农耕区从黄河流域拓展至长江以北地区;第二次为唐宋时期,主要特征是对长江以南地区从平原低地拓垦至丘陵山地;第三次为清中叶以后,主要是对东北、西北和西南等边疆地区的拓垦和全国山地的深度开发,至20世纪80年代达到了最大范围。图1
 新窗口打开|下载原图ZIP|生成PPT
图1中国史前稻粟作遗存点与西周以来农耕区拓展
注:基于自然资源部标准地图服务网站GS2019(1830)号地图制作,底图无修改;虚线内区域为耕地相对集中分布区,其内耕地主要呈不连续的分片分布,其外可能有零散的耕地分布;距今7000—4000年稻、粟作遗存分布资料引自文献[51];西周以来主要农耕区分布引自文献[57],并据文献[59]对塔里木盆地周边绿洲农业分布区进行修订。
Fig. 1Sites with macro-remains of rice and millet plants during 7000-4000 BP and the expansion of agricultural area since Western Zhou Dynasty (1046-771 BC) in China
3.1 战国至两汉
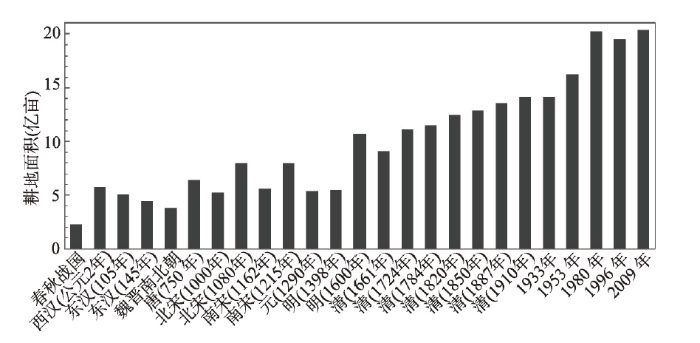
战国(公元前475—公元前221年)是中国历史上社会大变革时期之一。诸侯国为足食足兵,多通过变法图强,并大力发展农耕;加之铁农具和役使耕畜的逐渐推广,战国期间的新垦耕地得以增加。其中以渭水、黄河和济水为轴心的黄河中下游平原诸国,人口众多、居邑密布,宜耕荒地已被基本垦毕,许多地方均呈现出“土地狭小,民人众”的紧张态势,农耕方式也随之转向精耕细作,并开始兴修水利设施,以提高土地生产率;而其外围的齐、楚、秦、赵及燕等国则以扩大耕地面积为主。这使得至战国晚期农耕区北拓至今长城一线,东北拓至辽东半岛,南拓至钱塘江流域及今湘、赣两省北部,西南拓到成都平原;不过新拓农区的耕作方式均较粗放,常时耕时弃[60]。春秋战国期间(公元前770—公元前221年),全国人口峰值达3200万左右,耕地面积2.3亿亩上下(图2)[31]。但战国末期战乱不断、社会动荡加剧,秦统一全国时人口已锐减至2000万以下[31];因而全国耕地面积也出现了较大幅度减少。图2
 新窗口打开|下载原图ZIP|生成PPT
图2过去2000年中国各朝代的耕地面积变化
注:春秋战国、西汉、魏晋南北朝、唐及明(1600年)数据引自文献[31];东汉数据引自文献[32];北宋(1000年)、南宋(1162年)及南宋(1215年)数据由文献[33]和本文估算的西夏与大理耕地面积汇总;元(1290年)数据引自文献[34];明(1398年)数据引自文献[29];清代各年数据由文献[41,42,43,44,45,46]等汇总而得(
Fig. 2Changes of cropland area in China for the past 2000 years
西汉时期中国农耕区范围出现了第一次大规模扩张[56,57],至西汉中期(约公元前130—公元前70年)主要农耕区范围从先前的黄河中下游拓至黄土高原、黄淮海地区及长江流域的大部分平原和低山丘陵地区;甚至因移民实边需要,在陇西、河西走廊及今新疆南部的绿洲地带等区域也发展了农垦[59, 61](图1)。但长江以南的大部分地区,由于人口密度低,农耕的开发程度仍然保持较低水平。考订显示,至西汉末(平帝元始二年(公元2年),后文中的公元年均省去“公元”)全国耕地面积约为5.72亿亩(图2)[29, 31]。
两汉之交的战乱和社会动荡使当时农耕出现显著萎缩,虽然此后东汉人口与经济恢复较快,得以重新繁荣,但与西汉相比,因社会稳定持续时间较短,耕地面积始终未恢复至西汉的峰值水平。特别是其间北方游牧民族不断南迁而逐渐占据了黄土高原,使得今晋北、陕北、陇东地区的农耕人口锐减至西汉盛期时的5%~10%,导致在西汉农耕盛期时的耕地分布北界显著向南退缩[62]。估算显示:至东汉中期,元兴元年(105年)全国耕地约5.06亿亩,永嘉元年(145年)约4.77亿亩(图2),分别为西汉末的88%和83%[32]。
3.2 三国至两宋
自东汉末起至三国、两晋、南北朝(约180—589年),因各地政权长期割据,战乱不断,造成人口数度出现较大幅度波动,并致主要农耕区黄河流域人口大量外迁、种植业萎缩,因而使得社会大乱时期大量耕地抛荒,而相对稳定时期则又复耕,且其间全国无具体田亩数字记载。不过推算表明,当时全国耕地常年应维持在3.85亿亩左右[31],约为西汉末的2/3;且其中大部分仍分布在长江以北地区。然而,这一时期黄河流域人口的多次大量外迁也为其他地区(特别是南方地区)的农耕发展提供了大量劳动力和先进的农业生产技术。其中东汉末,黄河中下游地区的连年战乱,造成大批人口外迁至长江流域和辽东地区。西晋末的永嘉之乱(311年前后)触发了中国历史上第一次人口南迁高潮;在313—450年间北方地区迁至南方的户口约达北方原有户口的15%[63];但其间无全国耕地数量的具体记载。虽然这一时期长江以南地区总体上地广人稀,农耕仍以“火耕水耨”的粗放式为主,但却为其后农耕区大规模拓展创造了重要条件。
隋朝(581—619年)期间虽有全国垦田数记载,但该数被后世认为不能使用[29]。隋鼎盛时(609年前后)全国人口又恢复至6000万左右,与西汉末期相仿[64],且当时长江以南的农耕也较两汉时期有显著发展;因而推算当时全国田亩应较前期有较大幅度恢复。
隋、唐交替战乱后,中国社会又进入一个被后世称为“国力强盛、经济繁荣”的王朝;特别是经唐太宗、武后、玄宗励精图治,社会各业均得到稳定发展,不但长江以北农耕区得到全面恢复,并散布至今整个西北边疆各省;而且长江以南的大部分平原低地得以深度开发。已有研究表明:至唐天宝年间(742—755年)全国农耕达到极盛,共计耕地6.42亿亩(图2),较之汉代的峰值5.72亿亩又增约7000万亩,特别是长江流域得到了更大发展,使得秦岭、淮河一线以南和以北的地亩几近半分[31]。
不过未久便发生“安史之乱”(755—763年),唐室皇权渐弱,以致唐后期藩镇割据,疆域日渐萎缩,耕地也随之再度减少;特别是关中、河南、河北等因大量人口南迁江南、西入四川,耕地减少更甚。至“五代十国”(907—961年),中国又进入了大分治时代。史载彼时暴君酷吏迭出、赋税繁多、战争不断、民不聊生,因而也造成大量垦田荒芜[58]。但其间因缺乏田亩具体记载,至今尚无当时全国耕地的具体数据。
公元979年,北宋先后翦灭各地割据势力,统一了东南半壁的大部分地区,中国自此进入了中原政权与辽(907—1125年)、西夏(1038—1227年)、金(1115—1234年)、大理(937—1254年)和黑汗(840—1212年)等周边主要政权及一些部族实体(如回鹘诸部、吐蕃诸部等)多元政体并存的时代,农耕再度得到恢复和发展。特别是当时位于北方的辽[65]、西夏[66]和西南的大理[67]等,也发展了农耕。综合已有耕地重建结果显示:宋开宝九年(976年),耕地总量约4.68亿亩;至道三年(997年)增至约4.96亿亩[33]。加之位于今东北的辽当时约有耕地2500万亩[33],以及大理等其他诸部的垦田约500万亩左右[67],汇总可得1000年前后全国耕地约5.26亿亩。
此后至宋元丰初(1080年前后),北宋耕地发展至7.32亿亩,百年间增加了约50%[33]。其间,辽境内的农耕也显著发展,估算显示:至1080年前后,辽耕地约4230万亩[33]。而在西夏,耕地面积在立国初期(延祚七年,1044年)约1040万亩,鼎盛时期(天盛年间,1160年代前后)增至约1930万亩[68],据此推算1080年前后,西夏耕地约为1400万亩。大理在其前朝南诏(738—902年)时,就有许多地区耕耘水田、种植稻谷,兼种豆、麻、黍、稷,呈现出“邑落相望、牛马被野”的农、牧业发展态势[69],且农耕发展始终相对稳定[67]。据估算,大理末期(天定二年,1254年)的人口为115万人左右[70],最高时(约1210年前后)接近150万人;按其人口自然增长3‰左右回溯,1080年前后大理的人口约102万。不过相较于北宋,大理农耕相对粗放,按当时其人均耕地高于北宋人均耕地(约5.4亩/人)水平10%推算,1210年前后大理的耕地面积约890万亩,1080年前后约600万亩。汇总这些数据表明,1080年前后全国耕地应达7.94亿亩左右(图2)。
但自1120年前后起,北宋联金灭辽,战事重开;金得辽后,趁势于1125年南下攻宋,致宋室南迁临安,中原人口再度大规模南下,因此淮河以北大部分耕地荒芜、江淮之地农耕遭受重创。现有研究显示:及至南宋绍兴三十二年(1162年),宋金耕地合计仅约5.28亿亩[33];加之西夏、大理等,全国耕地也不过5.6亿亩左右(图2)[33]。之后战事渐息,农耕得以较快恢复;且江南随着宋室南迁而成为政治、经济中心,使得长江以南农耕不断从平原低地向低洼湿地和丘陵山地、甚至深山地区扩展[57,58];因此至南宋嘉定八年 (1215年前后),宋金耕地又恢复至7.68亿亩[33]。不过西夏末期农耕却受新建的北方蒙古游牧政权(建于1206年)兵伐而出现一定程度衰落[68],因而推算其耕地亦从鼎盛时期的1930万亩减至1215年前后的1700万亩。加之上述估算的当时大理耕地约890万亩;汇总可得:1215年前后全国耕地又恢复至7.94亿亩左右(图2)。
3.3 元代以后
自13世纪初起,北方蒙古政权先后多次起兵进行大规模西征与南攻,再次造成了长达数十年全国战乱,导致社会长期动荡、人口剧减、农耕大幅萎缩。据估计,战乱前的1210年前后,全国人口约1.45亿;但至蒙古统一全国,建立元朝10年后的1290年前后,全国人口仅约7500万左右,80年间人口减少近半[71];其间全国耕地亦减至5.35亿亩左右[34](图2)。加之有元一朝不足百年,至其最盛时(1341年前后)人口也仅恢复至9000万左右[71],且种植业不受重视,因而其间耕地也未恢复至前朝盛期水平。且之后又陷入社会动荡与元明之交的战乱,全国耕地亦因之再度显著萎缩。不过,自1368年明朝建立后,社会又很快得到稳定,农耕也得以较快恢复。然因其前战乱造成人口大幅减少,故至洪武二十六年(1393年)前后全国人口亦不过恢复至7200万左右[72]。考订表明:洪武末年(1398年),全国耕地约5.50亿亩[29],较之北宋与南宋盛期(约7.94亿亩),减少约30%。好在有明一代,甚重农耕;加之人口稳定增长 (至1580年前后达1.78亿,1630年约1.925亿)[72]与边疆屯田对耕地扩张的需要,种植业得以稳步发展;特别是从明后期起玉米、薯类等作物陆续引入与推广,又促进了对陡坡丘陵山地的不断拓垦,使得至万历三十年(1602年)前后,全国耕地达10.7亿亩左右[31]。但明晚期的气候恶化导致北方边境大量军屯废弃,因而至1620年之后,全国耕地又出现减少;加之不久之后,就又进入明清之交的社会大动荡和战乱,故至清初的顺治十八(1661年),全国耕地又降至约9.12亿亩[41]。
但有清一代,农耕再度得到快速恢复与稳步发展;特别是自清中叶起对东北、热察绥、新疆、青藏高原等边疆地区的不断拓垦和全国大多数山地的深度开发,使得农耕区再次得到大规模拓展。其间不但耕地记载丰富,而且涉及耕地面积估算与重建研究的成果亦多[23, 35-37, 41-47, 49-50, 73-74],其中尤以中国科学院地理科学与资源研究所等的重建结果[23, 41-43]被学界广泛采用。综各研究(表1)可得:雍正二年(1724年)前后,全国耕地约11.11亿亩,超过了明朝最高值。此后至清后期,全国耕地一直稳步增长,至乾隆四十九年(1784年)前后,全国耕地增至约11.53亿亩;嘉庆二十五年(1820年)前后达12.48亿亩;道光三十年(1850年)达12.88亿亩;光绪十三年(1887年)达13.55亿亩;清末宣统二年(1910年)为14.18亿亩。
Tab. 1
表1
表1清代耕地面积重建结果汇总及与其他****估算结果的对比(亿亩)
Tab. 1
| 年份 | 本文结果 | 其他****估算结果 | |||||||
|---|---|---|---|---|---|---|---|---|---|
| 十八行省 | 东北三省② | 热察绥③ | 新疆④ | 青藏⑤ | 全国合计 | 史志宏⑥ | 金晓斌等 | ||
| 雍正二年 (1724年) | 10.73 | 0.203 | 0.135 | < 0.010 | 0.033 | 11.11 | 9.97 | 9.29 | |
| 乾隆四十九年 (1784年) | 10.84 | 0.328 | 0.306 | 0.024 | 0.036 | 11.53 | 10.71 (1766) | — | |
| 嘉庆二十五年 (1820年) | 11.66 | 0.380 | 0.327 | 0.081 | 0.036 | 12.48 | 11.77 (1812) | 12.26 | |
| 道光三十年 (1850年) | 11.96① | 0.420 | 0.347 | 0.115 | 0.038 | 12.88 | 13.20 12.54[35] | — | |
| 光绪十三年 (1887年) | 12.33 | 0.650 | 0.430 | 0.111 | 0.033 | 13.55 | 13.89 | 13.29 | |
| 宣统二年 (1910年) | 12.28 | 1.215 | 0.525 | 0.120 | 0.040 | 14.18 | 14.58 | — | |
| 文献出处 | [41] | [43] | [44] | [36] | [37] | ||||
新窗口打开|下载CSV
20世纪上半叶中国内忧外患不断,人口增长和农业发展近乎停滞。据民国主记处统计局调查资料,公元1933年前后中国耕地面积仅为14.17亿亩[35, 38]。但至20世纪后半叶,全国耕地又呈现快速增长。其中1951—1953年首次全国范围的查田定产调查结果显示,当时中国耕地面积约16.28亿亩[39];1980年前后耕地概查数据订正后的面积为20.22亿亩[39];1996年全国第一次土地调查结果显示,全国耕地面积为19.51亿亩[39];2009年第二次全国土地调查公报显示,全国耕地面积为20.31亿亩[40]。
综上可见,尽管自战国以来中国耕地面积总体呈增加趋势,其中在过去2000年间,全国耕地总量从公元初的5.72亿亩增至2009年的20.31亿亩(图2);但其间也曾受社会治乱、朝代更替而致的人口波动、农耕政策和气候变化(特别是冷暖和干湿的多年代至百年尺度波动可造成农耕范围的盈缩及农牧交错带的农耕比重变化)等多种因素共同影响而多次出现不同程度的波动;特别是魏晋南北朝、唐末至五代及北宋初、两宋交替、元朝至明初等时段,全国耕地总量均较其前期的最高值至少下降10%以上,其中最大者甚至超过30%。
4 过去千年垦殖率空间分布的变化
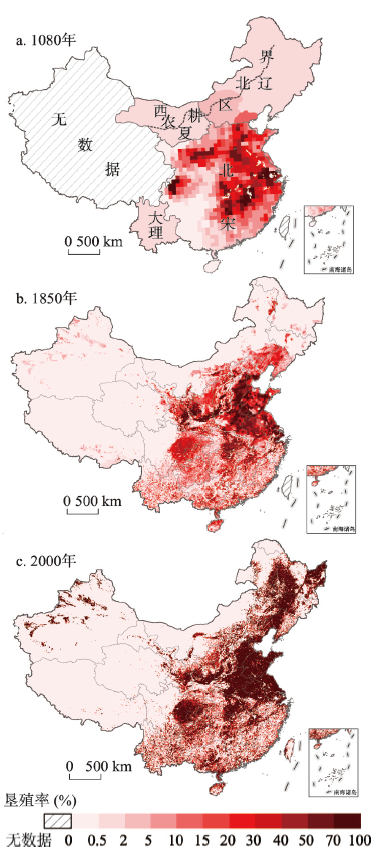
受中国地貌和气候条件限制,中国可垦土地资源分布的地域差异极为显著,其中主要集中在东部季风区。在经历汉对北方地区和唐、宋时期对南方地区的大规模农耕开发后,包括湿地围垦和山地拓垦等[77];及至北宋盛期(11世纪末),东部季风区的宜农土地已基本垦殖殆遍。据古城遗址推断,当时中国耕地的分布北界已达今大青山北的四子王旗、化德,以及今浑善达克沙地南缘和科尔沁沙地西部的太仆寺旗、正蓝旗、克什克腾旗、林西、巴林左旗[59],与20世纪末时的连片高垦殖区北界基本一致(图3);并朝“田尽而地、地尽而山,山乡细民,必求垦佃、犹不胜稼”(元·王桢《农书》)的山地垦耕方向趋势发展,这也奠定了中国耕地分布的主体格局。图3
 新窗口打开|下载原图ZIP|生成PPT
图31080年、1850年和2000年中国垦殖率空间分布
注:基于自然资源部标准地图服务网站GS2019(1830)号的地图制作,底图无修改。图a中北宋区域数据引自文献[48],并据文献[78]对西南局部地区进行修订,空间分辨率60 km×60 km;辽区域数据引自文献[33];西夏和大理区域垦殖率为本文推算;北方农耕区北界引自文献[59]。图b中东北地区数据据文献[43]订正,分辨率10 km×10 km;华北地区数据引自文献[50],分辨率10 km×10 km;其他区域数据均引自文献[49],分辨率10 km×10 km。图c中数据引自据文献[87],原始数据的分辨率为1 km×1 km,为便于与图b对比,本文重采样分辨率为10 km×10 km。
Fig. 3Spatial distribution of fractional cropland cover in China in 1080, 1850, and 2000 AD
集成1080年前后北宋境内的垦殖率格网化重建结果及其他政区的垦殖率估算结果 (图3a)显示:当时宋、辽境内垦殖率总体达11.5%;特别是长江以南地区垦殖强度较其前期显著加大,使得北宋境内的垦殖率达16.9%[33]。其中在北宋,60 km×60 km格网的垦殖率重建结果显示:除北方传统农耕区黄淮海平原、关中平原等垦殖率达30%以上外,南方的长江三角洲、鄱阳湖平原、两湖平原和四川盆地等区域的垦殖率也基本达到30%左右,东南沿海的丘陵河谷地带及四川盆地周边河谷山地等大多达5%以上,高者也达10%以上[48],仅西南局部地区垦殖率较低[78]。辽境内各道的垦殖率估算结果显示:辽管辖的今中国境内区域(主要包括今东北三省,内蒙古大部,河北、山西、陕西北部及京、津),其垦殖率虽总体仅为2.0%左右,但南京道(约今京、津和河北北部)的垦殖率亦达14.8%[33]。另据前文估算可知:位于西北的西夏,其初期(延祚七年,1044年)的垦殖率约0.9%,鼎盛时期(天盛年间,约1160年前后)的垦殖率约1.7%;据此推算11世纪后期西夏的垦殖率约为1.2%。大理末期(天定二年,1254年)的垦殖率约0.7%,因此推算其11世纪后期垦殖率也达0.6%左右(图3a)。
其后千年,全国农耕区的垦殖强度虽总体呈增加趋势,但各地的垦殖强度却存在明显波动,其中尤以北方地区波动更为显著。元代各行省的垦殖率估算结果显示:较之宋代农耕鼎盛期(1080年前后和1210年前后)[33],处于农耕低潮时期的元初(1290年前后)[34],北方主要农业区除腹里地区(约相当于今河北、山西、山东三省和京、津两市及内蒙中部部分地区)垦殖率较高外,其余地区的垦殖率均出现显著下降,其中河南行省(约相当于北宋的京西、淮南路,今河南和江苏北部)从之前的20%以上[33]下降至13%左右[34]。陕西行省和甘肃行省降幅更甚。北宋时陕西路(约相当于元初的陕西和甘肃两行省)的垦殖率约8%[33];但至1290年前后,陕西行省的垦殖率只有2%,甘肃行省仅0.5%[34];虽然这一结果可能偏低,但也与当时黄河流域经连年战乱、灾荒后尚未恢复的“十室九空”境况大体吻合。而在南方,除江浙行省(约相当于今浙江、福建两省及上海市和苏南、皖南和江西东部)外,其余各地的垦殖率也均出现不同程度下降;特别是宋代农耕发达的两湖平原和四川盆地降幅最为显著[34];这也与蒙元与南宋多年交战的主战场多集中在沿长江一线大体吻合。
不过元代之后,尽管全国也曾因战乱和社会动荡而出现间歇性的耕地大幅减少,但从总体看,明、清时期各地垦殖强度均有不同程度的提高,对山地、湿地的垦殖亦不断增强[79,80,81],且边疆地区的农耕也得以迅速发展。其中明万历十一年(1583年)各省垦殖率重建结果[82]显示,山东和河南垦殖率已超过40%,浙江、南直隶超过20%,北直隶、山西、江西和湖广垦殖率达10%~15%[82]。
至1850年前后,集成已有的垦殖率格网化重建结果(图3b)显示:华北平原、汾渭盆地和陇东地区、四川盆地、两湖平原、鄱阳湖平原及长三角地区等传统农业区的垦殖率已总体超过30%。以10 km×10 km格网计,华北平原、汾渭盆地、两湖平原及长三角等地,有半数以上格网的垦殖率超过50%,最高甚至超过70%。西南的云、贵与长江以南各省虽受地形高起伏等限制,垦殖率总体较低,但在其中的河谷、丘陵地带,垦殖率通常也达10%以上,高者可达20%以上。仅东北的吉林、黑龙江及内蒙古东部等受当时“封禁”限制[43],西北及青藏高原受干旱与高寒等气候条件的限制,因而以省、区计的垦殖率均低于2%,但也有局部地区,如东北的驿站沿线[43]、西北的绿洲带[59]及青藏高原的河谷地带[45-46, 73]等宜农之地,也出现了较高程度开垦。特别是在今新疆,清代的屯耕除军屯外,还设置了回屯、旗屯、遣屯等多种屯田方式;至嘉庆、道光年间新疆农耕达到鼎盛时,屯耕区域不仅遍布汉、唐时期垦殖范围,还在北疆绿洲进行了大量拓垦[83,84,85]。而且在1861年之后,随着清政府取消对吉林、黑龙江及内蒙古的开垦“封禁”[43],这些地区亦被大规模移民开垦,迅速发展成为新垦区[58, 86],因而其垦殖率也出现显著提高。
至20世纪,特别是随着1949年以后30余年的全国耕地面积快速增长,全国各地的垦殖率又出现了不同程度的增加,至1980年前后,全国境内的垦殖率达14.0%以上。此后至21世纪,全国耕地面积虽有小幅波动(其中增加的区域主要在东北和新疆,而长城以内大部分农区因城市扩张和退耕还林还草等均出现不同程度下降)[87,88,89];从千年变化过程看,属相对稳定水平。融合9套全球遥感解译结果得到的2000年全国耕地空间分布[87]显示(图3c),中国耕地主要集中连片分布在黑龙江黑河至云南腾冲一线以东的东部季风区,虽然这一地区国土面积仅为全国的43.8%[90],但其耕地面积却占全国耕地总面积的 3/4以上。其中东北平原、黄淮海地区、汾渭盆地和陇东地区、四川盆地、长江中下游平原等农业区有2/3以上格网的垦殖率超过70%(图3c)。从北方的辽西丘陵、坝上高原、黄土高原到南方各省的丘陵、山地等,虽受地形起伏影响耕地分布相对分散,但垦殖率也多在15%以上,部分河谷地带的垦殖率甚至亦已超过70%。而黑龙江黑河至云南腾冲一线以西的耕地虽在20世纪50年代以来呈持续增加态势,但因受自然条件(特别是气候与水资源)的制约[57]而多呈不连续的带状与零星分布,因而垦殖率总体较低。不过其中的许多绿洲地带,如河西走廊和天山南北两麓、伊犁盆地等,其垦殖率也均较高,局地最高者也达70%以上。青藏高原也因受自然条件(特别是高寒气候与地形等)制约,耕地总体呈零星分布[91,92],垦殖率总体较低。但位于青藏高原东北缘的河湟谷地,得益于自然条件相对较好,农业发展历史悠久[73],局地最高者垦殖率也达50%以上。
5 结论与讨论
本文根据中国历史时期农耕扩展过程和耕地变化重建等方面的研究成果,通过梳理、列举、归纳不同研究者的研究认识和集成不同****的耕地数量及垦殖率重建结果,综合分析了过去2000年中国主要农耕区拓展的阶段性及其间全国耕地面积和其中近千年垦殖率变化的主要特征。主要结论如下:(1)自战国以来,中国主要农耕区有3次大规模拓展。第一次盛于汉代,主要范围从黄河中下游地区拓展至长江以北地区,长江以南大部分地区垦殖程度低;第二次盛于唐宋时期,主要特征是对长江以南地区从平原低地拓垦至丘陵山地;第三次为清中叶以后,主要是对东北、西北和西南等边疆地区的拓垦和全国山地的深度开发;至20世纪80年代达到了最大垦殖范围。
(2)尽管因朝代疆域不同、政区差异使得耕地历史记录与重建结果的地域范围无法完全统一,但自战国以来,中国耕地面积一直呈波动增加趋势,直至20世纪后期才相对稳定。其中公元初突破5亿亩,8世纪前期突破6亿亩,11世纪后半叶达近8亿亩,16世纪后期突破10亿亩,19世纪前期突破12亿亩,20世纪初突破14亿亩,1953年逾16亿亩,1980年逾20亿亩。不过其间也多次出现不同程度的波动,其中魏晋南北朝、唐末至五代及北宋初、两宋交替、元朝至明初等时段,全国耕地总量均较其前期的最高值至少下降10%以上,最大者甚至超过30%。
(3)中国耕地空间分布的主体格局至11世纪前后就已基本奠定,其后千年的垦殖强度虽因多种原因而数度波动,但总体上呈增加特征。其中1080年前后,黄淮海、关中平原等的垦殖率达30%以上,长江三角洲、鄱阳湖平原、两湖平原和四川盆地等地的垦殖率也达30%左右。至1850年前后,华北平原、汾渭盆地和陇东地区、四川盆地、两湖平原、鄱阳湖平原及长三角地区等的垦殖率均超过30%,其中华北平原、汾渭盆地、两湖平原及长三角等,有半数以上地区的垦殖率超过50%。2000年前后,东北平原、黄淮海地区、汾渭盆地和陇东地区、四川盆地、长江中下游平原等农业区有2/3以上地区的垦殖率超过50%,辽西丘陵、坝上高原、黄土高原及南方各省的丘陵、山地等,垦殖率也多达15%以上;同时在河西走廊和新疆天山南北两麓、伊犁盆地等形成了带状的绿洲农业,在青海河湟谷地及西藏南部的一江两河流域形成了河谷农业带,其垦殖率局地最高者也达50%以上。
不过由于本文研究时段长跨2000年,用于不同时期耕地重建与估算的资料源来自历史记载、调查数据与遥感解译结果等多种类型,特别是由于这些资料源的特点不同、计量标准和精度不一,因此上述结果仍存在不确定性,其中主要有以下2个方面:
(1)由于中国历代田亩记载数据实质上是一种纳税单位,且不同朝代的田亩内涵、统计标准、亩制不一,还存在折亩、甚至隐匿等问题;因此尽管本文所采用的结果均为经研究者对原始记录所存在问题进行仔细分析、考订后,针对各种问题采用定量重建方法进行校准和亩制换算后的公开发表数据,但仍难免存在偏差。以目前研究最为深入的清代全国耕地为例,对比不同研究者的重建结果发现(表1):其偏差范围为1.8%~18.3%,即便是同一研究者使用同一来源的历史田亩记载、相同推算方法及亩制换算标准,也会因推算起点假定不同导致结果[35,36]存在5.3%左右的差异;但其中有80%的偏差在10%之内,平均为5.8%;因此可推断现有中国历史时期耕地面积重建结果大致有5%~10%的偏差。不过,我们认为对历史时期全国范围的耕地面积而言,这样的偏差是可接受的。而且,通过案例对比评估[42, 50, 80, 93-95]也表明相较于上述中国****的历史耕地重建结果,目前国际上根据人口数量、土地宜垦性等指标推算的SAGE[96]、HYDE[97,98]等全球LUCC格网化数据集在中国境内的历史耕地估算与空间分配均存在显著偏差。因此,HYDE 3.1以后的版本LUCC格网化数据集已逐步采用中国****的过去300年耕地重建结果替换其原有数据[99,100];但即便是替换耕地总量后的时段,其空间分配也仍存在偏差[50, 80, 95]。
(2)对于2000年前后的全国垦殖率,因其源于全球遥感解译得到的格网化耕地融合数据,故与历史时期重建及调查统计数据相比,大多数区域可能偏高。以耕地面积计,该数据显示:2000年全国耕地合计约27.02亿亩,这一结果与地球系统科学数据共享网 (www. geodata.cn)发布的全国1 km网格土地利用数据(其中耕地总计共26.71亿亩)[88]基本一致,但却分别较1996年的全国土地调查结果高7.52亿亩(38.6%)和2009年的调查结果高6.71亿亩(33.0%)。以分省(市、区)垦殖率计,与其最近时点的1996年土地调查结果相比,在除台湾外的31省(市、区)中,遥感解译结果的垦殖率较调查结果高5个百分点以上的省(市、区)多达19个,其中高10个百分点以上有12个,包括:黑龙江、吉林、辽宁、北京、天津、河北、山东、河南、上海、江苏、安徽、湖北。特别是根据土地调查数据计算显示,垦殖率最高的3个省(不含直辖市)分别是:河南50.69%,山东48.67%,江苏47.22%;但根据遥感解译结果,这3个省的垦殖率却均超过70%,分别达71.53%、78.2%和71.3%,因而可能显著偏大。
上述这些问题也说明,继续挖掘历史文献记载、改进历史耕地格网化分配方法,提升历史时期耕地变化重建结果的精度和可信度,发展历史重建、调查统计、遥感解译等多种来源数据的比对与融合方法,以更好地集成不同时段、不同区域、不同来源数据,促进历史耕地重建及相关历史地理问题研究与全球变化核心研究的深度交叉与融合,是本领域亟待深入开展的重要问题。
参考文献 原文顺序
文献年度倒序
文中引用次数倒序
被引期刊影响因子
[本文引用: 1]
[本文引用: 1]
DOI:10.1073/pnas.1217241110PMID:23630271 [本文引用: 2]

Human use of land has transformed ecosystem pattern and process across most of the terrestrial biosphere, a global change often described as historically recent and potentially catastrophic for both humanity and the biosphere. Interdisciplinary paleoecological, archaeological, and historical studies challenge this view, indicating that land use has been extensive and sustained for millennia in some regions and that recent trends may represent as much a recovery as an acceleration. Here we synthesize recent scientific evidence and theory on the emergence, history, and future of land use as a process transforming the Earth System and use this to explain why relatively small human populations likely caused widespread and profound ecological changes more than 3,000 y ago, whereas the largest and wealthiest human populations in history are using less arable land per person every decade. Contrasting two spatially explicit global reconstructions of land-use history shows that reconstructions incorporating adaptive changes in land-use systems over time, including land-use intensification, offer a more spatially detailed and plausible assessment of our planet's history, with a biosphere and perhaps even climate long ago affected by humans. Although land-use processes are now shifting rapidly from historical patterns in both type and scale, integrative global land-use models that incorporate dynamic adaptations in human-environment relationships help to advance our understanding of both past and future land-use changes, including their sustainability and potential global effects.
DOI:10.1579/0044-7447(2007)36[614:TAAHNO]2.0.CO;2URL [本文引用: 1]
[本文引用: 2]
[本文引用: 3]
[本文引用: 4]
DOI:10.1002/wcc.v2.6URL [本文引用: 1]
DOI:10.3402/tellusb.v43i4.15406URL [本文引用: 1]
DOI:10.22498/pagesURL [本文引用: 1]
[本文引用: 1]
[本文引用: 1]
[本文引用: 1]
[本文引用: 1]
[本文引用: 1]
[本文引用: 1]
[本文引用: 1]
[本文引用: 1]
[本文引用: 1]
[本文引用: 1]
[本文引用: 1]
[本文引用: 1]
[本文引用: 1]
[本文引用: 1]
[本文引用: 1]
[本文引用: 1]
[本文引用: 1]
[本文引用: 1]
[本文引用: 1]
[本文引用: 1]
[本文引用: 1]
[本文引用: 1]
[本文引用: 1]
[本文引用: 1]
[本文引用: 3]
[本文引用: 3]
DOI:10.1007/s00376-009-9031-5URL [本文引用: 1]
[本文引用: 2]
[本文引用: 2]
DOI:10.18306/dlkxjz.2016.02.003 [本文引用: 1]
Constructing a spatially-explicit time series of historical land cover dataset is of upmost importance for climatic and ecological studies that make use of land use and cover change (LUCC) data. Some scholars have made efforts to simulate and reconstruct quantitatively information on China's historical land use. Due to the multiple sources of land use data, diversity of reconstruction approaches, and different methods of verification, the reconstruction results of spatially-explicit historical land cover datasets significantly differ. To better understand China's historical land cover datasets and provide effective references for future reconstruction study, it is necessary to comprehensively summarize and discuss the reconstruction methods. By comparing the characteristics of different historical land cover datasets, this research thoroughly analyzed the conceptual constructs, assumptions, reconstruction methods, and validation of the models. The main conclusions are as follows: (1) The majority of the research methods starts with reconstruction of the quantity of historical land cover and then proceeds to spatial pattern reconstruction. Given the lack of adequate and reliable historical data, making reasonable hypotheses about basic data, factors controlling distribution, and limiting factors is an important condition for attaining sound reconstruction results. (2) Methodologically, the majority of the studies uses the reduction method based on historical records and the reconstruction method based on spatial models that consist of the "top-down" method of spatial distribution and the "bottom-up" method of evolutional reconstruction models. (3) In order to improve the explanatory power of the results, it is necessary to validate the reconstruction output of historical land cover datasets in detail. While direct validation of reconstruction results is a more precise method, it is often restricted by the spatiotemporal scales of the research and data sources. Indirect validation method provides an important alternative for accuracy evaluation of the reconstruction results.
[本文引用: 1]
[本文引用: 1]
[本文引用: 1]
[本文引用: 1]
[本文引用: 1]
[本文引用: 8]
[本文引用: 8]
[本文引用: 2]
[本文引用: 2]
[本文引用: 9]
[本文引用: 9]
[本文引用: 2]
[本文引用: 2]
DOI:http://www.geog.com.cn/article/2021/0375-5444/10.1038/s41598-018-31807-6URL [本文引用: 14]
[本文引用: 6]
[本文引用: 5]
[本文引用: 5]
[本文引用: 3]
[本文引用: 3]
DOI:10.1007/s11442-015-1219-2URL [本文引用: 1]
DOI:10.11821/xb200006007 [本文引用: 1]
The research of landuse and land cover change is a core project in the international global environmental change studies, and project aims at revealing how landcover has been changed in China in the last century will be an important and necessary action. Based on the standardized and unified data collected from numrable and valuable historical documents and various statistical reports which were published before 1950 but now are scattered in the nationwide libraries and archives, and the classification data obtained by investigations and remote sensing after 1950, the landcover change and characteristics of land use in China during the 20th century are traced and analyzed in this paper. The results are: ① The unused and non arable land keeps decreasing and landcover has been changed obviously. ② The cultivated land, forestland, horticultural land, settlement, and mining land, and transportation land are increasing, in which, the augmentations from 1914 to 1997 for cultivated land, forest land, horticultural land, settlement and mining land, and transportation land were 49×10<sup>6</sup>hm<sup>2</sup>, 49×10<sup>6</sup>hm<sup>2</sup>, 7 1×10<sup>6</sup>hm<sup>2</sup>, 17 5×10<sup>6</sup>hm<sup>2</sup>, 3 1×10<sup>6</sup>hm<sup>2</sup>, respectively. ③ The grasslands, uncultivated arable land, water bodies and wetland are decreasing, in which, the decrements from 1950 to 1990 for the grasslands and uncultivated arable land were 65×10<sup>6</sup>hm<sup>2</sup> and 90×10<sup>6</sup>hm<sup>2</sup>. ④ The proportional structure of land use consisted in the cultivated, forestland, grassland, horticultural land, settlement and mining land, transportation land, water bodies, and others by 10 19%, 13 02%, 40 83%, 0 11%, 0 49%, 0 21%, 2 35%, 32 8% in 1949, and by 14 14%, 23 65%, 26 91%, 0 85%, 2 33%, 0 53%, 4 30%, 27 29% in 1997, respectively.
[本文引用: 1]
[本文引用: 4]
[本文引用: 4]
[本文引用: 3]
[本文引用: 3]
[本文引用: 5]
[本文引用: 5]
[本文引用: 3]
[本文引用: 3]
[本文引用: 8]
[本文引用: 8]
[D].
[本文引用: 3]
[D].
[本文引用: 3]
DOI:10.18306/dlkxjz.2016.06.010 [本文引用: 4]
The Yellow River-Huangshui River Valley(YHV) located in the northeast edge of the Qinghai-Tibet Plateau is a typical farming-pastoral area. Since the Qing Dynasty, the expansion of cultivated land has led to a significant change in forest and grassland cover in this region. Base on the current vegetation map, soil and topographic factors, and historical data in literature, this study reconstructed the potential forest and grassland spatial distribution in the YHV. Combined with the reconstructed farmland change in the Qing Dynasty, we calculated the change of forest and grassland coverage in the YHV in the Qing Dynasty. The results show that: (1) The spatial distribution of forest and grassland before cropland expansion in the Qing Dynasty was consistent with present day vegetation distribution. The forest area was slightly larger, the shrub area was spatially more contiguous, and the distribution of grassland was wider. (2) The estimated area of forestland was 0.28×10⁴ km2, the area of shrub was 0.93×10⁴ km2, and the area of grassland was 2.1618×10⁴ km2 before reclamation in the Qing Dynasty. Because of farmland reclamation activities, it is estimated that the areas of grassland, shrub, and forest have decreased by 5180.41 km2, 1330.35 km2, and 441.31 km2 in the YHV region at the end of the Qing Dynasty. The area of reclaimed grassland was the largest (52% of potential grid of grassland became cultivated cropland) and the intensity of conversion was high (the average reclamation index of grassland grids was 10%). The reduced areas mainly concentrated in the LeDu Basin, Xining Basin in the middle of the Huangshui Valley, Jianzha Basin in the Yellow River Valley, and the Hualong Basin. The target vegetation types that have been reclaimed by humans in the YHV in the Qing Dynasty were not only influenced by factors of natural environment but also social policies.
[本文引用: 4]
[本文引用: 4]
[本文引用: 4]
DOI:10.1007/s11442-009-0036-xURL [本文引用: 2]
DOI:10.1007/s11442-012-0932-3URL [本文引用: 3]
DOI:10.1007/s10113-014-0751-4URL [本文引用: 3]
DOI:10.1016/j.gloplacha.2019.01.010URL [本文引用: 5]
[本文引用: 4]
[本文引用: 4]
DOI:10.1360/N072015-00482URL [本文引用: 1]
[本文引用: 1]
[本文引用: 1]
[本文引用: 1]
DOI:10.1177/0959683612441839URL [本文引用: 1]
[本文引用: 1]
[本文引用: 1]
[本文引用: 2]
[本文引用: 2]
[本文引用: 5]
[本文引用: 5]
[本文引用: 4]
[本文引用: 4]
[D].
[本文引用: 5]
[D].
[本文引用: 5]
[本文引用: 1]
[本文引用: 1]
DOI:10.11821/xb199305005 [本文引用: 1]
According to the history,the oases in Tarim Basin can be divided into ancient oases,old oasis and new oases. Based on landform they can be classified as valleys,alluvial fans,alluvial plains and river terminus. The formation is affected by hydrology,landform,soil,vegetation and other natural factors,and it is also affected by the enhancement of water conservancy technique,the improvement of productive tool and the growth of population. The development and evolution of oases is mainly decided by the human utilization of water resources. The ancient small oases are mostly distributed in the lower reaches of rivers. Along with the development of agriculture and the enlargement of oases,water becomes insufficient in the lower reaches,which causes the oases moving towards the piedmont area. As a result,the oases in the lower reaches were compelled to be abandoned due to the shortage of water. The further enlargement of oases can not be satisfied by using the water from river channels hence the plain reserviors should be constructed to regulate runoff. That is the reason why the new oases irrigated by using reservoirs are mostly located around the old piedmont oases. Strong winds and sands,serious salinization and river course change are the natural causes for the disappearance of ancient oases. The main human cause is the agricultural irrigation which results in temporal and spatial changes of the distribution of surface water.
[本文引用: 1]
[本文引用: 1]
[本文引用: 1]
[本文引用: 1]
[本文引用: 1]
[本文引用: 1]
[本文引用: 1]
[本文引用: 1]
[本文引用: 1]
[本文引用: 1]
[本文引用: 1]
[本文引用: 3]
[本文引用: 3]
[D].
[本文引用: 2]
[D].
[本文引用: 2]
[本文引用: 1]
[本文引用: 1]
[本文引用: 1]
[本文引用: 1]
[本文引用: 2]
[本文引用: 2]
[本文引用: 2]
[本文引用: 2]
[本文引用: 3]
[本文引用: 3]
[本文引用: 1]
[本文引用: 1]
[本文引用: 1]
[本文引用: 1]
[本文引用: 1]
[本文引用: 1]
[本文引用: 1]
[本文引用: 1]
DOI:10.11821/dlxb201611008 [本文引用: 2]
Based on "Cropland Taxes" and "the Number of Households" data recorded in historical documents, this paper estimated cropland area of the Northern Song Dynasty by analyzing some society factors in this dynasty, including land use policies and taxation system. Besides, by quantifying the relationship among population proportion, per capita cropland and cropland spatial pattern in the mid-Northern Song Dynasty, we designed a cropland distribution model. And the model was used to reconstruct cropland area at Lu (administrative region of the Northern Song Dynasty) scale for AD 976, 997, 1066 and 1078. The results are shown as follows: (1) The cropland area of the whole study area for AD 976, 997, 1066 and 1078 of the Northern Song Dynasty were about 468.27 million mu (Chinese area unit, 1 mu=666.7 m2), 495.53 million mu, 697.65 million mu and 731.94 million mu, respectively, and 264 million mu was increased for AD 976-1078. The annual growth rate of cropland area was about 4.4‰, and the reclamation rate (i.e. ratio of cropland area to total land area) increased from 10.7% to 16.8%, and per capita cropland area decreased from 15.7 mu to 8.4 mu. (2) In terms of the characteristics of cropland spatial pattern change, the reclamation rate of the Southeast, Northern and Southwest in the Northern Song territory increased by 12.0%, 5.2% and 1.2%, respectively, and that of some regions of the Yangtze River Plain increased to more than 40%, and for the North China Plain the reclamation rate increased to more than 20%. The reclamation rate of the Southwest (except the Chengdu Plain) in the Northern Song territory was less than 6%. (3) The evaluation results show that the absolute relative error of 84.2% Lu was less than 20%, so the cropland distribution model is feasible. Therefore, our reconstruction results can reflect the spatial-temporal characteristics of cropland area in the Northern Song Dynasty.
[本文引用: 2]
[本文引用: 1]
[本文引用: 1]
DOI:10.1007/s10113-019-01575-8URL [本文引用: 3]
[本文引用: 1]
[本文引用: 1]
[本文引用: 2]
[本文引用: 2]
[本文引用: 1]
[本文引用: 1]
[本文引用: 1]
[本文引用: 1]
[本文引用: 1]
[本文引用: 1]
[本文引用: 1]
[本文引用: 1]
DOI:10.3390/rs11192250URL [本文引用: 3]
[本文引用: 2]
[本文引用: 2]
DOI:10.11821/dlxb201809001 [本文引用: 1]
Landform is an important factor determining the spatial pattern of cropland through allocating surface water and heat. Therefore, it is of great significance to study the change of cropland distribution from the perspective of geomorphologic division. Based on China's multi-year land cover data (1990, 1995, 2000, 2005, 2010 and 2015) and geomorphologic regionalization data, we analyzed the change of cropland area and its distribution pattern in six geomorphologic regions of China over the period 1990-2015 with the aid of GIS techniques. Our results showed that the total cropland area increased from 177.1 to 178.5 million hectares with an average increase rate of 0.03%. Cropland acreage decreased in southern China and increased in northern China. Region I (eastern hilly plains) had the highest cropland increase rate, while the dynamic degree of Region IV (northwestern middle and high mountains, basins and plateaus) was significantly higher than that of other regions. The barycenter of China's land cultivation had shifted from North China to northwest over the 25 years. Regions IV and I were the two high-growth regions of cultivated land. Region II (southeastern low-middle mountains) and Region V (southwestern middle and low mountains, plateaus and basins) were the main decreasing regions of cultivated land. The area of cultivated land remained almost unchanged in Region III (north China and Inner Mongolia eastern-central mountains and plateaus) and Region VI (Tibetan Plateau). The loss of cropland occurred mostly in regions I and II as a result of growing industrialization and urbanization, while the increase of cropland occurred mainly in Region IV because of reclamation of grasslands and other wastelands.
[本文引用: 1]
[本文引用: 1]
[本文引用: 1]
DOI:10.11820/dlkxjz.2015.02.008 [本文引用: 1]
Since numerical simulation has become a popular method for studying the effects of land use and land cover change on climate and environment, spatially explicit historical cropland datasets are increasingly required in regional and global climate change and carbon cycle research. In this study, using historical population data as a proxy, we estimated the provincial cropland area of Qinghai and Tibet in 1910. Based on the statistical data of the National Bureau of Statistics of China, the survey data of the Ministry of Land and Resources, and the results of some previous studies, we revised the cropland area of Qinghai and Tibet in 1950-2000. The relationship between altitude and surface slope and cropland distribution were quantified to develop the spatially explicit reconstruction model of historical cropland at a resolution of 1 km×1 km. Since the cropland area reached the maximum in the 1980s, the satellite-observed cropland distribution extent of this time period was taken as the maximum distribution extent of historical cropland. The model developed in this research was used to reconstruct the spatial patterns of cropland in Qinghai and Tibet in 1910, 1960, 1980, and 2000. The reconstruction results show that: (1) in 1910-1950, cropland area of Qinghai-Tibet was stable, while in 1950-1980 cropland area increased rapidly, reaching 10583 km2, which is the maximum of the entire study period; in 1980-1990, cropland area decreased slightly; and in 1990-2000, cropland area increased slightly; (2) with regard to its spatial distribution, in 1910-1960, cropland expanded and land use activities intensified greatly in the Yellow River-Huangshui River Valley (YHV); in 1960-1980, cropland expansion and land use intensification occurred in the YHV, the Yarlung Zangbo River, the Nianchu River, and the Lhasa River valleys; in 1980-2000, the spatial pattern of cropland in Qinghai and Tibet remained unchanged. By comparing the reconstruction results of this study for 2000 with satellite-observed cropland distribution of the same year, we found that the correlation coefficient was 0.92 and the absolute difference followed normal distribution. The percentage of grid cells where the absolute difference is low (-10% to 10%) reached 73.29%, while the percentage of grid cells where the absolute difference is high (>40% or <-40%) was 1.94%. Incorporating more information on historical population and cropland of Qinghai and Tibet will help improve the accuracy of our reconstruction modeling. The reconstruction results of this research can be used in regional climate models to study the impact of cropland cover change on the climate and carbon cycle.
[本文引用: 1]
[本文引用: 1]
[本文引用: 1]
DOI:10.1007/s11430-010-4053-5URL [本文引用: 1]
DOI:10.1007/s11769-017-0862-1URL
DOI:10.1007/s11430-019-9555-3URL [本文引用: 2]
DOI:10.1029/1999GB900046URL [本文引用: 1]
DOI:10.1029/1999GB001232URL [本文引用: 1]
DOI:10.1080/17474230701622940URL [本文引用: 1]
DOI:10.1111/geb.2011.20.issue-1URL [本文引用: 1]
DOI:10.5194/essd-9-927-2017URL [本文引用: 1]
