 ,1, 王平,1,2, 王田野3, 黄其威1,2, 于静洁1,2
Characteristic analysis of organic carbon output and its affecting factors of Arctic rivers in Siberia
LIU Shiqi,1, WANG Ping,1,2, WANG Tianye3, HUANG Qiwei1,2, YU Jingjie1,2通讯作者:
收稿日期:2020-03-5修回日期:2020-12-2网络出版日期:2021-05-25
| 基金资助: |
Received:2020-03-5Revised:2020-12-2Online:2021-05-25
| Fund supported: |
作者简介 About authors
刘诗奇(1990-), 女, 黑龙江人, 博士后, 主要从事地质环境与气候变化研究。E-mail:

摘要
关键词:
Abstract
Keywords:
PDF (3009KB)元数据多维度评价相关文章导出EndNote|Ris|Bibtex收藏本文
本文引用格式
刘诗奇, 王平, 王田野, 黄其威, 于静洁. 西伯利亚北极河流有机碳输出特征及影响要素. 地理学报[J], 2021, 76(5): 1065-1077 doi:10.11821/dlxb202105002
LIU Shiqi, WANG Ping, WANG Tianye, HUANG Qiwei, YU Jingjie.
1 引言
在河流侵蚀和搬运作用下,从陆地迁移至海洋的碳是全球碳循环的重要组成[1]。气候增暖在北极具有“极地放大效应”(Polar-amplified Warming)[2],导致北极地区多年冻土退化、活动层厚度增加[3,4]。多年冻土中储存的有机碳大量释放[5],并部分随河流输出至北冰洋[5,6],这一过程成为极地碳循环中的重要环节。而广泛发育的多年冻土,不仅影响着北极河流有机碳输出,也使其同北极多年冻土层一样,对气候变化十分敏感[7]。20世纪80年代起,诸多****针对世界河流有机碳展开研究[1, 8],但受限于监测数据,多数研究仅在年际尺度上分析各流域有机碳输出[1]。20世纪90年代以来,该领域的科学研究主要围绕河流有机碳输出的时空特征、影响因素及其对气候变化的响应开展[1, 5, 9-11]。西伯利亚地区拥有鄂毕河、叶尼塞河和勒拿河3条北极大型河流[5, 12],作为北冰洋淡水输入的重要源区,流域内广泛发育多年冻土,是北极气候与环境变化研究的重点区域[4, 13]。与世界其他河流一样,西伯利亚北极河流有机碳输出受径流、地形和土壤有机碳含量等多要素的影响[1]。而与此同时,由于其高纬度的地域属性和广泛发育的多年冻土,气候变暖引起的冻土退化又将对各环境要素产生不同程度的影响[14,15],并明显反映在河流有机碳输出的时空响应上。
因此,研究气候变暖条件下的北极河流有机碳输出特征及其影响要素,有利于深入揭示北极碳循环对气候及环境变化的综合响应,为建立北极河流有机碳输出与环境变化的关系,增强对北极碳循环的认识,科学应对气候变暖等提供理论依据。本文在前人研究基础上,通过分析2004—2017年鄂毕河、叶尼塞河和勒拿河的ArcticGRO(Arctic Great Rivers Observatory)径流及有机碳数据(
2 研究区概况
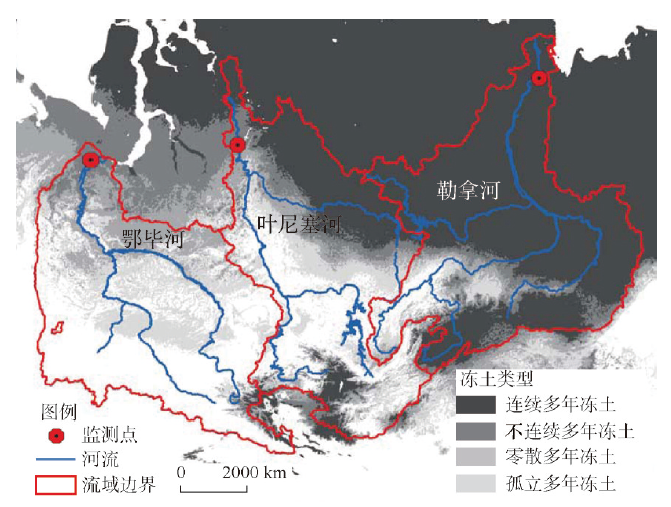
北冰洋仅占全球海洋体积1%,却拥有超过世界10%的径流输入(约3300 km3/a)[16,17]。北极地区最大的3条河流均位于俄罗斯西伯利亚地区,自西向东分别为鄂毕河(Ob River)、叶尼塞河(Yenisei River)和勒拿河(Lena River)(图1),其流域面积及河流径流量均可与北美最大的密西西比河流域相提并论[9, 17](表1)。但不同于世界其他河流,西伯利亚北极河流流域内广泛发育多年冻土,且覆盖率随纬度的增加自上游向下游呈增加趋势[14],河流冬季结冰而春季洪泛[18]。气候变化影响着上述流域内多年冻土、降水、径流和河流化学组分等各个方面,进而导致河流下游生态系统发生变化[19]。图1
 新窗口打开|下载原图ZIP|生成PPT
图1鄂毕河、叶尼塞河、勒拿河流域位置及冻土分布
注:冻土数据来源于Jaroslav等[20]。
Fig. 1Geographic location of Ob, Yenisei and Lena river basins and distribution of permafrost
Tab. 1
表1
表1西伯利亚三大流域基本地理环境特征及人口数据统计
Tab. 1
| 鄂毕河 | 叶尼塞河 | 勒拿河 | 来源文献 | |
|---|---|---|---|---|
| 汇入海域 | 喀拉海 | 拉普捷夫海 | [11] | |
| 海域面积(104 km2) | 661.5 | 363.2 | ||
| 海域DOC汇入(Tg/a) | 11.1 | 8.26 | ||
| 流域面积(104 km2) | 311 | 257 | 247 | [1] |
| 257 | 258 | 242 | [39] | |
| 299 | 254 | 246 | [9] | |
| 295 | 244 | 243 | [32] | |
| 流域平均海拔(m) | 305 | 769 | 608 | [1] |
| 流域平均坡度(°) | 1.98 | 4.90 | 4.91 | |
| 平均土壤厚度(cm) | 216 | 93 | 49 | |
| 年均降水量(mm) | 393 | 356 | 337 | |
| 年均气温(℃) | -0.6 | -4.5 | -8.6 | |
| 土壤有机碳(kg/m3) | 20 | 12.6 | 12.9 | |
| 年径流量(km3) | 404~419 | 562~577 | 524~533 | [39] |
| 405 | 626 | 525 | [33] | |
| 427 | 673 | 588 | [9] | |
| 410 | 610 | 540 | [32] | |
| 多年冻土覆盖率(%) | 4~18 | 36~66 | 78~94 | [33] |
| 4 | 42 | 90 | [39] | |
| 连续多年冻土占比(%) | 1 | 31 | 77 | [9] |
| 人口密度(人/km2) | 8 | 3 | 0.4 | |
| 7 | 2 | 1 | [1] | |
新窗口打开|下载CSV
鄂毕河是俄罗斯第三大河流[21],南起阿尔泰山脉,向西再向北流经世界最大的泥炭地系统湿地——西西伯利亚平原[22],并最终汇入北冰洋喀拉海域,淡水汇入量约占北冰洋淡水汇入总量的15%[23]。多年冻土面积占流域的4%~10%[24],其中不连续多年冻土之下富集大量泥炭[25],气候变化将导致该地区全新世泥炭沉积的稳定性变差,预计未来将不断减少[5]。流域南部上游是俄罗斯小麦的主产区,而中下游是西西伯利亚油气田。20世纪50年代中期至80年代,鄂毕河流域共修建大型水库1座,中型水库3座。整体而言,鄂毕河流域人类活动较多,工农业的发展在一定程度上影响着流域的生态环境[26]。
叶尼塞河,南起萨彦岭(南西伯利亚),向北经过中西伯利亚高原,最终汇入北冰洋喀拉海域[27],约占北冰洋淡水汇入总量的22%[28],是北冰洋淡水贡献率最大的河流[7]。叶尼塞河径流具有明显的季节性,春季为径流高峰[18]。整个流域每年有超过6个月均被冰雪覆盖,多年冻土覆盖率高达90%[24],其中,连续多年冻土占34%,不连续多年冻土占11%,零散和孤立多年冻土共占45%[29],仅部分南部区域不发育多年冻土。
勒拿河源起于南部贝加尔、斯塔诺沃伊山和朱格朱尔山脉地区,并最终汇入北冰洋拉普捷夫海域,主要位于东西伯利亚雅库特地区[15]。整体属大陆性气候,年均降水量较低(200~500 mm),冬季寒冷漫长,最低温度可达-50 ℃,而夏季短暂且炎热,最高温度近35 ℃,流域内年均气温为-6 ℃,并随纬度升高而不断下降[30]。流域南部以不连续多年冻土为主,从60°N向北逐渐过渡为连续多年冻土(厚度从50~1500 m不等),淡水汇入量约占北冰洋的15%,且将近85%来自于春—夏季洪水(5—9月)[31]。
全球气候变暖影响着西伯利亚北极地区的多年冻土分布及降水模式[28],并导致河流径流过程及河水所携带物质组分发生改变[14, 28],包括河流有机碳含量的变化[5]。在综合西伯利亚3大河流基本地理环境及人口特征数据(表1)的基础上,通过研究西伯利亚北极流域的河流有机碳输出特征,发现3大流域的河流有机碳在来源及输出规律方面具有高度相似性的同时,也在径流、冻融及人类活动等影响下,存在显著差异。
3 西伯利亚北极河流有机碳来源及输出方式
气候变暖导致北极地区多年冻土退化,活动层厚度增加,大量有机碳从冻土中释放[34],并部分随河流汇入北冰洋。多年冻土作为世界最大的陆地有机碳库,其有机碳储量达1330~1580 Pg[35],约为大气碳总量的2倍[36]。因此,鄂毕河、叶尼塞河和勒拿河作为西伯利亚地区的主要河流,将大量有机碳从陆地搬运至海洋系统,其有机碳来源和输出方式,也成为了研究北极地区碳循环过程与机理的关键[9, 37]。3.1 西伯利亚北极河流有机碳来源
河流有机碳的主要来源包括本地陆源有机物质、外来生物作用产物和人类生产生活排放三大类[7]。其中,颗粒有机碳(POC)主要来源于本地生物作用、流水冲刷剥蚀以及土壤淋滤等物理风化作用产物,其浓度与悬浮固体总量(TSS)有关,而溶解有机碳(DOC)则主要来自于地表水和地下水的流动搬运,其浓度与地表水及地下水流量密切相关[1]。在多年冻土广泛发育的北极地区,由于有机碳输出机理不同,随河流输出的有机碳也具有明显的年代特征。DOC主要来源于现代陆相产物(Δ14C平均值为(72±39)‰)[38],而POC来源普遍比DOC更加久远(Δ14C平均值为(-261±82)‰),对应同位素年龄约为1600~3300 a[7],极有可能来自于多年冻土活动层,或多年冻土及泥炭层的有机碳[27, 39],甚至部分来自于沿河床分布的更深、更古老沉积物的剥蚀产物[5]。
三大流域DOC与POC输出的Δ14C也因多年冻土的差异发育而显著不同。分析各流域河口处的有机碳监测数据(鄂毕河采样点:66.63°N, 66.60°E;叶尼塞河采样点:67.43°N, 86.48°E;勒拿河采样点:70.68°N, 127.39°E)发现,鄂毕河流域DOC的Δ14C值从 -124.7‰~71.0‰不等,具有现代陆相产物和多年冻土活动层2种来源,说明在多年冻土发育程度较低的鄂毕河流域,多年冻土活动层中的有机碳相对不稳定,易于以溶解方式随河流输出;同样,在不连续和孤立多年冻土各占流域多年冻土总量1/3的叶尼塞河流域,也具有相似特征;而对于多年冻土发育程度较高的勒拿河流域,其河流输出的DOC(Δ14C:-49.8‰~152.3‰)几乎全部来源于现代陆相产物[5]。POC主要来自于多年冻土活动层,可见除风化剥蚀作用下以颗粒方式携带出多年冻土有机碳外,多年冻土发育程度较高的地区有机碳相对稳定,而随着多年冻土发育程度降低,多年冻土活动层有机碳更易于以溶解方式随河流输出,且相比较之下,孤立多年冻土较为发育的鄂毕河流域,其多年冻土活动层有机碳最为活跃,对气候变化的敏感度也更高。
此外,除各流域多年冻土的差异发育,Kutscher等也证实河流有机碳来源随河流流经区域不同而有所差异[6]。例如,坡度较陡的山区有机碳输出浓度低于地势平缓的低地,山区河流有机碳主要来源于土壤有机质[6]。
3.2 西伯利亚北极河流有机碳输出方式
河流有机碳通常以DOC和POC方式输出[7]。全球河流汇入大洋的POC约160 Tg/a,略高于DOC(140 Tg/a)[40]。北极地区的情况相反,其DOC输出总量(18~28 Tg/a)明显高达POC(4~7 Tg/a)4倍以上[1, 32, 39]。而西伯利亚河流DOC输出总量甚至高达POC的10~20倍。以叶尼塞河流域为例,随河流输出的DOC高达4.64~4.69 Tg/a [9],远超POC输出量(0.17 Tg/a)[41]。因此,北极河流有机碳输出在时间和空间上具有一定的区域特征,且随着采样时间不同,河流有机碳输出的研究结果间也存在一定差异(表2),进而加大对北极河流有机碳输出规律认识的难度。Tab. 2
表2
表2西伯利亚北极河流悬浮固体总量及输出有机碳数据统计(Tg/a)
Tab. 2
| 鄂毕河 | 叶尼塞河 | 勒拿河 | 来源文献 | |
|---|---|---|---|---|
| 流量站 | 萨列哈尔德 | 伊加尔卡 | 丘休尔 | [9] |
| 水质监测站 | 萨列哈尔德 | 杜金卡 | 日甘斯克 | |
| TSS | 17 | 5.9 | 18 | [39] |
| TOC | 3.5 | 4.7 | 6.7 | |
| DOC | 3.1~3.2 | 4.1~4.9 | 3.4~4.7 | [39] |
| 3.05 | 4.69 | 5.83 | [10] | |
| 4.118 | 4.644 | 5.681 | [9] | |
| POC | 0.31~0.6 | 0.17 | 0.47 | [39] |
新窗口打开|下载CSV
4 西伯利亚北极河流有机碳输出特征
4.1 河流有机碳输出的季节性
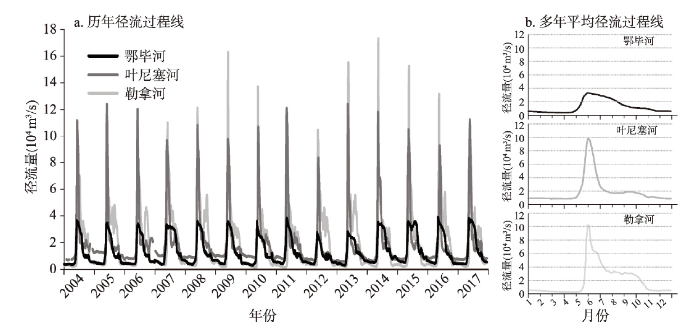
西伯利亚北极河流的径流量及有机碳输出具有明显的季节性[5]。2004—2017年径流数据显示,从5月起径流量迅速增加至径流高峰,全年径流输出集中在5—10月(图2)。图2
 新窗口打开|下载原图ZIP|生成PPT
图22004—2017年鄂毕河、叶尼塞河和勒拿河径流特征
Fig. 2Discharge of Ob, Yenisei and Lena rivers from 2004 to 2017
在对北极河流有机碳输出的季节性变化研究中,通常将一个水文年划分为春、夏、冬3个季节来加以分析[9, 42],包括:5—6月的春季洪水期(2个月);7—10月的夏季生物活动增多期(4个月);以及从11月开始至次年4月的冬季低流量期(6个月)[9]。西伯利亚北极河流的大规模有机碳输出始于春末夏初,并于5—6月期间达到峰值[10]。春、夏两季是北极河流DOC和POC主要输出季节,冬季有机碳输出量最低[5, 43]。
4.2 各流域河流有机碳输出的季节差异
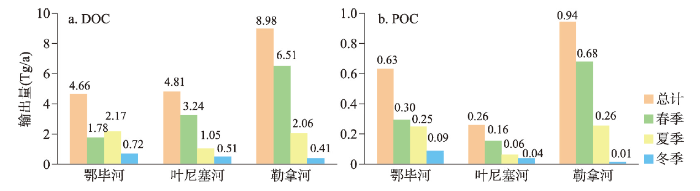
对西伯利亚3大流域而言,春、夏两季的有机碳输出占全年85%以上,叶尼塞河和勒拿河的有机碳输出高峰期为春季,而鄂毕河则春、夏两季有机碳贡献率相当,其有机碳输出高峰期略晚于东部的另外2条河流(图3)。图3
 新窗口打开|下载原图ZIP|生成PPT
图32004—2017年西伯利亚北极河流DOC、POC年均及各季节输出
Fig. 3Annual and seasonal output of DOC and POC in Arctic rivers in Siberia from 2004 to 2017
分别研究DOC与POC发现,由于来源不同(图2),二者输出浓度差异较大。例如,鄂毕河年均DOC输出4.66 Tg,超过POC(0.63 Tg)的7倍,其年均DOC输出浓度(9.83 mg/L)也同样高于POC(1.23 mg/L)。此外,河流有机碳输出浓度和通量的季节性特征也极为相似,比如,鄂毕河春、夏两季DOC输出浓度较为相近(10.3 mg/L和10.9 mg/L),而DOC输出通量在春季和夏季的贡献率也比较相似。但由于径流量的不同,部分地区有机碳输出浓度与通量的季节相似性也会受到影响,如鄂毕河的平均DOC输出浓度明显高于叶尼塞河,但由于叶尼塞河径流量相对较大,最终二者年均DOC输出通量较为相近。
整体而言,叶尼塞河的河流有机碳输出以春季为主,其贡献量约为夏季的3倍;勒拿河有机碳输出浓度处于三大流域中等水平,但因其2004—2017年期间较高的径流量,河流有机碳输出通量最大(DOC输出约8.98 Tg/a),约是鄂毕河和叶尼塞河之和,春季贡献率明显高于夏季,冬季输出极少。因此,通过季节性差异分析,发现河流有机碳输出浓度和径流量的大小共同决定着输出通量,而河流有机碳来源和径流量同时又影响着其输出浓度。
4.3 河流有机碳输出的年际特征
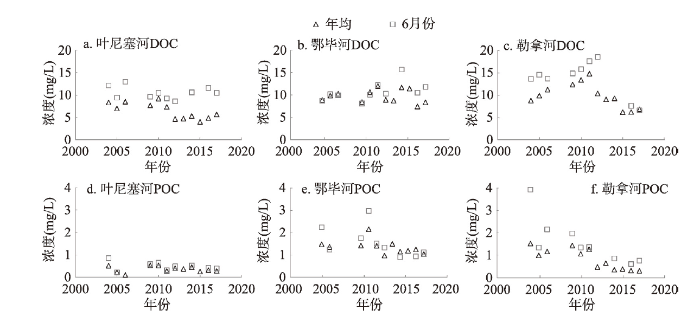
西伯利亚三大流域的有机碳输出明显高于北极其他河流[33],其DOC输出超过北极全部河流的一半[5, 7, 9, 43-44],而POC仅处在北极河流的中等水平(1.26~1.55 Tg/a)[32]。分析3条河流2004—2017年的年均有机碳输出浓度并与6月份对比,发现在不同的河流流经区域及多年冻土发育程度下,POC和DOC输出的年际变化规律不同,且各流域差异明显,6月份的河流有机碳输出浓度与全年趋势类似,但仍在个别年份或整体数值上存在不同(图4)。图4
 新窗口打开|下载原图ZIP|生成PPT
图42004—2017年西伯利亚北极河流有机碳输出浓度
Fig. 4Concentration of organic carbon output in Arctic rivers in Siberia from 2004 to 2017
2004—2017年期间各流域POC输出浓度均呈下降趋势,叶尼塞河明显低于另外2条河流(< 1 mg/L),而鄂毕河和勒拿河均在2012年呈现断阶式下降。据此推测,孤立和连续多年冻土相对发育的流域中POC更易随河流输出,且连续多年冻土发育的勒拿流域POC对环境变化更为敏感。对DOC而言,鄂毕河年均DOC浓度相对稳定(7.4~12 mg/L),但6月DOC浓度(8.1~15.7 mg/L)自2011年起有所增加。勒拿河DOC输出浓度以2012年为转折,先增后降,且历年来波动较大(6.18~14.76 mg/L),6月份DOC浓度普遍高于年均,但年际变化趋势相同。叶尼塞河6月份DOC浓度(8.6~13 mg/L)则几乎不变,而年均DOC浓度不仅略低于另外2条河流(4~9.2 mg/L),且在2012年后明显减少。对三大流域而言,DOC来源主要为现代陆相产物,但均不同程度的包括部分多年冻土活动层来源。因此,流域环境的不同及多年冻土发育程度的差异均使各流域DOC输出浓度具有明显的区域差异性,河流有机碳输出特征是各流域地下多年冻土发育与流域环境变化的综合作用结果。
4.4 不同季节河流有机碳输出的多年变化规律
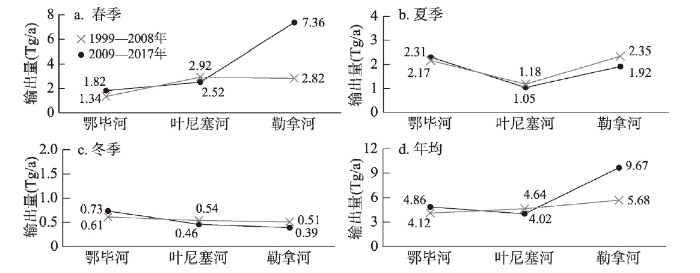
除季节性特征外,西伯利亚三大流域各季节的河流有机碳输出也随气候变暖,出现不同程度的变化。对比1999—2008年(数据来源于Holmes等[9])和2009—2017年(数据来源于ArcticGRO)数据(图5),发现鄂毕河DOC输出在各个季节均有所增加,年均DOC输出总量增长18%;叶尼塞河在春、夏、冬季的河流DOC输出均呈下降趋势,平均下降11%~15%;勒拿河流域则相对复杂,春季DOC输出明显增加,2009—2017年期间的年均春季DOC输出是1999—2008期间的2倍以上,而夏、冬两季均减少近1/3。整体看来,各流域年均DOC输出变化规律与春季较为一致,且对西伯利亚三大流域而言,河流有机碳输出变化特征具有区域性差异,如夏、冬两季,鄂毕河流域DOC输出呈增加趋势,而向东过渡到叶尼塞河和勒拿河流域,则表现为减少趋势。图5
 新窗口打开|下载原图ZIP|生成PPT
图5西伯利亚北极河流DOC输出特征对比
Fig. 5Comparison of DOC output characteristics of Arctic rivers in Siberia
整体而言,1999—2008年与2009—2017年间,鄂毕河、叶尼塞河和勒拿河的春季DOC输出从不到全年的一半增长至全年的63.03%(表3),且主要受勒拿河流域近十年春季河流DOC输出大幅提高的影响。此外,尽管不同流域春季有机碳贡献率和变化趋势各异,但随着气候变暖,春、冬河流DOC贡献比均有所提高,尤其是勒拿河流域。
Tab. 3
表3
表31999—2008年及2009—2017年西伯利亚北极河流季节性DOC输出
Tab. 3
| 河流 | 鄂毕河 | 叶尼塞河 | 勒拿河 | 总输出 | ||||||||
|---|---|---|---|---|---|---|---|---|---|---|---|---|
| 时段 | 1999—2008 | 2009—2017 | 1999—2008 | 2009—2017 | 1999—2008 | 2009—2017 | 1999—2008 | 2009—2017 | ||||
| DOC春(Tg/a) | 1.34 | 1.82↑ | 2.92 | 2.52↓ | 2.82 | 7.36↑ | 7.09 | 11.69↑ | ||||
| DOC夏(Tg/a) | 2.17 | 2.31↑ | 1.18 | 1.05↓ | 2.35 | 1.92↓ | 5.70 | 5.28↓ | ||||
| DOC冬(Tg/a) | 0.61 | 0.73↑ | 0.54 | 0.46↓ | 0.51 | 0.39↓ | 1.65 | 1.58↓ | ||||
| DOC总(Tg/a) | 4.12 | 4.86↑ | 4.64 | 4.02↓ | 5.68 | 9.67↑ | 14.44 | 18.55↑ | ||||
| DOC春/DOC冬 | 2.20 | 2.47↑ | 5.45 | 5.49↑ | 5.56 | 18.86↑ | 4.28 | 7.39↑ | ||||
| DOC春占比(%) | 32.49 | 37.36↑ | 62.96 | 62.59↓ | 49.69 | 76.11↑ | 49.06 | 63.03↑ | ||||
新窗口打开|下载CSV
5 西伯利亚北极河流有机碳输出的影响要素
5.1 径流过程
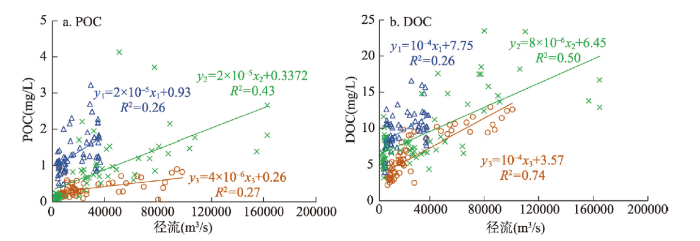
Holmes等证实春季融雪引起的径流增加会导致河流有机碳输出增多[9]。而西伯利亚3大流域2004—2017年径流与有机碳输出数据,再次证实河流DOC和POC浓度随径流量增加而增大的同时,存在一定区域差异(图6)。其中鄂毕河的有机碳浓度与径流线性关系最弱,表明除径流外,有机碳输出受其他因素影响较多,而叶尼塞河及勒拿河的径流与有机碳浓度间的线性相关更强,且叶尼塞河径流与DOC浓度的线性相关性最好(R2DOC ≈ 0.74),但与POC浓度的线性回归系数明显偏低,说明对于较大的流域而言,其大流量且长时间的搬运过程,一方面补充了河流有机碳,另一方面也加剧有机碳的分解和沉降[45]。图6
 新窗口打开|下载原图ZIP|生成PPT
图62004—2017年西伯利亚北极河流径流量与有机碳输出浓度的关系
Fig. 6Relationship between runoff and organic carbon output of Arctic rivers in Siberia from 2004 to 2017
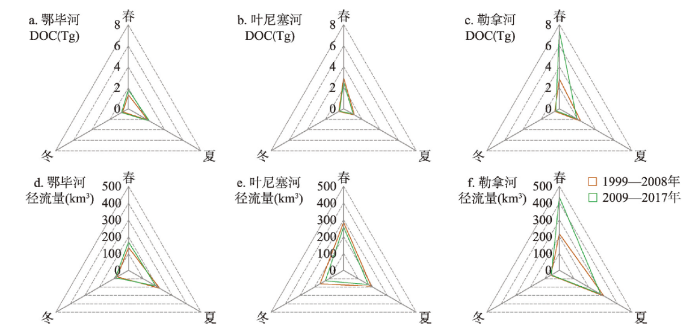
西伯利亚河流径流的季节性特征也影响着河流有机碳输出[29]。鄂毕河流域2009—2017年间的河流径流量略高于1999—2008年期间,夏季占比相对较多(图7a),河流DOC输出总量表现为相同趋势(图7d);相比之下,叶尼塞河2009—2017年间河流径流有所减少,春季占比相对较多(图7b),河流DOC输出总量不仅同步减少,但冬季河流径流量减少更为明显(图7e);勒拿河春季的河流径流量和DOC输出都表现为显著的增长,但夏季河流DOC输出随径流量减少而降低,冬季占比最低(图7c、7f)。因此,各流域有机碳输出的年际及季节性特征不同,但同一流域的河流有机碳输出与径流特征却表现出较为一致的趋势。
图7
 新窗口打开|下载原图ZIP|生成PPT
图71999—2008年及2009—2017年西伯利亚北极河流年均径流量及DOC输出
注:1999—2008年数据来自文献[9]。
Fig. 7Annual runoff and DOC output of Arctic rivers in Siberia in 1999-2008 and 2009-2017
5.2 冻融过程
西伯利亚地区广泛发育的多年冻土不仅储存大量有机碳[46],也是北极淡水及海洋生态系统中有机碳的重要来源[47]。Wild等通过研究西伯利亚河流2003—2013年的高时间分辨率碳同位素记录,发现西伯利亚河流总有机碳(TOC)的(17±8)%来源于多年冻土—泥炭层[5]。而多年冻土的存在,限制了径流对地表剥蚀作用的同时[7],也阻碍了DOC的深层迁移,使其在土壤及地表水体中富集[48]。随着全球气候变暖,多年冻土退化,活动层厚度加深,长期储存在多年冻土中的有机碳大量释放,并部分随河流径流输出至北冰洋[71]。河流径流量随流域内多年冻土的覆盖率增高而非线性增大,多年冻土覆盖率对河流径流的影响甚至远超过降水量[14]。因此高纬度多年冻土的融化不仅影响河流径流过程[29],也影响河流有机碳输出[49,50]。Fabre等研究表明,不同类型多年冻土对河流有机碳输出有着不同程度的影响,且对不同类型有机碳而言,起主导作用的多年冻土类型有所不同[7]。例如,河流POC输出主要受控于孤立多年冻土,而不连续多年冻土的贡献率相对较低,仅为4.2%。根据模型预测,到2050年北极地区的多年冻土面积将减少13%~28%[51]。因此,深入研究多年冻土区的有机碳来源及运输路径,对判断气候变化对多年冻土及河流有机碳的影响具有重要意义。
5.3 人类活动
人类活动对北极地区环境的影响包括人类的资源利用和污染排放[38]。水坝建设、水库调节和其他人类活动导致的河流径流模式变化[14, 31],间接影响着河流有机碳输出等。西伯利亚3大流域中,鄂毕河流域人口密度最大(表1),社会经济发展程度最高,该流域河水中溶解无机氮(DIN)和总溶解磷(TDP)含量明显较高[9],且与其他河流不同,鄂毕河径流量与有机碳浓度之间不具有明显的线性关系(图6)。
此外,Raymond等发现,尽管北极河流有机碳随径流输出具有相似的季节性特征,但鄂毕河流域的径流及有机碳输出季节性波动相对较弱,极有可能是流域上游的水坝及湖泊影响了河流的天然径流过程[10]。而在对2004—2017年三大流域的径流研究中,也发现了同样的特征(图2)。Yang等证实在鄂毕河流域上游地区,农业和工业用水以及为削减夏季洪峰的水库人为调节使夏季径流明显减少,而冬季放水发电又导致鄂毕河上游冬季径流增加[21]。
同时,在频繁进行核武器试验的20世纪50年代,流域内的大气CO2浓度达到高峰,同时期流域内的河流输出有机碳中14C也相对富集[38]。因此,相对于气候因素,人类活动对区域碳循环的影响可能更为重要和直接[21]。
5.4 其他要素
有研究表明,气候变暖不是影响河流有机碳输出的唯一控制因素[52]。Vaks等认为古地理环境、夏季日照强度、北冰洋海面温度及海冰等均可对多年冻土分布带来影响,进而影响流域的有机碳输出及储存条件[52];Semiletov等通过研究北冰洋淡水水量平衡发现,勒拿河流域径流的季节性变化与净降水量的变化趋势相同[53],Callaghan等的研究发现,北极陆地径流输入主要是融雪径流[54],且受气温及融雪过程的影响明显,而径流与河流有机碳(尤其是DOC)输出特征相对一致,因此温度和降水也是影响北极河流有机碳输出的重要因素;此外,由于河流有机碳的搬运受到地表及地下不同环境要素影响,部分有机碳(约10%~50%的POC和3%~35%的DOC)由于在搬运过程中不断发生矿化、降解而处于不稳定状态,甚至发生POC与DOC间的相互转化[55],影响着河流有机碳的输出;同时,北极河流有机碳还与流域土壤有机碳含量直接相关[56],也明显受到地形坡度等的控制作用,例如,坡度通过影响地表径流的展布特征、与土壤接触范围及停留时间,决定着冲刷剥蚀和淋滤过程,进而影响径流水体中DOC与POC的浓度[57]。综上,西伯利亚北极河流有机碳输出的时空特征复杂,北冰洋海冰、夏季日照强度、土壤有机碳含量及流域气温、降水、坡度、水动力强度等各流域沉积环境特征均可对河流有机碳输出过程产生影响[1, 52]。
6 结论
西伯利亚北极河流有机碳输出是全球碳循环的重要一环,且间接反映各环境要素对全球气候增暖的响应。研究全球变暖背景下的北极河流有机碳输出,有利于揭示其与北极环境变化的关系,增强对北极地区碳循环的认识,为科学应对气候变暖提供依据。鄂毕河、叶尼塞河和勒拿河流域的有机碳输出特征明显不同且具有季节性特征,主要受气候、径流过程、冻融过程及人类活动等环境要素的影响。春、夏两季为河流有机碳输出的主要时期,而不同河流有机碳输出的季节特征存在差异。随着气候变暖,三大河流DOC输出与径流变化呈显著正相关,同时,因多年冻土类型和发育程度不同对河流有机碳输出的影响有所差异。此外,与北极气温、降水等气象要素不同,河流有机碳数据的获取不仅受地域限制,还由于高纬度河流的冬季冻结,导致数据获取在时间上的局限性。因此,河流有机碳输出在时间和空间上具有极强的变异性,进而取样时间和地点对研究结果至关重要,西伯利亚河流有机碳输出的研究仍需更多科学数据的支撑和更为深入的定量化表征。
当然,已有诸多研究证实,西伯利亚北极河流有机碳输出随气候变暖而不断变化。因此,在分析北极河流有机碳输出的同时,需加深对河流有机碳与多年冻土、径流、植被等各环境要素的定量关系分析,为气候变暖条件下北极地区的资源合理利用及环境保护提供科学评价及建议。
致谢:
中国科学院地理科学与资源研究所朱秉启研究员在本文修改与完善过程中所给予的宝贵建议。参考文献 原文顺序
文献年度倒序
文中引用次数倒序
被引期刊影响因子
DOI:10.1029/95GB02925URL [本文引用: 11]
DOI:10.1038/s41558-018-0339-yURL [本文引用: 1]
DOI:10.1038/nature09051PMID:20428168 [本文引用: 1]

The rise in Arctic near-surface air temperatures has been almost twice as large as the global average in recent decades-a feature known as 'Arctic amplification'. Increased concentrations of atmospheric greenhouse gases have driven Arctic and global average warming; however, the underlying causes of Arctic amplification remain uncertain. The roles of reductions in snow and sea ice cover and changes in atmospheric and oceanic circulation, cloud cover and water vapour are still matters of debate. A better understanding of the processes responsible for the recent amplified warming is essential for assessing the likelihood, and impacts, of future rapid Arctic warming and sea ice loss. Here we show that the Arctic warming is strongest at the surface during most of the year and is primarily consistent with reductions in sea ice cover. Changes in cloud cover, in contrast, have not contributed strongly to recent warming. Increases in atmospheric water vapour content, partly in response to reduced sea ice cover, may have enhanced warming in the lower part of the atmosphere during summer and early autumn. We conclude that diminishing sea ice has had a leading role in recent Arctic temperature amplification. The findings reinforce suggestions that strong positive ice-temperature feedbacks have emerged in the Arctic, increasing the chances of further rapid warming and sea ice loss, and will probably affect polar ecosystems, ice-sheet mass balance and human activities in the Arctic.
DOI:10.1038/s41561-019-0526-0URL [本文引用: 2]
DOI:10.1073/pnas.1811797116URL [本文引用: 12]
DOI:10.1002/jgrg.v122.8URL [本文引用: 3]
DOI:S0043-1354(19)30326-4PMID:31022529 [本文引用: 8]
The export of organic carbon export by the rivers to the oceans either as particulate organic carbon (POC) or dissolved organic carbon (DOC) is very sensitive to climate change especially in permafrost affected catchments where soils are very rich in organic carbon. With global warming, organic carbon export in both forms is expected to increase in Arctic regions. It should affect contemporary biogeochemical cycles in rivers and oceans and therefore modify the whole food web. This study tries to understand complex processes involved in sediment, POC and DOC riverine transport in the Yenisei River basin and to quantify their respective fluxes at the river outlet. The SWAT (Soil and Water Assessment Tool) hydrological model is used in this study to simulate water and suspended sediment transfers in the largest Arctic river. POC and DOC export have been quantified with empirical models, adapted from literature for the study case. First, the hydrological model has been calibrated and validated at a daily time step for the 2003-2008 and the 2009-2016 periods respectively, and its output has been compared with field data for water and sediment fluxes. Based on conceptualization of transfer processes, calibration on climate and soil properties has been performed in order to correctly represent hydrology and sediment transfer in permafrost basins. Second, calibration of empirical models for DOC/POC transport have been performed by comparing their output with field data, available from 2003 to 2016. Our study reveals that SWAT is capable of correctly representing hydrology, sediment transfer, POC and DOC fluxes and their spatial distribution at a daily timescale, and outlines the links between these fluxes and permafrost features. Our simulation effort results in specific sediment, POC and DOC fluxes of 2.97?t?km yr, 0.13?t?km yr and 1.14?t?km yr for the period 2003-2016 which are in the range of previous estimates. About 60% of the total fluxes of sediment, DOC and POC to the Arctic Ocean are exported during the two months of the freshet. Spatial analysis show that permafrost-free areas have returned higher daily organic carbon export than permafrost affected zones, highlighting the thawing permafrost effect on carbon cycle in climate change feedback.Copyright ? 2019 Elsevier Ltd. All rights reserved.
DOI:10.3402/tellusa.v33i2.10706URL [本文引用: 1]
DOI:10.1007/s12237-011-9386-6URL [本文引用: 17]
URL [本文引用: 3]
URL [本文引用: 2]
[本文引用: 1]
[本文引用: 1]
DOI:10.1038/s41558-019-0614-6 [本文引用: 1]
Extensive degradation of near-surface permafrost is projected during the twenty-first century(1), which will have detrimental effects on northern communities, ecosystems and engineering systems. This degradation is predicted to have consequences for many processes, which previous modelling studies have suggested would occur gradually. Here we project that soil moisture will decrease abruptly (within a few months) in response to permafrost degradation over large areas of the present-day permafrost region, based on analysis of transient climate change simulations performed using a state-of-the-art regional climate model. This regime shift is reflected in abrupt increases in summer near-surface temperature and convective precipitation, and decreases in relative humidity and surface runoff. Of particular relevance to northern systems are changes to the bearing capacity of the soil due to increased drainage, increases in the potential for intense rainfall events and increases in lightning frequency. Combined with increases in forest fuel combustibility, these are projected to abruptly and substantially increase the severity of wildfires, which constitute one of the greatest risks to northern ecosystems, communities and infrastructures. The fact that these changes are projected to occur abruptly further increases the challenges associated with climate change adaptation and potential retrofitting measures.
DOI:10.1007/s11430-018-9383-6URL [本文引用: 5]
DOI:10.1016/j.gca.2018.10.024URL [本文引用: 2]
DOI:10.1029/JZ071i018p04305URL [本文引用: 1]
[本文引用: 2]
DOI:10.1007/s13280-011-0214-9URL [本文引用: 2]
DOI:10.1002/jgrg.v121.3URL [本文引用: 1]
DOI:10.1016/j.earscirev.2019.04.023 [本文引用: 1]
Permafrost is a key element of the cryosphere and an essential climate variable in the Global Climate Observing System. There is no remote-sensing method available to reliably monitor the permafrost thermal state. To estimate permafrost distribution at a hemispheric scale, we employ an equilibrium state model for the temperature at the top of the permafrost (TTOP model) for the 2000-2016 period, driven by remotely-sensed land surface temperatures, down-scaled ERA-Interim climate reanalysis data, tundra wetness classes and landcover map from the ESA Landcover Climate Change Initiative (CCI) project. Subgrid variability of ground temperatures due to snow and landcover variability is represented in the model using subpixel statistics. The results are validated against borehole measurements and reviewed regionally. The accuracy of the modelled mean annual ground temperature (MAGT) at the top of the permafrost is +/- 2 degrees C when compared to permafrost borehole data. The modelled permafrost area (MAGT < 0 degrees C) covers 13.9 x 10(6) km(2) (ca. 15% of the exposed land area), which is within the range or slightly below the average of previous estimates. The sum of all pixels having isolated patches, sporadic, discontinuous or continuous permafrost (permafrost probability > 0) is around 21 x 10(6) km(2) (22% of exposed land area), which is approximately 2 x 10(6) km(2) less than estimated previously. Detailed comparisons at a regional scale show that the model performs well in sparsely vegetated tundra regions and mountains, but is less accurate in densely vegetated boreal spruce and larch forests.
DOI:10.1175/1525-7541(2004)005<0595:DCACOT>2.0.CO;2URL [本文引用: 3]
DOI:10.1038/NCLIMATE3262 [本文引用: 1]
Permafrost, which covers 15 million km(2) of the land surface, is one of the components of the Earth system that is most sensitive to warming(1,2). Loss of permafrost would radically change high-latitude hydrology and biogeochemical cycling, and could therefore provide very significant feedbacks on climate change(3-8). The latest climate models all predict warming of high-latitude soils and thus thawing of permafrost under future climate change, but with widely varying magnitudes of permafrost thaw(9,10). Here we show that in each of the models, their present-day spatial distribution of permafrost and air temperature can be used to infer the sensitivity of permafrost to future global warming. Using the same approach for the observed permafrost distribution and air temperature, we estimate a sensitivity of permafrost area loss to global mean warming at stabilization of 4.0(-1.1)(+1.0) million km(2) degrees C-1 (1 sigma confidence), which is around 20% higher than previous studies(9). Our method facilitates an assessment for COP21 climate change targets(11): if the climate is stabilized at 2 degrees C above pre-industrial levels, we estimate that the permafrost area would eventually be reduced by over 40%. Stabilizing at 1.5 degrees C rather than 2 degrees C would save approximately 2 million km(2) of permafrost.
The Freshwater Budget of the Arctic Ocean.
[本文引用: 1]
DOI:10.1080/10889379909377670URL [本文引用: 2]
DOI:http://www.geog.com.cn/article/2021/0375-5444/10.1038/srep24784URLPMID:27095029 [本文引用: 1]
Boreal and subarctic peatlands are an important dynamical component of the earth system. They are sensitive to climate change, and could either continue to serve as a carbon sink or become a carbon source. Climatic thresholds for switching peatlands from sink to source are not well defined, and therefore, incorporating peatlands into Earth system models is a challenging task. Here we introduce a climatic index, warm precipitation excess, to delineate the potential geographic distribution of boreal peatlands for a given climate and landscape morphology. This allows us to explain the present-day distribution of peatlands in Western Siberia, their absence during the Last Glacial Maximum, their expansion during the mid-Holocene, and to form a working hypothesis about the trend to peatland degradation in the southern taiga belt of Western Siberia under an RCP 8.5 scenario for the projected climate in year 2100.
DOI:10.1126/science.266.5186.753URL [本文引用: 1]
DOI:10.1016/j.gca.2012.07.015URL [本文引用: 2]
DOI:10.1016/j.gca.2019.04.015 [本文引用: 3]
The Yenisei River has the highest annual discharge of all the rivers draining into the Arctic Ocean and therefore any change in the chemical flux composition could have a profound effect on the nutrient input to the ocean. The hydrological cycle of this region is predicted to change because of changing precipitation patterns and thawing permafrost. By studying the seasonal changes in the geochemistry of the river, information on which end-member sources are important under different hydrological conditions can be gained and therefore provide a basis to model future change. In this study we present a 7-month time-series of water chemistry samples collected at Igarka near the mouth of the Yenisei. We investigate seasonal variation in major cation chemistry, radiogenic Sr (Sr-87/Sr-86), stable Li (delta Li-7) and stable Mg (delta(26)mg) isotopes. Temporal variation in major cation chemistry was consistent with seasonal changes in the relative contribution of end-members previously identified from smaller rivers in this region: snow, shallow soil (organic layer and leaf litter) and deeper soil/groundwater. Temporal variation in Sr-87/Sr-86 values, a source tracer, was also broadly consistent with seasonal changes in the contribution of the aforementioned end-members to river chemistry. However, an additional contribution from atmospheric dust, which is a minor component of major cation fluxes, is required to account for the observed increase in Sr-87/Sr-86 values during the spring flood. Variations in Li isotopes are observed, with lower values during spring flood. Although there is a relationship between Sr-87/Sr-86 and delta Li-7, the variation in delta Li-7 values is unlikely to be due to changes in source inputs. Rather, they are consistent with decreased isotope fractionation during high discharge as a result of the short water residence time inhibiting processes known to fractionate Li isotopes such as adsorption and secondary mineral formation. The seasonal variation in delta Mg-26 values is negligible, but the inter-annual variation observed between 2012 and 2015 may be due to changes in permafrost extent. (C) 2019 Elsevier Ltd.
DOI:http://www.geog.com.cn/article/2021/0375-5444/10.1029/2004JD004583URL [本文引用: 3]
DOI:10.1016/j.polar.2014.02.001URL [本文引用: 1]
URL [本文引用: 2]
DOI:10.1007/s10712-019-09536-wURL [本文引用: 4]
DOI:10.1038/nature14338PMID:25855454 [本文引用: 3]
Large quantities of organic carbon are stored in frozen soils (permafrost) within Arctic and sub-Arctic regions. A warming climate can induce environmental changes that accelerate the microbial breakdown of organic carbon and the release of the greenhouse gases carbon dioxide and methane. This feedback can accelerate climate change, but the magnitude and timing of greenhouse gas emission from these regions and their impact on climate change remain uncertain. Here we find that current evidence suggests a gradual and prolonged release of greenhouse gas emissions in a warming climate and present a research strategy with which to target poorly understood aspects of permafrost carbon dynamics.
[本文引用: 1]
[本文引用: 1]
URL [本文引用: 1]
DOI:10.1146/annurev.earth.36.031207.124300URL [本文引用: 1]
DOI:10.1002/2015GB005351URL [本文引用: 1]
URL [本文引用: 3]
DOI:10.1016/S0304-4203(03)00105-1URL [本文引用: 8]
DOI:10.1016/S0016-7037(00)00409-9URL [本文引用: 1]
URL [本文引用: 1]
DOI:10.1016/j.watres.2019.05.082URL [本文引用: 1]
DOI:10.1021/es202068bURL [本文引用: 2]
DOI:10.1134/S1028334X18060077URL [本文引用: 1]
DOI:10.1016/j.scitotenv.2018.02.152URL [本文引用: 1]
DOI:10.5194/bg-11-6573-2014URL [本文引用: 1]
DOI:10.1016/j.scitotenv.2004.12.059URL [本文引用: 1]
DOI:10.1002/hyp.v23:1URL [本文引用: 1]
DOI:10.1002/grl.v45.3URL [本文引用: 1]
DOI:10.1016/j.scitotenv.2010.06.056URL [本文引用: 1]
[D].
[本文引用: 1]
[D].
[本文引用: 1]
DOI:10.1038/s41586-019-1880-1PMID:31915398 [本文引用: 3]
Climate change in the Arctic is occurring rapidly, and projections suggest the complete loss of summer sea ice by the middle of this century. The sensitivity of permanently frozen ground (permafrost) in the Northern Hemisphere to warming is less clear, and its long-term trends are harder to monitor than those of sea ice. Here we use palaeoclimate data to show that Siberian permafrost is robust to warming when Arctic sea ice is present, but vulnerable when it is absent. Uranium-lead chronology of carbonate deposits (speleothems) in a Siberian cave located at the southern edge of continuous permafrost reveals periods in which the overlying ground was not permanently frozen. The speleothem record starts 1.5 million years ago (Ma), a time when greater equator-to-pole heat transport led to a warmer Northern Hemisphere. The growth of the speleothems indicates that permafrost at the cave site was absent at that time, becoming more frequent from about 1.35?Ma, as the Northern Hemisphere cooled, and permanent after about 0.4?Ma. This history mirrors that of year-round sea ice in the Arctic Ocean, which was largely absent before about 0.4?Ma (ref. ), but continuously present since that date. The robustness of permafrost when sea ice is present, as well as the increased permafrost vulnerability when sea ice is absent, can be explained by changes in both heat and moisture transport. Reduced sea ice may contribute to warming of Arctic air, which can lead to warming far inland. Open Arctic waters also increase the source of moisture and increase autumn snowfall over Siberia, insulating the ground from low winter temperatures. These processes explain the relationship between an ice-free Arctic and permafrost thawing before 0.4?Ma. If these processes continue during modern climate change, future loss of summer Arctic sea ice will accelerate the thawing of Siberian permafrost.
[本文引用: 1]
DOI:10.1007/s13280-011-0215-8URL [本文引用: 1]
URL [本文引用: 1]
[本文引用: 1]
DOI:10.1029/94GB02311URL [本文引用: 1]
