 ,1,2, 雷玮倩1, 许刚3, 徐智邦1, 周正梓1,4
Urban scaling and the spatio-temporal characteristics of scaling exponents in China
JIAO Limin,1,2, LEI Weiqian1, XU Gang3, XU Zhibang1, ZHOU Zhengzi1,4收稿日期:2019-08-6修回日期:2020-07-7网络出版日期:2020-12-25
| 基金资助: |
Received:2019-08-6Revised:2020-07-7Online:2020-12-25
| Fund supported: |
作者简介 About authors
焦利民(1977-), 男, 河南安阳人, 教授, 博士生导师, 研究方向为城市化与国土空间优化、地理空间分析和数据挖掘。E-mail:

摘要
关键词:
Abstract
Keywords:
PDF (5098KB)元数据多维度评价相关文章导出EndNote|Ris|Bibtex收藏本文
本文引用格式
焦利民, 雷玮倩, 许刚, 徐智邦, 周正梓. 中国城市标度律及标度因子时空特征. 地理学报[J], 2020, 75(12): 2744-2758 doi:10.11821/dlxb202012014
JIAO Limin, LEI Weiqian, XU Gang, XU Zhibang, ZHOU Zhengzi.
1 引言
经济发展推动人口持续向城市集聚。如今全球有55%的人口居住在城市,预计2050年将达68%[1]。城市被认为是人类活动,尤其是创造力产生的主要场所[2],全球城市化趋势对城市定量研究和可持续发展提出了迫切的挑战[3]。作为世界人口第一大国、第二大经济体的发展中国家,中国城镇化在几十年进程中得到了迅速而显著的发展。至2017年,中国城市化率由1980年的19.36%增加到了57.96%,预计2030年将达68.7%[4]。持续的快速城市化也为中国城市发展带来了诸多城市问题,特大城市和城市群持续扩张、人口快速增长与资源环境综合承载力约束之间的矛盾不断加剧[5,6],区域与区域之间、区域内城市单元经济社会发展水平、公共资源配置等不平衡现象愈发显著。目前,中国正处于注重高质量发展和以人为本的新型城镇化阶段[7],城市人口规模是社会经济、基础设施强度以及城市的知识生产活动的重要决定因素[3, 8-10],了解城市系统内不同要素随城市人口的增加如何发展以及协调二者的关系对中国城市可持续发展至关重要。在城市扩张过程中,诸多城市要素与城市人口规模存在着非线性关系,这种定量关系可用幂函数Y(t) = Y0N(t)β表示。其中,β被称为标度因子(Scaling Exponent),其与1的大小关系能反映要素Y(t)与城市人口规模N(t)之间的关系。城市标度律(Urban Scaling Laws)关注了不同历史、地理、文化、体制下城市所表现出的共同性质[2],并在不同国家和地区的研究中均被证实[11,12,13,14]。更有研究表明,城市标度律不仅适用于现代文明城市,在历史聚落研究中也同样被证实[15,16],这意味着标度律基本适用于每一个城市系统,且与城市地理位置、文化、经济发展程度等因素无关[11]。
尽管标度律在不同国家城市系统及时间尺度上呈现出一致性规律,目前学界关于标度律的普适性也有一定争议,主要归结为以下3个方面:① 不同城市范围内标度律的不稳健性[17,18,19];② 双对数下线性回归模型的适用性[20];③ 城市要素与人口规模间的标度因子受宏观经济结构[21]、公共政策[22]等其他外部条件影响。现有研究多针对发达国家,城市要素选择也多局限在GDP、用地面积、路网、专利等少数指标。作为快速城市化的发展中国家,采用广泛多样的指标研究中国城市系统的标度律是重要的科学问题。
尽管国外****对标度律开展了大量的研究,国内却少有对中国城市标度律进行系统性的研究,且已有研究主要针对建成区面积等指标[23,24,25,26],缺乏对更多城市要素的关注。了解广泛多样的城市要素与人口规模之间的标度关系、从时空维度探究标度因子的演化规律及特点能够丰富对城市标度律的认识,科学认清城市发展规律进而合理优化资源配置。作为典型的快速城市化国家,中国城市发展是否符合标度律?城市要素标度因子在空间与时间上有何特征?亟待进一步探索并揭示。
本文采用中国275个地级及以上城市数据,探究标度律在中国城市系统中的适用性及城市要素与人口规模的标度关系,结合区域发展特征,从时空维度探究标度因子的时空演化规律,以期为认知快速城市化地区城市系统标度特征及演化规律提供理论依据,为城市发展决策提供支持。
2 数据与方法
2.1 研究区
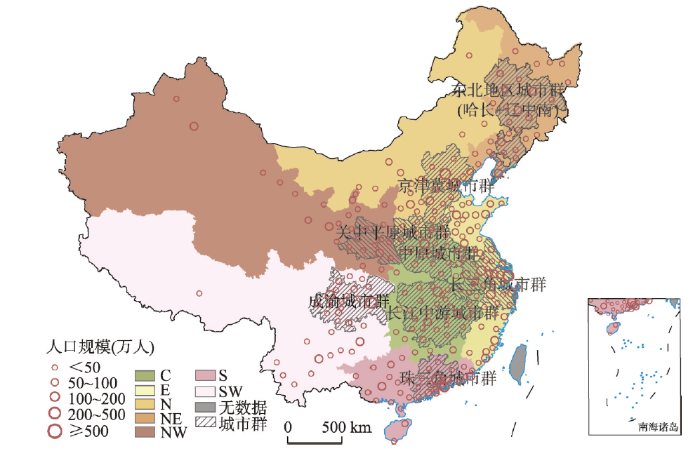
地级市是中国重要行政单元,地级市内还存在多个县/市及大量的非城市化地区,相对而言市辖区城市化率普遍较高,且二三产业所占比重较高[18],更能够代表“城镇化地区”。为了数据的一致性与可比性,本文选择275个地级以上城市市辖区为研究单元。为研究标度因子的地区差异,本文对全国进行了典型区域和城市群划分。参考省份地理位置分布与经济发展水平,划分华北(N)、东北(NE)、华东(E)、华中(C)、华南(S)、西南(SW)与西北(NW)七大区域(图1)。国内外的相关研究对城市群的概念和空间范围有不同的界定[27],本文参考《中华人民共和国国民经济和社会发展第十三个五年(2016—2020年)规划纲要》,提取八大城市群作为典型城市群分析单元。城市群的范围以国务院批复的城市群规划范围为主,未批复的城市群范围界定主要参考《2016中国城市群发展报告》[28]。
图1
 新窗口打开|下载原图ZIP|生成PPT
图12016年中国275个地级城市人口规模及区域与城市群划分
注:基于自然资源部标准地图服务网站审图号为2016(2556)号的标准地图制作,底图无修改。
Fig. 1The spatial distribution of urban population of 275 prefecture-level cities and the division of regions and urban agglomerations in China in 2016
2.2 数据来源
常住人口比户籍人口更能反映市辖区实际人口规模[18, 29],本文“城市人口”定义为城市市辖区常住人口(万人),即《中国城市建设统计年鉴》城区人口与暂住人口之和,更接近真实城市规模,其余城市要素统计范围皆限定为市辖区。收集《中国城市统计年鉴》(2001—2017年)、《中国城市建设统计年鉴》(2006—2016年)及《中国城市建设统计年报》(2000—2005年)地级以上城市人口及城市要素数据,剔除不完整数据以及因行政区划变更导致的突变数据,并用地方统计年鉴数据修正,确定275个城市样本。港澳台地区由于数据缺失原因,不纳入本文研究范围。2.3 标度律
标度律起源于生物学领域的Kleiber定律——生物体体积与其新陈代谢率间存在3/4幂函数关系,表明质量越大的生物体,单位质量单位时间消耗能量越低[30]。Bettencourt等[2]多位研究者逐渐将该概念引入城市研究中,将城市比作“生命系统”或“生物体”,将城市人口规模和城市指标视为“生物体质量”和“新陈代谢”。各城市指标与城市人口规模间的非线性关系可概括为城市标度律,其函数形式为:式中:Y(t)表示城市范围内各要素(建成区面积、GDP等)的度量;i代表整个城市系统内的不同城市;N(t)为时间t时城市人口规模;Y0为标准化常量;β为标度因子。
根据标度因子与1的关系可将标度律分为以下3种情况[2, 31]:β ≈ 1,描述与个人需求相关的变量(如就业岗位、住房数量、家庭用水量等),与城市人口规模呈线性关系;β ≈ 0.85 < 1,描述与基础设施建设相关的变量,与城市人口规模呈次线性关系,表明从小城市到大城市,要素增加率小于人口增加率,这是因为在大城市有更多居民共同享有城市基础设施,体现了城市要素的规模经济;β ≈ 1.15 > 1,描述与社会交互相关的变量(如GDP、知识产出、疾病、犯罪等),与城市人口规模呈超线性关系,表明从小城市到大城市,要素增加率大于人口增长率,体现了城市要素的规模报酬递增效应。
对式(1)取双对数后,采用最小二乘法(OLS)得到回归方程:
考虑到统计数据质量可能会对实证结果产生一定的影响,进行回归分析时采用残差平均值正负两倍标准差剔除异常值。首先对人口及城市要素取双对数进行线性回归拟合,得到斜率β及截距logY0,并用实际值减去预期值得到残差
若logYi(t)在残差平均值正负两倍标准差范围外,则视其为异常值,予以剔除。剔除异常值后再根据保留的数据重新拟合,得到标度因子β及拟合优度R2。
3 结果分析
3.1 中国城市要素的标度律
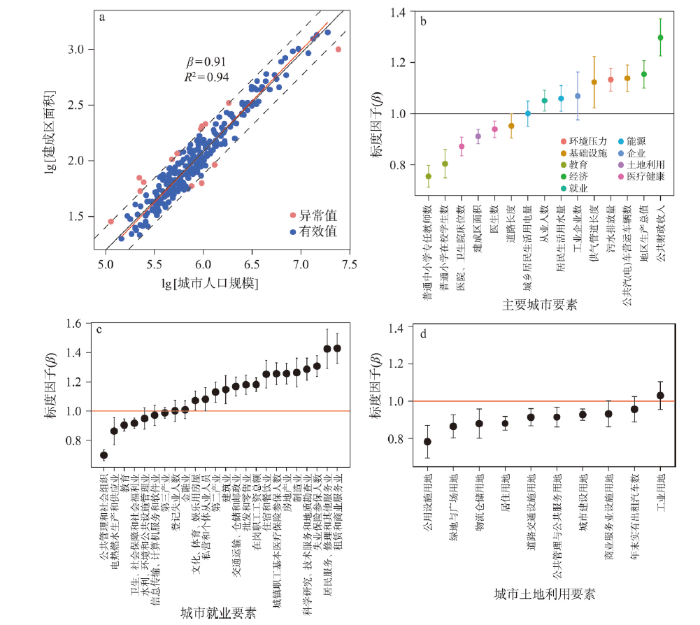
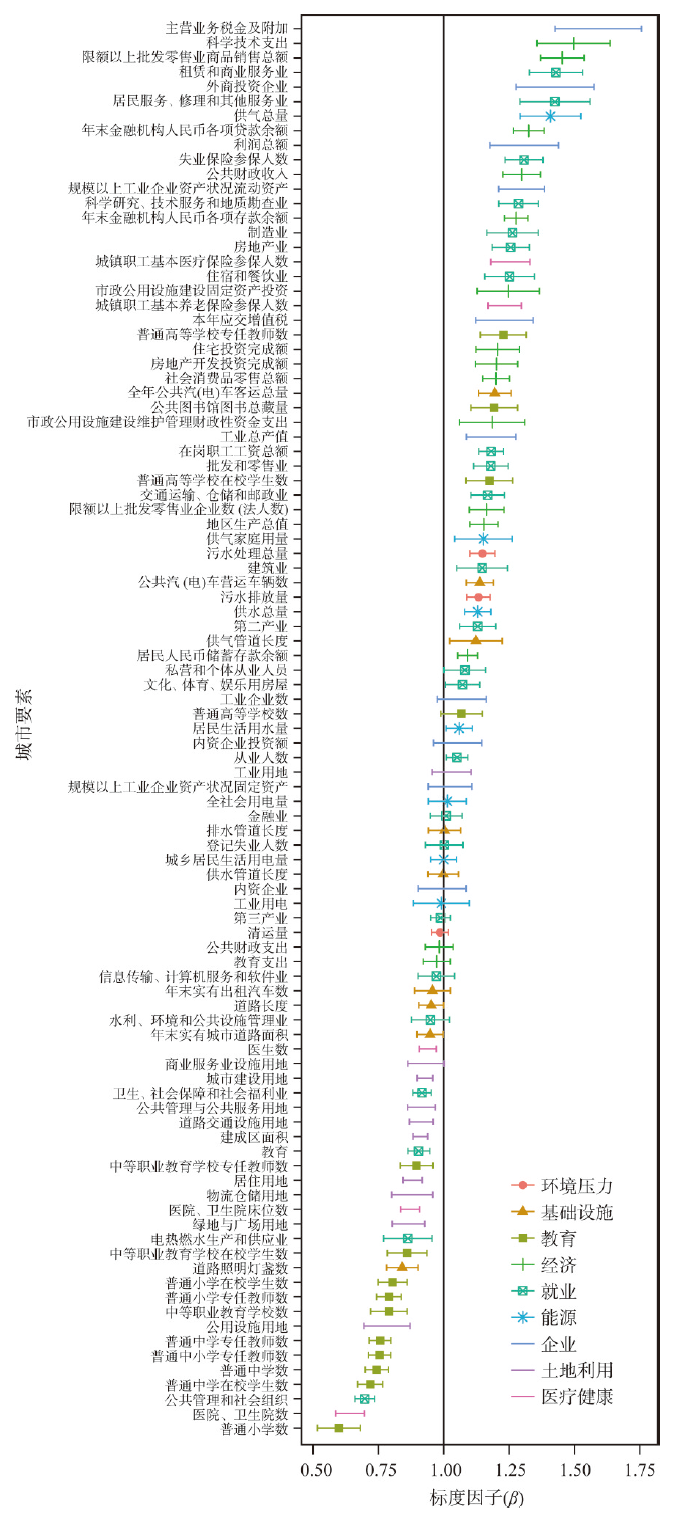
采用两倍标准差剔除异常值,然后再进行标度律拟合。以2016年建成区面积与城市人口规模为例(图2a),落在残差平均值正负两倍标准差区间内(虚线)的值为有效值(即蓝色点),红色点为区间外值(异常值),予以剔除。本文首先以2016年的数据为主讨论城市标度律拟合结果和区域分异,然后再讨论标度因子的年度变化。根据有效值进行拟合,得到建成区面积标度因子β为0.91,拟合优度R2为0.94,拟合情况较好。根据此方法最终归纳出9大类共96个城市要素与人口规模的标度律关系(图3),平均拟合优度R2为0.77,表明标度律能较好描述中国城市要素与人口规模关系。需要说明的是,第一产业及采矿业从业人数等城市要素受限于自然资源禀赋,与城市人口规模无关,不符合标度关系,未纳入本研究范围。图2
 新窗口打开|下载原图ZIP|生成PPT
图22016年中国城市要素的标度律
Fig. 2Urban scaling in China in 2016
图3
 新窗口打开|下载原图ZIP|生成PPT
图32016年中国城市96个要素的标度因子
Fig. 3Urban scaling exponent of 96 indicators in China in 2016
本文选取15个具有代表性的主要城市要素进行标度律分析(图2b),其结果基本符合Bettencourt总结的3类范围[2]:β < 1:普通中小学专任教师数、普通小学在校学生数、医院卫生院床位数、建成区面积、医生数、道路长度;β = 1:城乡居民生活用电量;β > 1:从业人数、居民生活用水量、工业企业数、供气管道长度、污水排放量、公共汽(电)车营运车辆数、地区生产总值(GDP)及公共财政收入。
中国城市建成区面积与人口规模呈次线性关系(β = 0.91),从小城市到大城市,土地增加率小于人口增加率,大城市土地利用规模经济较显著。部分基础设施要素(供气管道长度、公共汽车营运车辆数等)与人口规模呈超线性(β > 1),此类公共资源多向大城市聚集,未能体现基础设施的规模经济,反映了处于快速城市化进程中的国家,大中小城市在部分基础设施和公共服务方面发展不平衡,大城市更具比较优势。居民生活用水量与人口规模呈弱超线性关系(β = 1.06),发展中国家大城市居民生活条件更优越,人均生活用水量也越多。GDP、工业企业数等与社会经济发展相关的要素β与理论预期一致(β > 1),随城市规模的扩大,大城市无论是正向的(如GDP、公共财政收入)或负向的(如污水排放量)社会产出也相应增加。
中国城市就业要素中(图2c),公共管理和社会组织部门从业人数在大城市中分布较少(β = 0.70),而租赁和商业服务业及居民服务(β = 1.43)、修理和其他服务业从业人员(β = 1.43)在大城市分布比例最高。教育行业从业人数增加率小于人口(β = 0.90),即教师人数相对较少,尤其是普通中小学专任教师数更少,师资力量的短缺不可避免会带来教育资源数量与质量的激烈竞争,大城市教育资源“供不应求”、适龄儿童入学难等问题依然严峻。金融业从业人数与城市规模近似呈线性关系(β = 1.01),中国金融业发展起步较晚,基础较薄弱,大城市金融功能未得到充分体现,金融业还处于初级发展阶段,未来还有较大的成长空间。
土地利用方面(图2d),除工业用地外,中国建设用地与其余城市用地类型面积均与人口呈次线性关系(β < 1),且公用设施用地与人口规模的标度因子最小(β = 0.78),其用地增加率远低于人口,用地趋于节约集约化。工业用地与人口呈超线性增长(β = 1.03),这主要是由于中国当前正处于工业化中后期阶段,中西部地区工业化快速发展,工业用地面积快速增加,从小城市到大城市,工业用地增加率大于人口增加率。
从图3可以看出,除个别就业指标外,位于β = 1指示线左侧均为教育、医疗健康、土地利用等指标,反映了基础设施指标的规模经济,大城市的基础设施共享率更高。位于β = 1指示线右侧主要是经济、企业等反映集聚效应的指标。值得一提的是,小学数与医院、卫生院数标度因子最小,远低于理论值0.85,这可能有以下两点原因:一是大城市学校和医院的规模更大,二是大城市学生和教育资源、病人与医疗资源向少量优势学校与大型医院集中。
3.2 标度因子的区域差异
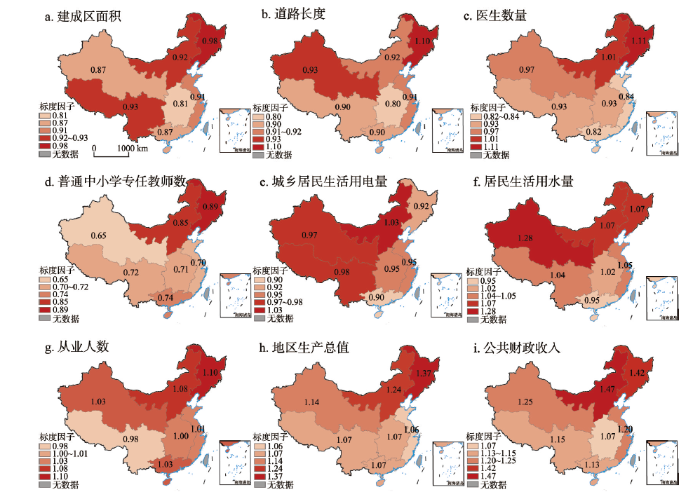
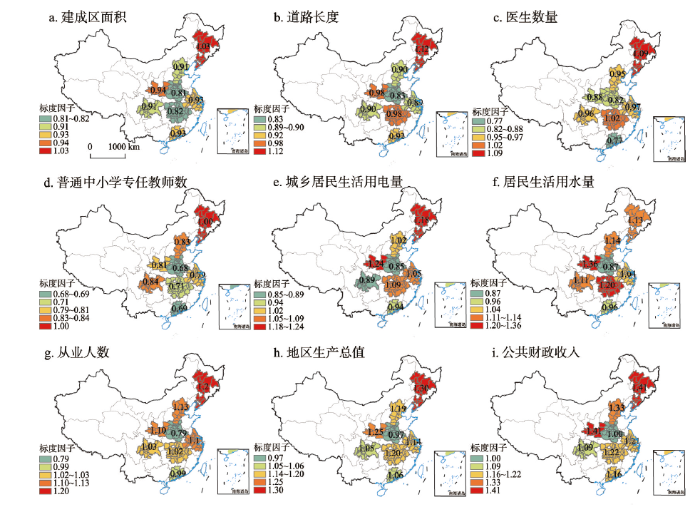
3.2.1 地区差异 空间分异性是地理现象的基本特征,本文选取9个具有代表性的城市要素探究标度因子的区域差异(图4)。使用地理探测器进行各要素空间分异性测度[32,33],结果表明各城市要素分层异质性q统计值在0.10~0.24之间(表1),要素在各分区之间存在空间分异性;城市要素的空间分异性与标度因子在空间分异性具有一定联系,城市要素的分异性及其在不同规模城市之间的分布特征共同影响了标度因子的区域分异。图4
 新窗口打开|下载原图ZIP|生成PPT
图42016年中国七大区域标度因子特征
注:基于自然资源部标准地图服务网站审图号为2016(2556)号的标准地图制作,底图无修改。
Fig. 4Urban scaling exponent of seven regions in China in 2016
Tab. 1
表1
表12016年中国分区域人口及主要城市要素分层异质性q值
Tab. 1
| 人口 数量 | 建成区 面积 | 道路长度 | 医生数 | 普通中小学专 任教师数 | 城乡居民 生活用电量 | 居民生活 用水量 | 从业人数 | 地区生产 总值 | 公共财政 收入 | |
|---|---|---|---|---|---|---|---|---|---|---|
| q | 0.07 | 0.10 | 0.18 | 0.11 | 0.13 | 0.20 | 0.16 | 0.13 | 0.18 | 0.20 |
新窗口打开|下载CSV
标度因子在地区之间具有差异,反映了区域城市系统发展的区域分异。土地利用方面,七大区域建成区面积均与人口呈次线性关系(β < 1),且华中地区与人口规模的标度因子最小(β = 0.81),该地区大城市的土地利用规模经济较为明显。东北地区城市建成区面积与人口规模近似呈线性关系(β = 0.98),随着城市规模的增大,城市平均人口密度没有明显升高。东北地区道路长度与人口呈超线性(β = 1.10),道路增加率大于人口,随城市规模增加,人均道路占有量越多;华中地区道路长度与城市人口规模的标度因子最小(β = 0.79),大城市人均道路占有量少,城市道路交通利用率最高,但也可能导致道路出行更为拥堵。医疗资源方面,东北地区医生数与人口呈超线性关系(β = 1.11),与预期相悖,随城市规模增大,大城市医生数增长率大于人口,医疗资源多向地区内大城市集中。教育资源方面,华北(β = 0.89)、东北(β = 0.85)地区小学数标度因子最大,从小城市到大城市,普通中小学专任教师数增加率最大,以上区域大城市教育资源投入相对充分;而西北地区小学数标度因子最小(β = 0.65),从小城市到大城市,教师数增加率最小,教育资源规模经济最为显著,但因此可能带来较为严重的教育资源短缺状况。
个人需求方面,各要素预期标度因子应等于1,但是中国城市标度律出现个别例外情况。东北、华北地区从业人数β高于全国平均水平(β = 1.06),随城市规模扩大,从业人数增加率大于人口,从业人员多聚集在区域内的大城市。华北地区城乡居民生活用电量与人口规模呈弱超线性关系(β = 1.03),β略高于全国平均水平,华北地区大城市人均用电量更多。西北地区居民生活用水量标度因子最大(β = 1.28),从小城市到大城市,居民生活用水增加率最大,大城市人均用水量更多。上述例外情况反映了这些要素的人均指标在不同规模城市之间的不均衡,例如东北和华北的就业、华北的人均用电及西北的人均用水在大城市更有优势或占用更多。
经济产出方面,七大区域GDP均与人口呈超线性关系(β > 1),符合预期。东北、华北地区GDP的标度因子β高于全国平均水平(β = 1.15),且东北地区GDP标度因子最大(β = 1.37),表明以上区域大城市经济产出的集聚效应突出。华北地区公共财政收入标度因子最大(β = 1.47),从小城市到大城市,公共财政收入增加率最大,表明该地区公共财政收入具有明显向大城市集中的趋势。
为反映不同区域基础设施与公共服务规模经济、家庭能源消耗个人需求及经济产出集聚效应水平,根据标度因子实际值与预期值的大小关系,将区域划分不同等级,结果如表2所示。华北地区大城市基础设施与公共服务规模经济不显著,而东北地区大城市呈现出规模不经济情况,表明以上区域基础设施与公共服务要素在大城市投入更多,大城市经济产出集聚效应也呈现出高度集聚状况。与此同时,除华中地区大城市经济产出集聚效应呈弱集聚状况外,华东、华南、西南与西北地区大城市经济产出集聚效应均显著。西北与华北地区不同规模城市家庭能源消耗个人需求不均衡,这可能与不同规模城市间要素供给与分配不平衡有关,以致西北、华北地区大城市在家庭能源消耗方面相对更占优势。
Tab. 2
表2
表22016年中国七大区域基础设施与公共服务规模经济、家庭能源消耗个人需求及经济产出集聚效应状况
Tab. 2
| 区域 | 基础设施与公共服务规模经济 | 家庭能源消耗个人需求 | 经济产出集聚效应 |
|---|---|---|---|
| 华北 | 不显著 | 不均衡 | 高度集聚 |
| 东北 | 规模不经济 | 均衡 | 高度集聚 |
| 华东 | 显著 | 均衡 | 集聚 |
| 华中 | 显著 | 均衡 | 弱集聚 |
| 华南 | 显著 | 均衡 | 集聚 |
| 西南 | 显著 | 均衡 | 集聚 |
| 西北 | 显著 | 不均衡 | 集聚 |
新窗口打开|下载CSV
3.2.2 城市群差异 检验不同城市群之间要素空间分异性,结果表明各城市要素的地理探测器q统计值在0.08~0.26之间(表3),各要素在城市群之间存在空间分异性。分城市群拟合城市要素与人口规模标度关系,结果如图5所示。土地利用方面,东北地区城市群建成区面积与人口呈弱超线性关系(β = 1.03 > 1),随城市规模增大,人均占用土地更多。对于道路长度要素,东北地区城市群道路长度与人口规模呈超线性关系(β = 1.13),与预期相悖,随城市规模的增加,东北地区城市群大城市人均道路占有量更高;长三角城市群大城市人均道路占有量较低(β = 0.71),居民出行交通可能因此变得拥挤。医疗资源方面,东北地区城市群医生数与人口呈超线性关系(β = 1.09 > 1),表明东北地区城市群随城市规模的增大,医生数也更多,医疗资源在大城市更为充足。珠三角城市群医生数与人口规模的标度因子最小(β = 0.77),珠三角医疗资源规模经济最为显著,但可能带来医疗资源的紧张。教育资源方面,中原城市群与珠三角普通中小学专任教师数标度因子最小,中原城市群β = 0.68,珠三角β = 0.69,从小城市到大城市,教育资源增加率最小,规模经济最为显著,但因此也可能带来师资力量的短缺。
Tab. 3
表3
表32016年中国分城市群人口及主要城市要素分层异质性q值
Tab. 3
| 人口 数量 | 建成区 面积 | 道路长度 | 医生数 | 普通中小学专 任教师数 | 城乡居民 生活用电量 | 居民生活 用水量 | 从业人数 | 地区生产 总值 | 公共财政 收入 | |
|---|---|---|---|---|---|---|---|---|---|---|
| q | 0.07 | 0.16 | 0.10 | 0.12 | 0.08 | 0.09 | 0.15 | 0.23 | 0.26 | 0.21 |
新窗口打开|下载CSV
图5
 新窗口打开|下载原图ZIP|生成PPT
图52016年中国八大城市群标度因子特征
注:基于自然资源部标准地图服务网站审图号为2016(2556)号的标准地图制作,底图无修改。
Fig. 5Urban scaling exponent of eight agglomerations in China in 2016
个人需求方面,京津冀、长三角及珠三角城市群作为中国就业热门区域,京津冀从业人数增加率大于长三角及珠三角,京津冀大城市对人力资源的吸引力相对更大。对于城乡居民生活用电量,中原、成渝及珠三角城市群大城市在节能方面表现较好(β < 1),关中平原城市群大城市居民生活人均用电更多(β = 1.24),这可能是小城市供电不充分加之冬季居民用煤炭取暖频率较高使得用电量较少导致。
经济产出方面,中原城市群GDP与人口规模呈次线性关系(β = 0.97),随城市规模增大,中原城市经济产出增加率小于人口。从小城市到大城市,京津冀相比长三角与珠三角经济产出增加率最大,大城市表现出较强的经济产出集聚效应(β = 1.19)。中原城市群公共财政收入与人口规模呈线性关系,而东北地区城市群公共财政收入标度因子最大(β = 1.41),反映出该地区公共财政收入多向大城市集中。考虑到个别城市群如关中平原城市群所含地级市,样本量较少可能会对拟合结果造成影响,本文对回归进行了异方差检验,结果表明样本量少不影响对数标准下最小二乘法的最佳线性无偏性,不会对结果产生影响。
各城市群大城市基础设施与公共服务规模经济、家庭能源消耗个人需求及经济产出集聚效应状况如表4所示。关中平原与东北地区城市群大城市基础设施与公共服务规模经济不显著,甚至呈现出规模不经济情况,即在以上地区要素多向区域内大城市集中,大城市经济产出也呈现出高度集聚状况,而家庭能源消耗个人需求呈现极不均衡状况。京津冀与长江中游城市群大城市经济产出呈现强集聚状况,珠三角与长三角城市群次之,与京津冀城市群相比,珠三角与长三角城市群发育较为完善,城市经济发展一体化程度相对更高;以上城市群大城市基础设施与公共服务规模经济显著。反观中原城市群,与其他城市群相比,其大城市基础设施与公共服务规模经济强显著,而经济产出未体现集聚效应(β < 1)。
Tab. 4
表4
表42016年中国城市群基础设施与公共服务规模经济、家庭能源消耗个人需求及经济产出集聚效应状况
Tab. 4
| 城市群 | 基础设施与公共服务规模经济 | 家庭能源消耗个人需求 | 经济产出集聚效应 |
|---|---|---|---|
| 京津冀城市群 | 显著 | 不均衡 | 强集聚 |
| 珠三角城市群 | 显著 | 均衡 | 集聚 |
| 长三角城市群 | 显著 | 不均衡 | 集聚 |
| 长江中游城市群 | 显著 | 不均衡 | 强集聚 |
| 成渝城市群 | 显著 | 均衡 | 弱集聚 |
| 中原城市群 | 强显著 | 不均衡 | 不集聚 |
| 关中平原城市群 | 不显著 | 极不均衡 | 高度集聚 |
| 东北地区城市群(哈长+辽中南) | 规模不经济 | 极不均衡 | 高度集聚 |
新窗口打开|下载CSV
3.3 标度因子的时间变化特征
标度因子随时间的变化反映了城市系统随时间的演化(图6)。2000—2008年建成区面积标度因子β整体呈上升趋势,大城市土地利用规模经济比较优势逐步减弱,而2008年后标度因子整体略有下降,土地利用规模经济又有加强趋势,发达国家建成区面积β普遍为0.6~0.8[13],中国大城市建成区面积扩张速度与发达国家相比偏快,且2015年以来大城市建成区面积扩张速度依然呈加快趋势,中国城市土地利用规模经济有待加强。道路长度β总体略有上升,且逐步趋近于1,道路长度与人口规模由次线性转变为线性关系,而后略有下降,近年来大城市人均道路拥有量略有减少,大城市居民出行交通较为拥堵。教育与医疗方面,普通中小学专任教师数标度因子β介于0.60~0.80,教育资源规模经济显著,2005年以来标度因子β平稳上升,大城市人均中小学教师数略有增加;医生数β整体较为稳定,徘徊在0.90附近,医疗资源规模经济较为显著,未来应考虑适当扩大大城市教育与医疗资源的投入。图6
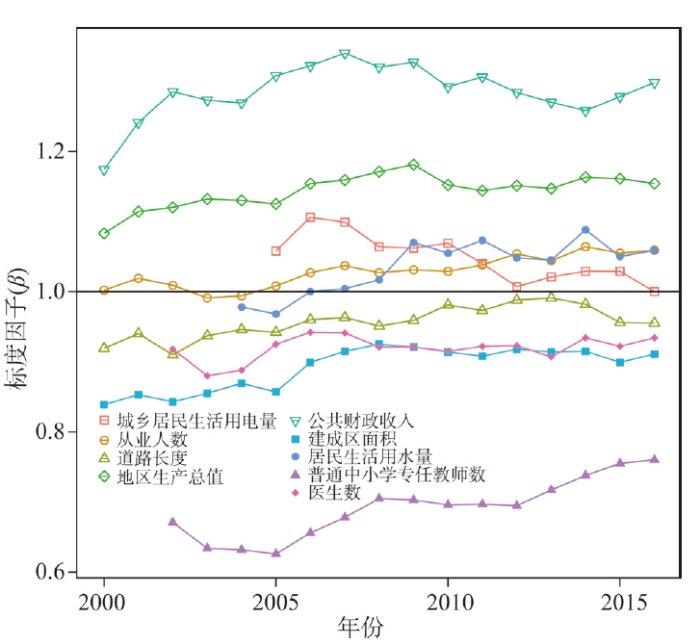 新窗口打开|下载原图ZIP|生成PPT
图62000—2016年中国城市要素标度因子变化
Fig. 6Temporal evolution of scaling exponent for urban indicators from 2000 to 2016 in China
个人需求方面,从业人数标度因子略高于理论值1,大城市就业热度高居不下。城乡居民生活用电量β整体呈下降趋势,并逐步趋近于理论值1,大城市居民用电环保意识逐渐增强。居民生活用水量β整体呈上升趋势,大城市人均用水量逐年增多。
经济产出方面,2000—2016年GDP标度因子β均大于1,符合预期。2000—2009年β呈上升的趋势,大城市经济产出集聚效应日益增强,2009年后β有所回落,近年来趋近于1.14~1.16。总体而言中国大城市表现出很强的经济产出集聚效应,且在未来很长一段时间内,大城市将持续保持这种较强的经济产出集聚效应。公共财政收入β整体上呈先上升后有下降又上升趋势,除2000年外,公共财政收入β均大于1.20,高于预期,反映中国公共财政收入向大城市集中,经济产出集聚效应显著。
4 结论与讨论
4.1 结论
本文以275个地级市为城市单元,探究了中国城市要素与人口规模间的标度关系,并从时空维度探究了标度因子的区域差异与时间变化特征。研究表明,中国城市发展符合标度律,但作为典型的快速城市化国家,中国城市标度律呈现出与发达国家不同的特征。中国城市人口集聚带来的经济增长率较高,但土地利用、医疗健康、家庭能源消耗(特别是用水量)等城市要素的规模利用效率还有较大提升空间,大城市的基础设施规模经济也有待增强。部分基础设施、生活设施要素与人口规模呈超线性或线性关系,与预期的次线性相悖,基础教育、医疗等要素的标度因子则远低于发达国家的次线性阈值,反映了快速城市化国家公共资源向大城市聚集、不同规模城市发展不平衡等特征。根据创新的分层扩散理论(Hierarchical Diffusion of Innovations)可知,个别基础设施与人口规模呈超线性的情况在未来一段时间内还将持续下去,反映了不同规模城市之间发展的不协调、不平衡。标度因子的区域分异反映城市发展协调程度差异,该差异在东北地区最为显著,东北地区资源多集中在大城市,大城市经济产出集聚效应也更高,不同规模城市发展差异较大。分析主要城市要素的标度因子随时间的变化,中国大城市的经济产出集聚效应(GDP)在2009年最为显著,而后略有下降;中国大城市土地扩张总体上自2000年以来持续加速,2008年以后仍维持在较高水平,管控城市特别是大城市的外延式扩张、提高土地利用效率具有紧迫性。城市标度律的地区差异分析可为区域之间的资源能源利用、社会经济发展状况评价提供统一可比的基础,进而为区域发展提供决策支持;标度因子随时间的变化反映了城市系统特征的演化,对国家城市发展的分类施策和管控具有指导意义。4.2 讨论
本文采用中国地级及以上城市市辖区常住人口及城市要素数据进行标度律探究,结果表明中国城市发展符合标度律特征,且城市要素与人口规模拟合情况较好。中国城市标度律符合理论预期情况,反映中国城市发展受到自组织演化机制的支配,符合城市演化规律[34]。部分与政府自上而下投资决策相关的基础设施要素(公共汽(电)车营运车辆数、供气管道长度等)偏离了理论预期值,与人口呈超线性关系,这与巴西城市基础设施要素标度特征有着相似之处[11]。“空间填充”理论(Space Filling)表明基础设施必须实现普遍供给,才能与人口呈现次线性关系[11]。资金的有效足量供给和高效合理使用是保证基础设施与城镇化平稳协调发展的关键因素[35]。在发展中国家,基础设施主要由政府决策并投资建设,相对于小城市,大城市有足够的税收收入投资基础设施建设,因而基础设施在大城市覆盖更广。供水管道分布情况则有所不同:得益于政府对地下供水管道的长期建设,供水系统基本已实现在城市系统中的全面覆盖,因而供水管道长度与人口规模近似呈线性关系。随着经济性基础设施的不断完善和以人为本的新型城镇化的推进,教育、医疗等社会性基础设施投资建设有所增加,但其总额和增幅力度与城镇化引致的强大需求还有一定差距[35]。未来还需加大对中小城市教育、医疗资源的投入,提升基础设施高效运行效率与互联互通水平。基础设施偏离理论预期的情况随时间推移是否会持续下去?运用标度律的演化思路可对此进行分析。Pumain等[36]探讨了城市系统中创新的等级扩散理论,即要素先在大城市集聚,而后再逐步扩散到中小城市,直到不同规模、不同层级的城市通过创新实现城市间要素平等分配,该扩散过程才停止。该理论也同样适用于基础设施分布,在本文中,若此结论成立,即供气管道与人口规模呈预期的次线性,则供气管道在小城市里增长更快,因为供气管道在大城市已完成普遍覆盖,其增长应相对小城市更缓慢。图7展示了2006—2016年间中国城市系统供水与供气管道长度的增量与人口的关系,结果表明供气管道长度增量及增速多于或快于供水网络,且大城市增长更明显,因此在未来一段时间内,供气管道与人口规模呈超线性的情况还将持续下去。
图7
 新窗口打开|下载原图ZIP|生成PPT
图72006—2016年中国城市系统供水(a)、供气管道长度增量(b)与人口关系图
Fig. 7The growth of water and gas pipe length from 2006 to 2016 against population in China's urban system
标度因子在空间上的分布特征能反映区域内城市协调发展程度与居民生活水平差异,且这种差异与区域经济基础、城镇化发展水平等因素有关。区域发展带来的资源与机会的非均衡性在东北地区最为显著,东北地区地广人稀,近年来由于人口外流与自然增长速度放缓等因素,城市发展速度也逐步放缓,与发达地区的城市化发展水平差距逐渐拉大。为维持城市发展,资源向区域内的大城市倾斜,大城市具备较高的投资效率和较快的经济增长速度,中小城市经济产出与人口扩张受制于落后的工业化水平而显著低于大城市[37]。中国经济空间结构以城市群为主,以京津冀、长三角及珠三角城市群三大核心经济增长极为例,京津冀大城市对高级人才、优质企业与高级生产要素与的吸引力更强,经济产出表现更为优异,城市发展动力强劲,极化效应显著;珠三角、长三角城市群发展一体化程度相对较高,信息创新带来的空间扩散效应较为普遍,中小城市依托大城市的产业升级与转移形成的知识、技术外溢[27, 36, 38],与大城市协同发展。
标度因子在时间上的变化反映了城市系统随时间的演化。从整体上看,建成区面积与GDP标度因子在时间上变化趋势大体一致。自2001年加入世界贸易组织以来,中国大城市土地扩张与经济发展持续加速,大城市土地利用效率略有下降,而经济产出效率却不断提高。2008年以后,受中国经济发展计划调整与政府扶持中小城市发展政策的影响,中国大城市土地利用效率略有提高,而经济产出效率略有下降,但二者标度因子均维持在较高水平,协调不同规模城市经济平衡发展,管控城市特别是大城市的外延式扩张、提高土地利用效率具有紧迫性。促进和引导城市内填式发展是实现新型城镇化的有效途径,有助于协调与平衡中国城市系统土地与人口标度关系[39]。
现有的城市统计数据质量问题以及功能城市定义的缺乏使得目前中国城市问题研究尚未形成一套自己的体系[29]。陈彦光等[40]认为这主要是由于中国城市概念不同于西方,统计范围尚未一致,加之对城市边界选定的不同造成了统计结果的差异。本文选取市辖区统计数据最大限度地保证了数据的一致性和可比性,但部分城市要素(如普通中、小学在校学生数)统计数据精度较低(仅精确到万人),数据离散程度较大。未来可考虑基于更有效的统计单元,运用多源与高精度数据对标度律进行更深入的研究。
参考文献 原文顺序
文献年度倒序
文中引用次数倒序
被引期刊影响因子
URL [本文引用: 1]
[本文引用: 5]
DOI:10.1073/pnas.0610172104URLPMID:17438298 [本文引用: 2]

1 (increasing returns), whereas those accounting for infrastructure display beta approximately 0.8
[本文引用: 1]
[本文引用: 1]
[本文引用: 1]
[本文引用: 1]
[本文引用: 1]
[本文引用: 1]
[本文引用: 1]
URLPMID:21085659 [本文引用: 1]
With urban population increasing dramatically worldwide, cities are playing an increasingly critical role in human societies and the sustainability of the planet. An obstacle to effective policy is the lack of meaningful urban metrics based on a quantitative understanding of cities. Typically, linear per capita indicators are used to characterize and rank cities. However, these implicitly ignore the fundamental role of nonlinear agglomeration integral to the life history of cities. As such, per capita indicators conflate general nonlinear effects, common to all cities, with local dynamics, specific to each city, failing to provide direct measures of the impact of local events and policy. Agglomeration nonlinearities are explicitly manifested by the superlinear power law scaling of most urban socioeconomic indicators with population size, all with similar exponents (1.15). As a result larger cities are disproportionally the centers of innovation, wealth and crime, all to approximately the same degree. We use these general urban laws to develop new urban metrics that disentangle dynamics at different scales and provide true measures of local urban performance. New rankings of cities and a novel and simpler perspective on urban systems emerge. We find that local urban dynamics display long-term memory, so cities under or outperforming their size expectation maintain such (dis)advantage for decades. Spatiotemporal correlation analyses reveal a novel functional taxonomy of U.S. metropolitan areas that is generally not organized geographically but based instead on common local economic models, innovation strategies and patterns of crime.
URLPMID:23544042
The factors that account for the differences in the economic productivity of urban areas have remained difficult to measure and identify unambiguously. Here we show that a microscopic derivation of urban scaling relations for economic quantities vs. population, obtained from the consideration of social and infrastructural properties common to all cities, implies an effective model of economic output in the form of a Cobb-Douglas type production function. As a result we derive a new expression for the Total Factor Productivity (TFP) of urban areas, which is the standard measure of economic productivity per unit of aggregate production factors (labor and capital). Using these results we empirically demonstrate that there is a systematic dependence of urban productivity on city population size, resulting from the mismatch between the size dependence of wages and labor, so that in contemporary US cities productivity increases by about 11% with each doubling of their population. Moreover, deviations from the average scale dependence of economic output, capturing the effect of local factors, including history and other local contingencies, also manifest surprising regularities. Although, productivity is maximized by the combination of high wages and low labor input, high productivity cities show invariably high wages and high levels of employment relative to their size expectation. Conversely, low productivity cities show both low wages and employment. These results shed new light on the microscopic processes that underlie urban economic productivity, explain the emergence of effective aggregate urban economic output models in terms of labor and capital inputs and may inform the development of economic theory related to growth.
URL [本文引用: 1]
[本文引用: 4]
URL [本文引用: 1]
URL [本文引用: 2]
[本文引用: 1]
[本文引用: 1]
URLPMID:24533062 [本文引用: 1]
Cities are increasingly the fundamental socio-economic units of human societies worldwide, but we still lack a unified characterization of urbanization that captures the social processes realized by cities across time and space. This is especially important for understanding the role of cities in the history of human civilization and for determining whether studies of ancient cities are relevant for contemporary science and policy. As a step in this direction, we develop a theory of settlement scaling in archaeology, deriving the relationship between population and settled area from a consideration of the interplay between social and infrastructural networks. We then test these models on settlement data from the Pre-Hispanic Basin of Mexico to show that this ancient settlement system displays spatial scaling properties analogous to those observed in modern cities. Our data derive from over 1,500 settlements occupied over two millennia and spanning four major cultural periods characterized by different levels of agricultural productivity, political centralization and market development. We show that, in agreement with theory, total settlement area increases with population size, on average, according to a scale invariant relation with an exponent in the range [Formula: see text]. As a consequence, we are able to infer aggregate socio-economic properties of ancient societies from archaeological measures of settlement organization. Our findings, from an urban settlement system that evolved independently from its old-world counterparts, suggest that principles of settlement organization are very general and may apply to the entire range of human history.
[本文引用: 1]
DOI:10.11821/dlxb201702003URL [本文引用: 3]
Scaling laws are powerful reflectors of the variations of the output of urban economic activities and the number of infrastructures with urban population. However, the difference in spatial definition of cities and data sources by countries leads to different statistical results of scaling law. We aim to analyse the difference in this paper by calculating regression coefficients of scaling law at different spatial scales, combined with census data, urban statistical yearbook data and remote sensing data of China. The conclusions are shown as follows: (1) Scaling coefficients change with both spatial scales and data sources. For spatial scales, scaling law is more agreeable with the data of urban municipal districts than with those of the whole city area in China. As there is a large number of non-urbanized areas within cities; these regions do not meet the assumptions of scaling law model. For data source, remote sensing data have a better fitting result than urban statistical yearbook data. (2) Comparatively speaking, urban population agglomeration contributes more to economic growth in China than it does in the US, but China has lower energy consumption and land-use efficiency. For example, the Gross Regional Product (GRP) scaling indicator of China is 1.22, while it is 1.11 in the United States. (3) Population agglomeration contributes more to the economic growth in large cities than in small cities. This may explain the emerging trends of urban immigrants in large cities of China. However, for energy consumption, small and medium-sized cities are more efficient than large cities. In addition, this paper discusses the potential direction for urban scaling research from three aspects: establishing more effective statistical units, combining traditional survey with big data analysis, and exploring mechanics behind scaling models.
[本文引用: 3]
URLPMID:23750213 [本文引用: 1]
Urban areas consume more than 66% of the world's energy and generate more than 70% of global greenhouse gas emissions. With the world's population expected to reach 10 billion by 2100, nearly 90% of whom will live in urban areas, a critical question for planetary sustainability is how the size of cities affects energy use and carbon dioxide (CO2) emissions. Are larger cities more energy and emissions efficient than smaller ones? Do larger cities exhibit gains from economies of scale with regard to emissions? Here we examine the relationship between city size and CO2 emissions for U.S. metropolitan areas using a production accounting allocation of emissions. We find that for the time period of 1999-2008, CO2 emissions scale proportionally with urban population size. Contrary to theoretical expectations, larger cities are not more emissions efficient than smaller ones.
URLPMID:27493764 [本文引用: 1]
One of the most celebrated findings in complex systems in the last decade is that different indexes y (e.g. patents) scale nonlinearly with the population x of the cities in which they appear, i.e. y approximately x (beta) ,beta not equal1. More recently, the generality of this finding has been questioned in studies that used new databases and different definitions of city boundaries. In this paper, we investigate the existence of nonlinear scaling, using a probabilistic framework in which fluctuations are accounted for explicitly. In particular, we show that this allows not only to (i) estimate beta and confidence intervals, but also to (ii) quantify the evidence in favour of beta not equal1 and (iii) test the hypothesis that the observations are compatible with the nonlinear scaling. We employ this framework to compare five different models to 15 different datasets and we find that the answers to points (i)-(iii) crucially depend on the fluctuations contained in the data, on how they are modelled, and on the fact that the city sizes are heavy-tailed distributed.
[本文引用: 1]
[本文引用: 1]
DOI:10.1002/eap.1760URLPMID:29869352 [本文引用: 1]
Most of the planet's population currently lives in urban areas, and urban land expansion is one of the most dramatic forms of land conversion. Understanding how cities evolve temporally, spatially, and organizationally in a rapidly urbanizing world is critical for sustainable development. However, few studies have examined the coevolution of urban attributes in time and space simultaneously and the adequacy of power law scaling across cities and through time, particularly in countries that have experienced abrupt, widespread, political and economic changes. Here, we show the temporal coevolution of multiple physical, demographic, socioeconomic, and environmental attributes in individual cities, and the cross-city scaling of urban attributes at six time points (i.e., 1978, 1990, 1995, 2000, 2005, and 2010) in 32 major Chinese cities. We found that power law scaling could adequately characterize both the cross-city scaling of urban attributes across cities and the longitudinal scaling describing the temporal coevolution of urban attributes within individual cities. The cross-city scaling properties demonstrated substantial changes over time signifying evolved social and economic forces. A key finding was that the cross-city linear or superlinear scaling of urban area with population contradicts the theoretical sublinear power law scaling proposed between infrastructure and population. Furthermore, the cross-city scaling between area and population transitioned from linear to superlinear over time, and the superlinear scaling in recent times suggests decreased infrastructure efficiency. Our results demonstrate a diseconomy of scale in urban areal expansion that indicates a significant waste of land resources in the urbanization process. Future planning efforts should focus on policies that increase urban land use efficiency before continuing expansion.
[本文引用: 1]
[本文引用: 1]
DOI:10.11821/xb200904002URL [本文引用: 1]
Based on a review on urban allometric equation, this paper analyzes the allometric growth relationship between urban area and urban population in China by using the data of the urban built-up area and the total population of cities and towns in 1990, 2000 and 2005. After an in-depth discussion of the standard value of the scaling factor, the paper concludes that urban growth in China is negative allometry in 1990 and positive one in 2000 and 2005. Sample cities in the eastern and western China also show the same law. In contrast to this, cities in central China maintain the original proportion of built-up land growth with population growth; however, they show positive allometry in 2005 because of the promotion policy for central China. The conclusion is closely related to the changes in migrant population, housing system reform and the rapid expansion of development zones.
[本文引用: 1]
[本文引用: 1]
[本文引用: 1]
[本文引用: 2]
[本文引用: 2]
[本文引用: 1]
[本文引用: 1]
URLPMID:31479455 [本文引用: 2]
Nowhere has the scale and scope of urbanization been larger than in China over the last few decades. We analyze Chinese city development between the years 1996 and 2014 using data for the urbanized components of prefecture-level cities. We show that, despite much variability and fast economic and demographic change, China is undergoing transformations similar to the historical trajectory of other urban systems. We also show that the distinguishing signs of urban economies-superlinear scaling of agglomeration effects in economic productivity and economies of scale in land use-also characterize Chinese cities. We then analyze the structure of economic change in Chinese cities using a variety of metrics, characterizing employment, firms and households. Population size estimates remain a major challenge for Chinese cities, as official numbers are often reported based on the Hukou registration system. We use the information in the residuals to scaling relations for economic quantities to predict actual resident population and show that these estimates agree well with data for a subset of cities for which counts of total resident population exist. We conclude with a list of issues that must be better understood and measured to make sense of present urban development trajectories in China.
[本文引用: 1]
DOI:10.1126/science.1235823URL [本文引用: 1]
Despite the increasing importance of cities in human societies, our ability to understand them scientifically and manage them in practice has remained limited. The greatest difficulties to any scientific approach to cities have resulted from their many interdependent facets, as social, economic, infrastructural, and spatial complex systems that exist in similar but changing forms over a huge range of scales. Here, I show how all cities may evolve according to a small set of basic principles that operate locally. A theoretical framework was developed to predict the average social, spatial, and infrastructural properties of cities as a set of scaling relations that apply to all urban systems. Confirmation of these predictions was observed for thousands of cities worldwide, from many urban systems at different levels of development. Measures of urban efficiency, capturing the balance between socioeconomic outputs and infrastructural costs, were shown to be independent of city size and might be a useful means to evaluate urban planning strategies.
DOI:10.11821/dlxb201701010URL [本文引用: 1]
Spatial stratified heterogeneity is the spatial expression of natural and socio-economic process, which is an important approach for human to recognize nature since Aristotle. Geodetector is a new statistical method to detect spatial stratified heterogeneity and reveal the driving factors behind it. This method with no linear hypothesis has elegant form and definite physical meaning. Here is the basic idea behind Geodetector: assuming that the study area is divided into several subareas. The study area is characterized by spatial stratified heterogeneity if the sum of the variance of subareas is less than the regional total variance; and if the spatial distribution of the two variables tends to be consistent, there is statistical correlation between them. Q-statistic in Geodetector has already been applied in many fields of natural and social sciences which can be used to measure spatial stratified heterogeneity, detect explanatory factors and analyze the interactive relationship between variables. In this paper, the authors will illustrate the principle of Geodetector and summarize the characteristics and applications in order to facilitate the using of Geodetector and help readers to recognize, mine and utilize spatial stratified heterogeneity.
[本文引用: 1]
DOI:10.11821/dlxb201701012URL [本文引用: 1]
Hu Line uncovers one of China's most important characteristics of population paper distribution: East is dense, while west is sparse. Different from most previous research, this paper examined the differentiation and changes of population distribution on both sides of Hu Line from a perspective of spatial stratified heterogeneity instead. Geodetector was employed based on the spatial database of China's census data of 1953, 1982, 1990, 2000 and 2010 to reconfirm spatial position of Hu Line and analyzed changes of spatial stratified heterogeneity of population between southeast and northwest sides of Hu Line in different periods. Changes of population distribution since the founding of New China were found and the reasons for these changes were discussed. Major findings include: (1) From the spatial stratified heterogeneity perspective, Hu Line could be improved and optimized, at least, in some periods. Although the ratio of total population on both sides of Hu Line has roughly been kept at 94:6 since 1953, spatial stratified heterogeneity of population between the two sides (the southeastern side: the northwestern side) increased when Hu Line moves to south slightly in 1953, 2000 and 2010, which means population distribution was more homogeneous within either southeastern or northwestern region and heterogeneity was more remarkable between the two regions. (2) Heterogeneity decreased gradually since the reform and opening up. We found characteristics of population distribution converged on the two sides, especially since the 1990s when convergence between the two sides became apparent. This finding is significantly different from the conclusion of "remain unchanged" from most literatures. The reasons why heterogeneity reduced were: pattern of population distribution on the southeastern side changed from relatively even distribution among cities before 1990 to agglomeration in a few huge cities after 2000, while the degree of spatial agglomeration of population decreased slightly after the reform on the northwestern side. These changes have been confirmed by the analysis from cumulative distribution function and Gini coefficient. (3) On the whole, the effect of economic factors on population distribution has become more and more important, while the effect of natural environment and institution reduced. Combined effect from economic development, natural environment and institution resulted in two opposite directions of changes of population spatial distribution on the two sides. It should be emphasized that although general effect of natural environment has decreased, some natural factors, such as Three Gradient Terrains, still have significantly influence on population distribution in China.
[本文引用: 1]
[本文引用: 1]
DOI:10.18306/dlkxjz.2016.04.005URL [本文引用: 2]
Infrastructure development is an important part of urbanization and plays a fundamental role in supporting urban development. Using two kinds of statistical standards and by means of regression analysis, GIS analysis, and coefficient of variation calculation, this article analyzes the spatiotemporal pattern of infrastructure investment in China. The research found that: (1) Infrastructure investment in China has been growing at a high speed and has been an important driving force of urbanization. (2) Investment in economic infrastructure including electricity, transportation, water conservancy, is the main part of investment in infrastructure development, but the proportion of investment in medical and health care, education, social security, and other social infrastructure development has been gradually increasing. (3) Local government financial investment, bank loans, and land-transferring fees are the main sources of funds for infrastructure investment, and the government plays a leading role in such investment. (4) Infrastructure investment significantly differ between provinces and such difference is closely related to urbanization and economic development, but the gap tends to be closing. (5) There are differences between urban and rural infrastructure investment. The results not only can lay some foundation for further study including innovation and improvement of investment structure, but also provide some references for investment decisions of the government.
[本文引用: 2]
[本文引用: 2]
[D].
[本文引用: 1]
[D].
[本文引用: 1]
DOI:10.11821/dlxb201808009URL [本文引用: 1]
The spatio-temporal characteristics of demographic distribution in China from 2000 to 2010 were analyzed systematically from the perspective of urban agglomeration, using the methods of barycenter model, spatial autocorrelation and Theil index. The 19 urban agglomerations mentioned in the country's 13th Five-Year Plan (2016-2020) are studied in this paper. Results show that the distribution center of permanent population is moving further towards the southeast where developed urban agglomerations are concentrated. Urban agglomeration is a high value area of population density and population growth, but a low value area of natural population growth. Urban agglomeration is also the most active area of China's population flow, and the effect of population space agglomeration and diffusion is also remarkable. The spatial distribution pattern of China's population is closely related to the distribution and development of urban agglomerations. Meanwhile, the development of urban agglomerations has brought a large population into urban agglomeration or its core cities, and the distribution of population in urban agglomeration has increased significantly. Because of the attraction effect of urban agglomeration on population, the geographical difference of population density in China is further expanded. The development level of urban agglomeration in China is very different, and the urban agglomeration in different stages of development show different effects of population agglomeration and diffusion. Urban agglomerations in stage of the higher development degree, mainly located in eastern coastal densely populated areas, are featured by strong demographic attractiveness, and overall population agglomeration, hence gradually form a hierarchy. At the same time, urban agglomerations in stage of the lower development degree are mainly distributed in the central and western regions, where the population is sparse, with the city being less appealing to population. These urban agglomerations present the core edge diffusion characteristic, and the urban system structure is not stable yet.
[本文引用: 1]
[本文引用: 1]
DOI:10.11820/dlkxjz.2014.08.006URL [本文引用: 1]
The relationship between urban population and construction land area is supposed to follow the law of allometric growth, which is based on exponential growth or distribution. However, if we apply the allometric scaling law to Chinese cities using data from the statistical yearbooks of China, the relationship is often unclear or unconvincing, possibly due to the quality of the statistical data used. In this study, the ordinary least square method and log-linear regression analysis are employed to make a longitudinal allometric analysis of urban evolution of Xinyang, a medium-sized city of Henan Province, China. Population of the urban area (which is greater than the non-agricultural population of the same city) was estimated by using the census data from multiple years; the area of urban construction land was estimated using the land-use maps. The quality of these data is clearly higher than those provided in the statistical yearbooks. The result of the analysis shows that from 1949 to 2004, the urban population and area of construction land in Xinyang followed the allometric scaling law. During the period between 2007 and 2013, the scaling relation was disrupted due to the "city-making movement" in the context of an overheated economy based on real estate development and rapid urbanization. The following conclusion can be drawn: the urban evolution of Chinese cities follows the allometric growth law, but the allometric scaling can be disturbed by government policies in a largely command and control economy. The significance of this work lies in that, first, it provides a typical case of longitudinal allometry of China's cities for urban studies; second, it gives a set of models that can be used to estimate and project population size and urban land area of cities like Xinyang; and third, it lays a foundation for future allometric studies based on logistic growth rather than exponential growth.
[本文引用: 1]
